9Å structure of the COPI coat reveals that the Arf1 GTPase occupies two contrasting molecular environments
- European Molecular Biology Laboratory, Germany
- Max Planck Institute for Biophysical Chemistry, Germany
- Heidelberg University, Germany
- MRC Laboratory of Molecular Biology, United Kingdom
Figures
Figure 1 with 1 supplement
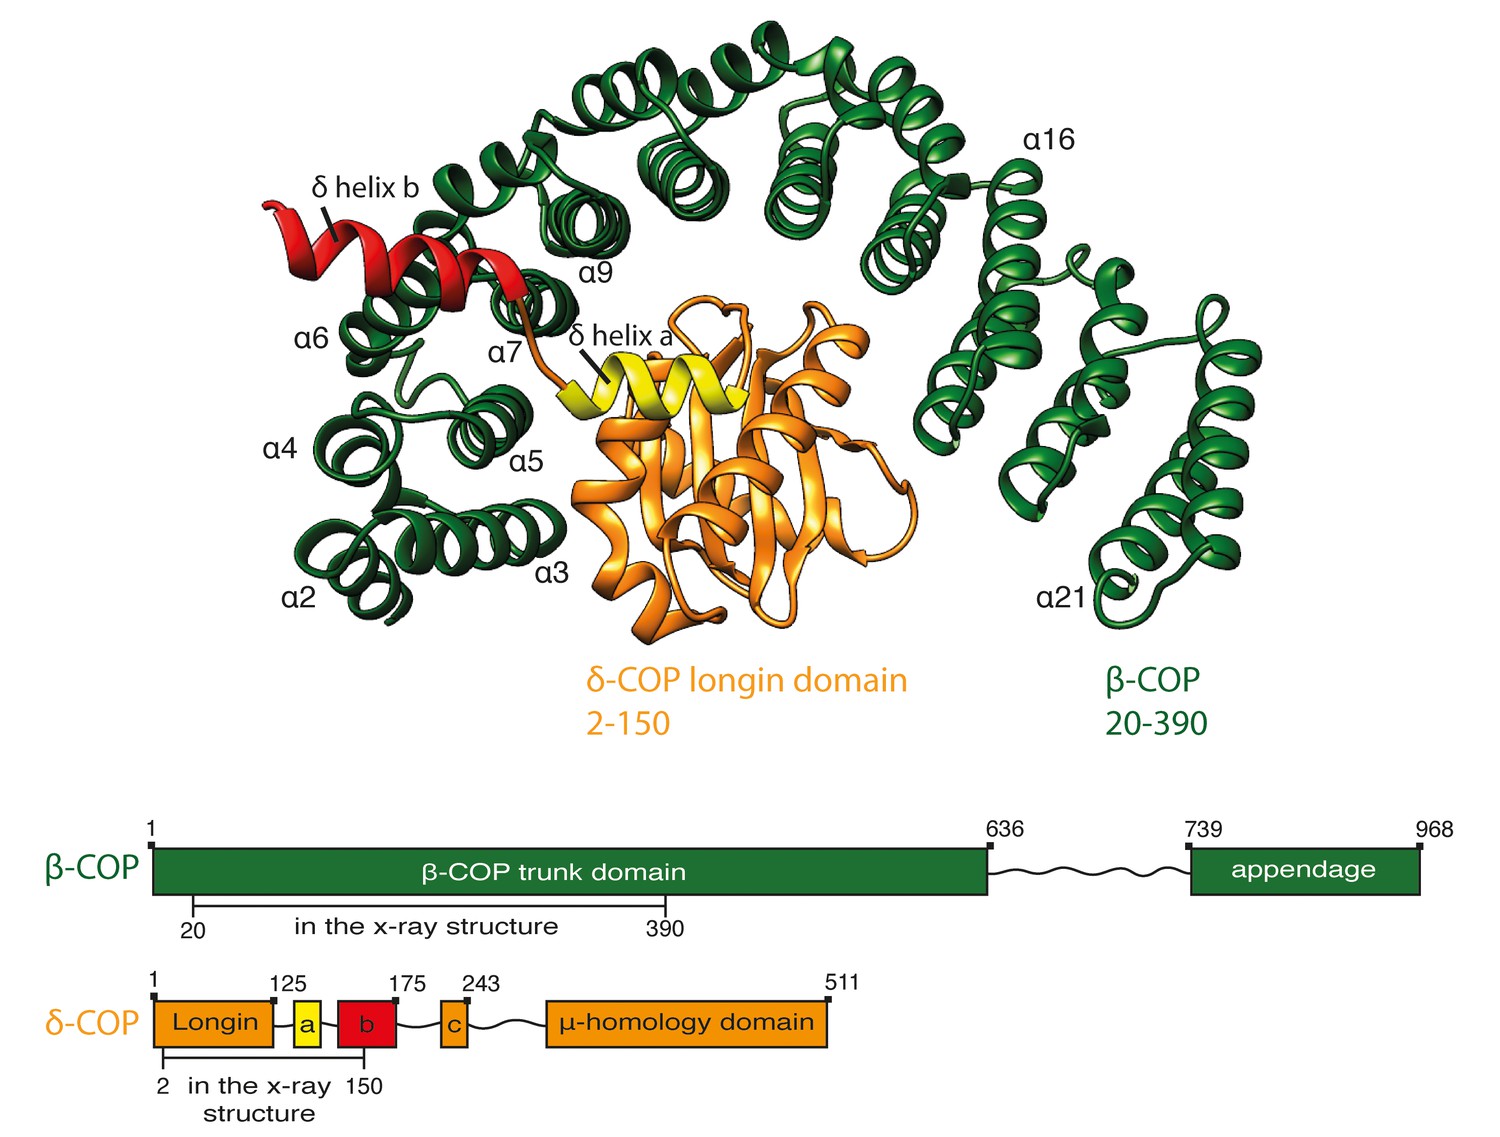
Crystal structure of β20-390δ2–150-COP.
A ribbon representation of the structure of Ctβ20–390 (dark green) Ctδ2–150 (orange) as viewed from the vesicle membrane. The α-helices within the α-solenoid of β-COP are numbered according to their position in the sequence. δ-COP consists of a longin domain and two downstream helices: helix a and b. Helix b projects away from the α-solenoid of β-COP. The schematic at the bottom of the panel shows the subunit domain composition. The subunit regions that are visualised in the x-structure are marked. The β-COP sequence numbering includes the N-terminal His-tag and thus is shifted by 15 residues relative to the annotated uniprot-Q9JIF7 Mus Musculus sequence. See also Figure 1—figure supplement 1 and Table 2.
Figure 1—figure supplement 1
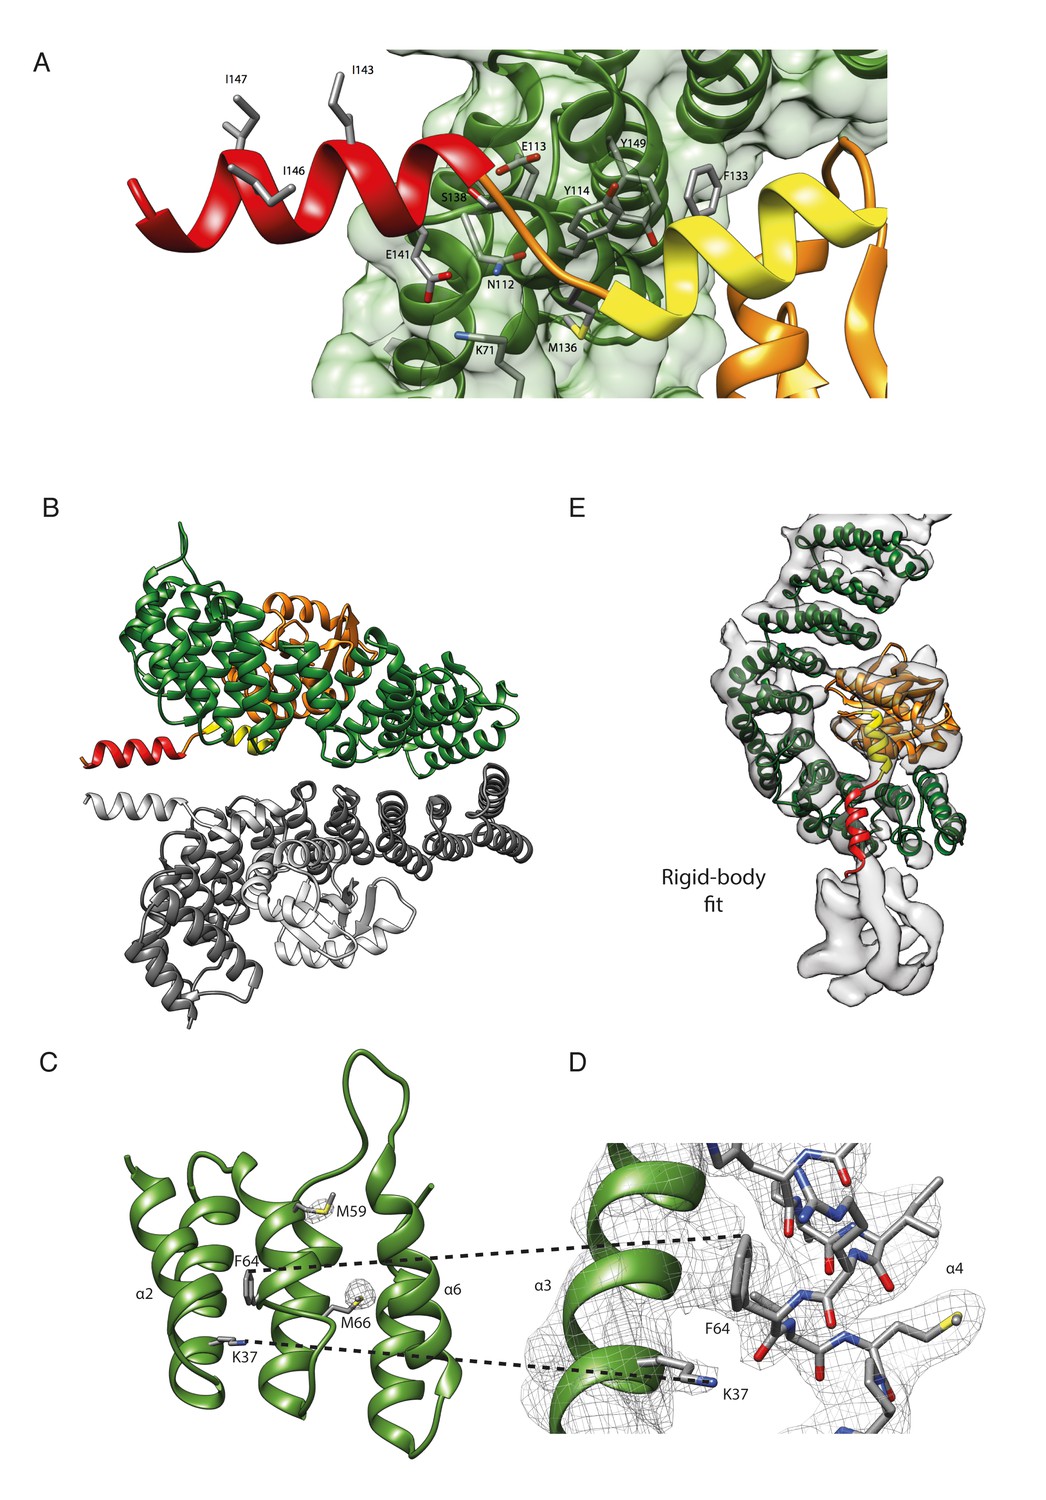
The structure of βδ-COP.
(A) In the crystal structure, β- and δ-COP share an extensive interface with a size of 1737 Å2. The longin domain, β–turn, and helix a of δ-COP are part of the interface with the inside of the β-COP α-solenoid, whereas helix b traverses the α-solenoid along the connection of helices α7 and α6 of β-COP and protrudes away from the solenoid (see also Figure 1). F133 in helix a is in close contact with α-solenoid residues Y114 and Y149. The side chain of δ-M136 anchors the short region between helix a and b onto β. Additionally, the side-chain of β-N112 forms a hydrogen bond to the main-chain oxygen of δ-M136. Other interactions are a salt bridge between δ-E141, which is located at the beginning of helix b, and side chain of β-K71, and a hydrogen bond between side chains of δ-S138 and β-E113. The side chains of I143, I146, and I147 in helix b are shown. These residues are essential for correct trafficking of HDEL motif containing cargo by COPI (Arakel et al., 2016). (B) In the crystal, δ-COP helix b (red) is involved in a contact with helix b of a symmetry-related molecule (grey). The crystal contact comprises an interface area of 371 Å2. We cannot assess whether the crystal contact influences the orientation of helix b, but superposition of corresponding parts of β- and δ-COP from the X-ray and cryo-ET structures (not shown) suggests that there is some flexibility in this region. (C) In the X-ray structure of γζ-COP with bound Arf1 (Yu et al., 2012), helices α2, α4, and α6 of γ-COP interact with Arf1. γζ-COP helix α4 shows standard α-helical geometry from residues T63 to T74 and ends in a 310 helical conformation (K75–Q78). In contrast, in our structure of βδ-COP, downstream of residue I61, β-COP helix α4 is shorter, and between residues I61 and F64 it forms a widened helix with a rare π-helix-like geometry. To highlight the quality of the structure in this region, electron density at contour level 4σ from the anomalous diffraction experiment with SeMet-labelled protein is shown for the two methionine residues M59 and M66. (D) The main chain oxygen of β-COP F64 in helix α4 forms a hydrogen bond with the amino group of the side chain of K37, which is located in the preceding helix α3. 2mFo-DFc electron density is shown at contour level 1σ. (E) The x-ray structure of Chaetomium thermophilum βδ-COP can be fit as a rigid body into the cryo-ET map of the Mus musculus COPI leaf at 9.2 Å resolution, indicating a high degree of structural conservation. β-COP is shown in dark green, δ-COP in orange.
Figure 2 with 3 supplements
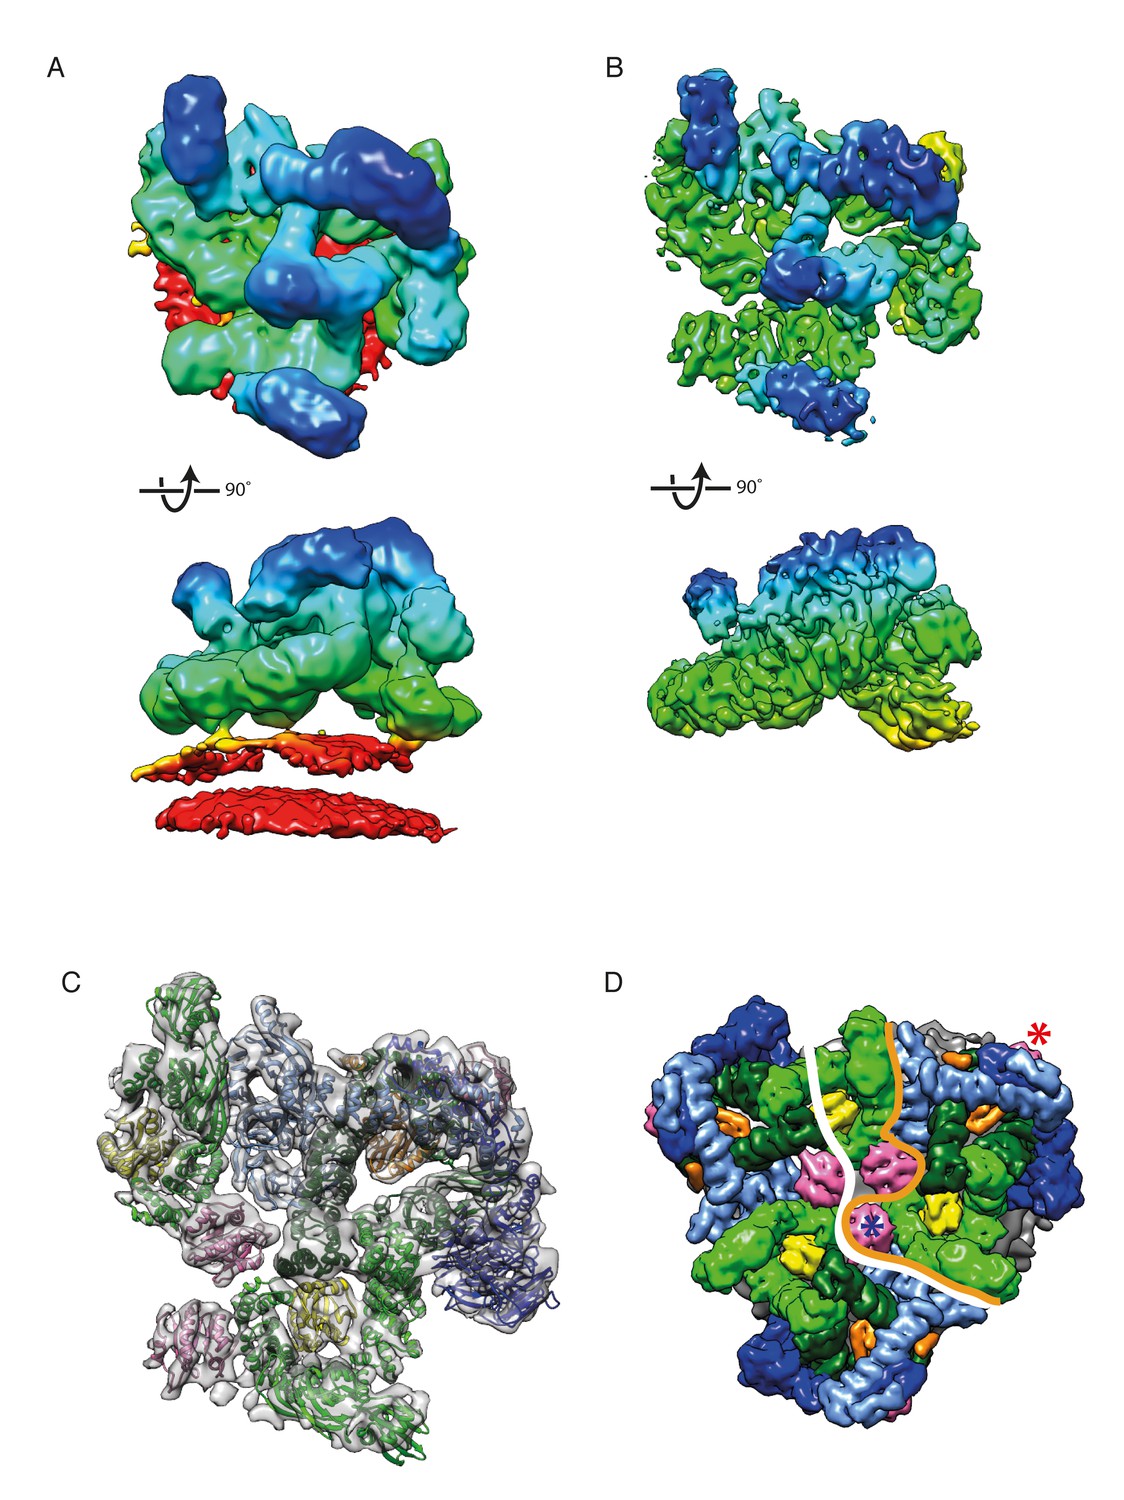
The structure of the COPI leaf at 9 Å resolution.
(A) CryoET reconstruction of the COPI asymmetric unit, the ‘leaf’ before local alignments. The density is colored according to the distance from the membrane - from red to blue. The displayed structure also contains part of Arf1-γ-ζ-COP from a neighboring leaf to show inter-leaf interactions. The density is displayed at 0.04 isosurface level in order to visualize the membrane. (B) CryoET reconstruction of the leaf at 9.2 Å resolution after local alignment. The membrane was masked out during local alignments and upon generation of the combined map. Note the definition of the α-helical densities in the structure. (C) A structural model of the COPI coat after flexible-fitting of structures and homology models into the cryoET structure. Note, that the C-terminal domain of α-COP, ε-COP, and the δ-COP MHD, are not visualized in the leaf structure, since they compose the inter-triad linkages. Color scheme: cryoET density - grey, Arf1 - pink, γ-COP – light green, β-COP - dark green, ζ-COP - yellow, δ-COP - orange, β’-COP - light blue, α-COP – dark blue. (D) The COPI triad. One asymmetric unit, the ‘leaf’, is outlined with an orange line. The part of the structure displayed in this figure A-C is outlined with the white line. The central Arf1 (γArf1) is marked with a blue asterisk, the peripheral Arf1 (βArf1) with a red asterisk. COPI subunits are displayed as molecular surfaces. See also Figure 2—figure supplement 1, Figure 2—figure supplement 2, and Video 1.
Figure 2—figure supplement 1
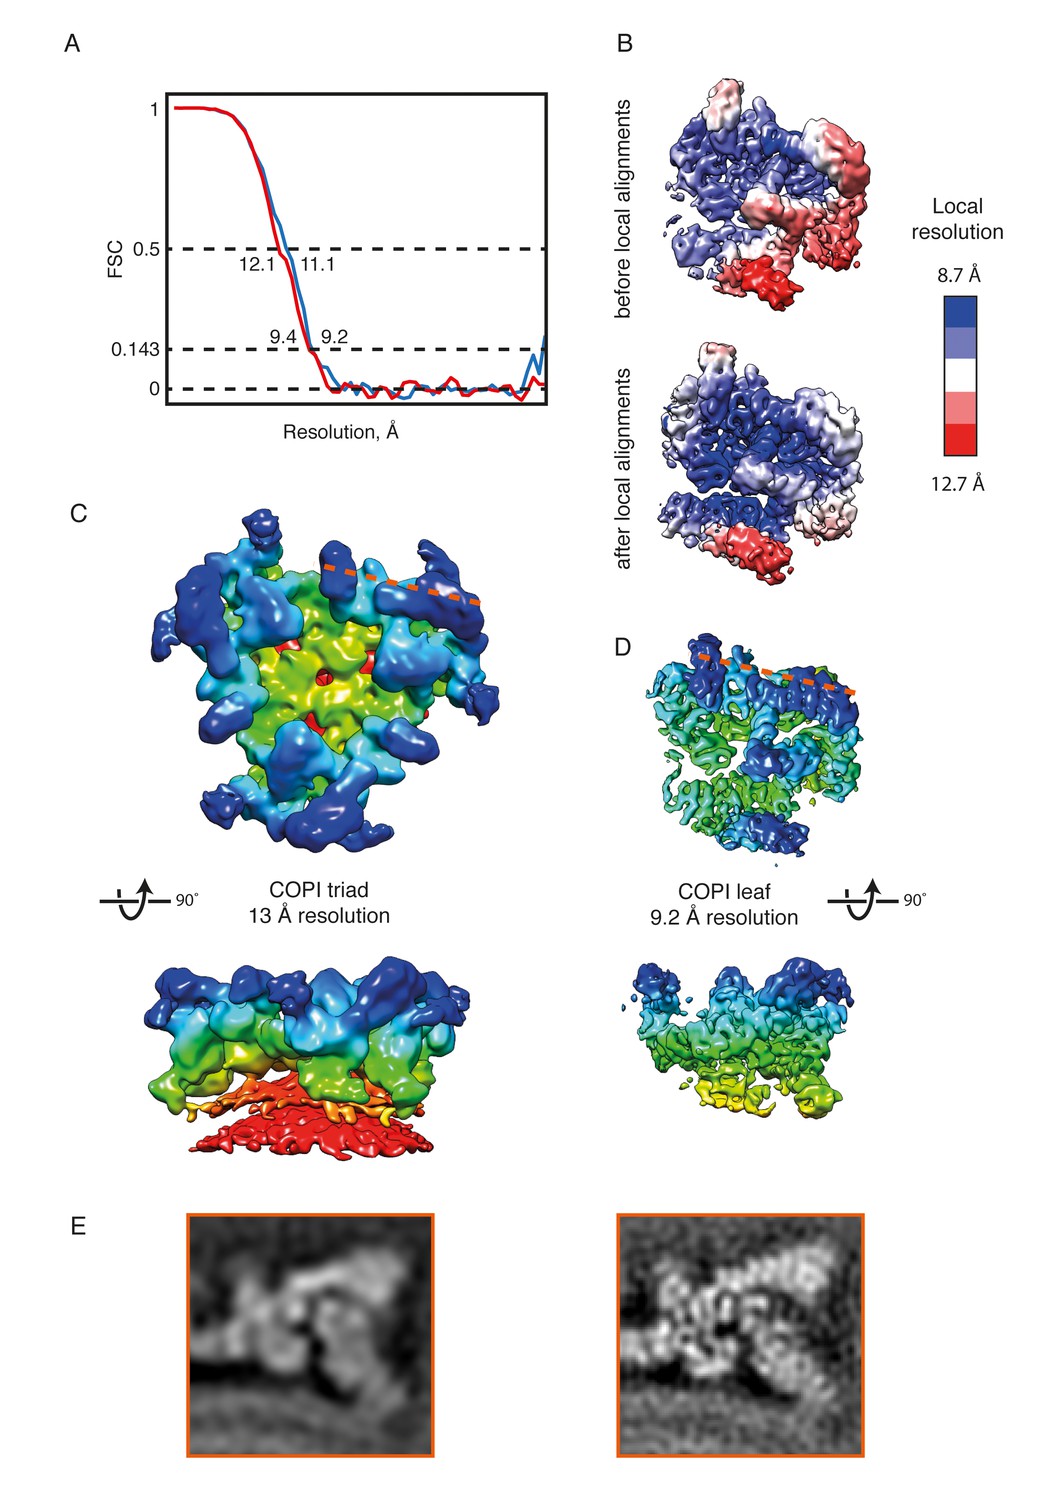
The COPI coat structure at 9 Å or 13 Å resolution.
(A) FSC curves (gold standard) for the leaf structure before (red) and after local alignments (blue). For the locally aligned structure the resolution at the 0.143 criterion is 9.2 Å, at 0.5 FSC – 11.1 Å. (B) The local resolution within the leaf structure ranges from 12.7 Å (red) to 8.7 Å (blue.) After local alignments, the resolution ranges from 11.5 to 8.1 Å. The color range for the locally aligned leaf is the same as for the initial structure for comparison purposes. (C) EM reconstruction of the COPI triad at 13 Å resolution (Dodonova et al., 2015). The triad is colored based on the radial distance from the membrane (from red to blue). (D) The locally aligned EM reconstruction of the leaf at 9.2 Å resolution for comparison to the 13 Å structure. At 9.2 Å resolution, α-helical densities are clearly resolved. The leaf structure is colored based on the radial distance from the membrane. The orange dashed line indicated the cutting plane of the orthoslice shown in the panel B. (E) Slices through the EM density of the 13 Å resolution (left panel), and the 9.4 Å resolution coat structure before the local alignment (right panel) for comparison. The cutting plane is shown with a dashed line in the panel C and D. Note the clear outlines of the α-helical densities in the structure in the right panel.
Figure 2—figure supplement 2
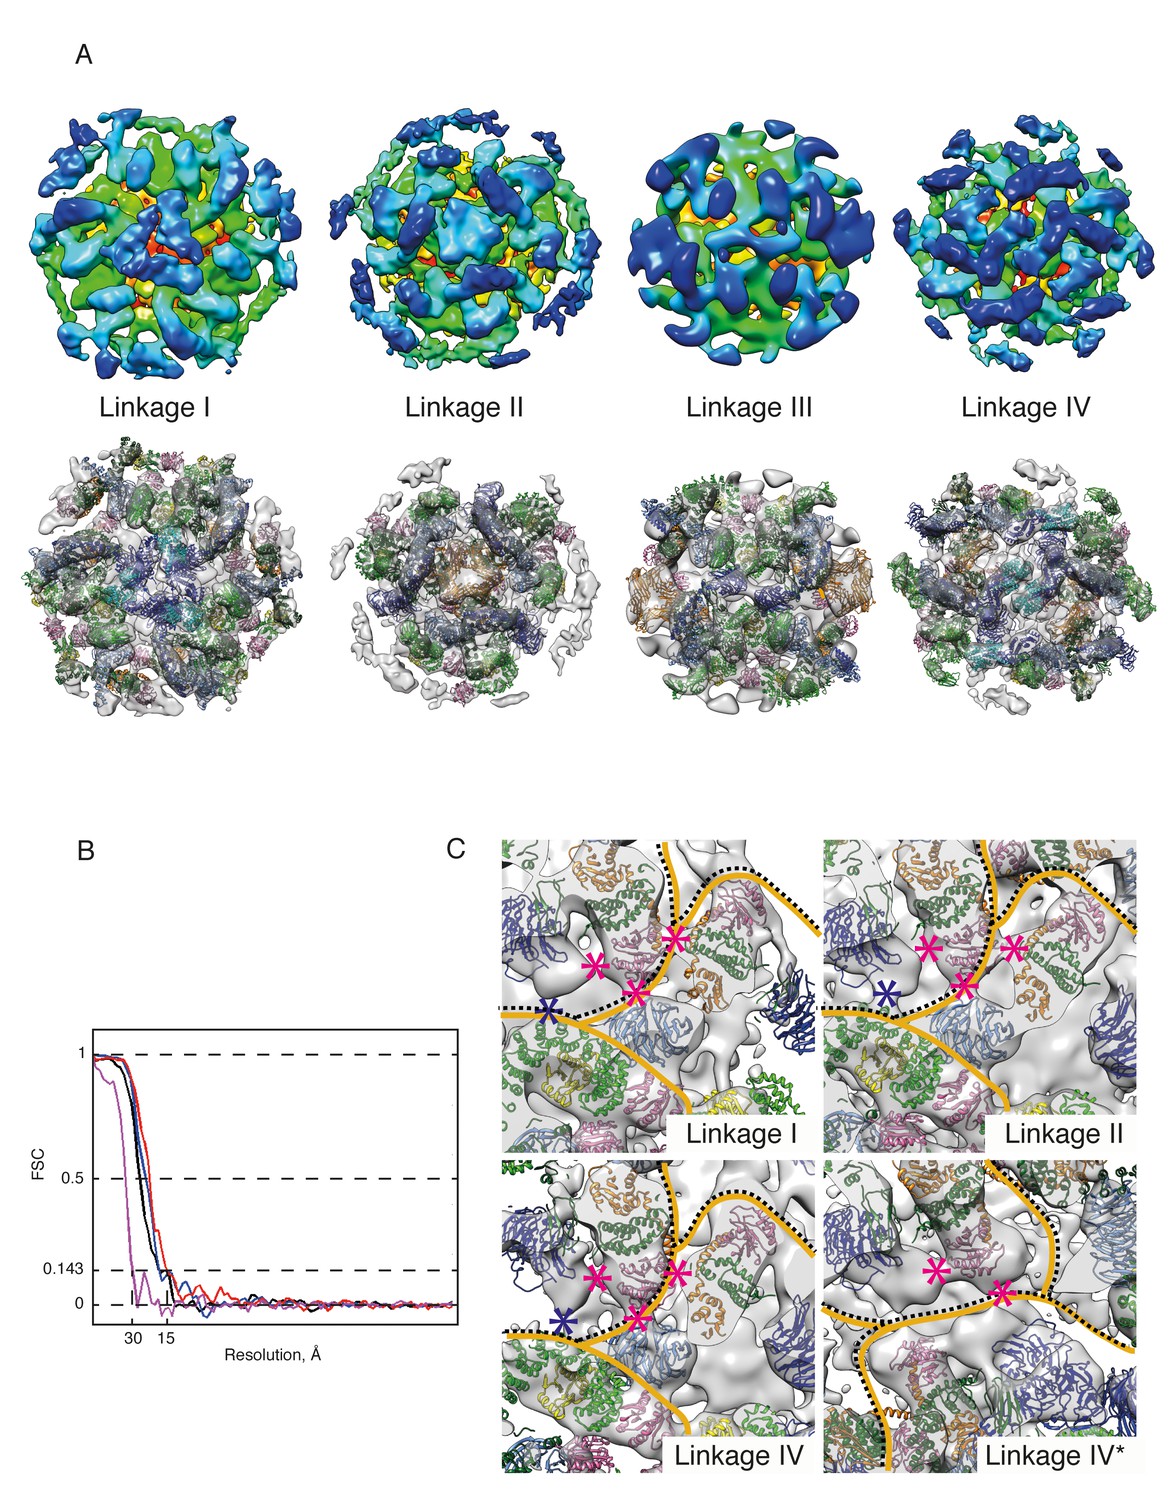
COPI coat linkages.
(A) The structures of the COPI linkages I, II, III, IV (see (Dodonova et al., 2015) for description). The upper panels show the linkage structures colored based on the radial distance from the membrane (from red to blue). The lower panels show the structural models generated by fitting protein structures into the linkage EM maps. The subunits that mediate the main contacts in the linkages are αε-COP (blue and cyan), and δ-COP MHD (orange). (B) The FSC curves for the linkage structures. Resolution at the 0.143 FSC is 15–17 Å for the linkages I, II, IV and 30 Å for linkage III, which is the least abundant of all linkages. (C) The inter-leaf contacts within linkages I, II and IV. Within linkage IV there are two non-symmetry related leaves: in one βArf1 abuts a neighboring triad (labeled linkage IV), in the other βArf1 protrudes towards the center of the linkage (labeled linkage IV*). The contacts made by Arf1 are marked with pink asterisks, the contact between α-COP and γ-COP is marked with a blue asterisk. The boundaries between different leafs are shown with orange lines, the boundaries between triads are shown with a dotted black line. Note that the molecular contacts made by βArf1 in the linkages I, II and IV are almost identical, while βArf1 in Linkage IV* makes fewer contacts. Isosurface threshold is 1σ.
Figure 2—figure supplement 3
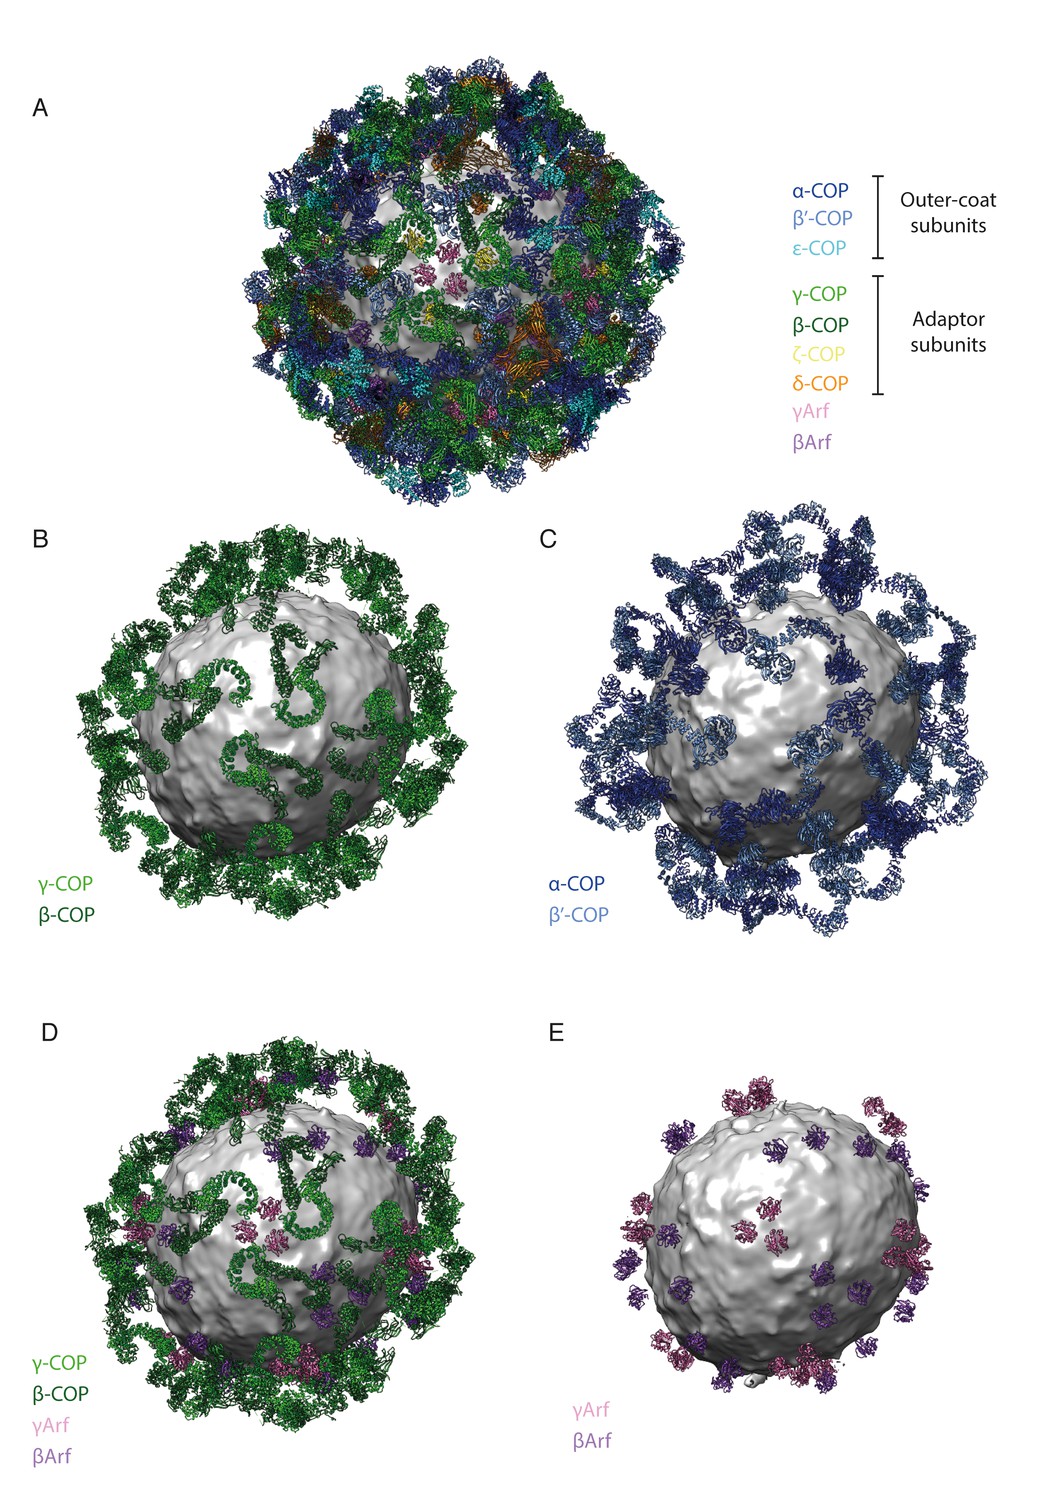
The spatial relationships between components of the coat are illustrated here as an aid to the reader.
The vesicle used for illustration is from our previously published work (Dodonova et al., 2015). (A) A composite representation of a complete COPI vesicle. The membrane is shown in grey. The color scheme of the subunits is shown in the panel. (B) A composite representation of a COPI vesicle, showing only the trunk adaptor domains of γ-COP (light green) and β-COP (dark green). (C) A composite representation of a COPI vesicle, showing only the core outer-coat subunits α-COP (dark blue) and β’-COP (light blue). (D) A composite representation of a COPI vesicle, showing the trunk domains of γ-COP (light green) and β-COP (dark green) and the associated Arf1 molecules – γArf (pink), βArf (purple). (E) A composite representation of a COPI vesicle, showing only the Arf1 molecules – γArf (pink), βArf (purple).
Figure 3
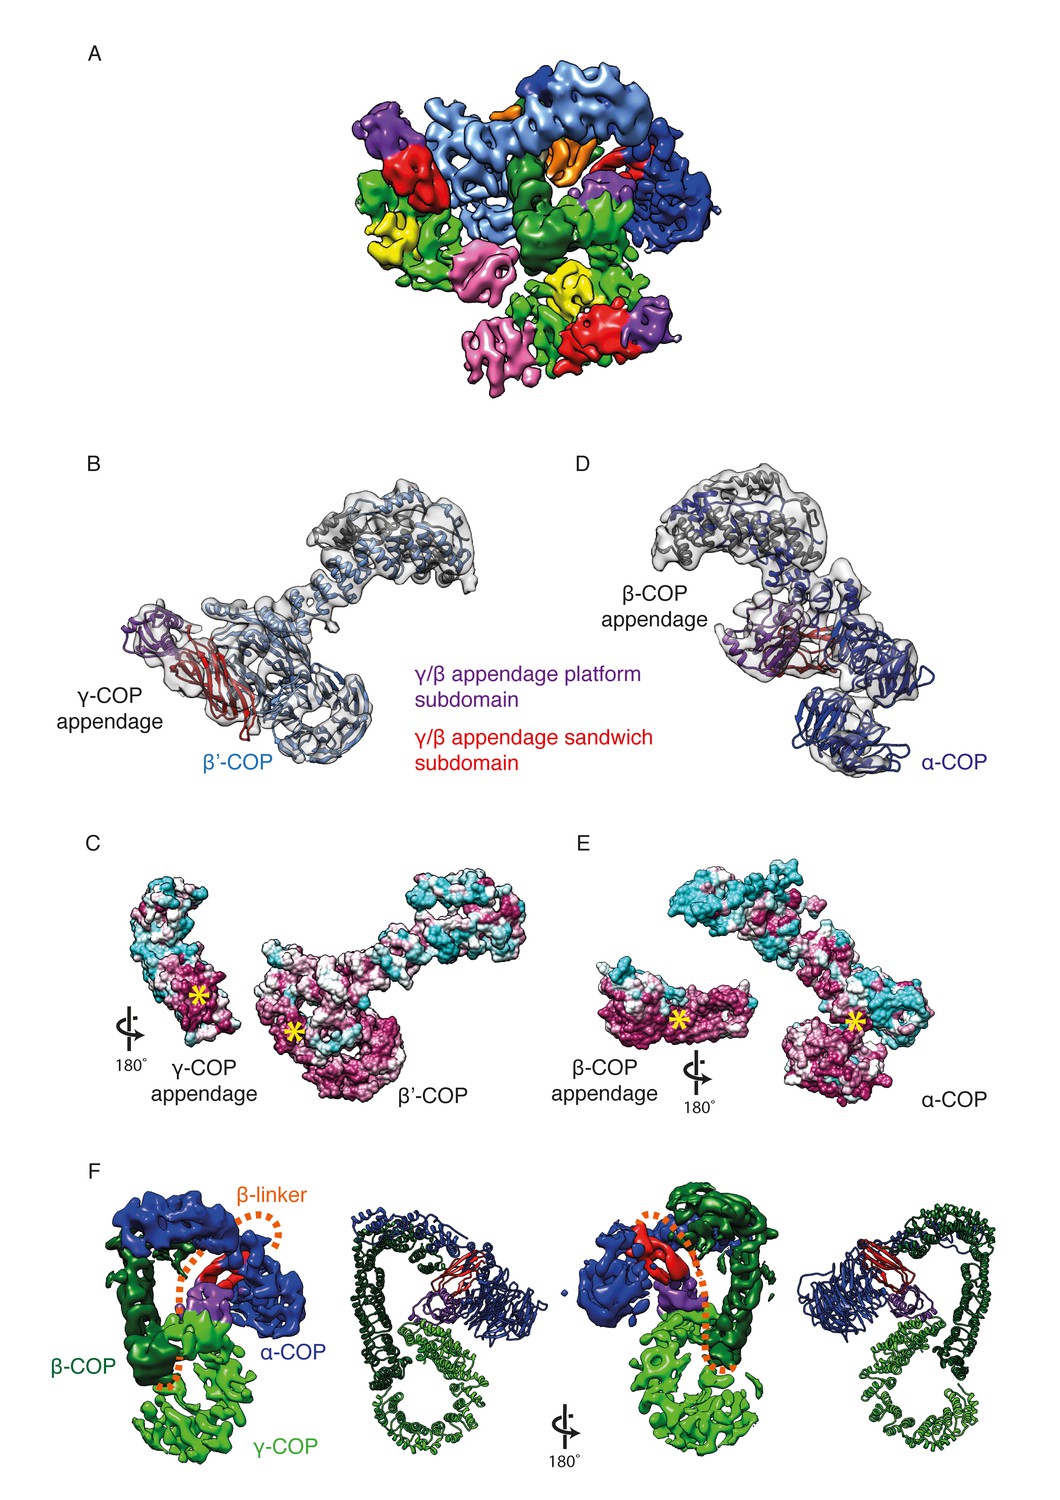
γ-COP and β-COP appendage domains within the coat.
(A) Localization of the γ-COP and β-COP appendages in the COPI leaf. The 9.2 Å EM map of the COPI leaf is colored based on the underlying subunit. Color scheme as in Figure 1, additionally appendage sandwich subdomains are red and appendage platform subdomains are purple. (B) γ-COP appendage (sandwich subdomain – red, platform subdomain - purple) interacts with the β’-COP (light blue). The models are shown within the corresponding part of the COPI EM map (transparent grey isosurface) (C) The structure as in B, opened out to reveal the conserved interaction interfaces of γ-COP and β’-COP (purple – conserved, cyan - variable). The yellow asterisks mark the interaction surfaces. (D) β-COP appendage interacts with α-COP (dark blue). (E) The structure as in D, opened out to reveal the conserved interaction interfaces of β-COP appendage and α-COP (purple – conserved, cyan - variable). (F) The β-COP appendage domain provides the main structural connection between the γ-COP adaptor subunit (light green) and the outer-coat subunit α-COP (blue), where it interacts with both β-propeller domains. Organization of the β-COP subunit: the long β-COP trunk domain (dark green) is connected to the appendage domain (red/purple) by a flexible linker (dashed orange line). We note that the β-COP trunk domain conformation, which is rather straight, is significantly different from the conformations of the β-subunits from homologous AP complexes, which are highly curved. The panel on the right shows the subcomplex from the ‘bottom’ (from the membrane side) in order to visualize the suggested β-linker path more clearly.
Figure 4 with 1 supplement
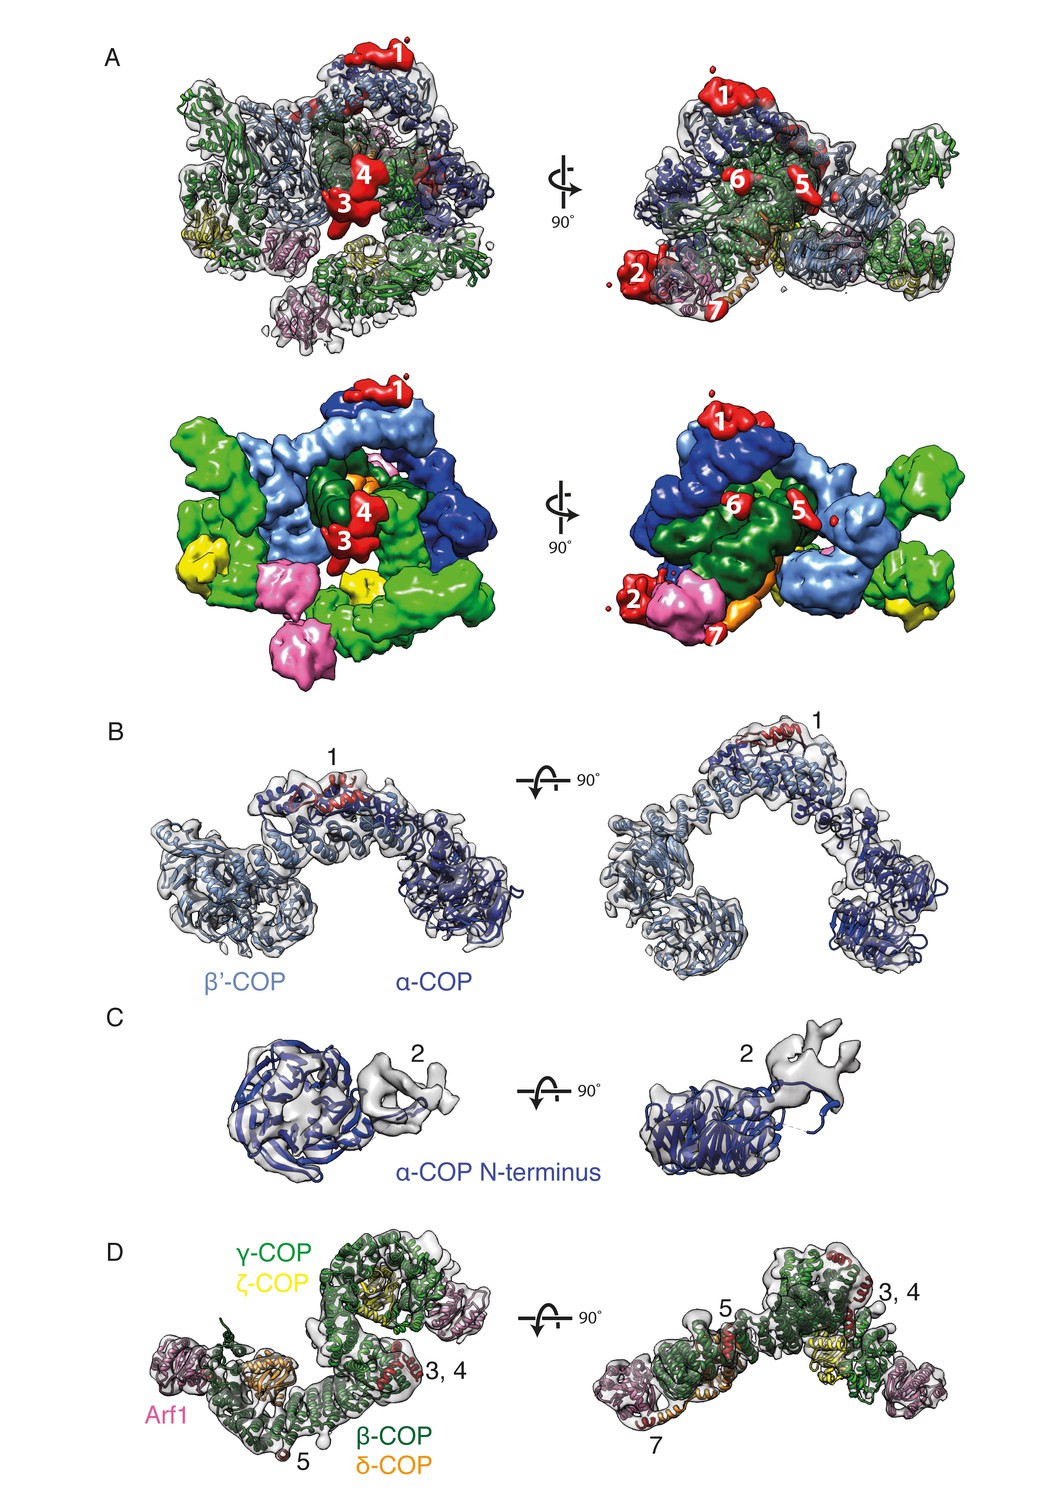
New densities identified in the COPI structure.
(A) Densities within the EM map that are not occupied by the fitted domain structures are shown in red and numbered from 1 to 7 according to their size. The fitted molecules in the lower panel are shown as surfaces. (B) The outer-coat subunits of COPI and a newly assigned region. Density 1 is adjacent to the α-COP/β’-COP interface and can be fitted with the α-helices (red) from the C-terminal part of the β’-COP subunit. (C) The density near the α-COP N-terminal β-propeller domain. The extra density at least partly originates from the mobile loop on the side of the β-propeller domain. (D) The adaptor subunits of COPI and three newly assigned regions. Densities 3 and 4 are located near the C-terminus of the β-trunk domain and are fitted with the additional β-COP C-terminal helices. Densities 5 and 7 are located in the vicinity of the δ-COP subunit and are fitted with the helices belonging to that subunit (see also Figure 5). See also Figure 4—figure supplement 1.
-
Figure 4—source data 1
Source data file Figure 4—figure supplement 1B.
This source file contains the volume values (in voxels) for the unoccupied ‘extra’ densities shown in Figure 4—figure supplement 1B, as determined using Chimera.
- https://doi.org/10.7554/eLife.26691.012
Figure 4—figure supplement 1
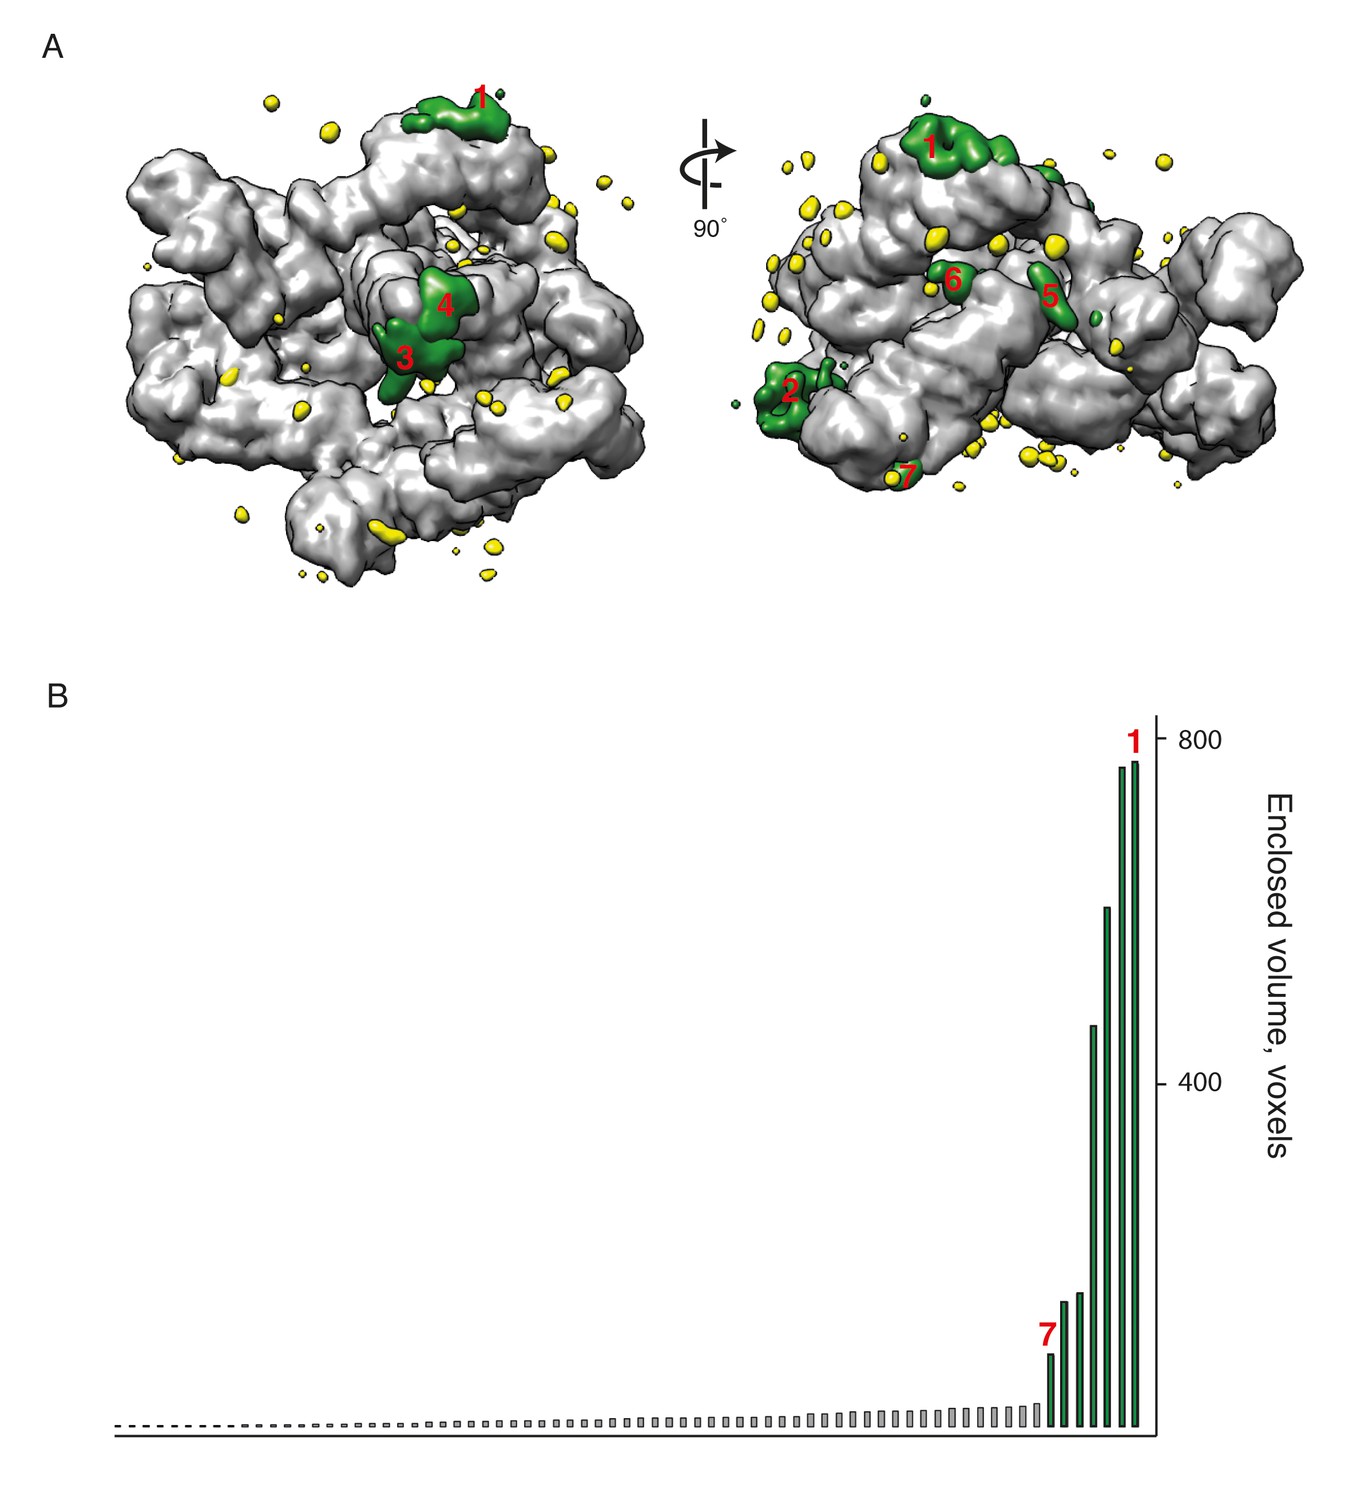
Identification of extra densities in the COPI EM map.
(A) The model of the COPI leaf was flexibly fitted into the EM map, and transformed into an EM density with 9 Å resolution (chimera molmap). The model density was subtracted from the initial EM map and the resulting difference map is shown in green and yellow. (B) The volume distribution of the extra densities (in voxels). The seven largest densities are highlighted in green in the plot and in the panel A. Source data files for panel B are available in Figure 4—source data 1.
Figure 5
δ-COP contains extra α-helices and contacts the Arf1 GTPase.
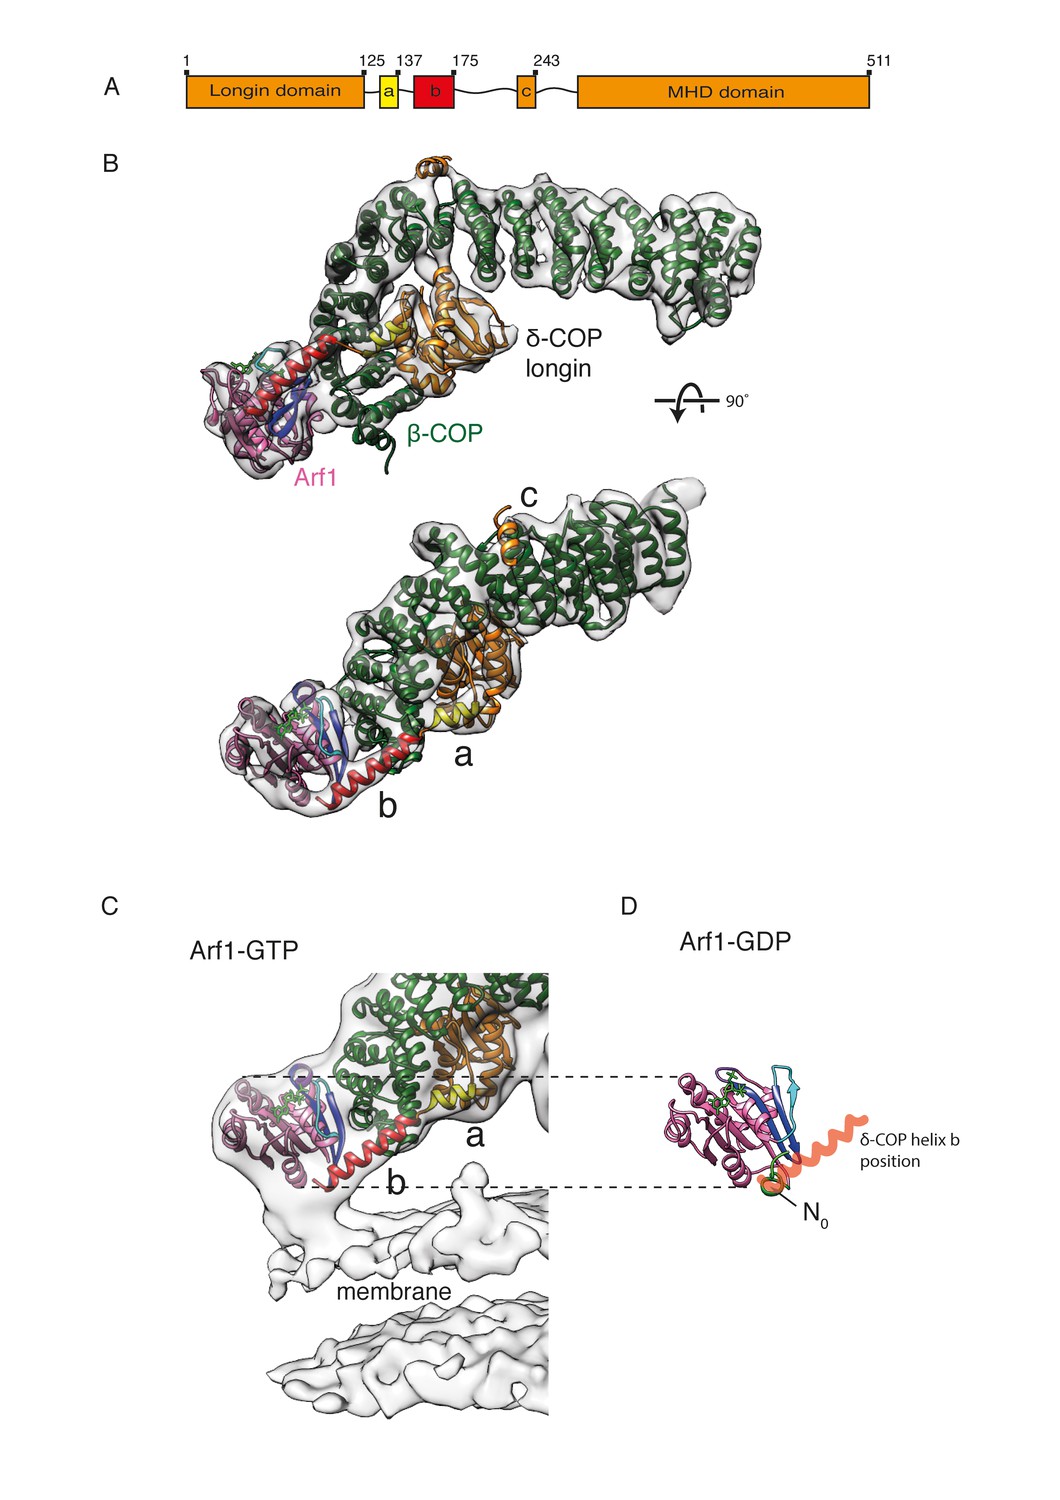
(A) A schematic representation of δ-COP domain architecture. Predicted helices downstream of the δ-COP longin domain are labeled ‘a’, ‘b’, ‘c’. (B) Arf1/δ-COP/β-COP complex fitted into the EM density. The MHD δ-COP is not shown here, since it is a part of the inter-triad linkages and is averaged out in the leaf structure. Residues 139–165 of helix b are modeled. Color scheme: EM density – transparent grey, Arf1 - pink, β-COP - dark green, δ-COP - orange. The δ-COP helix ‘a’ is highlighted in yellow, and helix ‘b’ in red. (C) The Arf1/δ-COP/β-COP subcomplex fitted into the EM map illustrated unmasked at a lower isosurface level. (D) Arf1 in the GDP-bound state. The orientation of Arf1-GDP is equivalent to that in panel C. The position occupied by the δ-COP helix b in the assembled coat is shown in semi-transparent red: it overlaps with helix N0. Color code: GDP – green, Arf1 – pink, Switch I - cyan, Switch II – purple, Interswitch – blue, helix N0 – green.
Figure 6 with 2 supplements
Site-directed photo-cross-linking.
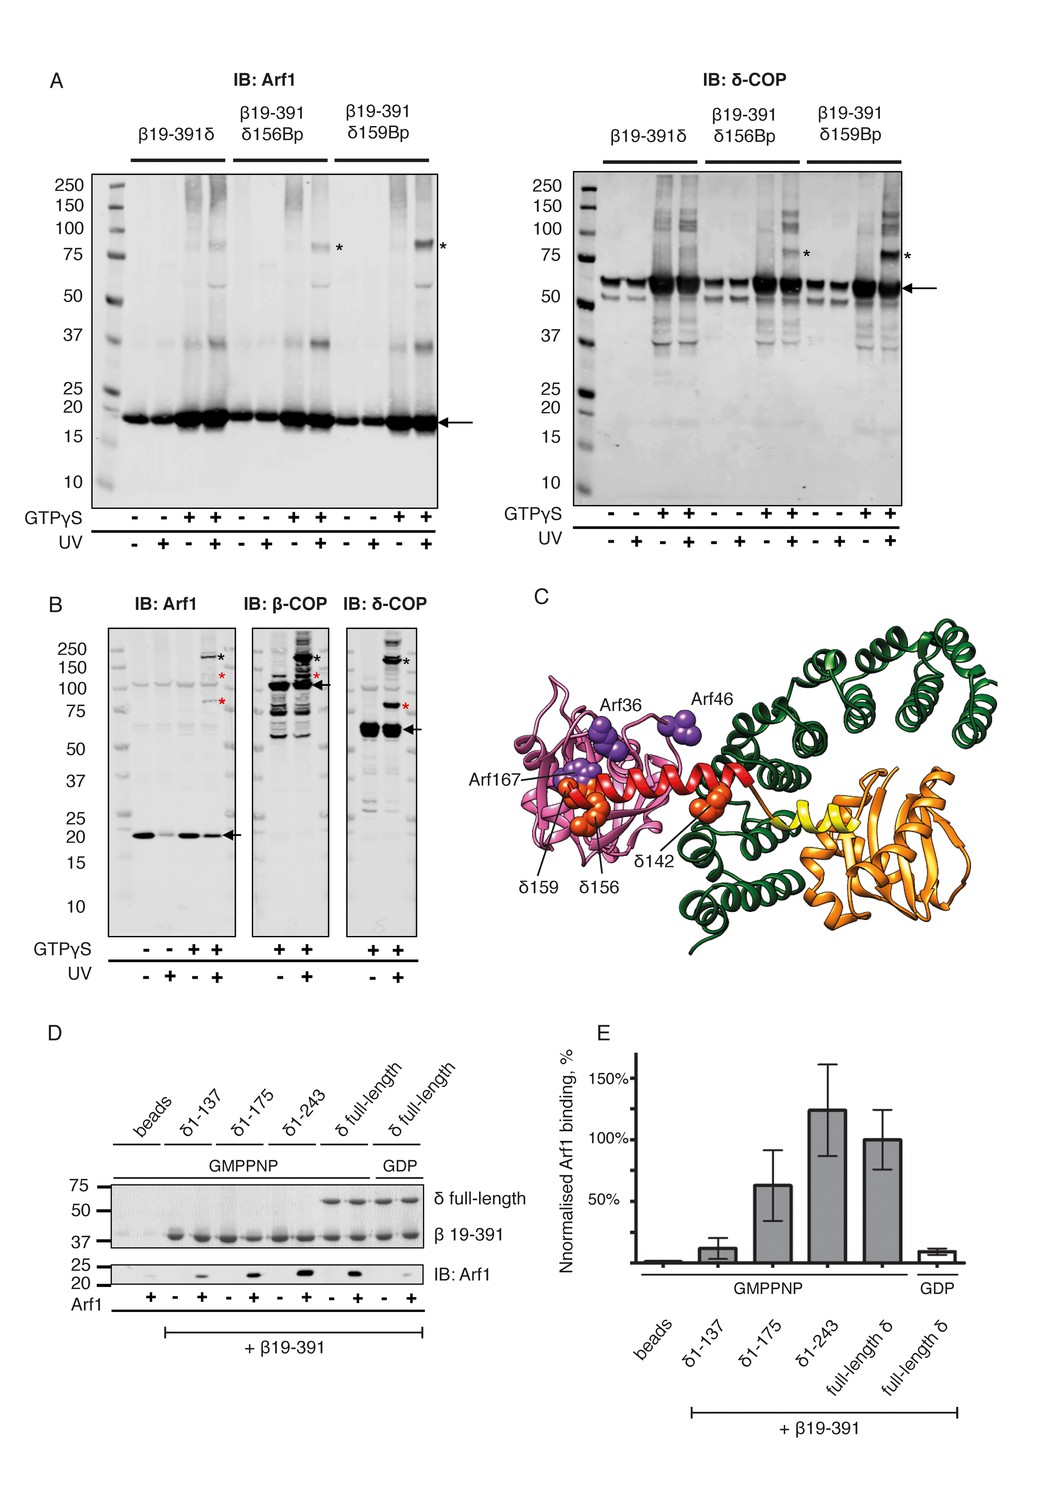
(A) Site-directed photo-cross-linking of chimeric βδ subcomplexes and Arf1-GTPγS on Golgi-like liposomes, with photolabile aminoacids (Benzophenone (Bp)) in δ-COP positions 156 or 159 (Ctβ19–391-MδT156Bp and Ctβ19–391-MδR159Bp). After irradiation with UV light, cross-linked products were analyzed by SDS-PAGE and western-blot with antibodies directed against Arf1 (left panel) and δ-COP (right panel), and are marked with black asterisks. Bands of non-cross-linked proteins are marked with arrows (IB: immune blot). (B) Site-directed photo-cross-linking of Arf1-GTPγS with Bp in both positions 46 and 167 (Arf1-I46BpY167Bp) with coatomer on Golgi membranes. Cross-linked products were analyzed by SDS-PAGE and western blot with antibodies directed against β-COP, δ-COP and Arf1. Black asterisks mark double cross-linked products linked by both photolabile residues, red asterisks mark single cross-linked products linked by Bp at either position 167 or 46 in Arf1. Non-cross-linked proteins are marked with arrows. (C) Ribbon model of the structure of a subcomplex of Ctβ19-391δ1–159 with Arf. Residues involved in cross-linking are shown as spheres (orange-red for δ-COP and purple for Arf1). In summary, photolabile amino acids δ-COP156 and δ-COP159 cross-linked to Arf1, photolabile Arf46 cross-linked to β-COP, and Arf167 cross-linked to δ-COP. Mass-spectrometry cross-linking also identified a cross-link between Arf36 and δ-COP142 (Dodonova et al., 2015). (D) Binding of NΔ20CtArf1 GMPPNP to Ctβδ subcomplexes. Subcomplexes contained β19–391-COP and δ-COP including helix a (δ-COP1-137), or δ-COP including helix b (δ-COP1-175), or δ-COP including helix c (δ-COP1-243), or full-length δ-COP, as indicated in the figure. Ctβδ subcomplexes were immobilized on Strep-Tactin sepharose beads. Beads were incubated with purified N△20CtArf complexed with GMPPNP or GDP. Pulldowns were analyzed by SDS-PAGE and western-blot. The gels were cut in two pieces. The lower piece was immuno-blotted with antibodies directed against Arf1 (lower panel). The upper part was used for coomassie staining to visualize COP subcomplexes (upper panel) (Note: δ-COP fragments 1–137, 1–175 and 1–243 are not visible in the coomassie stained upper panel as they migrate into the part of the gel that was blotted for quantification of Arf1). (E) Quantification of the data depicted in D. As a control, binding of NΔ20CtArf1 to β19-391COP complexed with full length δ-COP was analyzed in the presence of GDP (last column). Pulldowns were quantified using the Image-Studio software (Li-Cor Bioscience). Quantification was normalized to the βδ-COP subcomplexes containing full-length δ-COP with N△20CtArf in its GMPPNP complexed state. (means ± SEM; n = 3). See also Figure 6—figure supplement 1 and Figure 6—figure supplement 2. Source data files for panel E are available in Figure 6—source data 1.
-
Figure 6—source data 1
Source data file for Figure 6E.
- https://doi.org/10.7554/eLife.26691.017
Figure 6—figure supplement 1
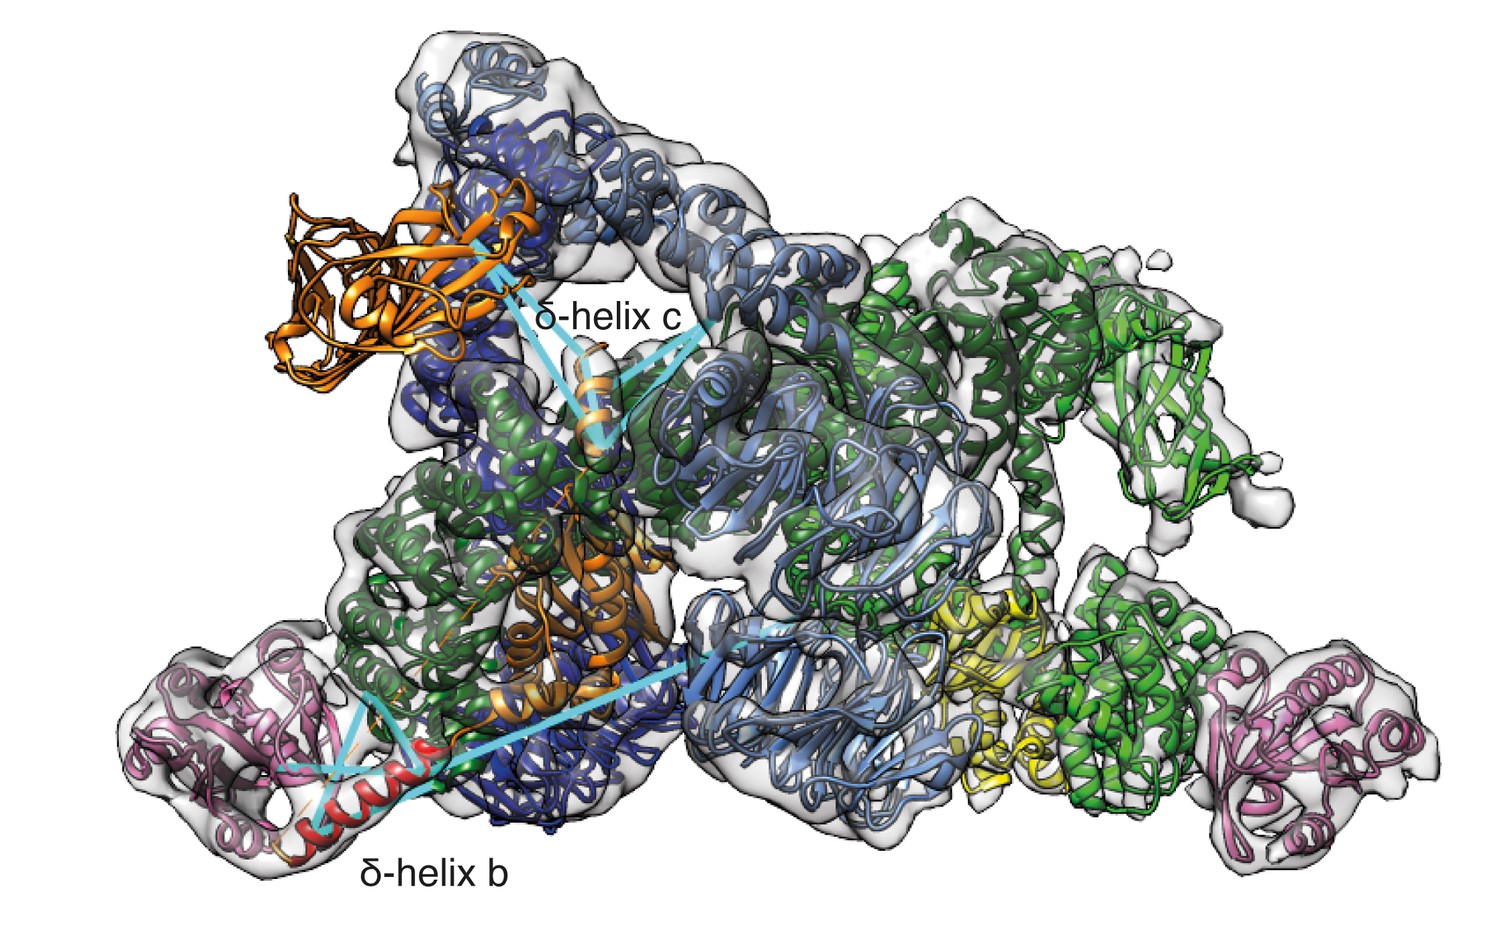
Mass-spectrometry derived cross-links from newly positioned COPI domains.
Cross-linked peptides from the newly assigned regions were mapped within the COPI leaf model (cyan lines). δ-COP helix b (red) was cross-linked to β-COP (dark green), to Arf1 (pink), and to β’-COP (light blue). The δ-COP helix C (orange) was cross-linked to δ-COP MHD (orange). Note that δ-COP MHD is located in the linkage, and not in the COPI leaf, so it is not enclosed by the EM density.
Figure 6—figure supplement 2
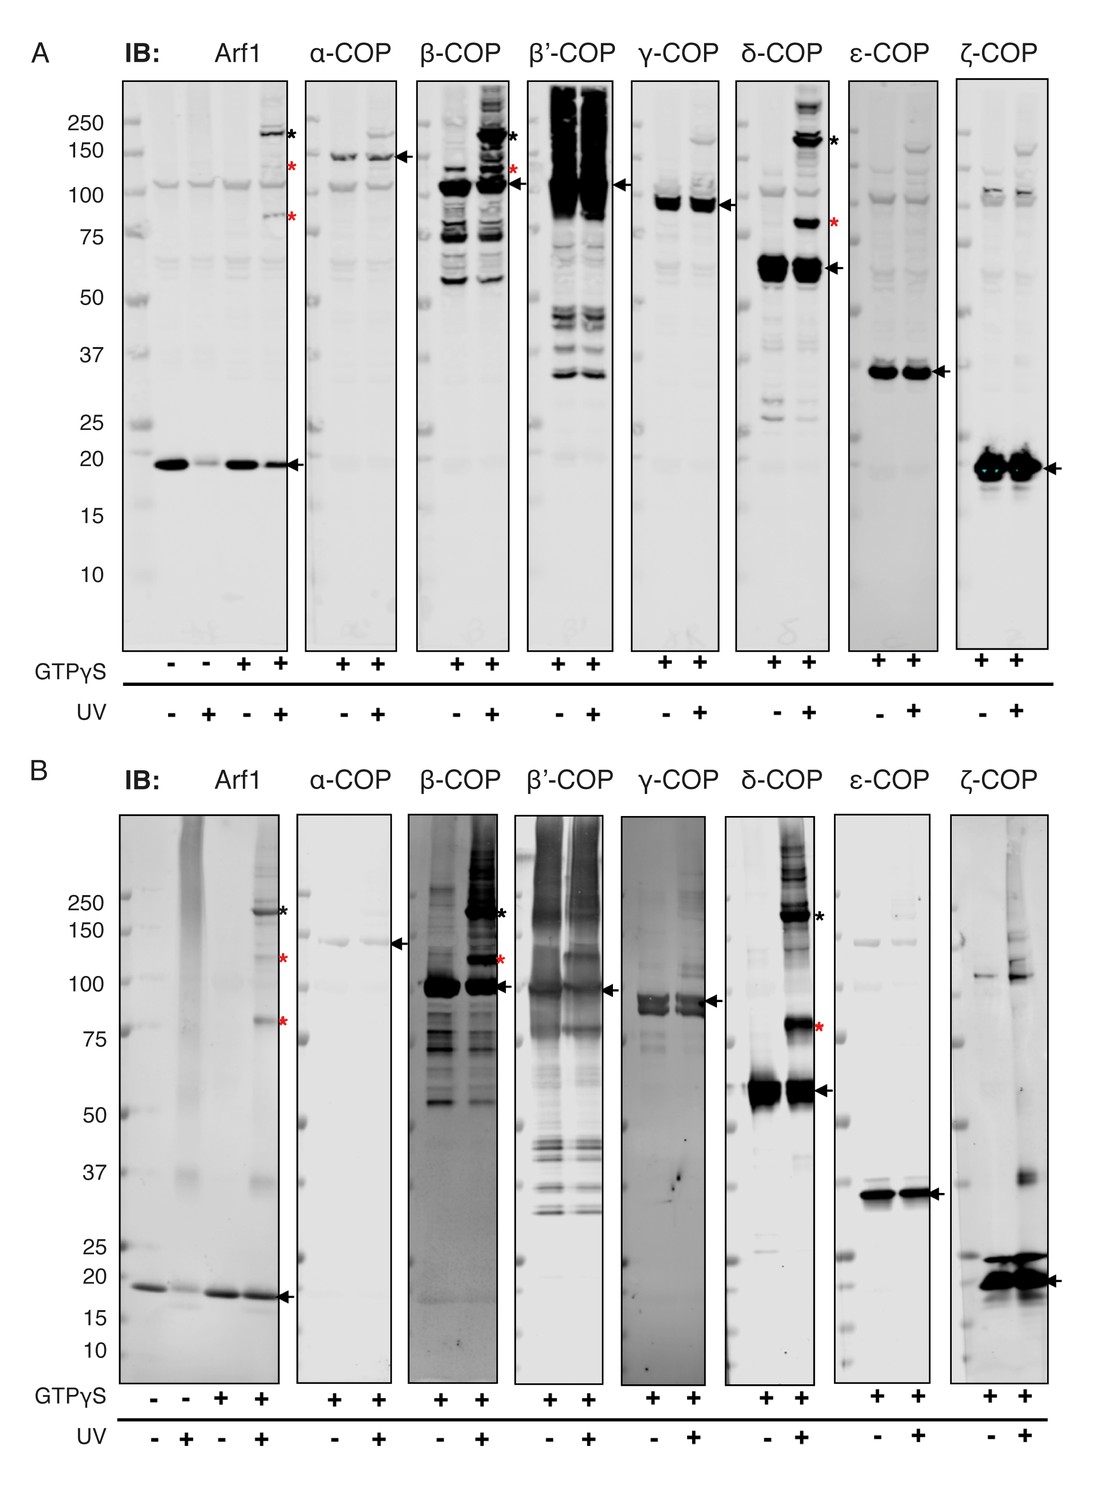
Site-directed photo-cross-links.
Site-directed photo-cross-linking of Arf1-I46BpY167Bp (loaded with GTPγS) to coatomer on (A) Golgi membranes, or (B) Golgi-like liposomes. Cross-links were analyzed by SDS-PAGE and western blot with antibodies directed against all coatomer subunits and against Arf1. Black asterisks mark double cross-link products obtained with photolabile Bp at positions 46 and 167 in Arf1, red asterisks mark single cross-link products with photolabile Bp at positions 46 or 167 in Arf1 (Sun et al., 2007). Bands representing the non-cross-linked proteins are marked with arrows.
Figure 7 with 1 supplement
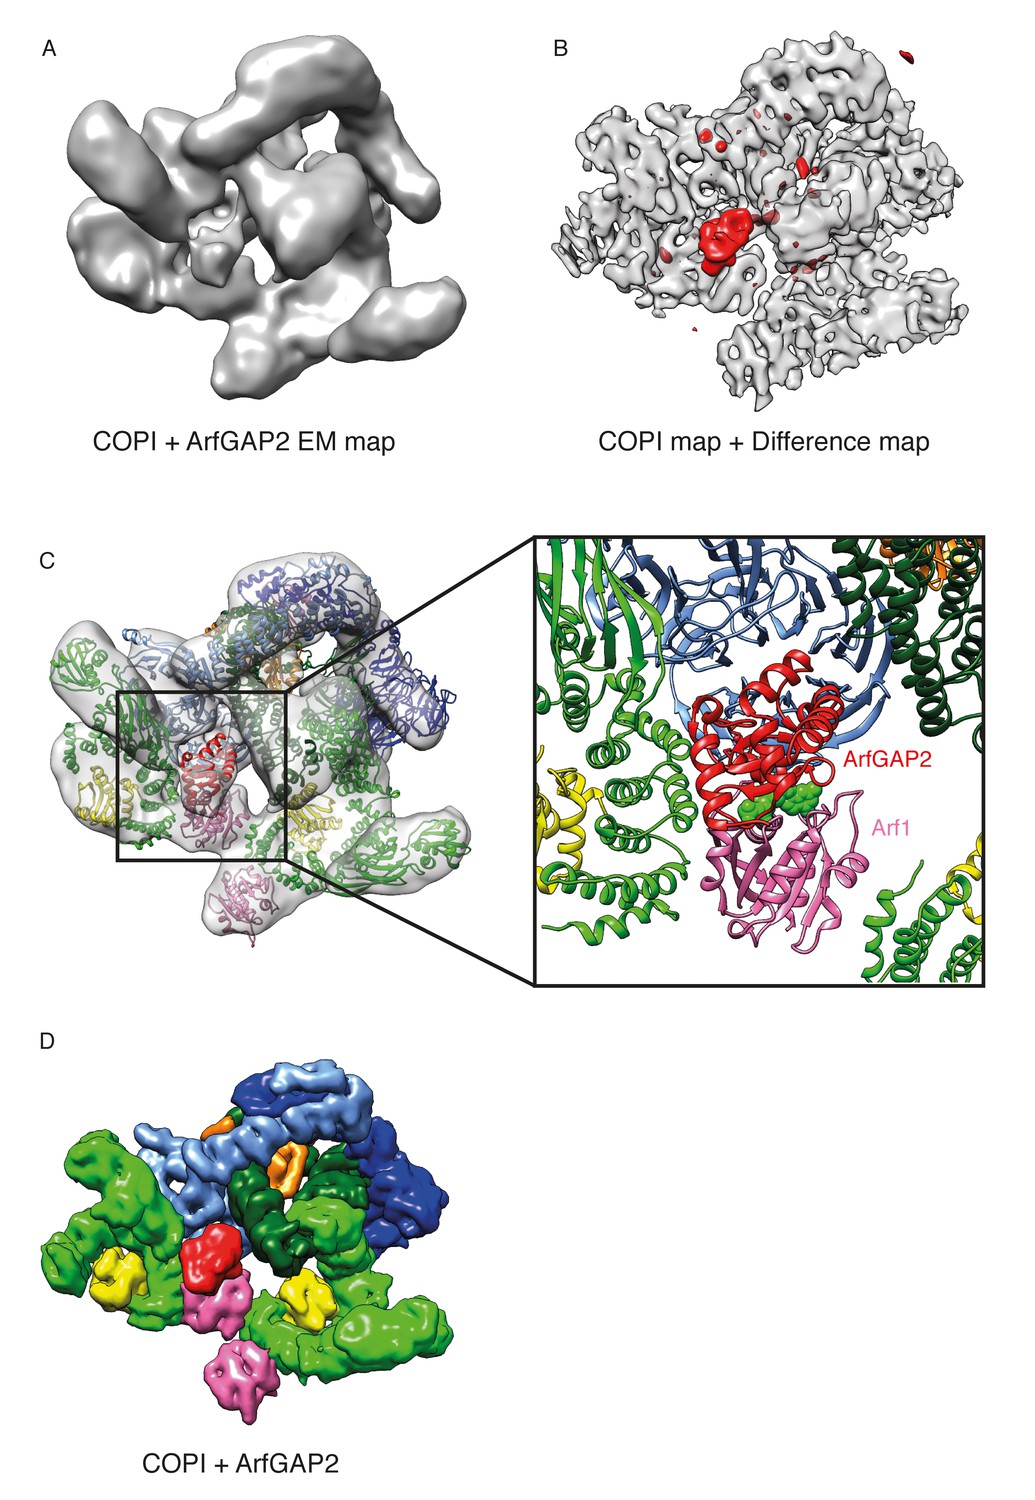
Localization of ArfGAP2 within the COPI coat.
(A) COPI-ArfGAP2 leaf structure as grey isosurface. (B) COPI leaf structure (grey) and the difference map between the COPI and the COPI-ArfGAP2 structure (red). (C) The fit of COPI and the ArfGAP2 catalytic domain (PDB:2P57) into the COPI-ArfGAP2 leaf structure. The domain is located near the Arf1-nucleotide binding site (nucleotide is shown in green) (D) Surface representations of the COPI and ArfGAP2 molecular models, illustrating the position of the ArfGAP2 catalytic domain (red) in a niche within the assembled coat. See also Figure 7—figure supplement 1.
Figure 7—figure supplement 1
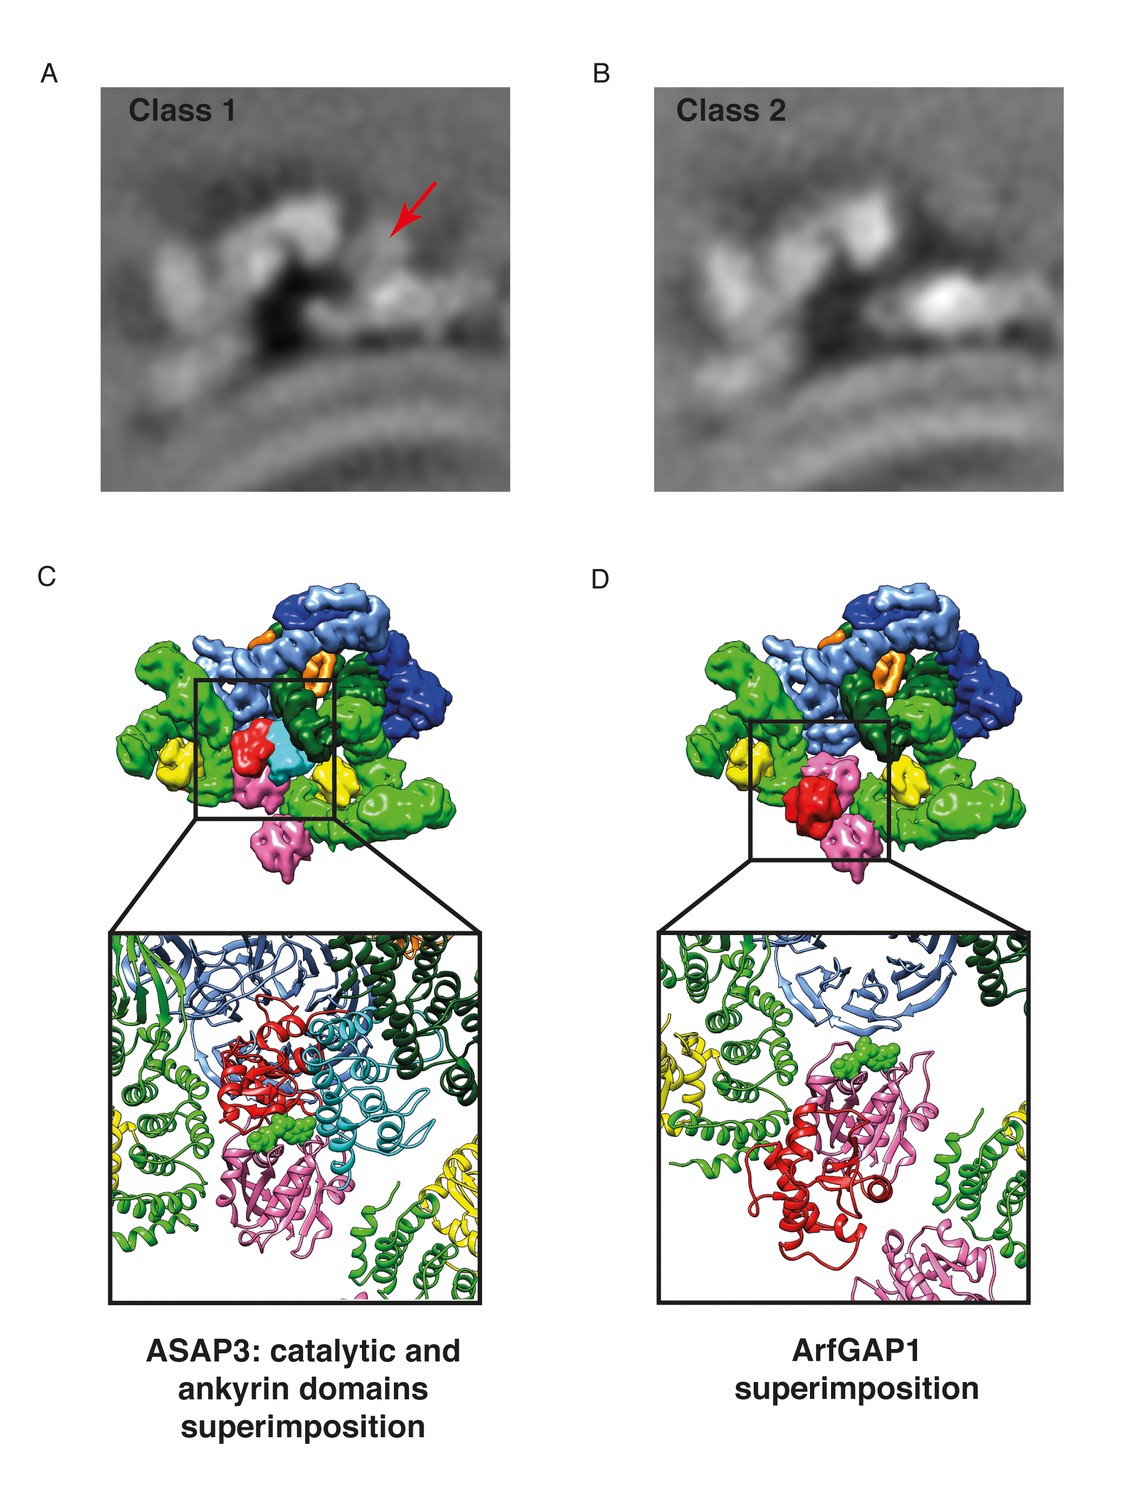
Position of the ArfGAP2 catalytic domain within in the COPI coat.
(A) The COPI-ArfGAP2 dataset was split into two distinct classes by multireference-based alignment and classification. Slice through the EM density of the class 1 from the COPI-ArfGAP2 dataset, which contains the extra density corresponding to the ArfGAP2 catalytic domain. The slicing plane is orthogonal to the membrane. The additional density is marked with an arrow. (B) Slice through the EM density of the class 2 from the COPI-ArfGAP2 dataset, which did not contain any additional densities in comparison with the control structure. The slicing plane is orthogonal to the membrane. (C) Position of the catalytic domain (red) and ankyrin domain (cyan) based on the Arf6-ASAP3 structure (PDB:3LVQ). The Arf1 from the Arf6-ASAP3 structure was superimposed with the Arf1 in our model. Note, that the ankyrin domain clashes with the β-COP (dark green). The existence of a small COPI-niche suggests that there may be sterical selection for the type of ArfGAP protein interacting with Arf1 in the context of the COPI coat. (D) Position of the catalytic domain (red) based on the Arf1-ArfGAP1 structure, where Arf1 in the Arf1-ArfGAP structure was superimposed on the Arf1 in our model (Goldberg, 1998). Note, that the catalytic domain is far from the nucleotide site (nucleotide is shown in green). Color scheme: Arf1 - pink, γ-COP – light green, β-COP - dark green, ζ-COP - yellow, δ-COP - orange, β’-COP - light blue, α-COP – dark blue. Compare panels C and D with our structural model illustrated in Figure 7C).
Videos
Video 1
The COPI coat structure and model.
A tour through the COPI structure highlighting key features of the coat discussed in this study.
Tables
Table 1
Data collection and refinement statistics. Each dataset was collected from one single crystal. Statistics for the highest-resolution shell are shown in parentheses.
| Dataset | SeMet | Native |
|---|---|---|
| Wavelength [Å] | 0.97264 | 0.97625 |
| Resolution range [Å] | 46.40–2.70 (2.83–2.70) | 32.05–2.57 (2.66–2.57) |
| Space group | C 2 2 21 | C 2 2 21 |
| Unit cell [Å] | a = 138.22;b = 176.40;c = 62.60 (90°,90°,90°) | a = 137.59;b = 177.47;c = 62.72 (90°,90°,90°) |
| Total reflections | 185546 (6684) | 165162 (19393) |
| Unique reflections | 17882 (1081) | 24909 (2440) |
| Multiplicity | 10.4 (6.2) | 6.6 (6.5) |
| Completeness [%] | 83.2 (39.3) | 99.9 (99.9) |
| Mean I/sigma(I) | 20.8 (1.9) | 15.1 (1.3) |
| Rmerge | 0.069 (0.819) | 0.068 (1.391) |
| Rpim | 0.031 (0.523) | 0.031 (0.644) |
| CC1/2 | 0.999 (0.620) | 0.999 (0.502) |
| # Reflections used in refinement | 24904 (2439) | |
| # Reflections used for Rfree | 1228 (119) | |
| Rwork | 0.1748 (0.2802) | |
| Rfree | 0.2273 (0.3185) | |
| Number of non-hydrogen atoms | 4213 | |
| in Macromolecules | 4169 | |
| Protein residues | 521 | |
| RMSD on bonds [Å] | 0.009 | |
| RMSD on angles [°] | 1.19 | |
| Ramachandran favored [%] | 97 | |
| Ramachandran allowed [%] | 2.5 | |
| Ramachandran outliers [%] | 0 | |
| Average B-factor [Å2] | 88.27 | |
| Macromolecules [Å2] | 88.42 | |
| Solvent [Å2] | 74.47 |
Table 2
Cross-links from newly assigned COPI domains The mass-spectrometry cross linking data is part of a previously published dataset (Dodonova et al., 2015). The distances between lysine pairs for which cross-links were observed were measured for our structural model. If the measured distance was below 35 Å, it satisfied the distance criteria.
| # | Subunit 1 | a.a. | Domain 1 | Subunit 2 | a.a. | Domain 2 | lD score | Distance, nm |
|---|---|---|---|---|---|---|---|---|
| 1 | β’ | 856 | C-terminal part | α | 1180 | CTD | 21,25 | − |
| 2 | β’ | 871 | C-terminal part | α | 1180 | CTD | 24,46 | − |
| 3 | β | 617 | loop near extra helix | ζ | 39 | core | 27,11 | − |
| 4 | β | 618 | loop near extra helix | ζ | 39 | core | 24,31 | − |
| 5 | β | 666 | linker | β | 891 | appendage | 46,62 | − |
| 6 | β | 671 | linker | β’ | 779 | α-solenoid | 32,34 | − |
| 7 | β | 671 | linker | β | 891 | appendage | 47,02 | − |
| 8 | β | 694 | linker | α | 750 | α-solenoid | 30,68 | − |
| 9 | β | 718 | linker | β’ | 779 | α-solenoid | 28,42 | − |
| 10 | β | 718 | linker | α | 671 | α-solenoid | 38,19 | − |
| 11 | β | 718 | linker | α | 698 | α-solenoid | 36,71 | − |
| 12 | β | 718 | linker | β | 324 | trunk | 38,14 | − |
| 13 | β | 718 | linker | β | 801 | appendage | 35,16 | − |
| 14 | β | 718 | linker | β | 891 | appendage | 35,1 | − |
| 15 | β | 727 | linker | α | 676 | α-solenoid | 25,12 | − |
| 16 | δ | 142 | extra helix b | Arf1 | 36 | core | 28,0 | 22 |
| 17 | δ | 142 | extra helix b | β | 122 | trunk | 36,07 | 16 |
| 18 | δ | 142 | extra helix b | β’ | 69 | 1st β-propeller | 31,54 | 60 |
| 19 | δ | 156 | extra helix b | β | 122 | trunk | 31,37 | 24 |
| 20 | δ | 156 | extra helix b | β | 47 | trunk | 26,7 | 27 |
| 21 | δ | 164 | near extra helix b | β | 122 | trunk | 30,62 | − |
| 22 | δ | 164 | near extra helix b | Arf1 | 36 | core | 33,33 | − |
| 23 | δ | 224 | linker | β’ | 615 | α-solenoid | 18,14 | − |
| 24 | δ | 227 | linker | δ | 309 | MHD | 33,02 | − |
| 25 | δ | 231 | linker | δ | 309 | MHD | 33,28 | − |
| 26 | δ | 233 | extra helix c | β’ | 627 | α-solenoid | 29,71 | 26 |
| 27 | δ | 233 | extra helix c | δ | 243 | extra helix c | 38,83 | 16 |
| 28 | δ | 233 | extra helix c | δ | 256 | linker | 35,08 | − |
| 29 | δ | 233 | extra helix c | δ | 263 | MHD | 39,82 | 36 |
| 30 | δ | 241 | extra helix c | β’ | 627 | α-solenoid | 24,78 | 18 |
| 31 | δ | 243 | extra helix c | δ | 263 | MHD | 24,59 | 23 |
| 32 | δ | 256 | linker | δ | 263 | MHD | 31,39 | − |
| 33 | δ | 256 | linker | δ | 309 | MHD | 33,11 | − |
| 34 | δ | 256 | linker | δ | 322 | MHD | 24,85 | − |
Download links
A two-part list of links to download the article, or parts of the article, in various formats.
Downloads (link to download the article as PDF)
Open citations (links to open the citations from this article in various online reference manager services)
Cite this article (links to download the citations from this article in formats compatible with various reference manager tools)
9Å structure of the COPI coat reveals that the Arf1 GTPase occupies two contrasting molecular environments
eLife 6:e26691.
https://doi.org/10.7554/eLife.26691


