Structural inhibition of dynamin-mediated membrane fission by endophilin
- University of Geneva, Switzerland
- University of California, United States
- University of Utah, United States
- Chan Zuckerberg Biohub, United States
- Yale University School of Medicine, United States
- Howard Hughes Medical Institute, Yale University School of Medicine, United States
- Swiss National Centre for Competence in Research Programme Chemical Biology, Switzerland
Figures
Figure 1 with 1 supplement
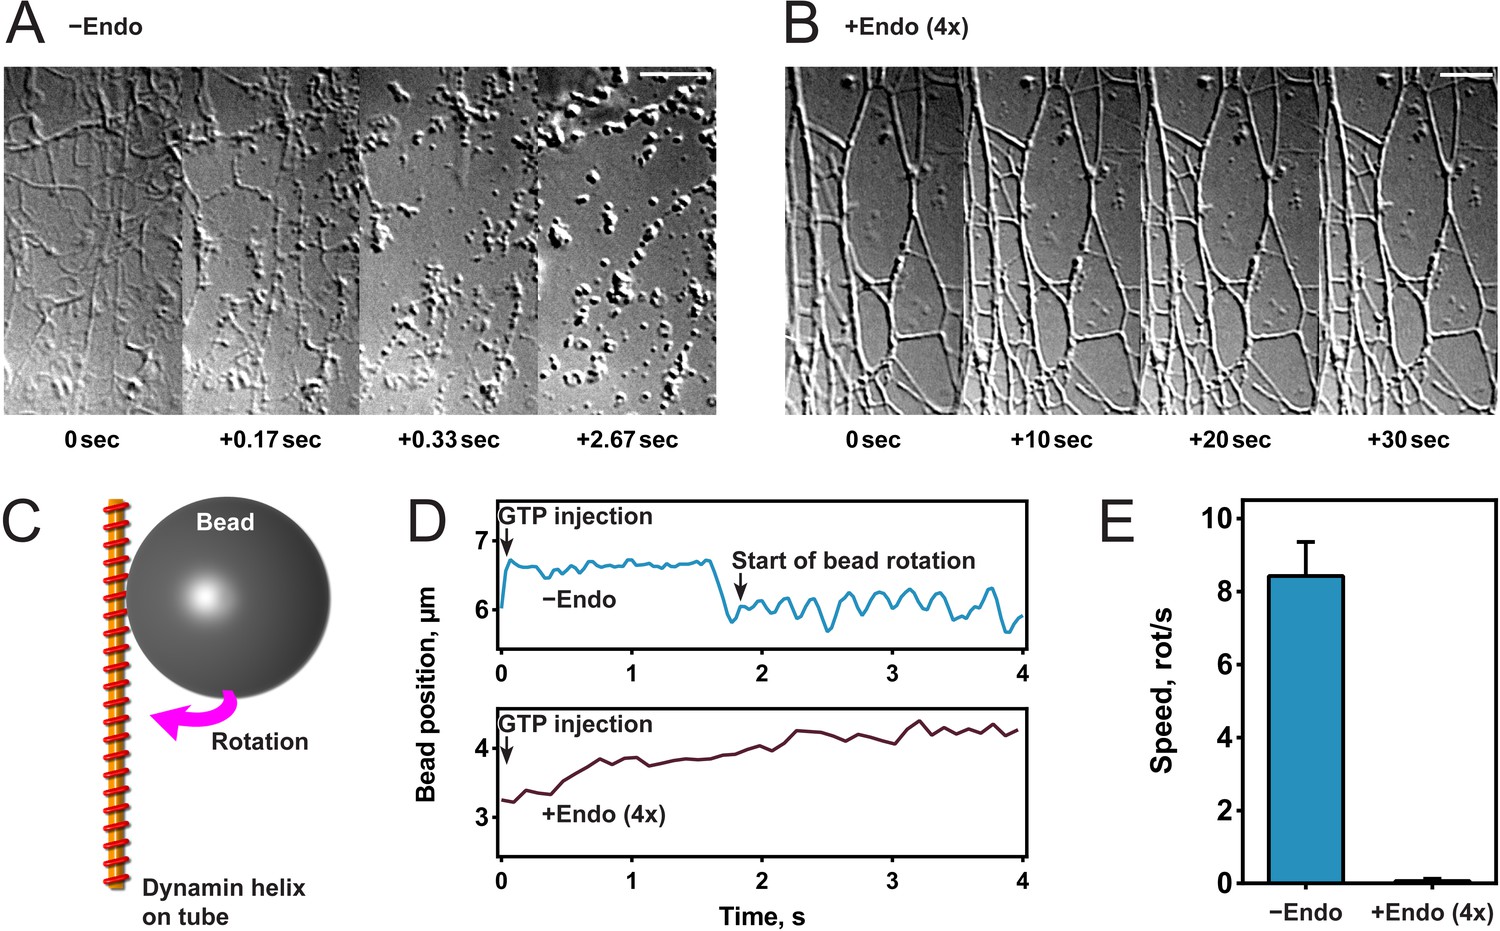
Endophilin inhibits dynamin-mediated constriction and fission.
(A, B) Visualization of tubule fission using membrane sheets assay. We injected GTP at t = 0 s on tubules generated by dynamin (A) or dynamin and endophilin (4x) (B). (C) Scheme of bead rotation assay. (D, E) Endophilin inhibits dynamin constriction, as the bead does not rotate in the presence of endophilin. Representative traces of the bead position relative to the tubule axis. Oscillations are caused by the bead rotating around the tubule (D), averaged maximal speeds (E). Error bars indicate standard deviation. Scale bars, 5 µm.
Figure 1—figure supplement 1
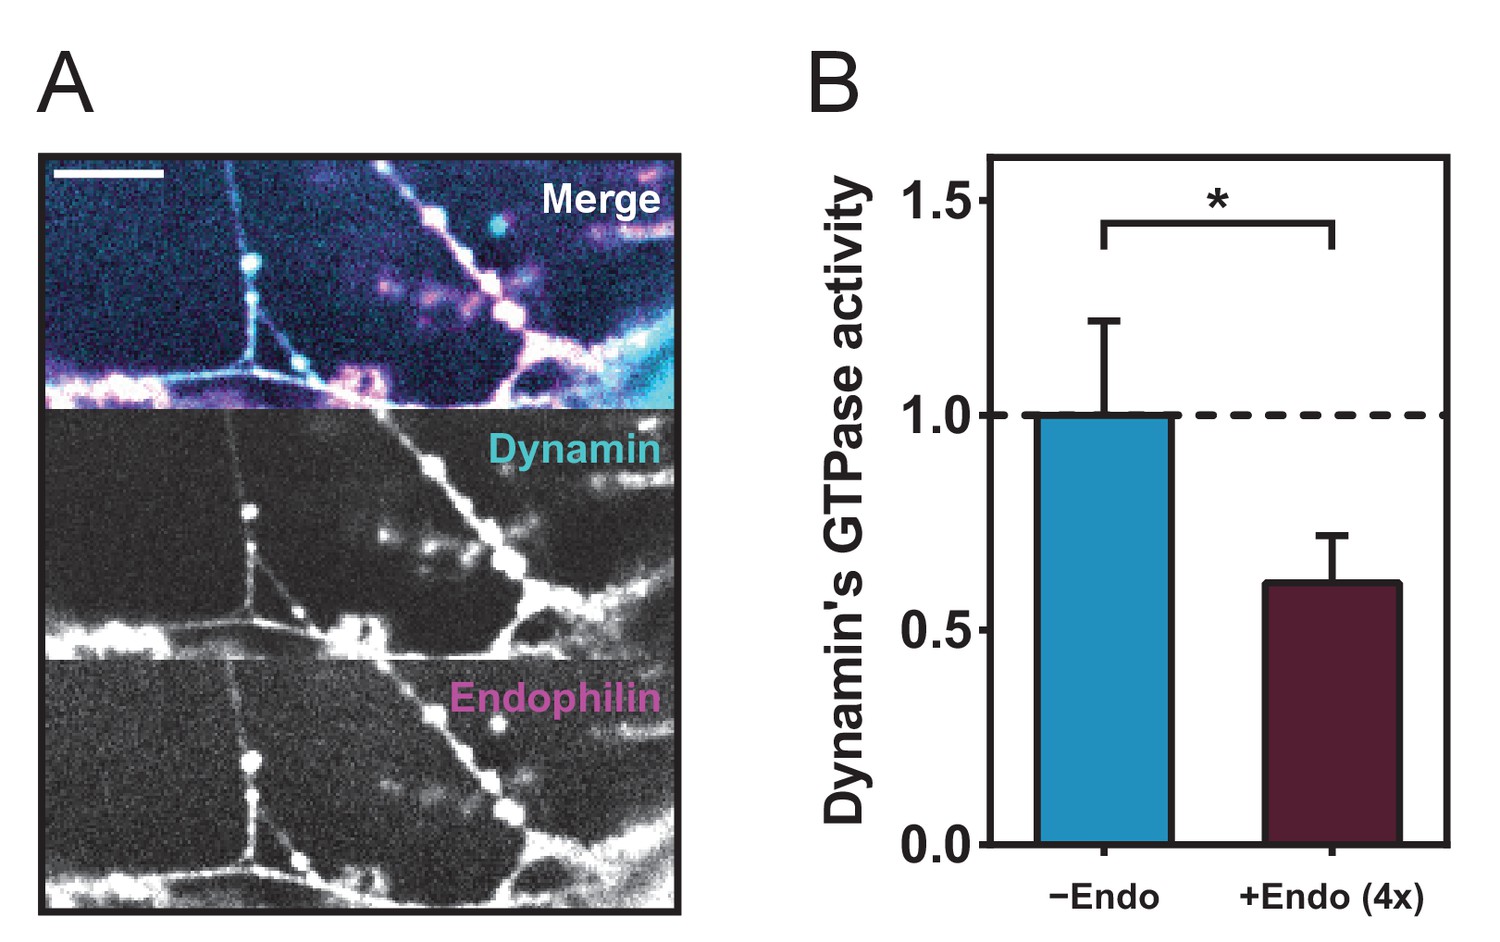
Colocalization of dynamin and endophilin and GTPase assay.
(A) Colocalization of endophilin ATTO 565 and dynamin ATTO 488 on tubules generated from membrane sheets. Bar, 5 microns (B) Malachite green GTPase assay, values are normalized to the positive control (dynamin+liposomes, see Materials and methods).
Figure 2 with 1 supplement
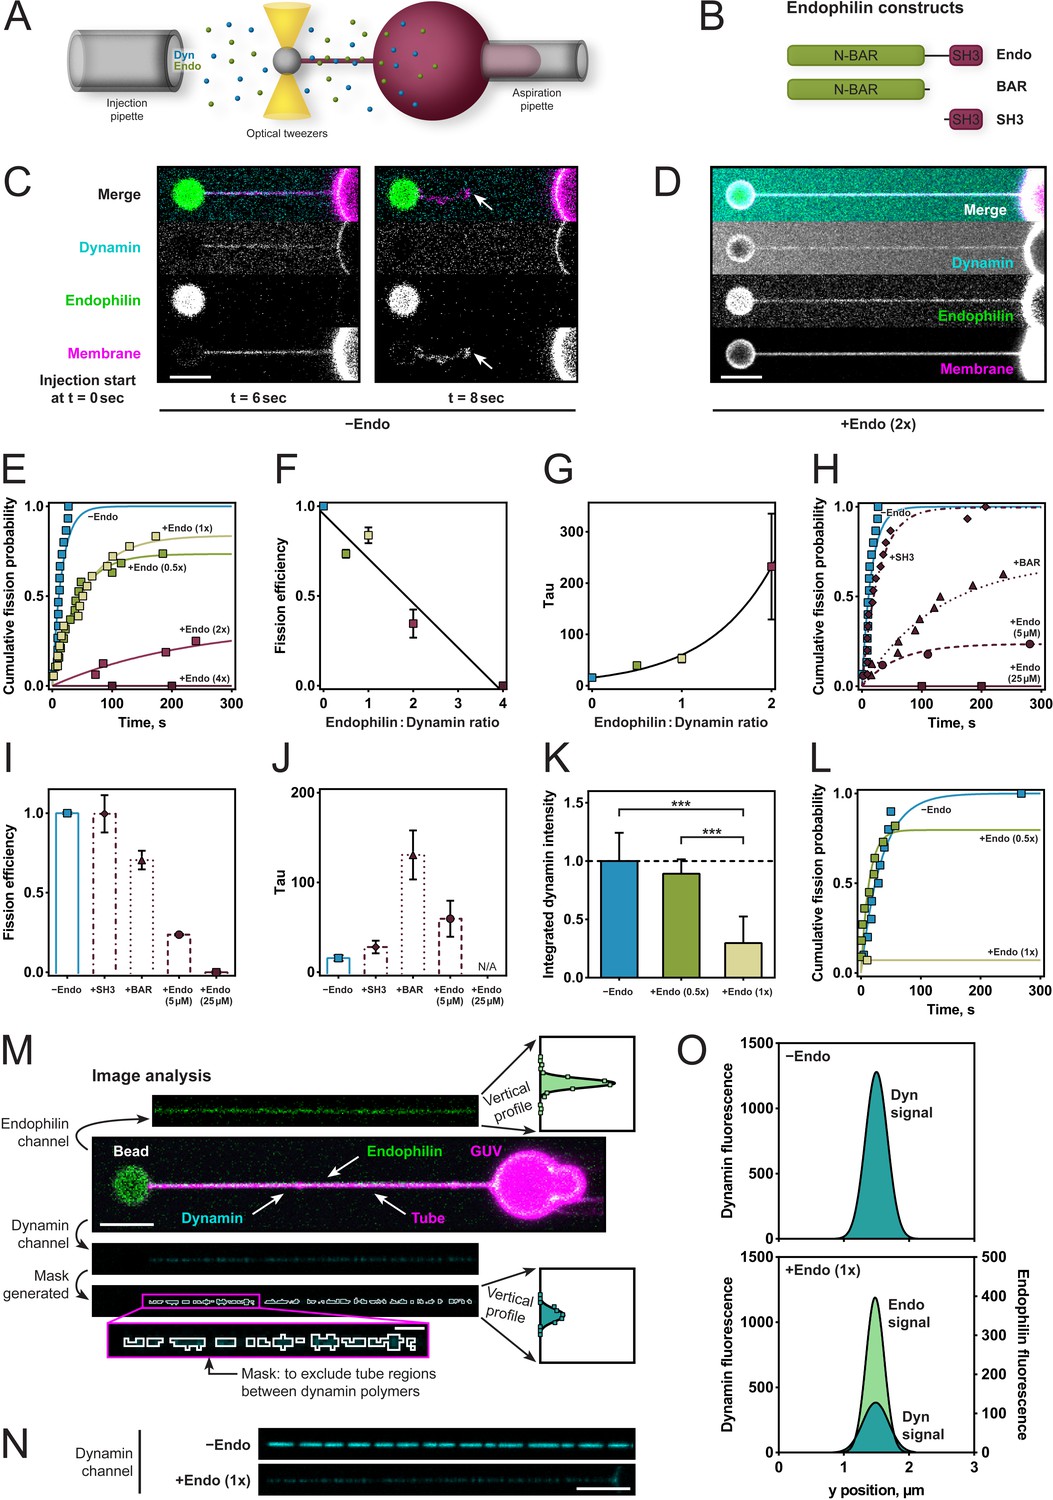
Endophilin reduces fission rate, fission efficiency and dynamin density.
(A) Tube pulling setup. A membrane tube is pulled from a GUV aspirated in a micropipette. Protein is injected using a second pipette. (B) Endophilin constructs used for the experiments. (C) Confocal images of tube after dynamin injection, as in setup (A). GUV is on the right, bead is on the left. (D) Confocal images of a tube after co-injection of endophilin (2x) dynamin (1x) and GTP. (E) Cumulative fission probability of tubes for various molar ratios of endophilin/dynamin, using 5 µM dynamin, 150 µM GTP. Lines: exponential fits to a*(1-exp(-t/τ)), n(−Endo)=15, n(+Endo (0.5x))=19, n(+Endo (1x))=18, n(+Endo (2x))=16, n(+Endo (4x))=15. Matlab code available in Source code file 1. (F) Fission efficiencies extracted from fits to data shown in (E). (G) Average fission time τ from fits to data shown in (E). (H) Cumulative fission probability for different endophilin constructs shown in (B) at 4x molar endophilin/dynamin ratio. n(+Endo (5 µM))=17, n(BAR)=16, n(SH3)=15. Lines: exponential fits to a*(1-exp(-t/ τ), Matlab code available in Source code file 1. (I) Fission efficiency extracted from fits to data shown in (H). (J) Average fission times τ extracted from fits to data shown in (H). Error bars in (F, G, I, J) indicate 95% confidence intervals of fits. (K–O) Decreased dynamin fluorescence density in co-complex with endophilin correlates with reduced fission efficiency. (K) Averaged dynamin fluorescence intensities for three different endophilin/dynamin ratios. The indicated values are calculated from integrals of the fluorescence peaks obtained following the image analysis explained in M. Source data are available in the Figure 2—source data 1. (L) Cumulative fission probability for the same tubes whose fluorescence was measured in (K). Matlab code available in Source code file 2. For (K–O), 150 µM GTP and 5 µM Dyn were used. (M) Image analysis of tubes coated with either dynamin alone or in co-complex with endophilin. From the dynamin image, a mask is generated (see magenta box), and a projection along the edge perpendicular to the tube axis is calculated (see vertical profiles). The intensity values shown in (K) are integrals of these vertical profiles. (N) Representative confocal images of dynamin fluorescence intensity signal for dynamin alone (−Endo) or in co-complex with endophilin (+Endo (1x)). (O) Vertical profiles obtained by image analysis shown in (M) of tubes shown in (N). Error bars in (K) indicate standard deviation. Scale bars are 5 µm, except in magenta box for (M), 1 µm.
-
Figure 2—source data 1
Dynamin fluorescence intensities for three different endophilin/dynamin ratios.
- https://doi.org/10.7554/eLife.26856.006
Figure 2—figure supplement 1
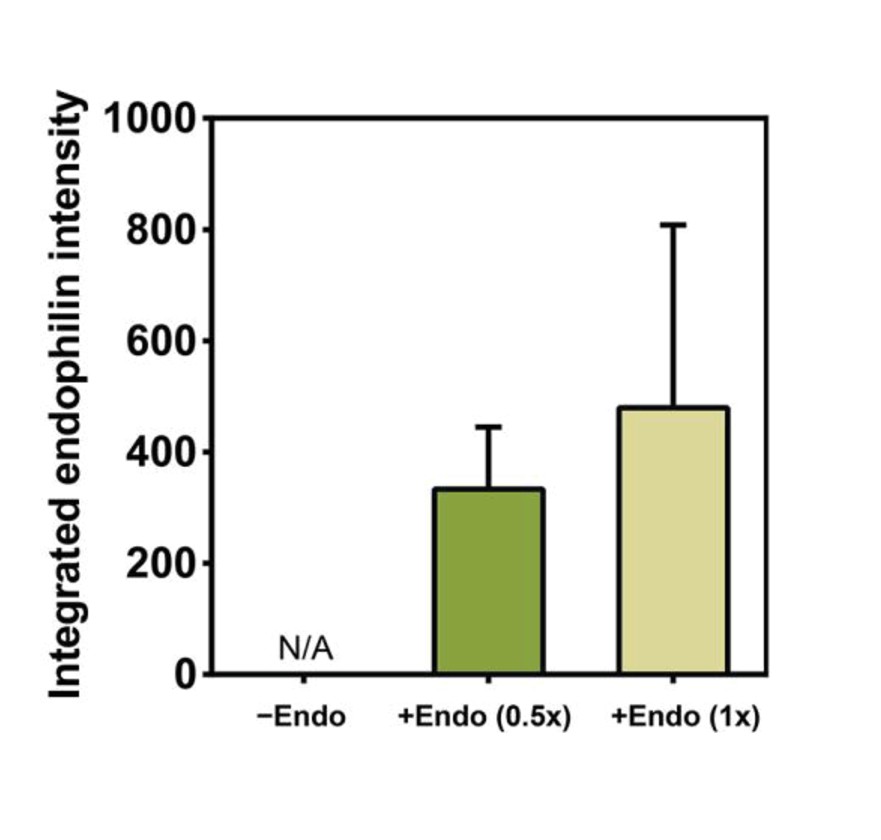
Endophilin intensity on tube increases with increased endophilin concentration in solution.
Quantification of endophilin signal intensity on the same tubes as those whose dynamin signal was measured for Figure 2K. The indicated values are raw integrals of the fluorescence peaks obtained by image analysis as shown in Figure 2M. n(−Endo)=10, n(+Endo 0.5x)=11, n(+Endo 1x)=14. Source data are available in the Figure 2—figure supplement 1—source data 1.
-
Figure 2—figure supplement 1—source data 1
Quantification of endophilin signal intensity on the same tubes as those whose dynamin signal was measured for Figure 2K.
- https://doi.org/10.7554/eLife.26856.007
Figure 3 with 1 supplement
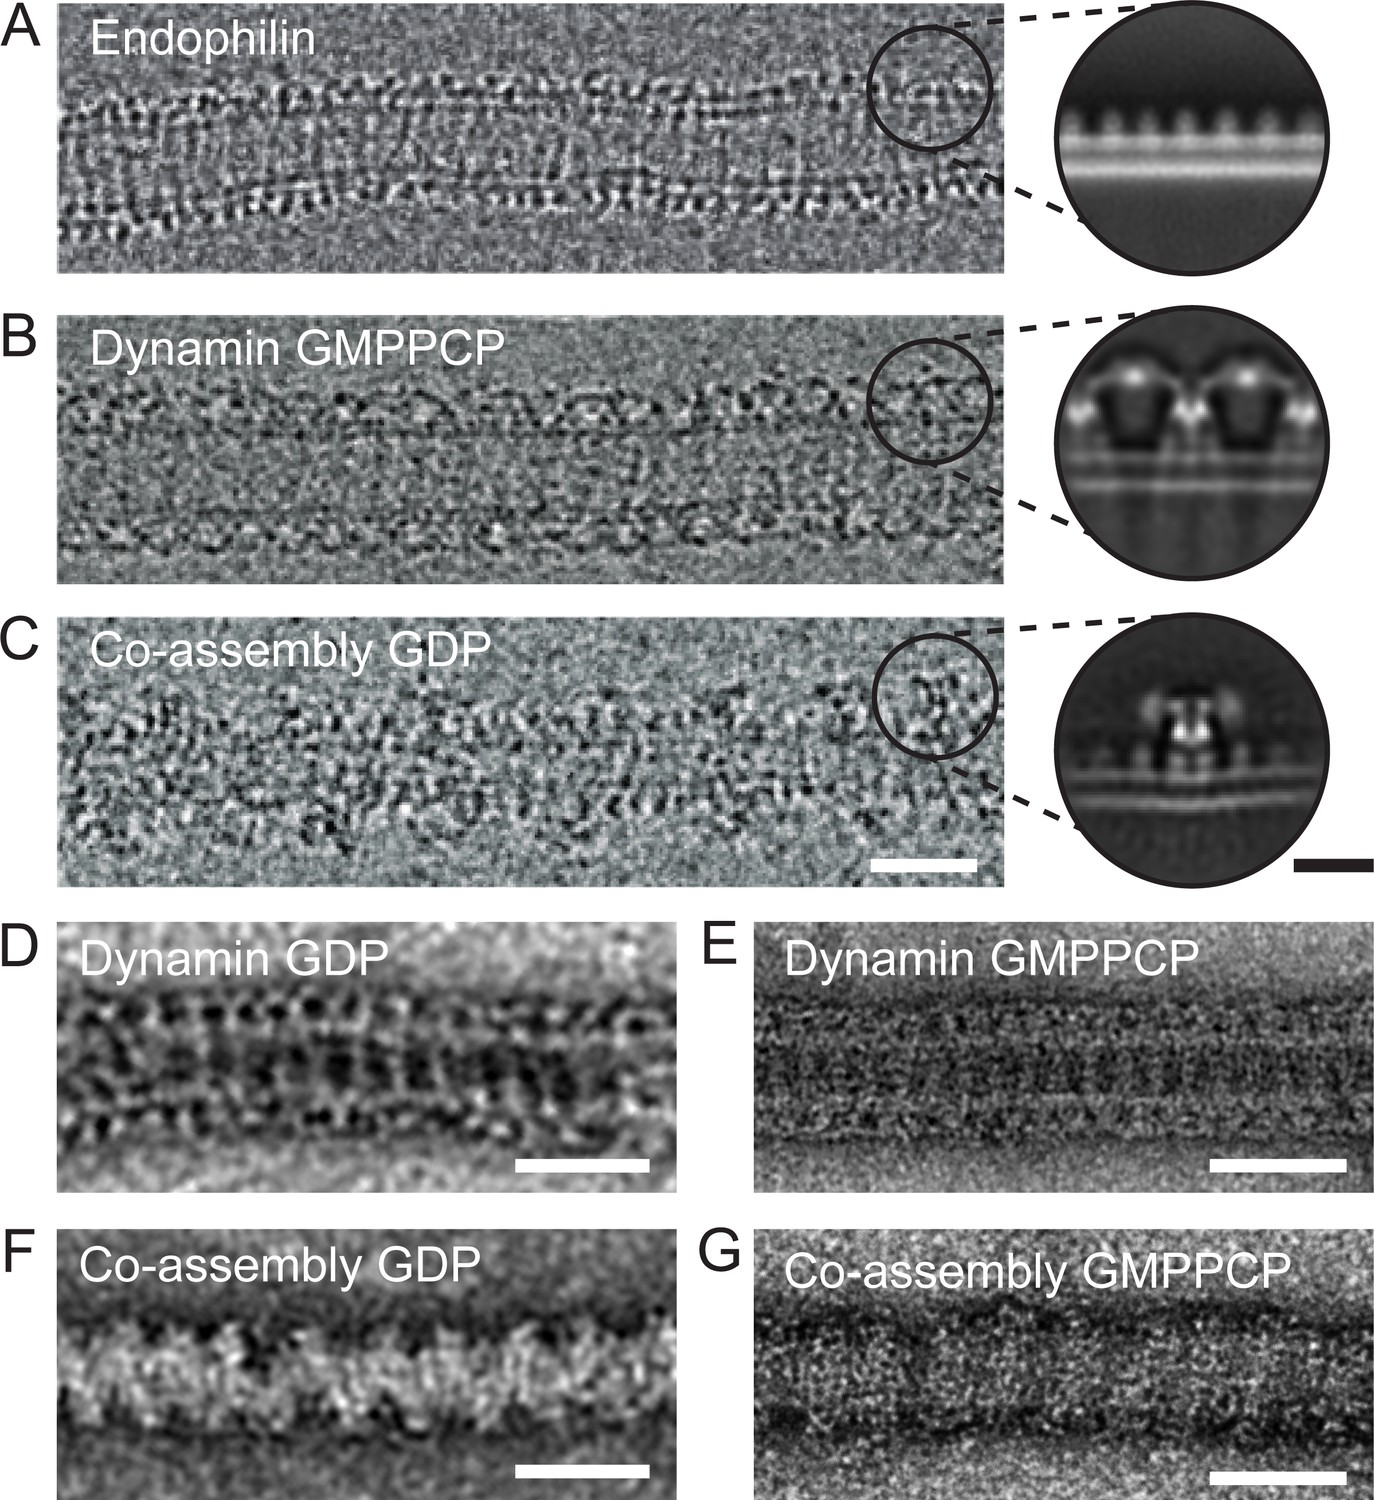
Endophilin can interleave between turns of a dynamin oligomer.
CryoEM of coated tubules of (A) endophilin alone (B) dynamin (GMPPCP) or (C) the endophilin-dynamin co-complex (GDP). Black circles on the cryoEM micrographs (A-C) delineate example particle coordinates that were picked to generate the cryoEM 2D class averages to the right. Negative stain micrographs of protein-coated tubules in GDP (D, F) and GMPPCP (E, G) nucleotide-bound states. (D-E) Dynamin only versus (F-G) endophilin-dynamin co-assembly. Black scale bar, 10 nm. White scale bars, 50 nm.
Figure 3—figure supplement 1
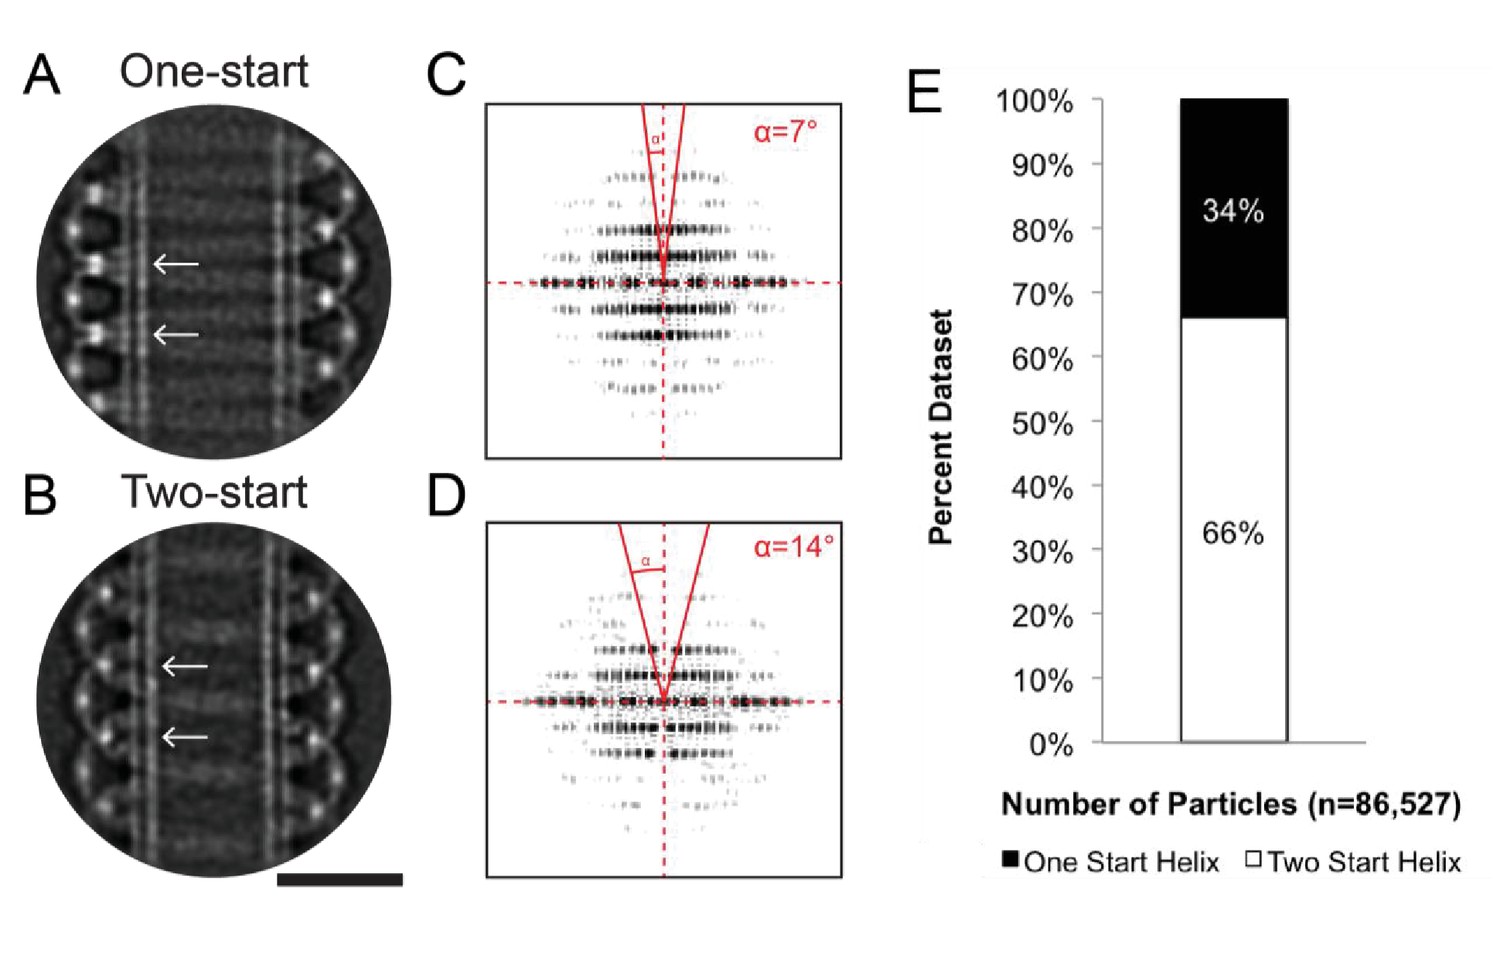
1-start and 2-start helices formed by Dynamin-1 with the non-hydrolyzable GTP analog GMPPCP.
(A) CryoEM 2D class average of a dynamin one-start helix, versus (B) a two-start start helix assembled around lipid tubules and in presence of GMPPCP. Stalk to stalk distances were ~13.9 nm and ~14.0 nm for the one-start and two-start dynamin helices, respectively (distances between white arrows in A and B). (C) Power spectrum of 2D class average of the dynamin one-start helix in A, versus (D) for the dynamin two-start helix in B. The solid red lines and angle α highlight the doubling of the pitch between A and B, according to d = p*cos(α) where p is the pitch, d is the perpendicular separation between diffraction planes, and α is the angle shown in C and D. (E) Percentages of all raw particles within that classified as one-start versus two-start helices. Bar, 25 nm.
Figure 4
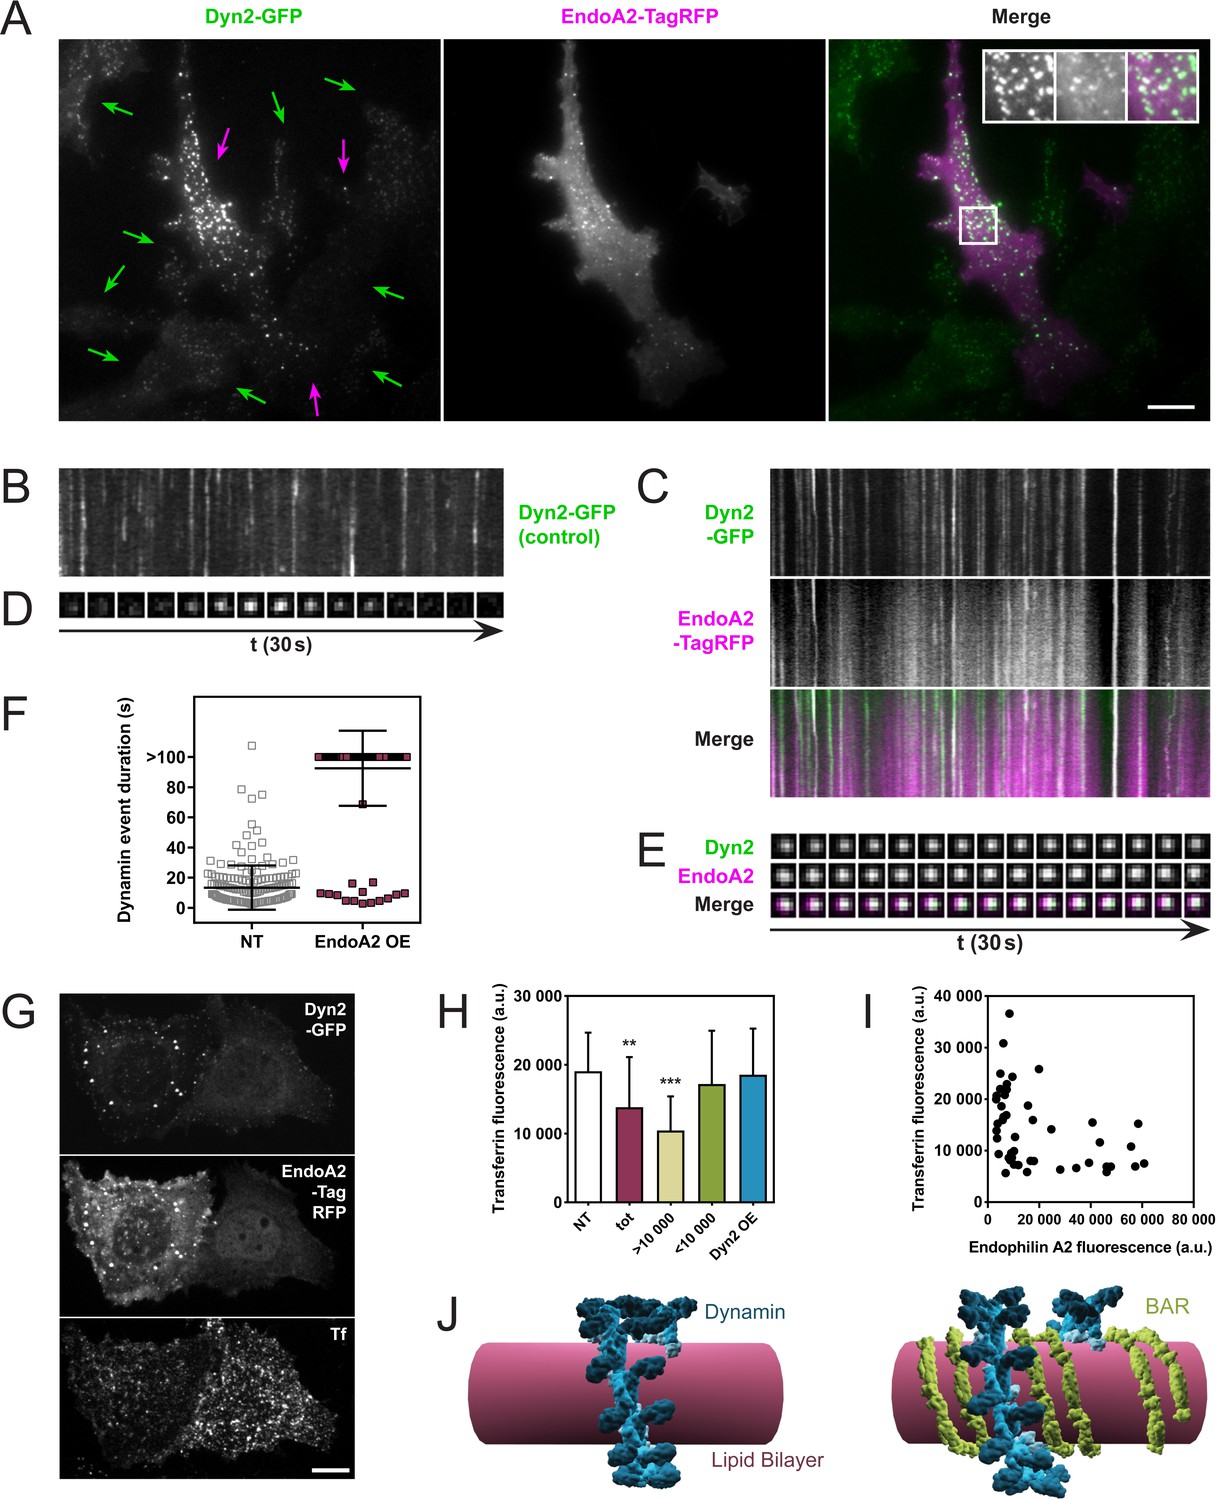
Endophilin overexpression blocks endocytic pits in vivo.
(A) TIRFM images of genome-edited SK-MEL-2 cells overexpressing endophilinA2-TagRFP. Purple arrows, transfected cells; green arrows, non-transfected cells. Inset: Magnification of white box; left, Dyn2-GFP signal; middle, EndoA2-TagRFP signal; right, merge. (B, C) Kymographs of dynamin2-GFP foci from non-transfected and transfected cells (respectively) show delayed kinetics of dynamin foci in cells overexpressing endophilinA2-TagRFP. Length of kymographs, 100 s. (D, E) Montage of representative dynamin foci from non-transfected and transfected cells (respectively). (F) Distribution of dynamin event durations for non-transfected (NT) and endophilinA2-TagRFP overexpressing cells. N(NT)=184, n(EndoA2 OE)=177. Source data are available in the Figure 4—source data 1. (G) Confocal images of SK-MEL-2 cells expressing different levels of endophilinA2-TagRFP. (H) Quantification of transferrin fluorescence in non-transfected cells (NT), cells overexpressing endophilinA2-TagRFP (tot), cells with high (>10 000) and low (<10 000) endophilinA2-TagRFP levels, and cells co-overexpressing dynamin2 and endophilinA2-GFP (Dyn2 OE). n > 20 for all conditions. Source data are available in the Figure 4—source data 2. (I) Plot of transferrin fluorescence signal vs. endophilinA2-TagRFP fluorescence from the tot condition in (H). (J) Model for inhibition of dynamin constriction by BAR domain proteins. G domains (dark blue) of adjacent dynamin rings interact and drive conformational changes to constrict the underlying membrane tube. When BAR proteins such as endophilin (green) are present between the dynamin rings, the G domains of dynamin cannot interact anymore. Therefore, constriction and following fission are inhibited. Scale bars, 10 µm.
-
Figure 4—source data 1
Dynamin event durations for non-transfected (NT) and endophilinA2-TagRFP overexpressing cells.
- https://doi.org/10.7554/eLife.26856.011
-
Figure 4—source data 2
Quantification of transferrin fluorescence in non-transfected cells, cells overexpressing endophilinA2-TagRFP, cells with high (>10,000) and low (<10,000) endophilinA2-TagRFP levels, and cells co-overexpressing dynamin2 and endophilinA2-GFP.
- https://doi.org/10.7554/eLife.26856.012
Tables
Table 1
Data collection parameters
https://doi.org/10.7554/eLife.26856.013| Dataset | Endophilin | Dynamin GMPPCP | Co-complex GDP |
|---|---|---|---|
| Microscope | TF30 Polara | TF30 Polara | TF30 Polara |
| Detector | K2 Summit | K2 Summit | K2 Summit |
| Collection | UCSFimage4 | SerialEM | SerialEM |
| Pixel size (Å) | 1.22 | 2.49 | 1.22 |
| Exposure (sec) | 6.0 | 8.0 | 8.0 |
| Total Dose (e-/Å2) | 40 | 20 | 40 |
| Micrographs | 204 | 2006 | 1660 |
| Motion Correction | MotionCorr | MotionCor2 | MotionCor2 |
| Defocus Range (μm) | 0.6–2.6 | 0.3–5.0 | 0.8–2.8 |
| Particles contributing to class averages in Figure 3 | 2047 | 2766 | 19,662 |
Additional files
-
Source code file 1
Matlab code for fitting of cumulative fission probability data for Figure 2E and H.
The code determines the variables a and τ based on the experimental data, for a fit to a*(1-exp(-t/τ)).
- https://doi.org/10.7554/eLife.26856.014
-
Source code file 2
Matlab code for fitting of cumulative fission probability data for Figure 2L.
The code determines the variables a and τ based on the experimental data, for a fit to a*(1-exp(-t/τ)).
- https://doi.org/10.7554/eLife.26856.015
-
Transparent reporting form
- https://doi.org/10.7554/eLife.26856.016
Download links
A two-part list of links to download the article, or parts of the article, in various formats.
Downloads (link to download the article as PDF)
Open citations (links to open the citations from this article in various online reference manager services)
Cite this article (links to download the citations from this article in formats compatible with various reference manager tools)
Structural inhibition of dynamin-mediated membrane fission by endophilin
eLife 6:e26856.
https://doi.org/10.7554/eLife.26856


