USP5/Leon deubiquitinase confines postsynaptic growth by maintaining ubiquitin homeostasis through Ubiquilin
- Institute of Molecular Biology, Academia Sinica, Taiwan
- National Yang Ming University, Taiwan
- Chang Gung University, Taiwan
Figures
Figure 1 with 1 supplement
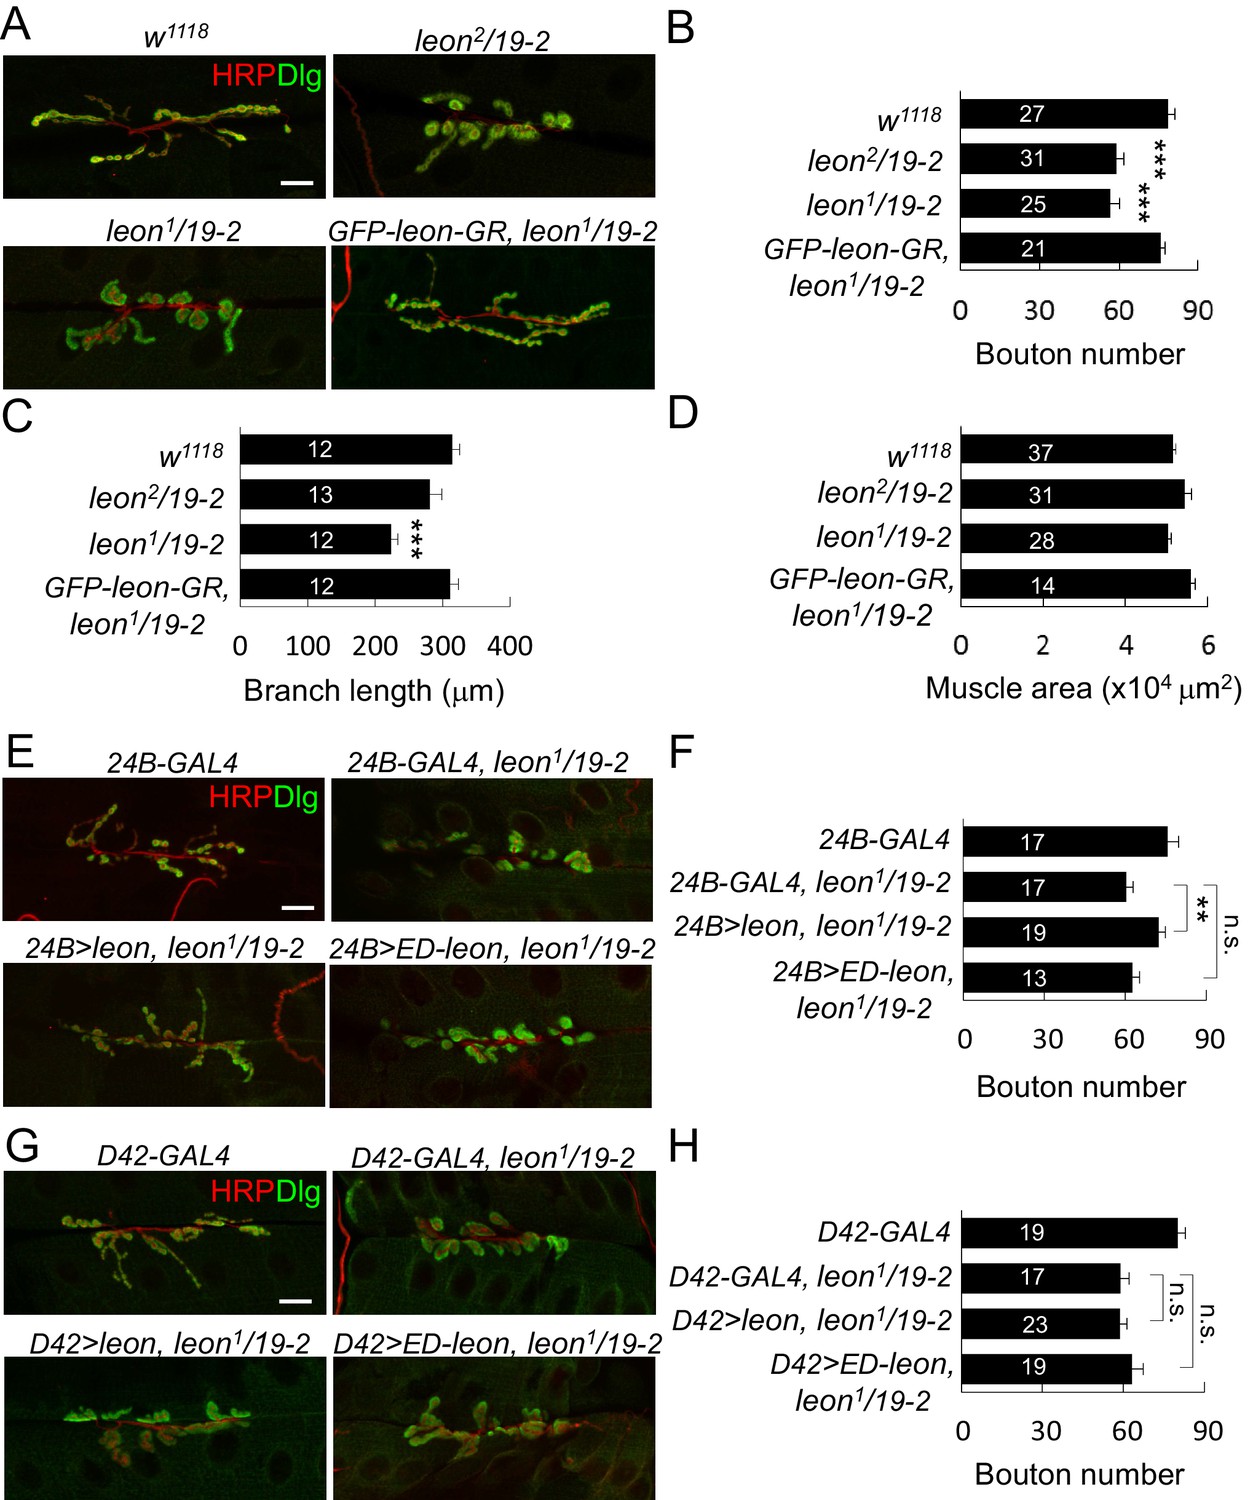
leon mutants display abnormal NMJ morphology.
(A) Immunostaining images show NMJs of w1118, leon2/19-2, leon1/19-2 and GFP-leon-GR, leon1/19-2 for HRP (red) and Dlg (green). (B–D) Bar graphs show means ± SEM (standard error of mean) of bouton numbers (B), branch lengths (C) and muscle areas (D, quantified by phalloidin staining, not shown). (E and G) Immunostaining images co-stained by HRP (red) and Dlg (green) show transgene rescue of leon1/19-2 NMJs by UAS-leon or UAS-ED-leon driven by postsynaptic 24B-GAL4 (E) or presynaptic D42-GAL4 (G). (F and H) Bar graphs show means ± SEM of bouton numbers in postsynaptic or presynaptic rescue. Scale bars, 20 μm. All data were compared to controls unless specifically indicated by brackets, with n.s. indicating no significance, * for p<0.05, and *** for p<0.001 according to Student’s t tests. The detail statistic numbers also see Supplementary file 1.
Figure 1—figure supplement 1
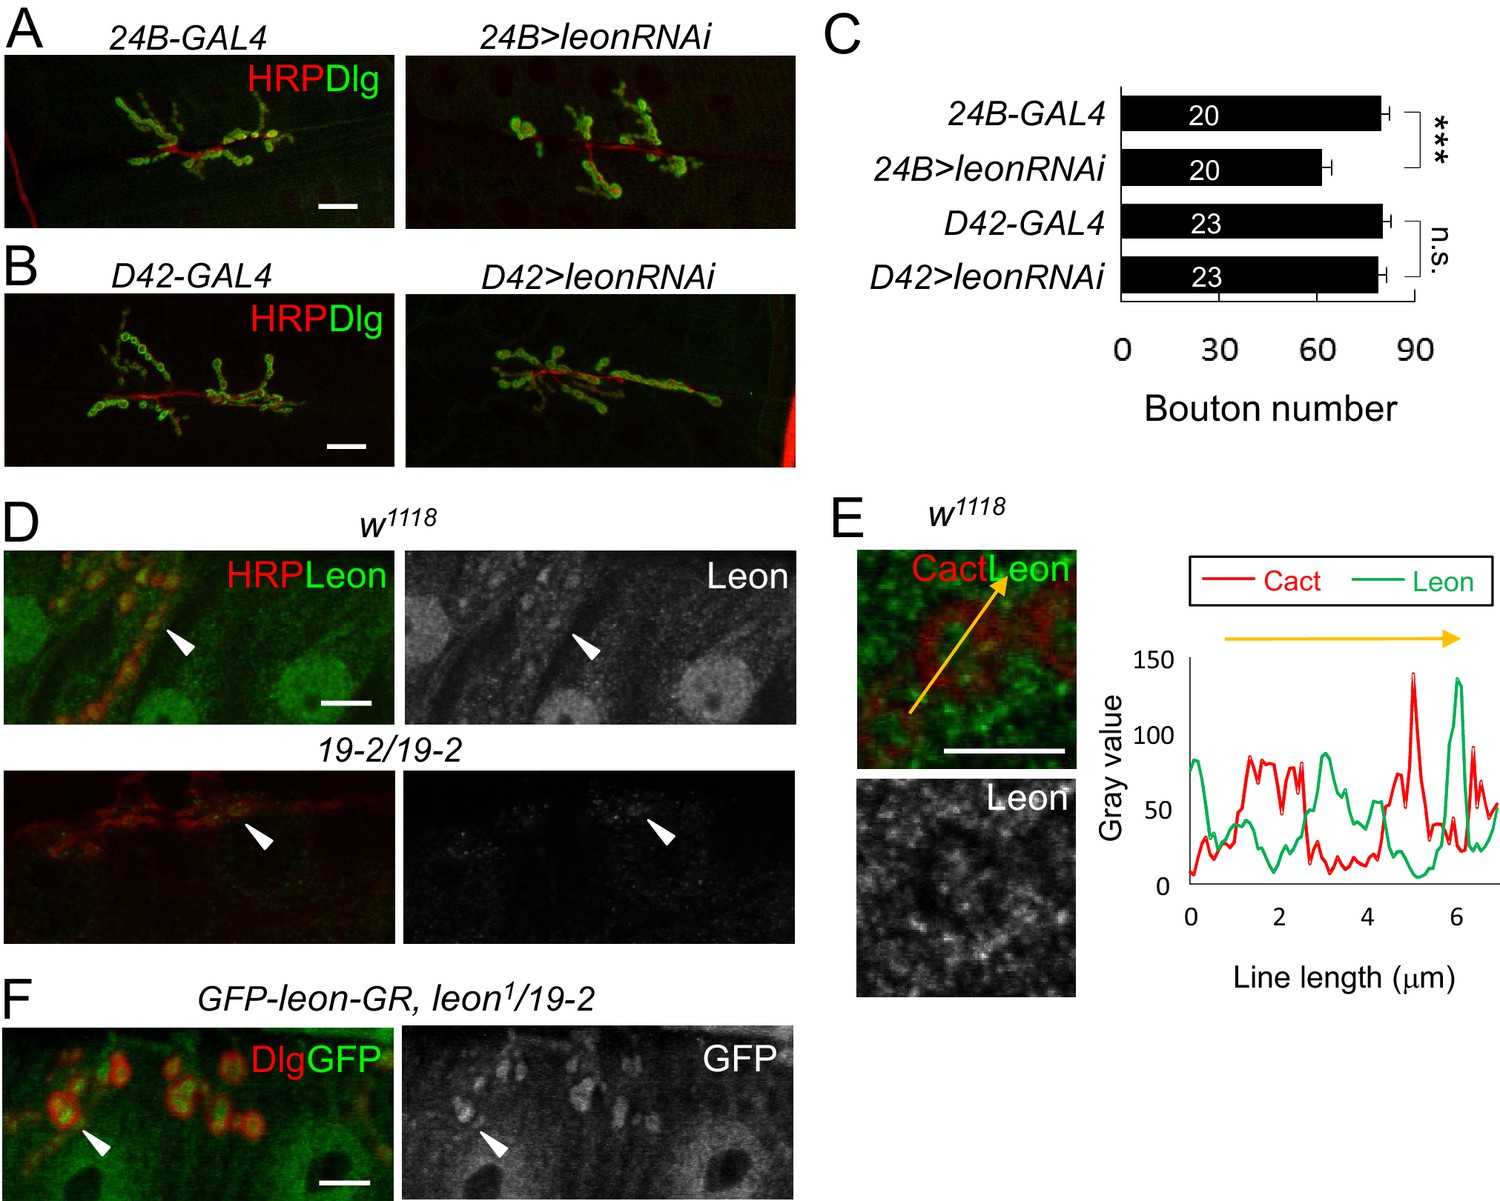
Postsynaptic leon in NMJ morphology and Leon expression pattern.
(A,B) Immunostaining images co-stained by HRP (red) and Dlg (green) show bouton number reduction in UAS-leonRNAi driven by postsynaptic 24B-GAL4 (A), but not by presynaptic D42-GAL4 (B). Scale bars, 20 μm. (C) Bar graphs show means ± SEM of bouton number in 24B-GAL4, 24B>leonRNAi, D42-GAL4, and D42>leonRNAi. Pairwise comparisons are shown by brackets with n.s. indicating no significance and *** for p<0.001 according to Student’s t tests. The detail statistic numbers also see Supplementary file 1. (D) Immunostaining images of NMJs for Leon (green) and HRP (red) show that Leon is expressed in muscles and NMJs (arrowhead) of w1118, and Leon signals are largely diminished in 19-2/19-2. The single Leon images (right panels) are also shown. Scale bar, 10 μm. (E) Enlarged images show expressions of Leon (green) and Cact (red), or Leon only (bottom), in a single bouton. Scale bar, 5 μm. The orange-colored arrow crossing the bouton was quantified for the intensities (gray value) of Cact and Leon (right panel). (F) Immunostaining images of NMJs for GFP (green) and Dlg (red) show expressions of GFP-leon-GR in leon1/19-2, similar to endogenous Leon expression. The single GFP image (right) is also shown. Scale bar, 10 μm.
Figure 2
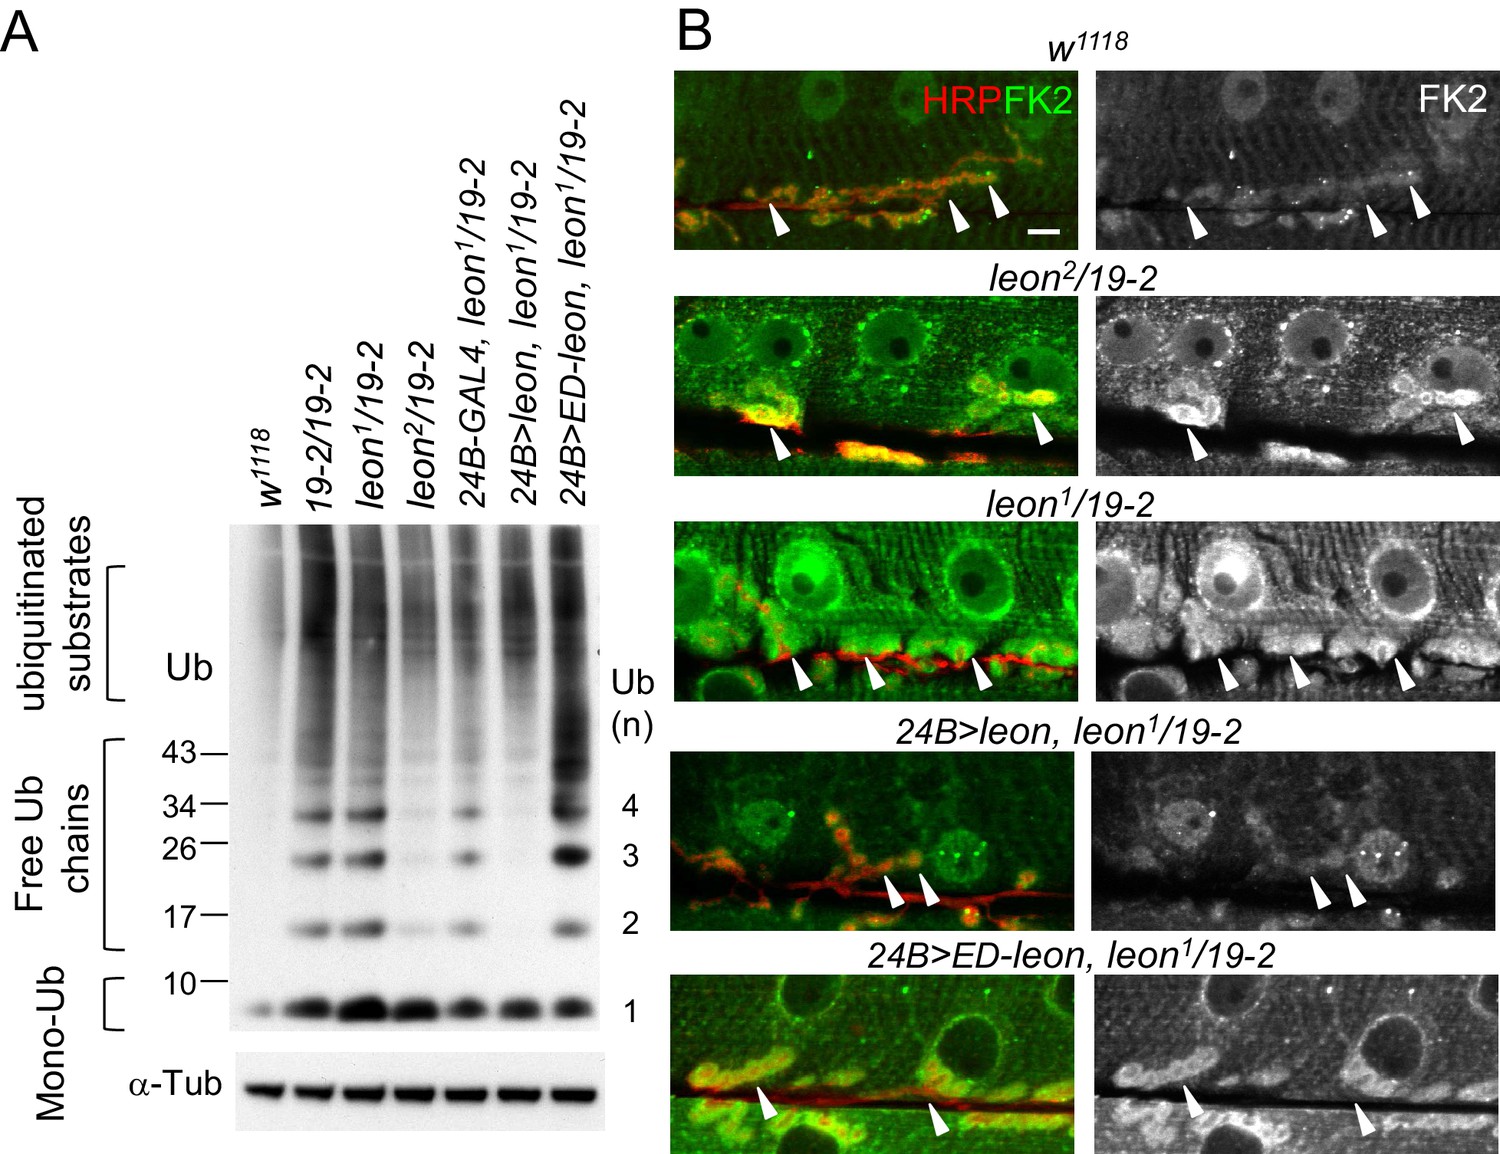
Defective ubiquitin homeostasis in leon mutants.
(A) Western blot probed with ubiquitin (Ub) antibodies shows ubiquitin expression patterns in w1118, 19-2/19-2, leon1/19-2, leon2/19-2, and postsynaptic expression of UAS-leon or UAS-ED-leon driven by 24B-GAL4 in leon1/19-2. α-Tub as control. (B) Images show FK2 (green) and HRP (red) immunostaining of NMJs in w1118, leon2/19-2 and leon1/19-2, and postsynaptic expression of UAS-leon or UAS-ED-leon driven by 24B-GAL4 in leon1/19-2. The single FK2 images (right) are also shown. Arrowheads indicate synaptic regions. Scale bar, 10 μm.
Figure 3 with 4 supplements
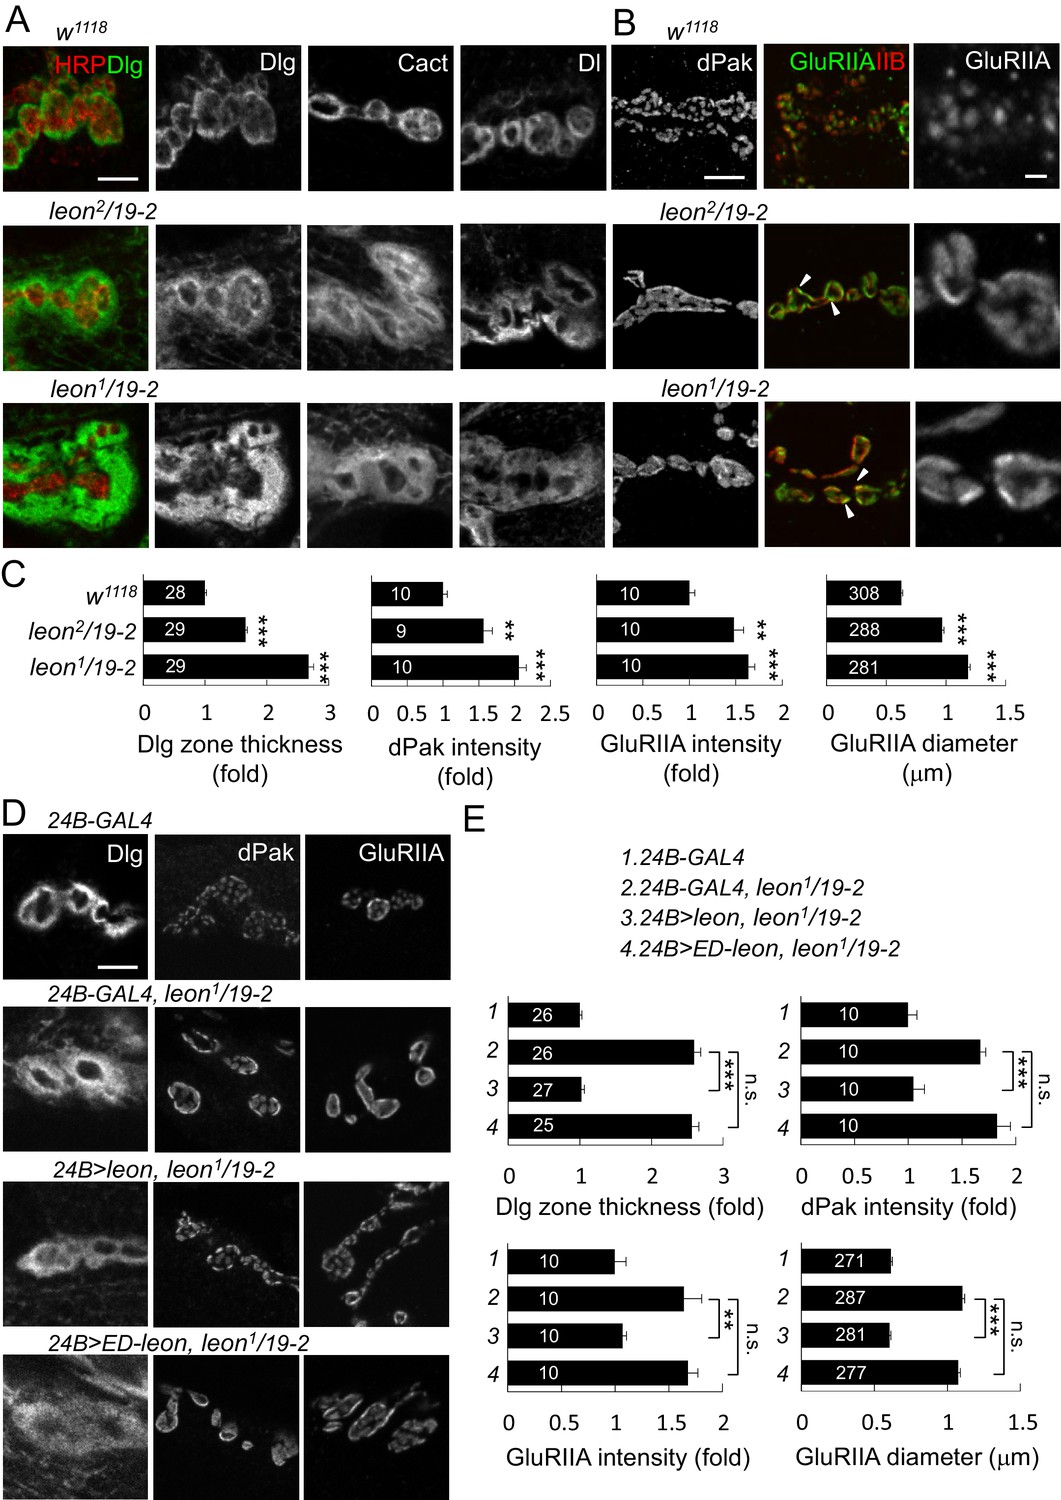
Expansion of SSR- and PSD-localized proteins at leon NMJs.
(A) Images show SSR-localized proteins Dlg, Cact and Dl in immunostaining of boutons in w1118, leon2/19-2 and leon1/19-2. Co-staining of Dlg (green) and HRP (red) is shown (left panels). (B) Images show PSD-localized dPak, GluRIIA and GluRIIB immunostaining at synapses of w1118, leon2/19-2 and leon1/19-2. Arrowheads indicate overlapping signals of expanded GluRIIA (green) and GluRIIB (red) clusters in middle panels. GluRIIA images are shown with magnification (right panels). (C) Bar graphs show means ± SEM of Dlg-positive zone thickness, dPak intensity and GluRIIA intensity and diameter in w1118, leon2/19-2 and leon1/19-2. (D) Images show Dlg, dPak and GluRIIA immunostaining at NMJs, with postsynaptic 24B-GAL4-driven UAS-leon or UAS-ED-leon expression in leon1/19-2. (E) Bar graphs show means ± SEM of Dlg-positive zone thickness, dPak intensity and GluRIIA intensity and diameter. All scale bars represent 5 μm except in magnified GluRIIA images, which is 1 μm. All data were compared to controls unless specifically indicated by brackets with n.s. indicating no significance, ** for p<0.01 and *** for p<0.001 according to Student’s t tests. The detail statistic numbers also see Supplementary file 1.
Figure 3—figure supplement 1
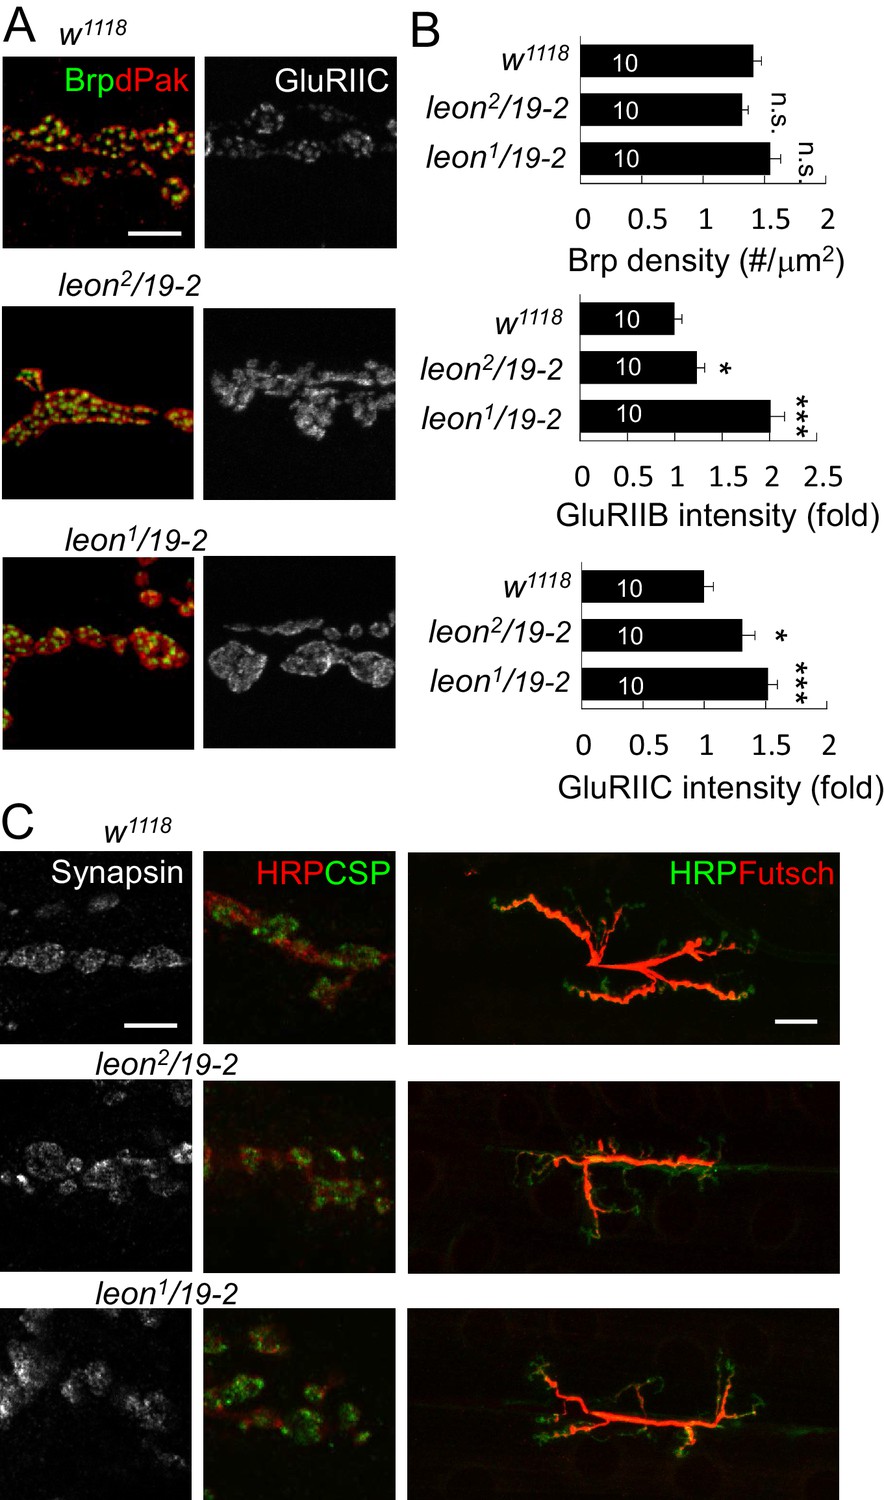
Localization of presynaptic proteins and expansion of GluRIIC clusters at leon NMJs.
(A) Images show immunostaining for Brp (green) and dPak (red), and GluRIIC (right panels) at NMJs of w1118, leon2/19-2 and leon1/19-2. Scale bar, 5 μm. (B) Bar graphs show means ± SEM of Brp density, GluRIIB intensity and GluRIIC intensity. All data were compared to controls with n.s. indicating no significance, * for p<0.05 and *** for p<0.001 according to Student’s t tests. The detail statistic numbers also see Supplementary file 1. (C) Images show NMJ immunostaining for presynaptic proteins Synapsin (left), CSP and HRP (green and red, respectively, at middle), and Futsch and HRP (red and green, respectively, at right) in w1118, leon2/19-2 and leon1/19-2. Scale bar, 5 μm (left) and 20 μm (right).
Figure 3—figure supplement 2
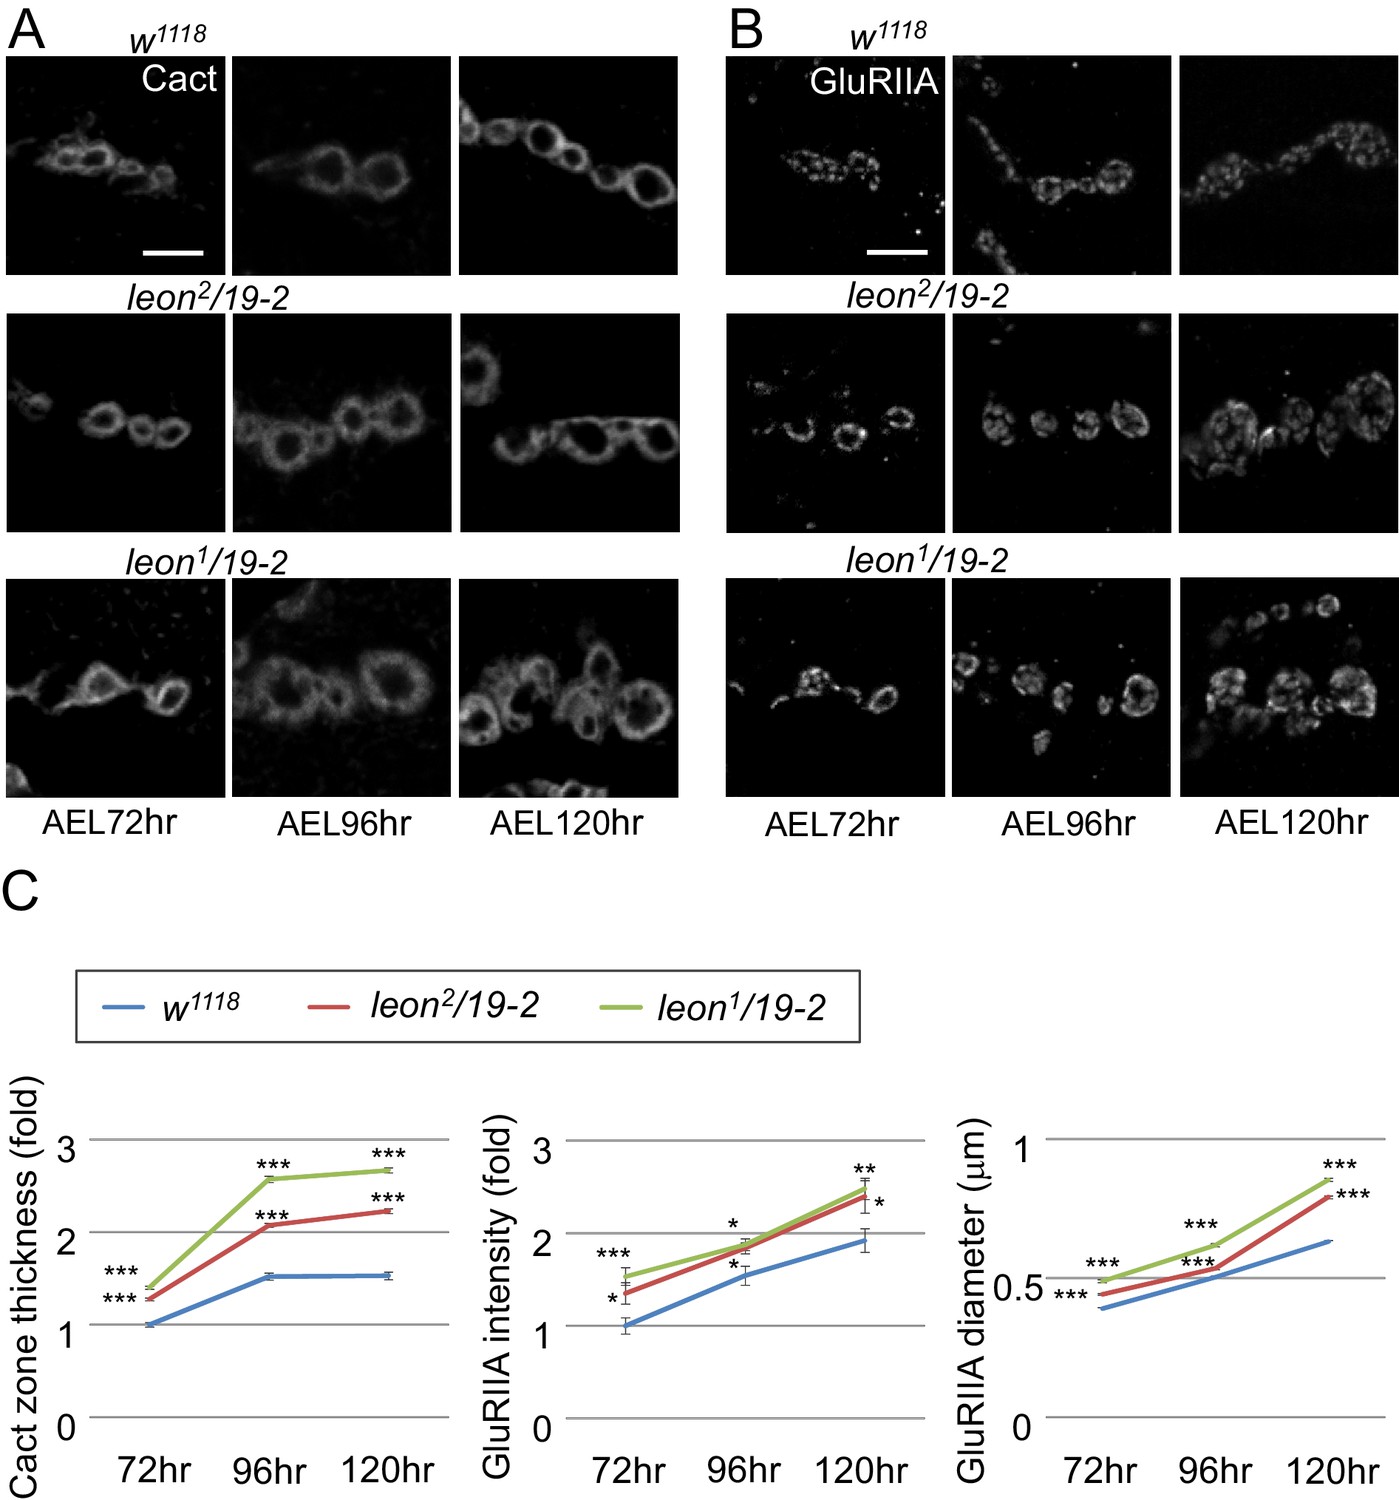
Postsynaptic defects of leon mutants in earlier larval stages.
(A and B) Images show Cact and GluRIIA immunostaining of NMJs in w1118, leon2/19-2 and leon1/19-2 at 72, 96 and 120 hr AEL. (C) Line graphs show means ± SEM of Cact-positive zone thickness and GluRIIA intensity and diameter at 72, 96 and 120 hr AEL. All data were compared to controls with * for p<0.05, ** for p<0.01, *** for p<0.001 according to Student’s t tests. The detail statistic numbers also see Supplementary file 1.
Figure 3—figure supplement 3
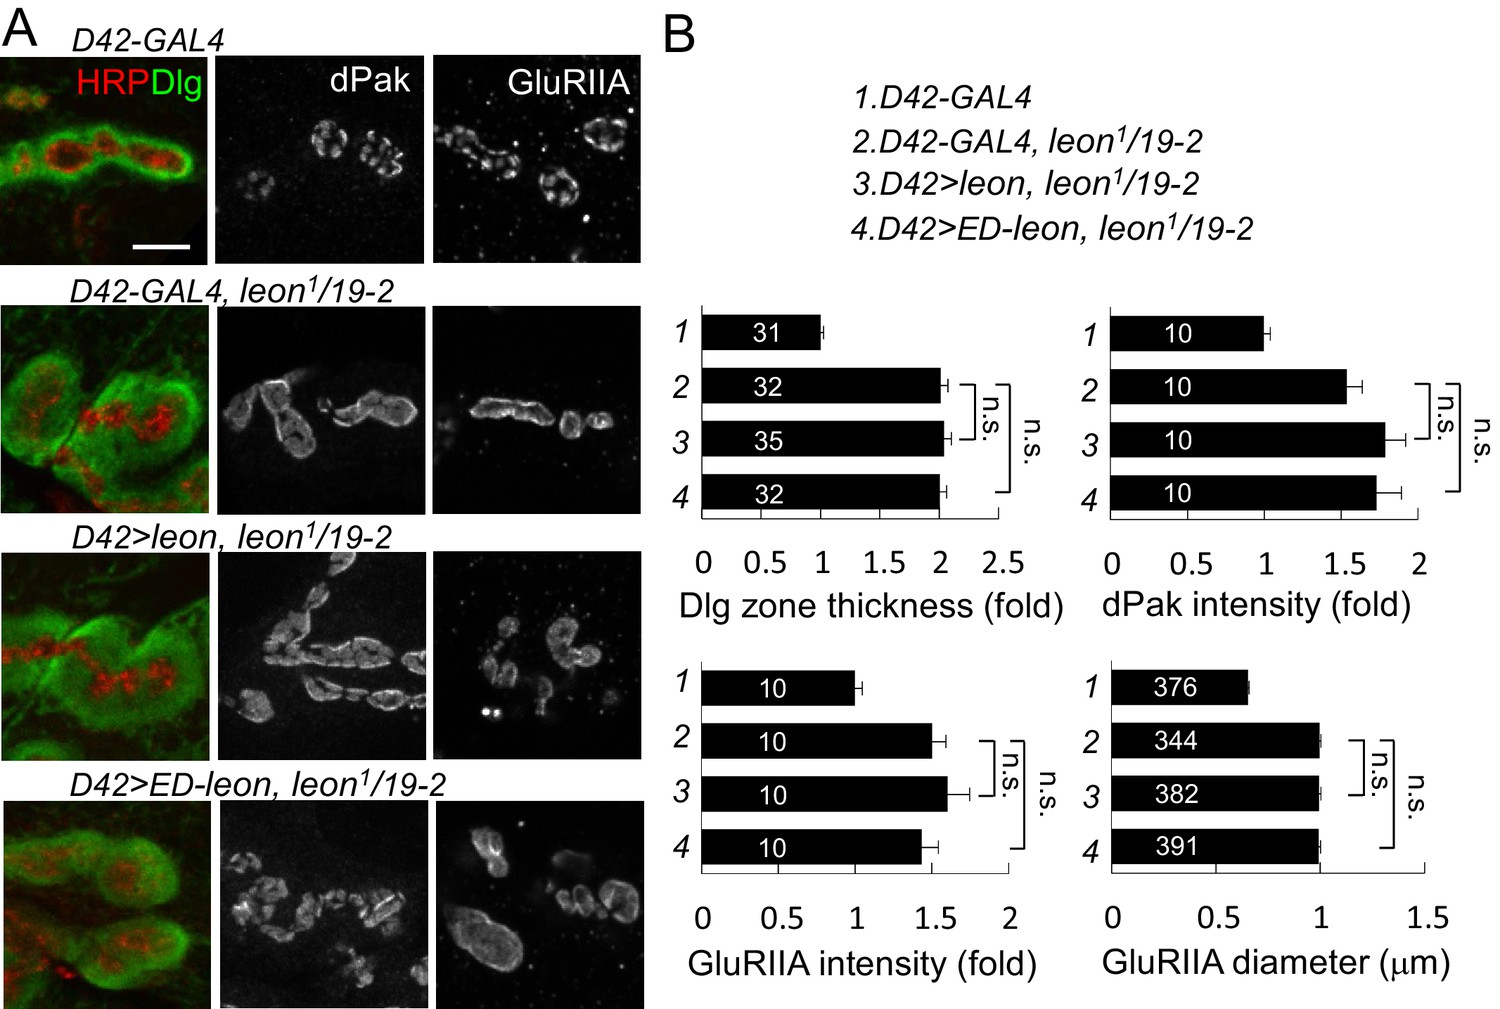
Presynaptic leon is not required for postsynaptic formation.
(A) Images show immunostaining for Dlg (green, co-stained with HRP in red), dPak, and GluRIIA in presynaptic D42-GAL4-driven UAS-leon or UAS-ED-leon expression that failed to suppress Dlg, dPak and GluRIIA expansion in leon1/19-2. Scale bar, 5 μm. (B) Bar graphs show means ± SEM of Dlg-positive zone thickness, dPak intensity and GluRIIA intensity and diameter. No rescue effect was shown by n.s. (no significance) when compared to D42-GAL4, leon1/19-2 according to Student’s t tests. The detail statistic numbers also see Supplementary file 1.
Figure 3—figure supplement 4
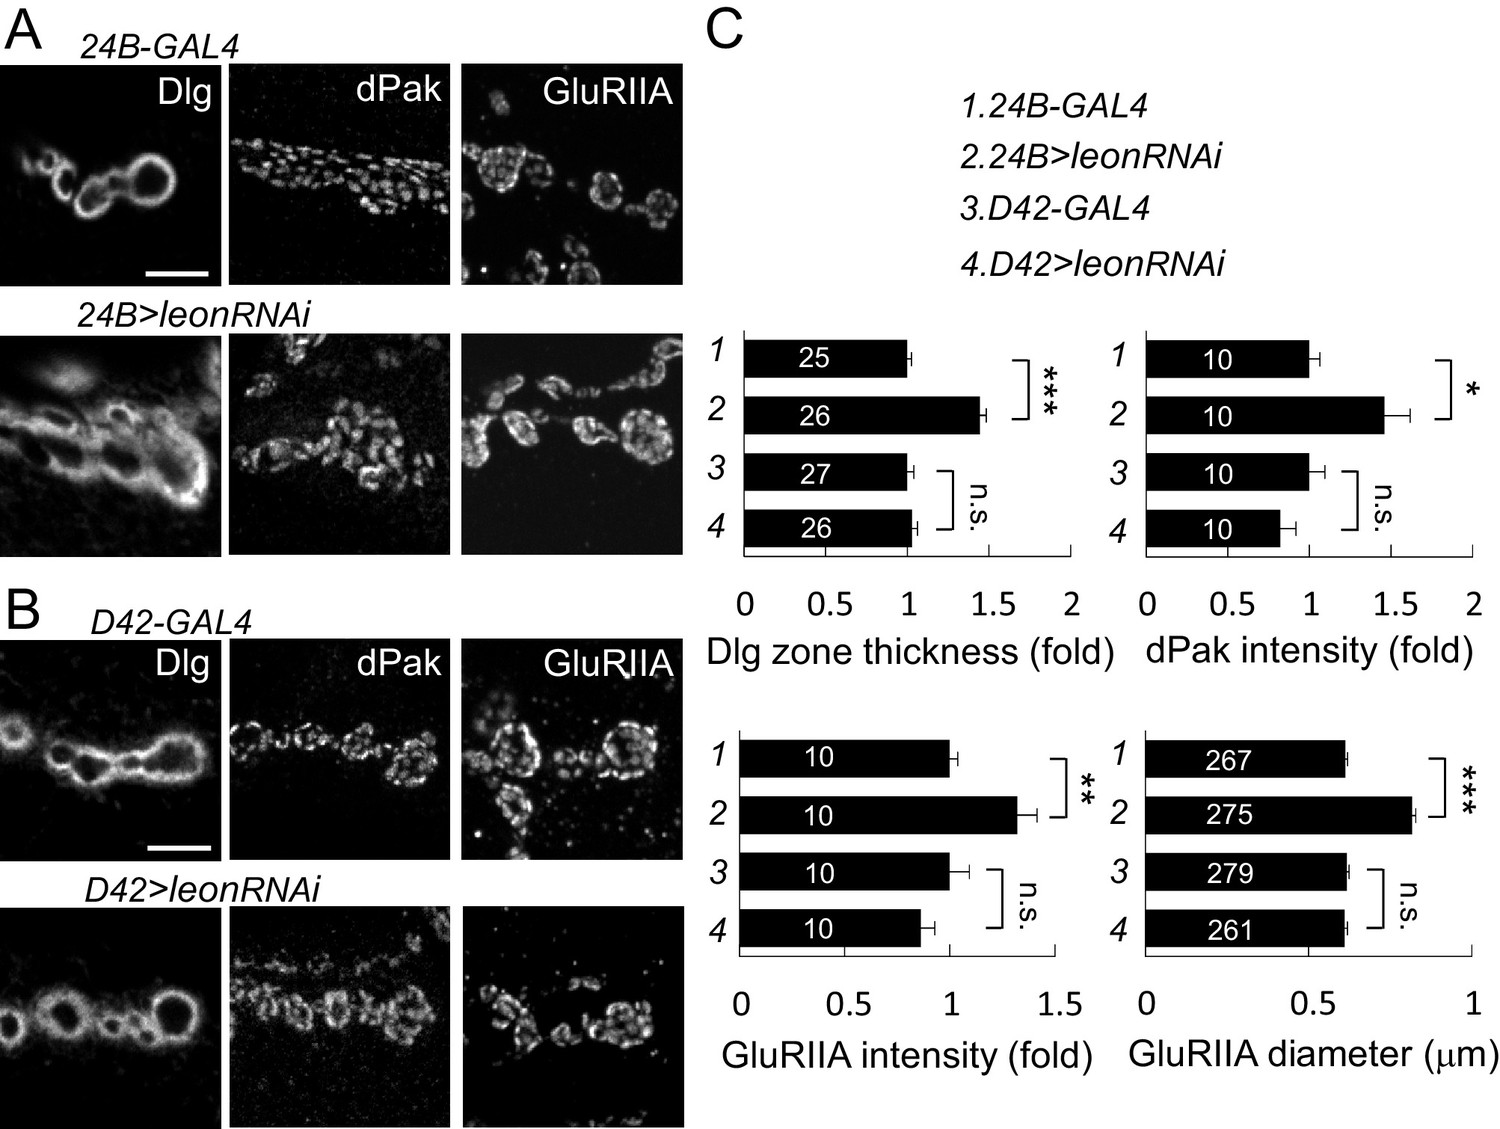
Postsynaptic leon knockdown exhibits postsynaptic defects.
(A,B) Images show Dlg, dPak and GluRIIA immunostaining at NMJs. Expansions of Dlg, dPak, and GluRIIA were shown in UAS-leonRNAi driven by postsynaptic 24B-GAL4 (A), but not by presynaptic D42-GAL4 (B). Scale bars, 5 μm. (C) Bar graphs show means ± SEM of Dlg-positive zone thickness, dPak intensity, GluRIIA intensity and diameter in 24B-GAL4, 24B>leonRNAi, D42-GAL4, and D42>leonRNAi. Pairwise comparisons are shown by brackets with n.s. indicating no significance and * for p<0.05, ** for p<0.01, *** for p<0.001 according to Student’s t tests. The detail statistic numbers also see Supplementary file 1.
Figure 4
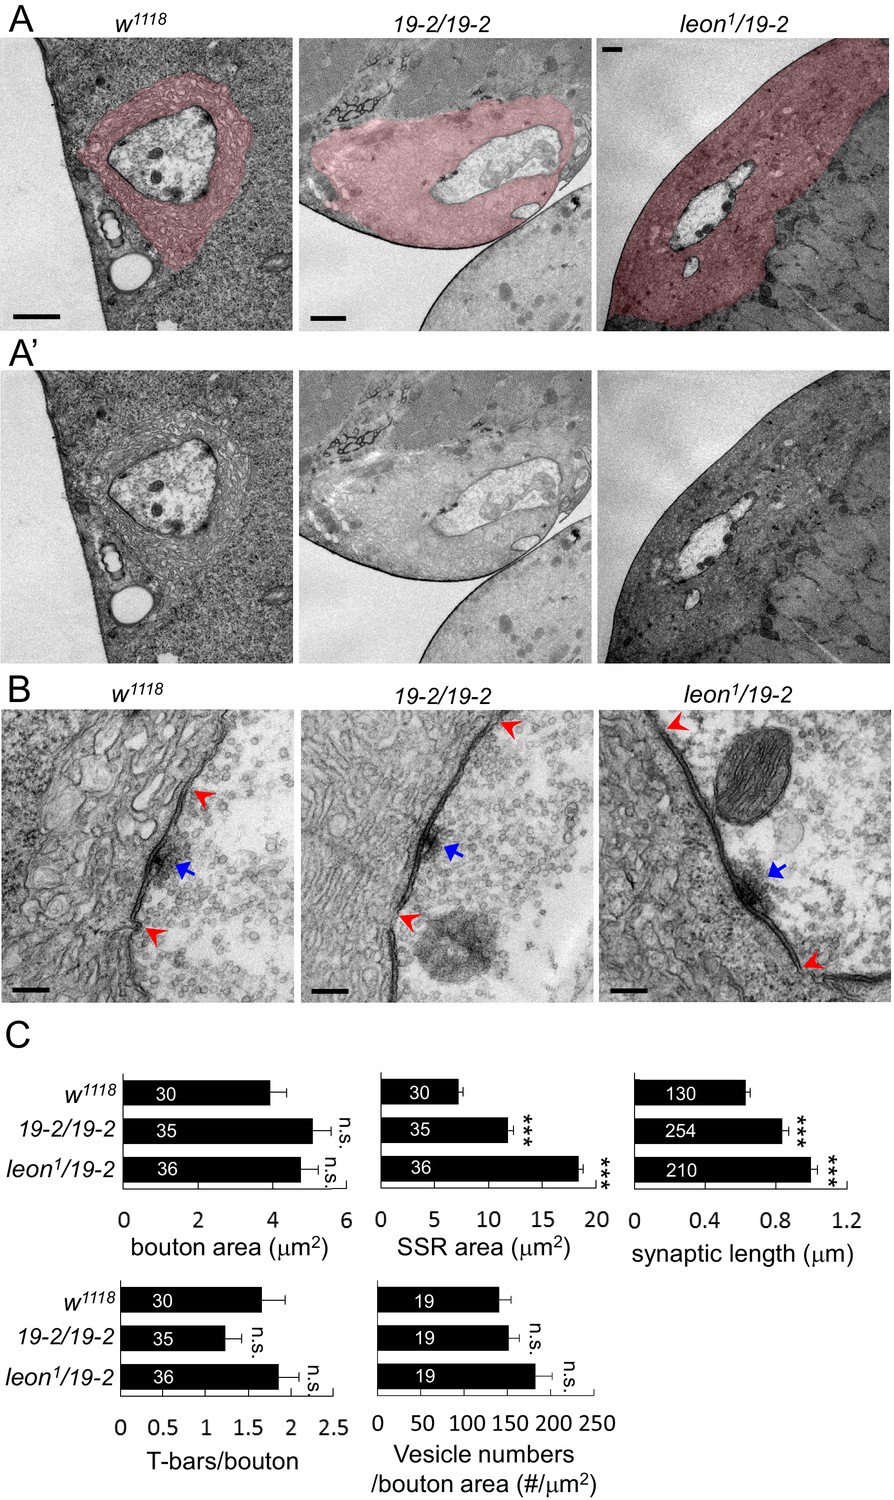
Ultrastructural analysis of leon mutant boutons showed enlarged SSR and longer synaptic membrane.
(A and A’) Electron micrographs of type Ib boutons in w1118, 19-2/19-2 and leon1/19-2. The SSRs are colored in (A). Scale bars, 1 μm. (B) Electron-dense membranes with presynaptic T-bars, postsynaptic SSRs and vesicles are shown in w1118, 19-2/19-2 and leon1/19-2. Each pair of red arrowheads delineates the boundary of synaptic membranes, and arrows (blue) indicate T-bars. Scale bars, 0.2 μm. (C) Bar graphs show means ± SEM of bouton area, SSR area, synaptic length, T-bar/bouton and vesicles/bouton areas in w1118, 19-2/19-2 and leon1/19-2. All data were compared to w1118 with n.s. indicating no significance and *** for p<0.001 by Student’s t tests. The detail statistic numbers also see Supplementary file 1.
Figure 5 with 1 supplement
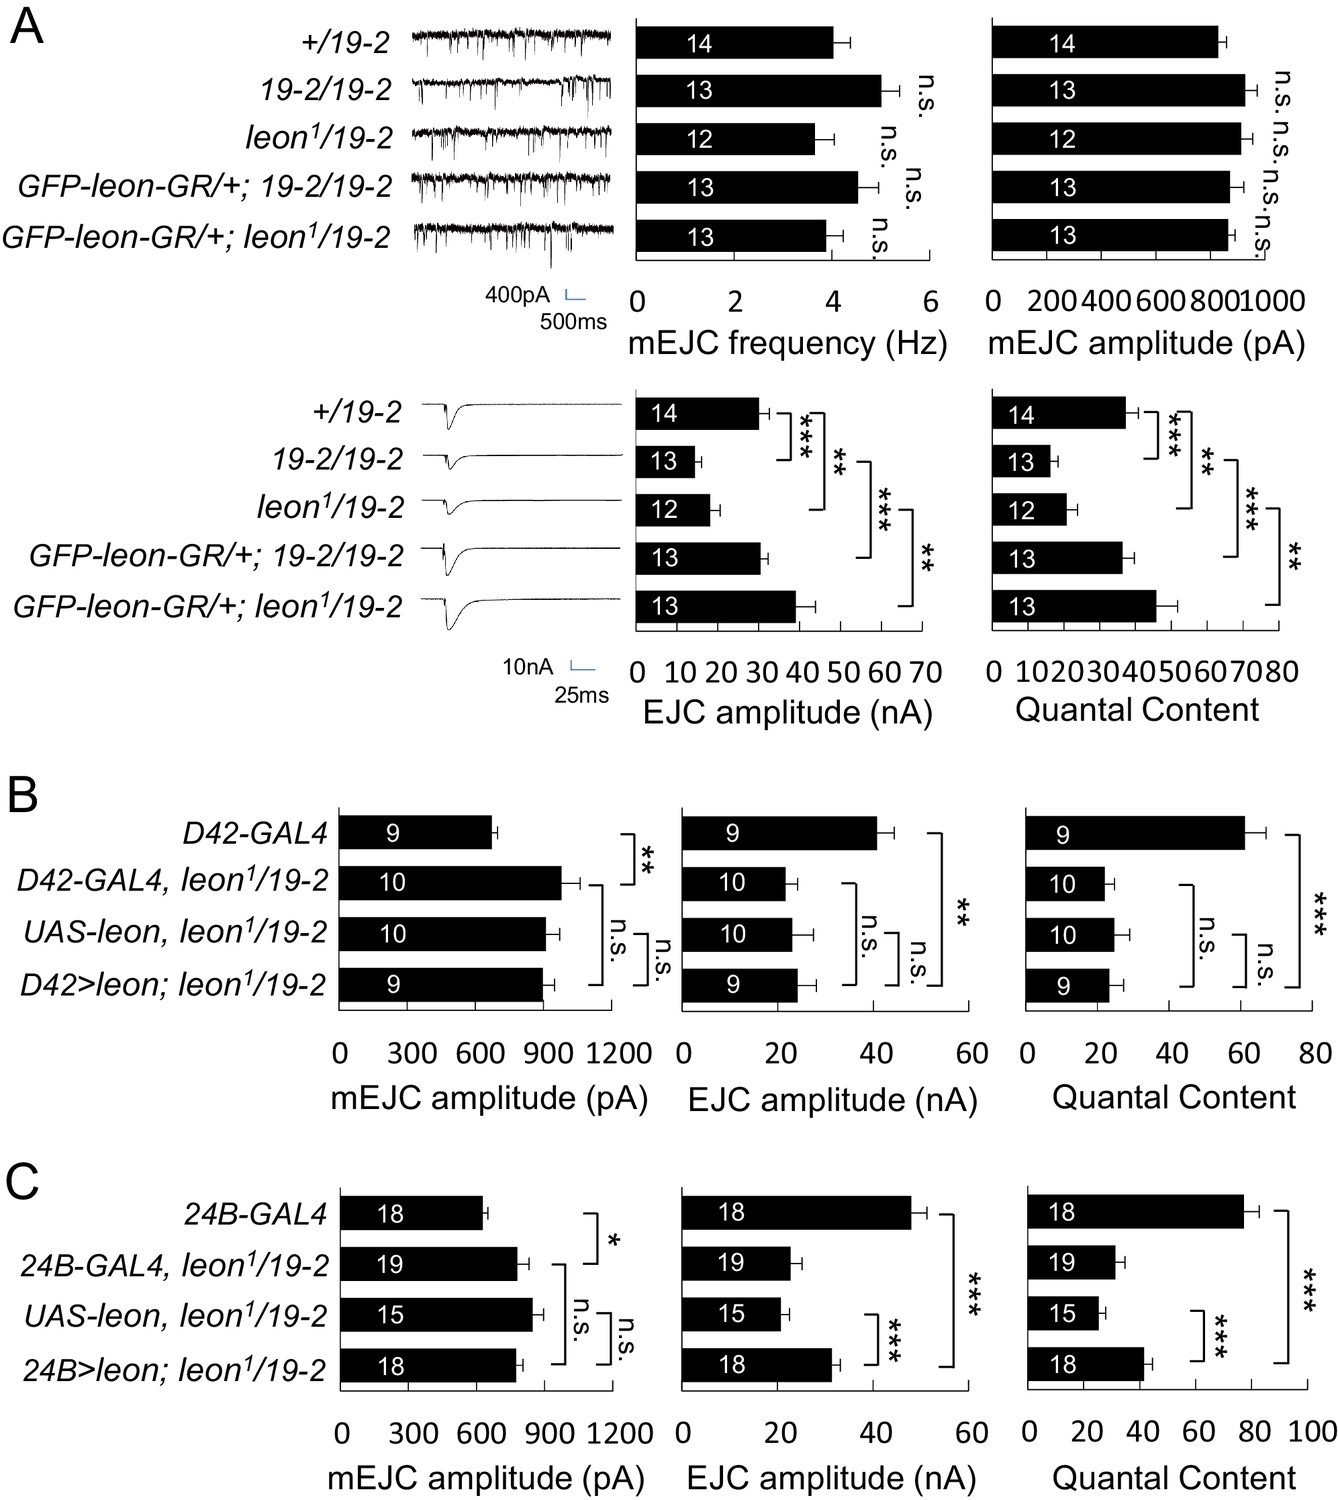
Impaired electrophysiological properties at leon mutant NMJs.
(A) Bar graphs compare frequency, mEJC amplitude, EJC amplitude, and quantal content in 19-2/19-2 and leon1/19-2 to +/19–2 control, and the rescue of 19-2/19-2 and leon1/19-2 by GFP-leon-GR. (B) Bar graphs show that presynaptic D42-GAL4-driven Leon expression failed to restore both EJC amplitude and quantal content in leon1/19-2 mutants. (C) Bar graphs show that 24B-GAL4-driven muscular expression of leon partially restored EJC amplitude and quantal content in leon1/19-2. All data were compared to controls unless specifically indicated by brackets with n.s. indicating no significance, * for p<0.05, ** for p<0.01 and *** for p<0.001 by Student’s t tests. The detail statistic numbers are in Supplementary file 1.
Figure 5—figure supplement 1
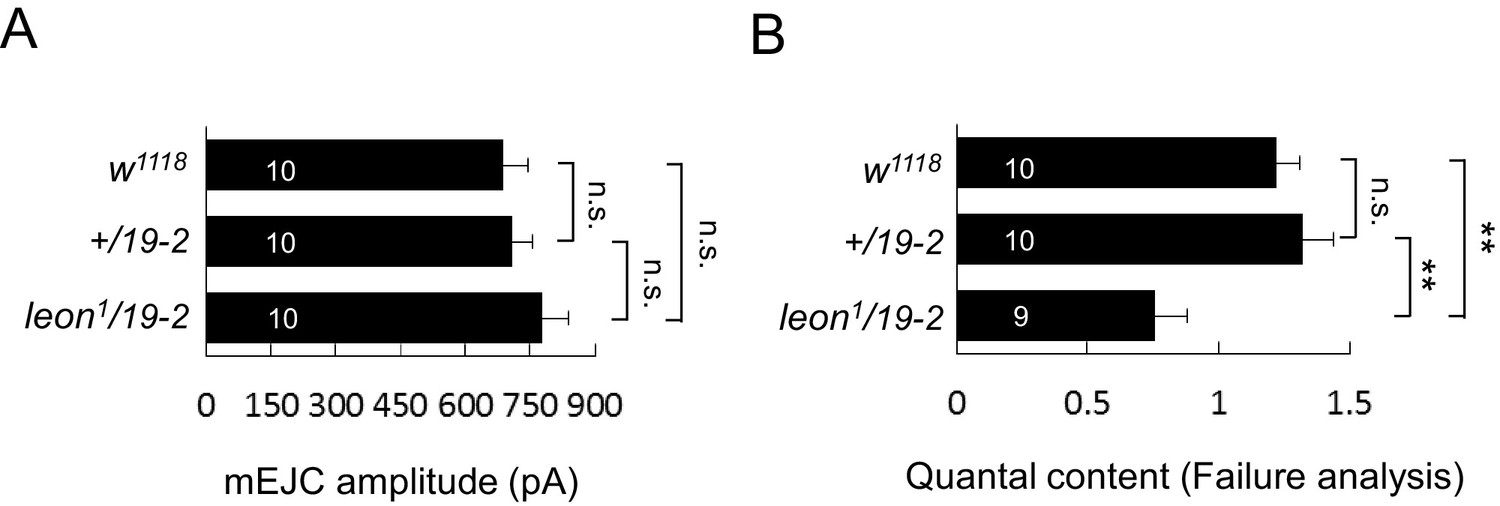
mEJC amplitude and failure analysis.
(A) Bar graphs show that the mEJC amplitude in leon1/19-2 mutant is slightly larger than w1118 and +/19–2 although no statistic significance was detected (see Supplementary file 1). (B) Bar graphs show means ± SEM of quantal content in w1118, +/19–2 and leon1/19-2 by failure analysis. n.s. indicating no significance, ** for p<0.01 and *** for p<0.001 by Student’s t tests. The detail statistic numbers are in Supplementary file 1.
Figure 6 with 1 supplement
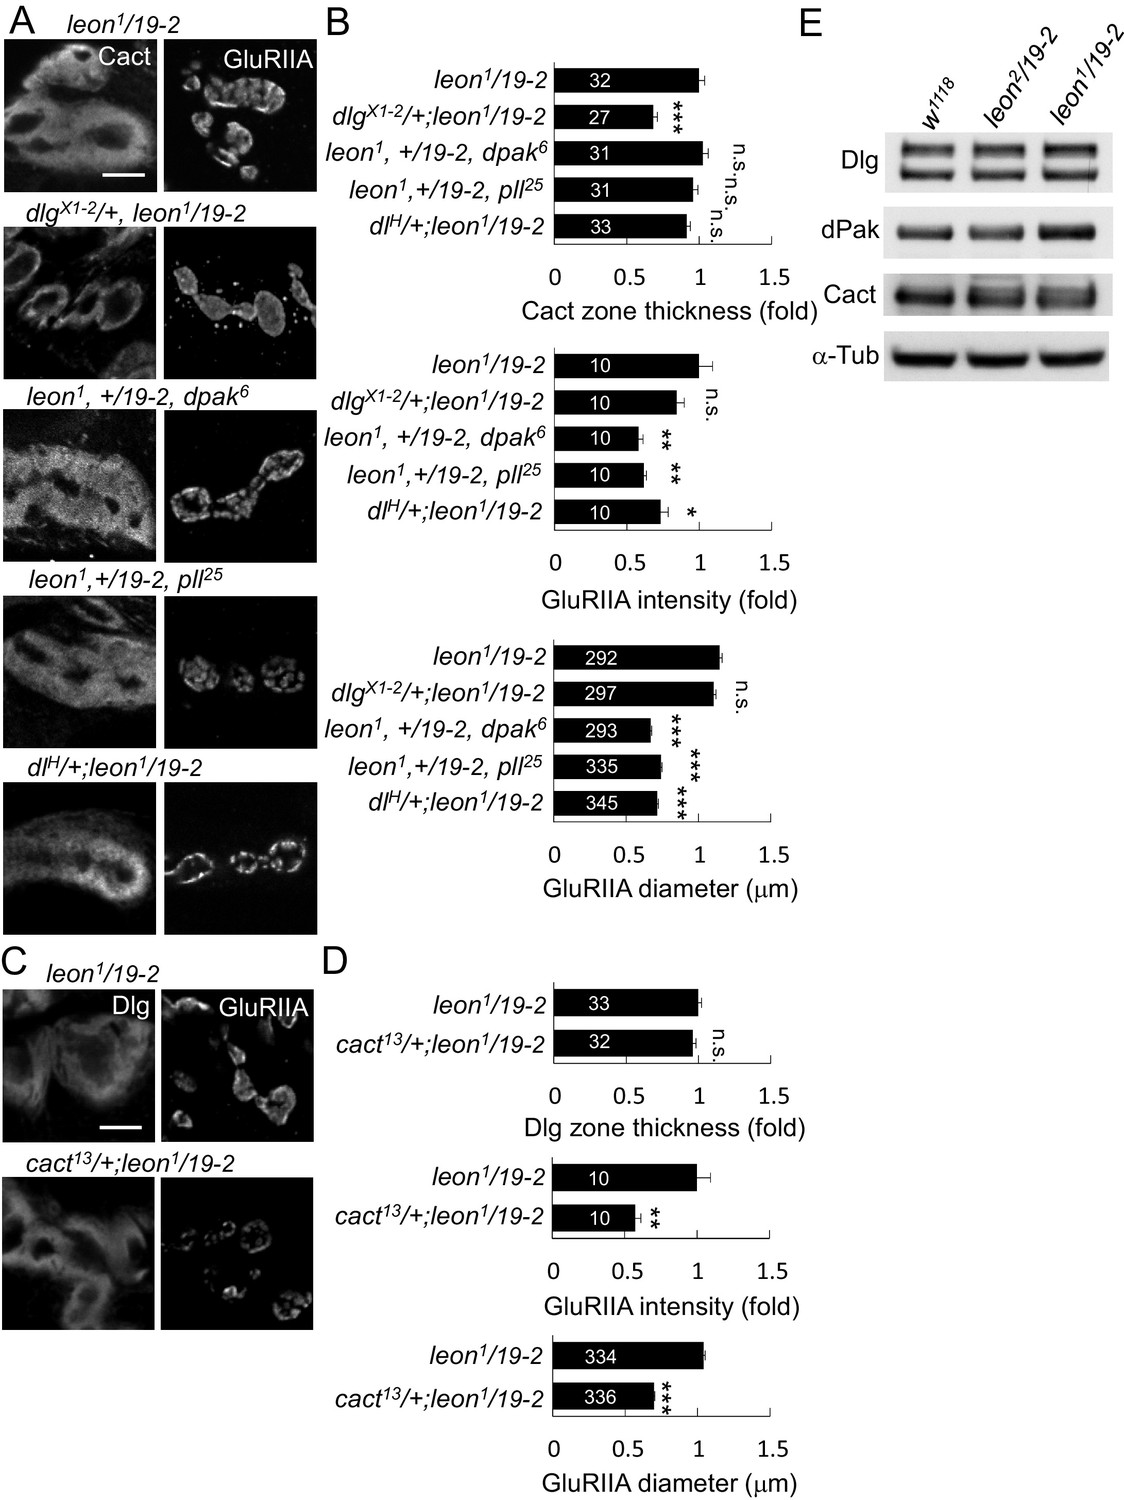
leon mutant phenotypes suppressed by reductions of gene dosages.
(A) Immunostaining images show suppression of Cact expansion in leon1/19-2 by dlgX1-2, and suppression of GluRIIA enlargement by dpak6, pll25 and dlH. (B) Bar graphs show means ± SEM of Cact-positive zone thickness and GluRIIA intensity and diameter. (C) Immunostaining images of NMJs for Dlg and GluRIIA show suppression of GluRIIA enlargement in cact13/+; leon1/19-2 as compared to leon1/19-2. (D) Bar graphs show means ± SEM of Dlg-positive zone thickness and GluRIIA intensity and diameter. Comparisons to leon1/19-2 were assessed by Student’s t tests with n.s. indicating no significance, * for p<0.05, ** for p<0.01 and *** for p<0.001. Scale bar, 5 μm. The detail statistic numbers are in Supplementary file 1. (E) Western blots show enhanced signals of Dlg, dPak and Cact in leon1/19-2 in comparison to w1118. α-Tub as control.
Figure 6—figure supplement 1
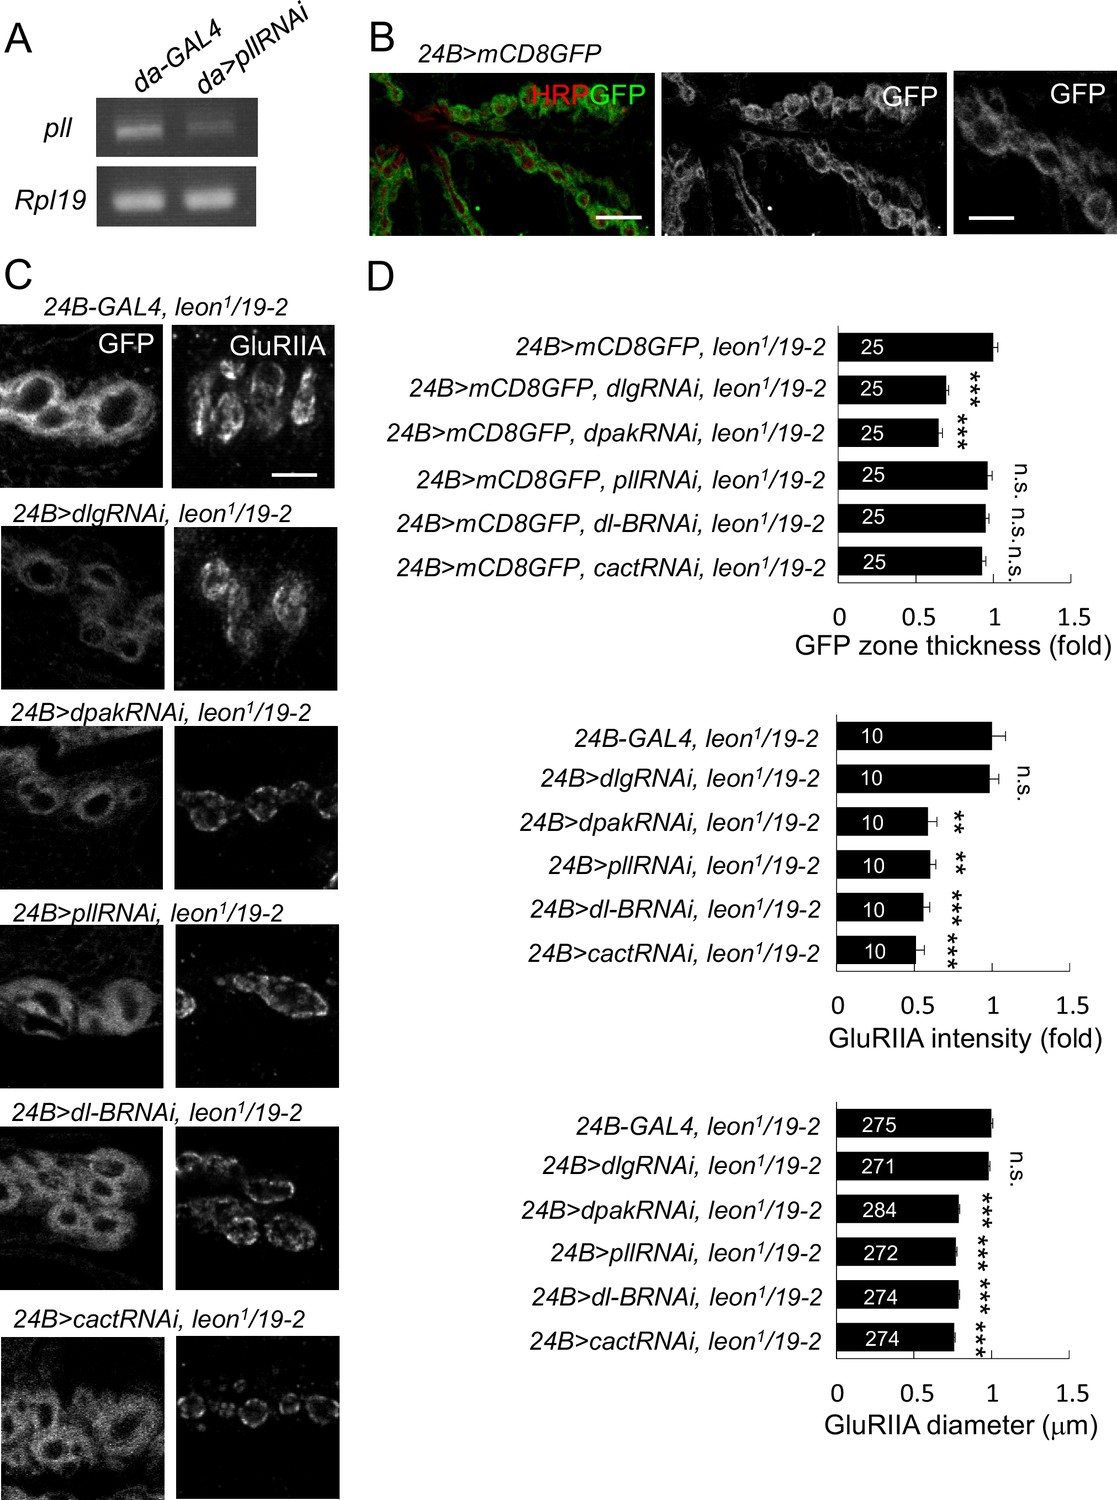
leon mutant phenotypes suppressed by knockdown of postsynaptic proteins.
(A) Examining expressions of pll in da-GAL4-driven pllRNAi by RT-PCR. The mRNA levels of pll decreased in 24B>pllRNAi as compared to GAL4 control. The mRNA expression of Rpl19 serves as control. (B) Postsynaptic expression of mCD8GFP by 24B-GAL4 shows SSR enriched GFP signals with magnification on the right. Scale bars: left, 10 μm and right, 5 μm. (C) Immunostaining images of NMJs for GFP and GluRIIA show suppression of mCD8GFP-labeled SSR in leon1/19-2 by RNAi transgenes for dlg and dpak, and suppression of GluRIIA enlargement by RNAi transgenes for dpak, pll, dl-B and cact. Scale bar, 5 μm. (D) Bar graphs show means ± SEM of GFP-positive zone thickness and GluRIIA intensity and diameter. Comparisons to leon1/19-2 were assessed by Student’s t tests with n.s. indicating no significance and *** for p<0.001. The detail statistic numbers are in Supplementary file 1.
Figure 7 with 1 supplement
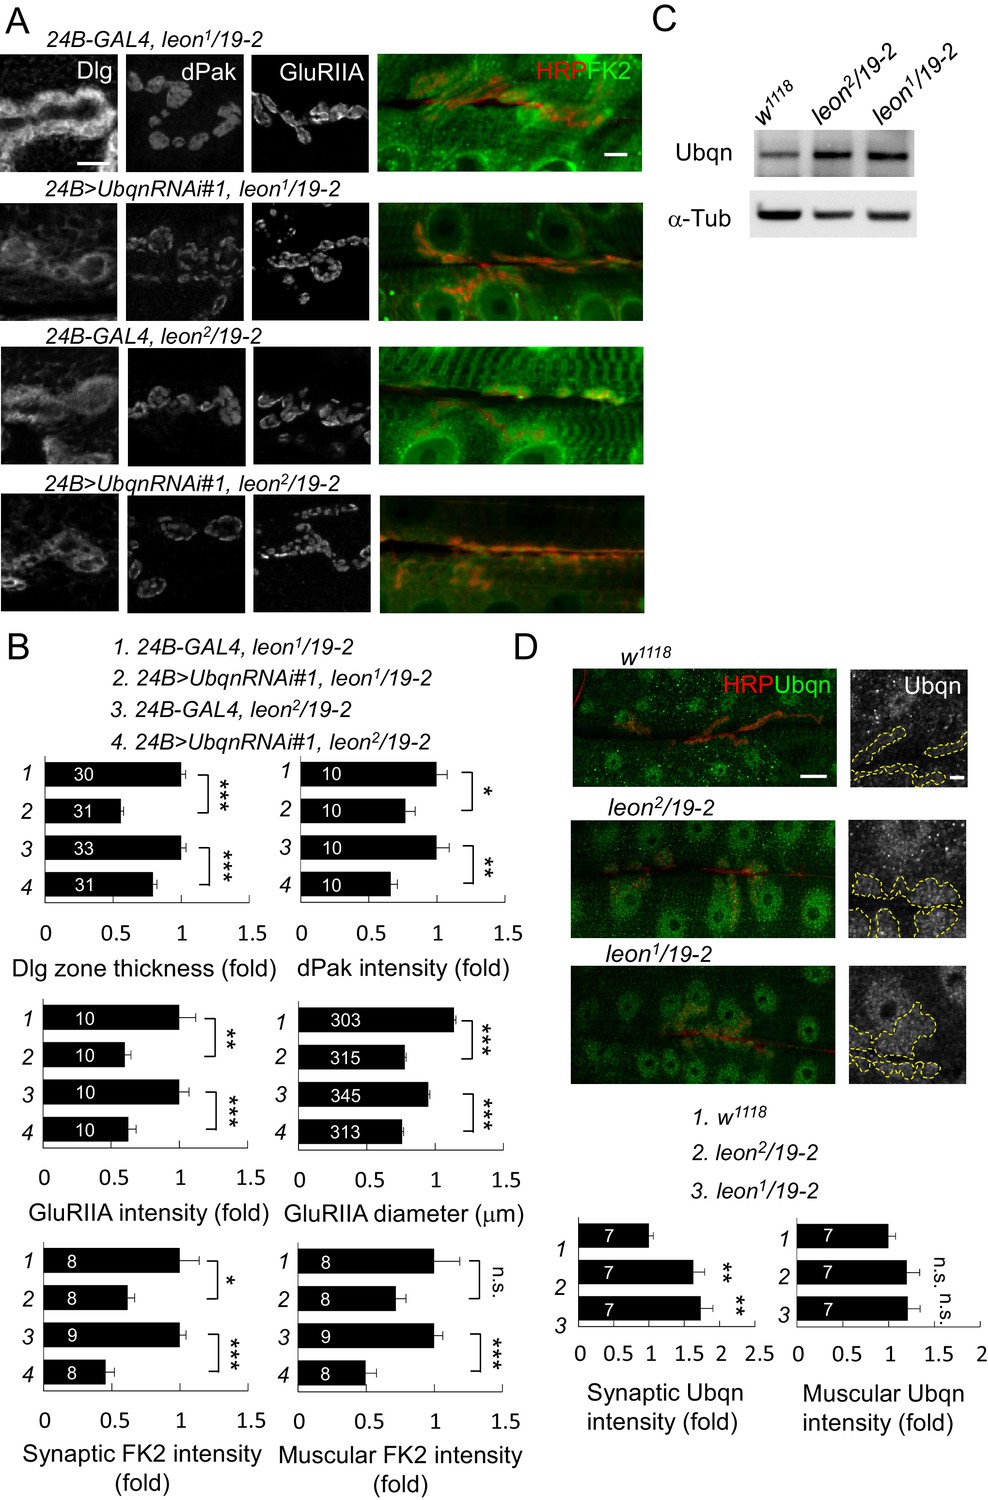
Ubqn-dependent postsynaptic expansion and ubiquitin homeostasis defects in leon mutants.
(A) Immunostaining images show suppression of Dlg, dPak and GluRIIA expansions, and reduction of FK2 intensity in leon1/19-2 and leon2/19-2 by 24B-GAL4-driven postsynaptic expression of UbqnRNAi#1. Scale bars: left, 5 μm, and right, 10 μm. (B) Bar graphs show means ± SEM of Dlg-positive zone thickness, dPak intensity, GluRIIA intensity and diameter, and FK2 intensities on synapses and muscles. (C) Western blot shows increases of Ubqn levels in leon2/19-2 and leon1/19-2 as compared to w1118. α-Tub as control. (D) Images show enhanced immunostaining signal of Ubqn (green, co-stained HRP in red) in leon2/19-2 and leon1/19-2 compared to w1118. The single Ubqn channel is also shown and yellow dashed lines delineate Cact-positive areas (Cact staining is not shown). Scale bars: left, 20 μm and right, 5 μm. Bar graphs show means ± SEM of Ubqn intensity at synaptic (left) or muscle (right) areas. All data were compared to controls unless specifically indicated by brackets with n.s. indicating no significance, * for p<0.05, ** for p<0.01 and *** for p<0.001 by Student’s t tests. The detail statistic numbers are in Supplementary file 1.
Figure 7—figure supplement 1
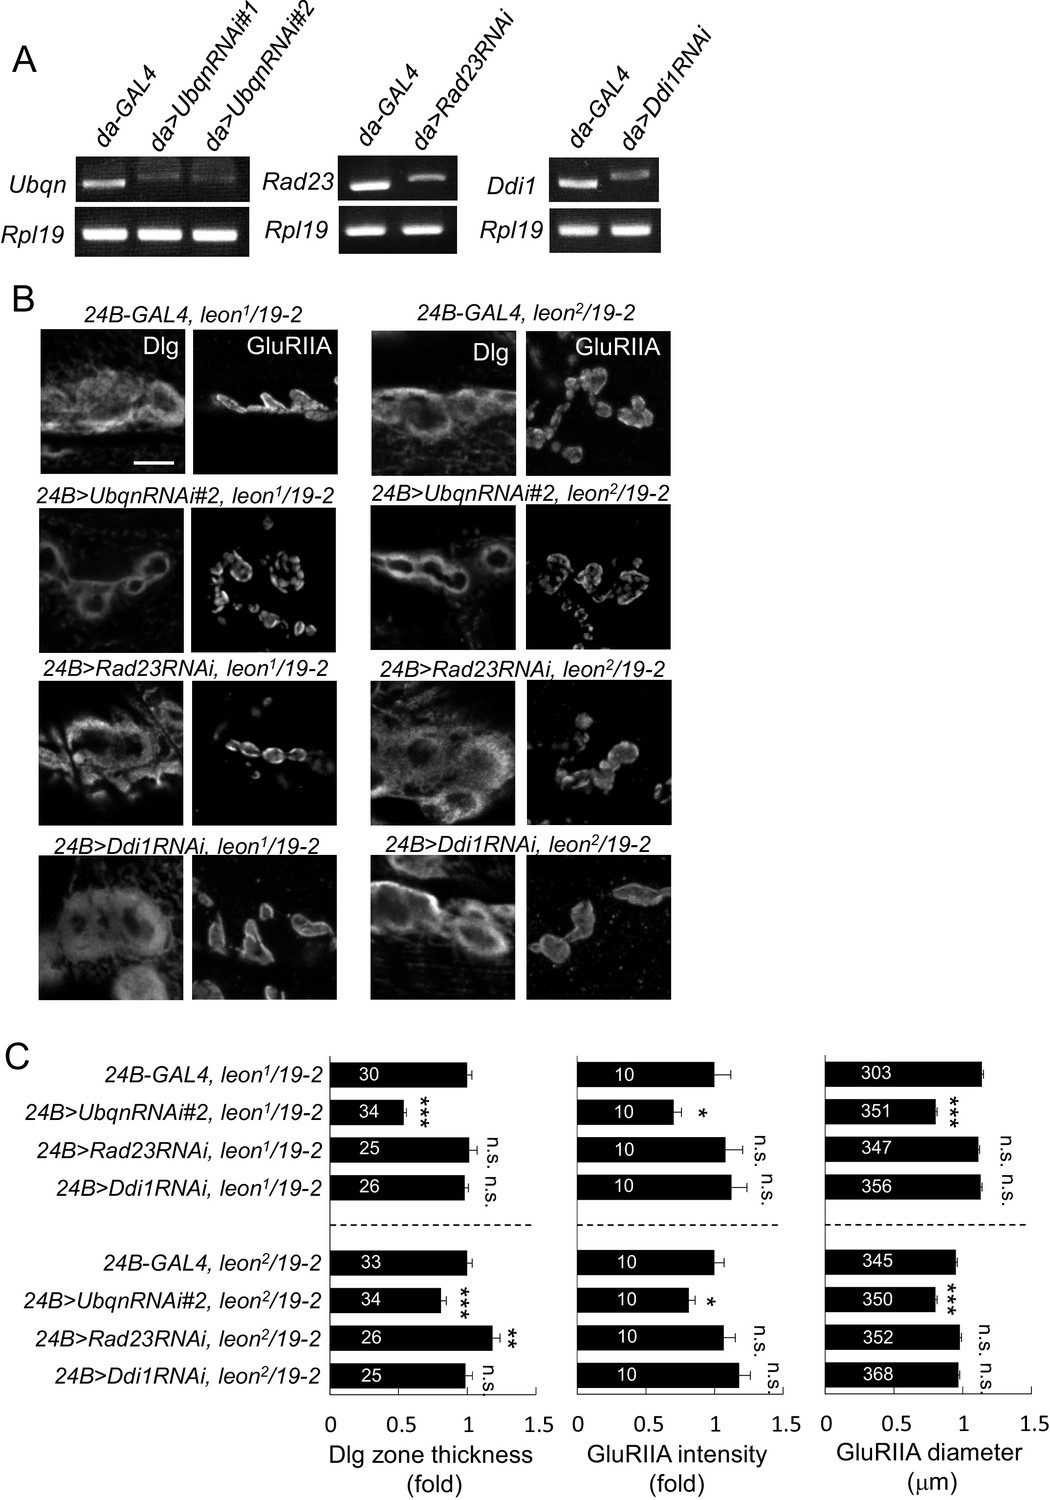
Ubqn- but not Rad23- or Ddi1-dependent postsynaptic defects in leon mutants.
(A) Examining expressions of Ubqn, Rad23 and Ddi1 in da-GAL4-driven UbqnRNAi (#1 and #2), Rad23RNAi and Ddi1RNAi by RT-PCR. The mRNA levels of Ubqn, Rad23 and Ddi1 decreased as compared to GAL4 control. The mRNA expression of Rpl19 serves as the control. (B) Immunostaining images show suppression of Dlg and GluRIIA expansion in leon2/19-2 or leon1/19-2 by 24B-GAL4-driven UbqnRNAi#2 expression. However, the suppression was not detected by 24B-GAL4-driven expression of Rad23RNAi and Ddi1RNAi. Scale bar, 5 μm. (C) Bar graphs show means ± SEM of Dlg-positive zone thickness and GluRIIA intensity and diameter. All data were compared to controls with n.s. indicating no significance, * for p<0.05, ** for p<0.01 and *** for p<0.001 according to Student’s t tests. The detail statistic numbers are in Supplementary file 1.
Figure 8
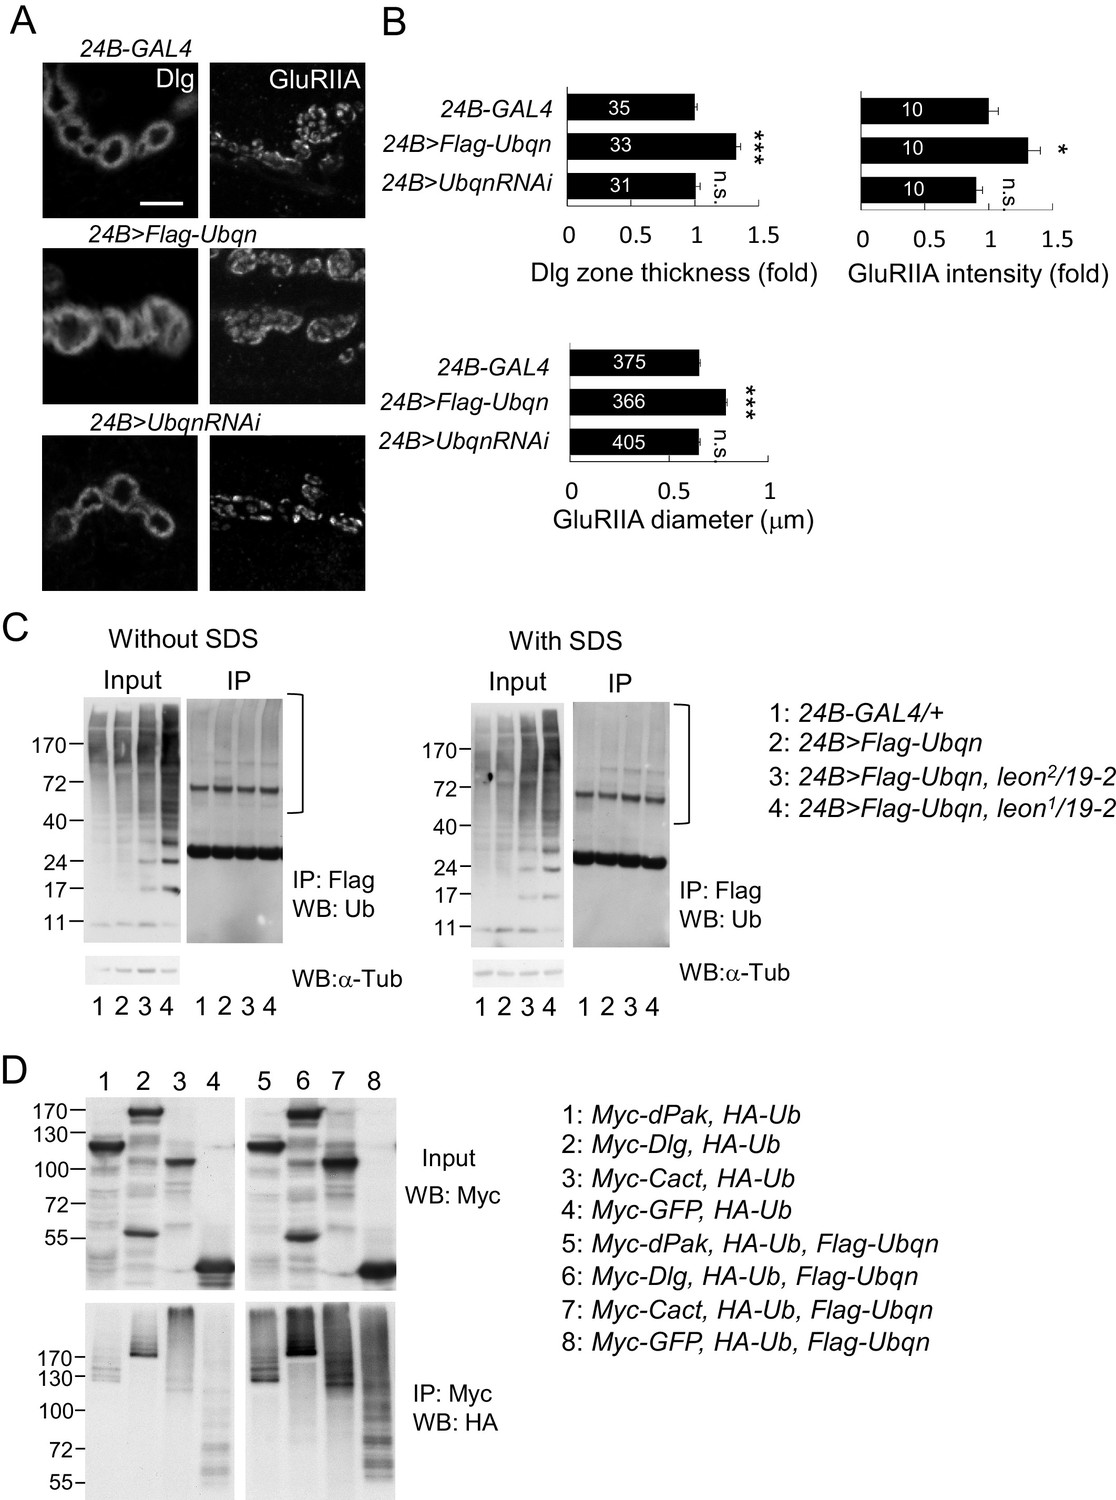
Ubqn promotes postsynaptic expansion and associates with ubiquitinated substrates.
(A) Images show 24B-GAL4-driven postsynaptic expression of Flag-Ubqn and UbqnRNAi, with immunostaining for Dlg or GluRIIA. Scale bar, 5 μm. (B) Bar graphs show means ± SEM of Dlg-positive zone thickness and GluRIIA intensity and diameter. All data were compared to 24B-GAL4 control with n.s. indicating no significance, and *** for p<0.001 according to Student’s t tests. The detail statistic numbers are in Supplementary file 1. (C) Western blots show input and immunoprecipitation of Flag-Ubqn from 24B-GAL4 control and 24B-GAL4-driven Flag-Ubqn expression in wild type, leon2/19-2 and leon1/19-2. The immunoprecipitates were probed with ubiquitin antibody. Left panels were performed in normal lysis buffer and right panels in lysis buffer containing SDS to disrupt protei association. Brackets indicate the smearing ubiquitin signals. α-Tub as control. (D) Western blots show input probed by Myc antibody (top panel) and immunoprecipitation of Myc-proteins probed by HA antibody. S2 cell transfected with plasmids for expressing HA-Ub and either Myc-dPak, Myc-Dlg, Myc-Cact, or Myc-GFP (lanes 1–4) or further co-transfected with Flag-Ubqn (lanes 5–8).
Figure 9
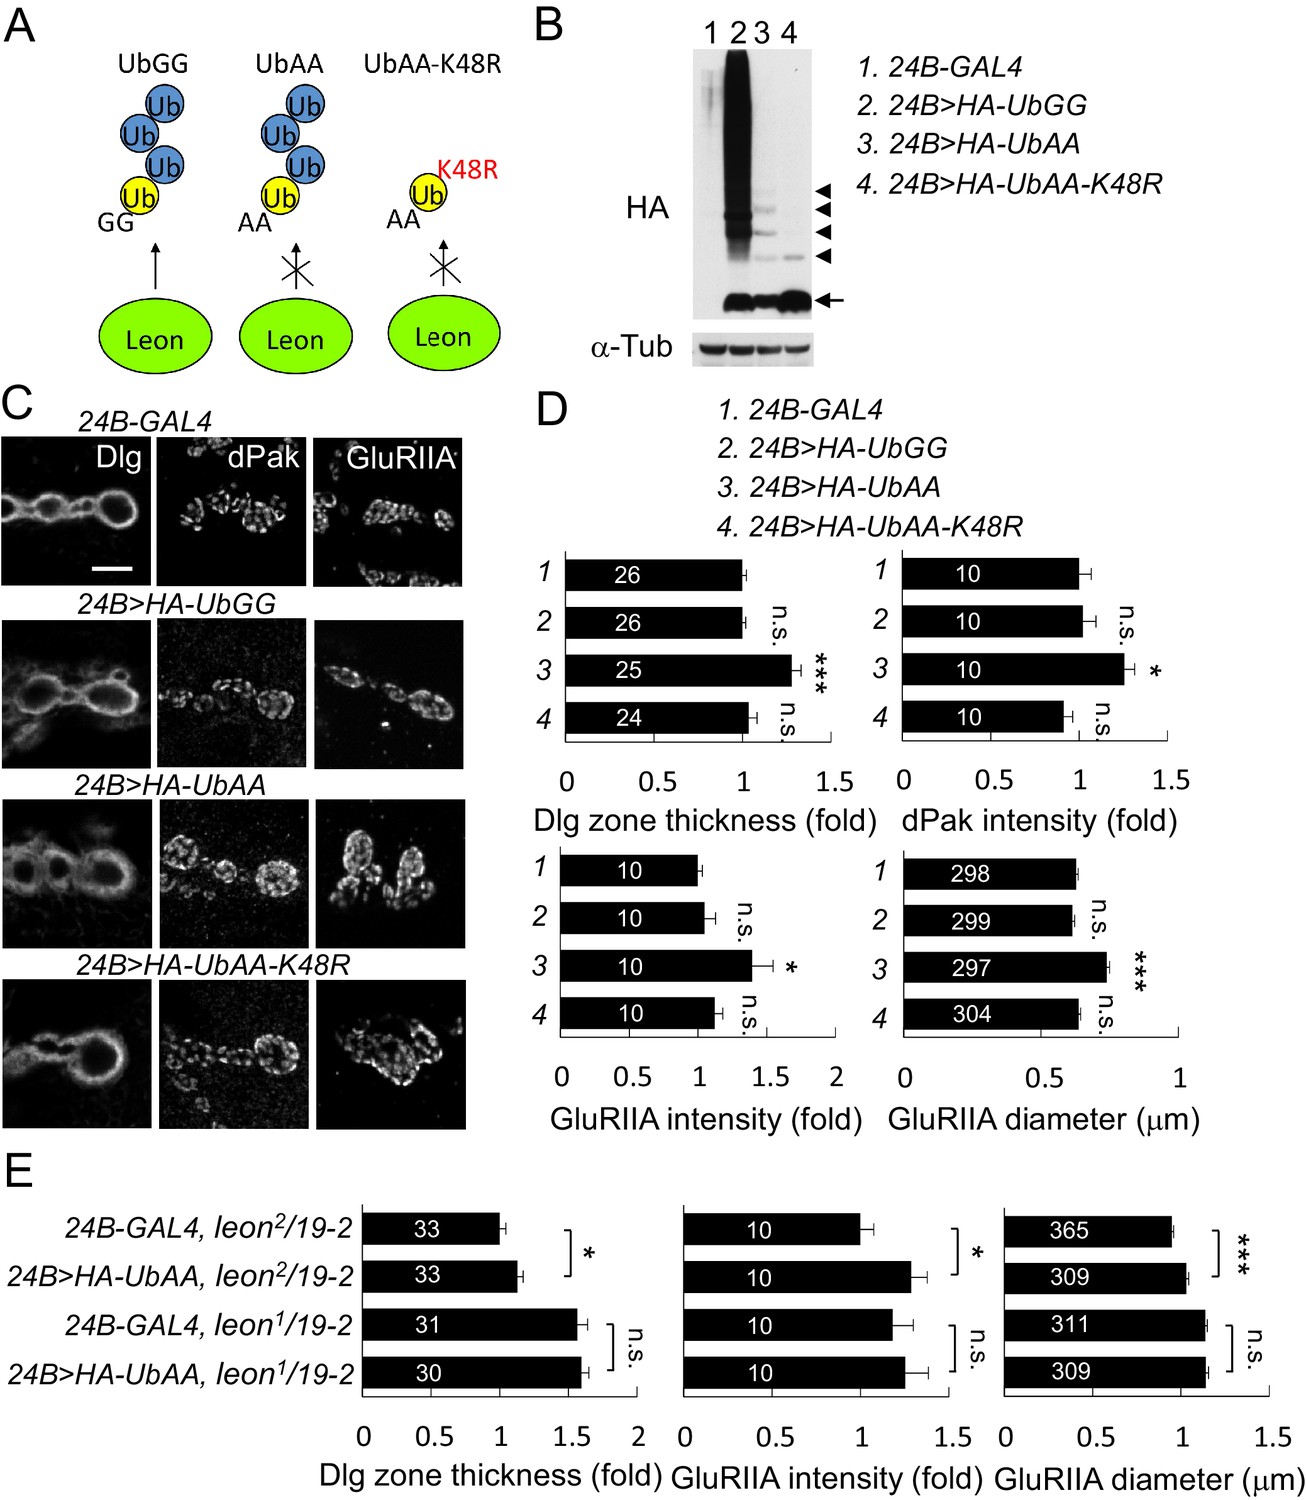
Postsynaptic defects induced by K48-linked free ubiquitin chains.
(A) Diagram shows formation of K48-linked free ubiquitin chains between ectopically expressed UbGG or UbAA (yellow), and endogenous Ub (blue). UbAA-K48R, however, cannot form K48-linked free ubiquitin chains. The free ubiquitin chains initiated by ectopic UbGG, but not UbAA, could be deconjugated by Leon. In addition, UbGG also conjugates to substrates. (B) Western blot probed with HA antibody shows HA expression patterns in 24B-GAL4 control (lane 1), 24B>HA-UbGG (lane 2), 24B>HA-UbAA (lane 3) and 24B>HA-UbAA-K48R (lane 4). α-Tub as control. Arrow indicates ubiquitin monomer and arrowheads the dimer, trimer, tetramer and pentamer. (C) Images show 24B-GAL4-driven postsynaptic expression of UbGG, UbAA and UbAA-K48R, with immunostaining for Dlg, dPak or GluRIIA. Scale bar, 5 μm. (D) Bar graphs show means ± SEM of Dlg-positive zone thickness, dPak intensity, GluRIIA intensity and diameter in 24B-GAL4-driven expression of UbGG, UbAA and UbAA-K48R. (E) Bar graphs show means ± SEM of Dlg-positive zone thickness and GluRIIA intensity and diameter in 24B-GAL4-driven UbAA expression in leon2/19-2 or leon1/19-2. All data were compared to controls unless specifically indicated by brackets with n.s. indicating no significance, * for p<0.05, and *** for p<0.001 according to Student’s t tests. The detail statistic numbers are in Supplementary file 1.
Figure 10
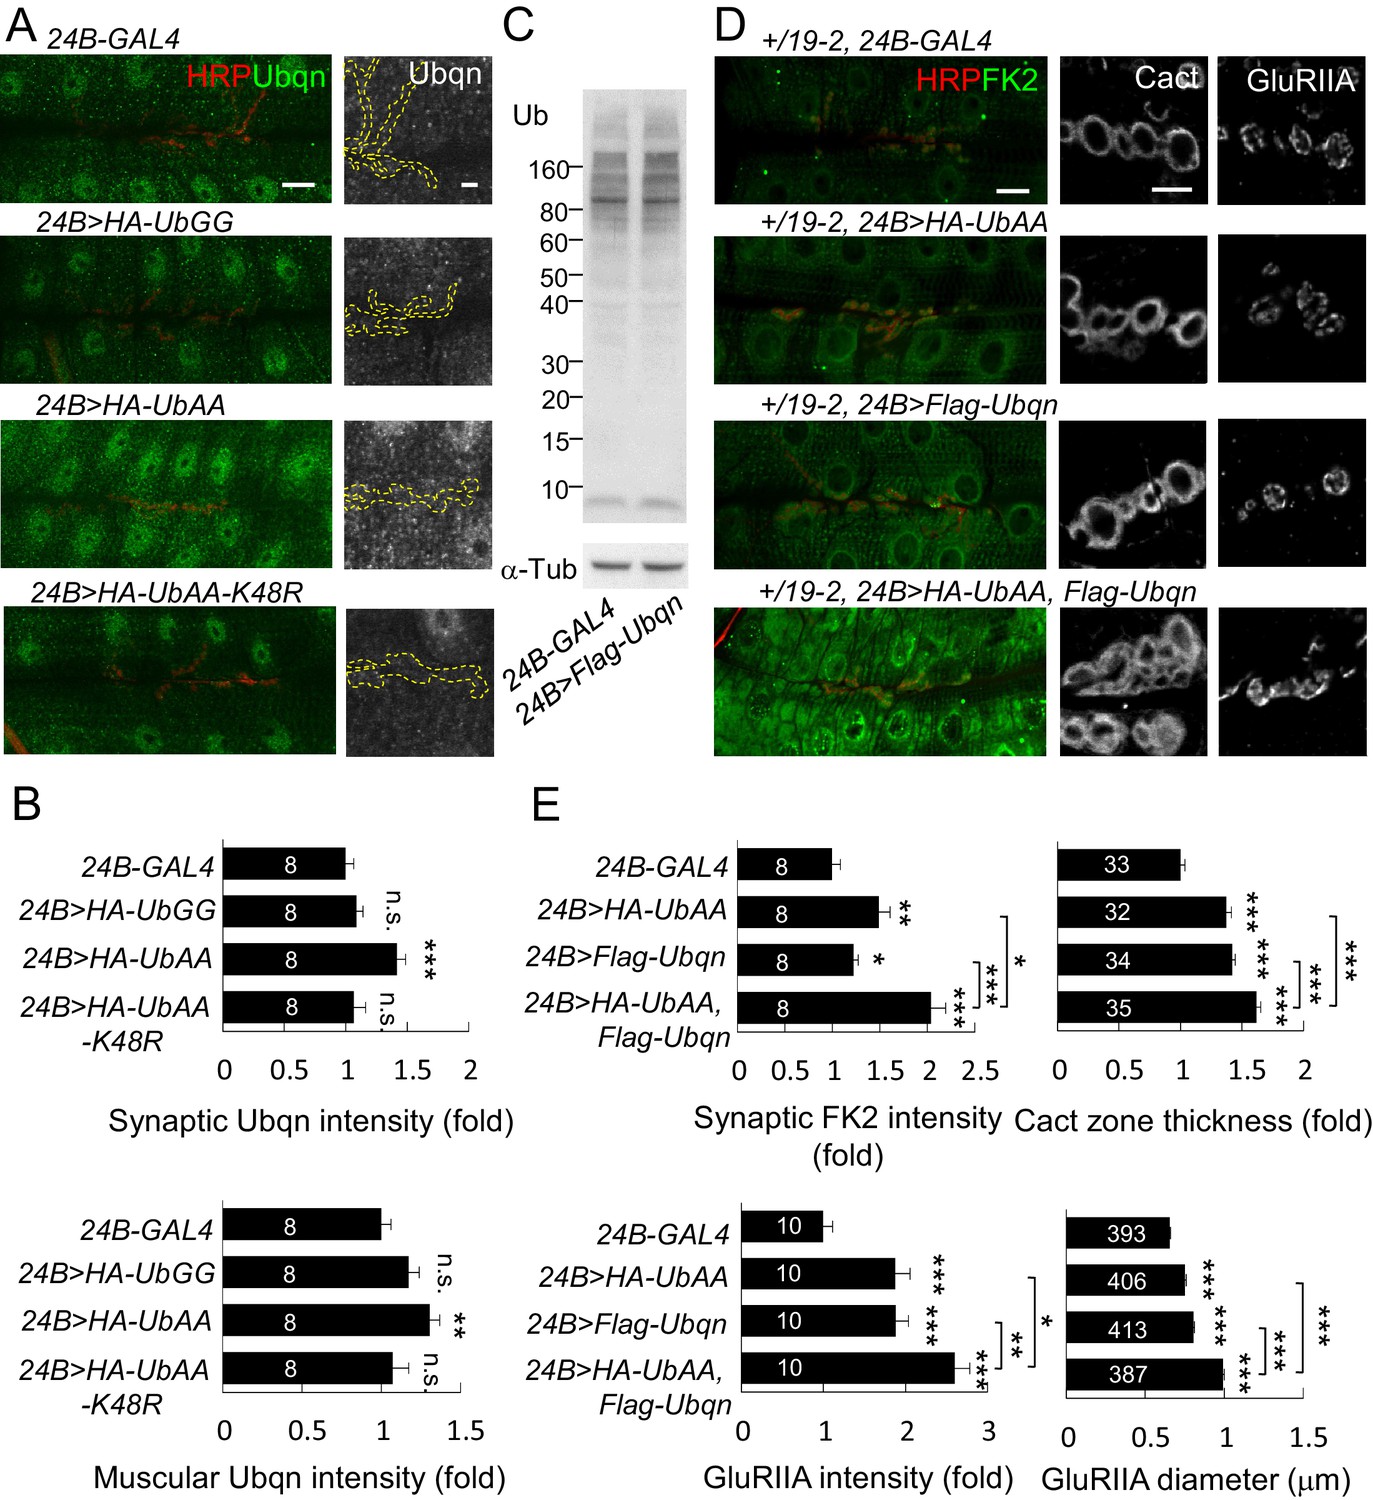
Free ubiquitin chains induce Ubqn levels and enhance postsynaptic defects when co-expressed with Ubqn.
(A) Immunostaining images show NMJs for Ubqn (green) and HRP (red) in 24B-GAL4-driven postsynaptic expression of UbGG, UbAA and UbAA-K48R. The single Ubqn channel is also shown and yellow dashed lines delineate HRP-positive areas. Scale bars: left, 20 μm and right, 5 μm. (B) Bar graphs show means ± SEM of synaptic and muscular Ubqn intensities when UbGG, UbAA or UbAA-K48R was expressed by 24B-GAL4. (C) Western blot probed with Ub antibody shows ubiquitin expression patterns in 24B-GAL4 control and 24B>Flag-Ubqn. α-Tub as control. (D) Images show NMJ immunostaining for FK2 (green, co-stained with HRP in red), Cact or GluRIIA in expression of HA-UbAA, Flag-Ubqn, or both in +/19–2 background. Scale bars: left, 20 μm and right, 5 μm. (E) Bar graphs show means ± SEM of synaptic FK2 intensity, Cact-positive zone thickness and GluRIIA intensity and diameter. All data were compared to controls unless specifically indicated by brackets with n.s. indicating no significance, * for p<0.05, ** for p<0.01, and *** for p<0.001 by Student’s t tests. The detail statistic numbers are in Supplementary file 1.
Figure 11

Model for Leon in maintaining postsynaptic ubiquitin homeostasis and protein degradation.
Schematics show postsynaptic distributions of free and substrate-conjugated ubiquitin chains in wild-type (upper left) and leon mutant (upper right) postsynaptic sites. (bottom) The proposed pathway for Leon/Usp5 in postsynapses: Leon downregulates the levels of free ubiquitin chains through the deubiquitinating activity. Accumulation of free ubiquitin chains promotes Ubqn elevation, and Leon may suppress Ubqn levels through alternative pathways (dotted lines). Accumulated Ubqn could bind and stabilize ubiquitinated substrates. However, free ubiquitin chains and Ubqn when both are increased, collaborate to induce more accumulations of ubiquitinated substrates. Finally, accumulated substrates contribute to postsynaptic protein accumulation and SSR and PSD expansions (Solid lines: supported by experiments in this study; dash lines: proposed links).
Author response image 1
Additional files
-
Supplementary file 1
Statistical data for bar graphs shown in figures.
- https://doi.org/10.7554/eLife.26886.021
Download links
A two-part list of links to download the article, or parts of the article, in various formats.
Downloads (link to download the article as PDF)
Open citations (links to open the citations from this article in various online reference manager services)
Cite this article (links to download the citations from this article in formats compatible with various reference manager tools)
USP5/Leon deubiquitinase confines postsynaptic growth by maintaining ubiquitin homeostasis through Ubiquilin
eLife 6:e26886.
https://doi.org/10.7554/eLife.26886


