A broadly distributed toxin family mediates contact-dependent antagonism between gram-positive bacteria
- University of Washington School of Medicine, United States
- Newcastle University, United Kingdom
- University of Washington, United States
- McMaster University, Canada
- Advanced Light Source, United States
- Northwestern University, United States
- Santa Fe Institute, United States
- Howard Hughes Medical Institute, University of Washington School of Medicine, United States
Figures
Figure 1 with 1 supplement
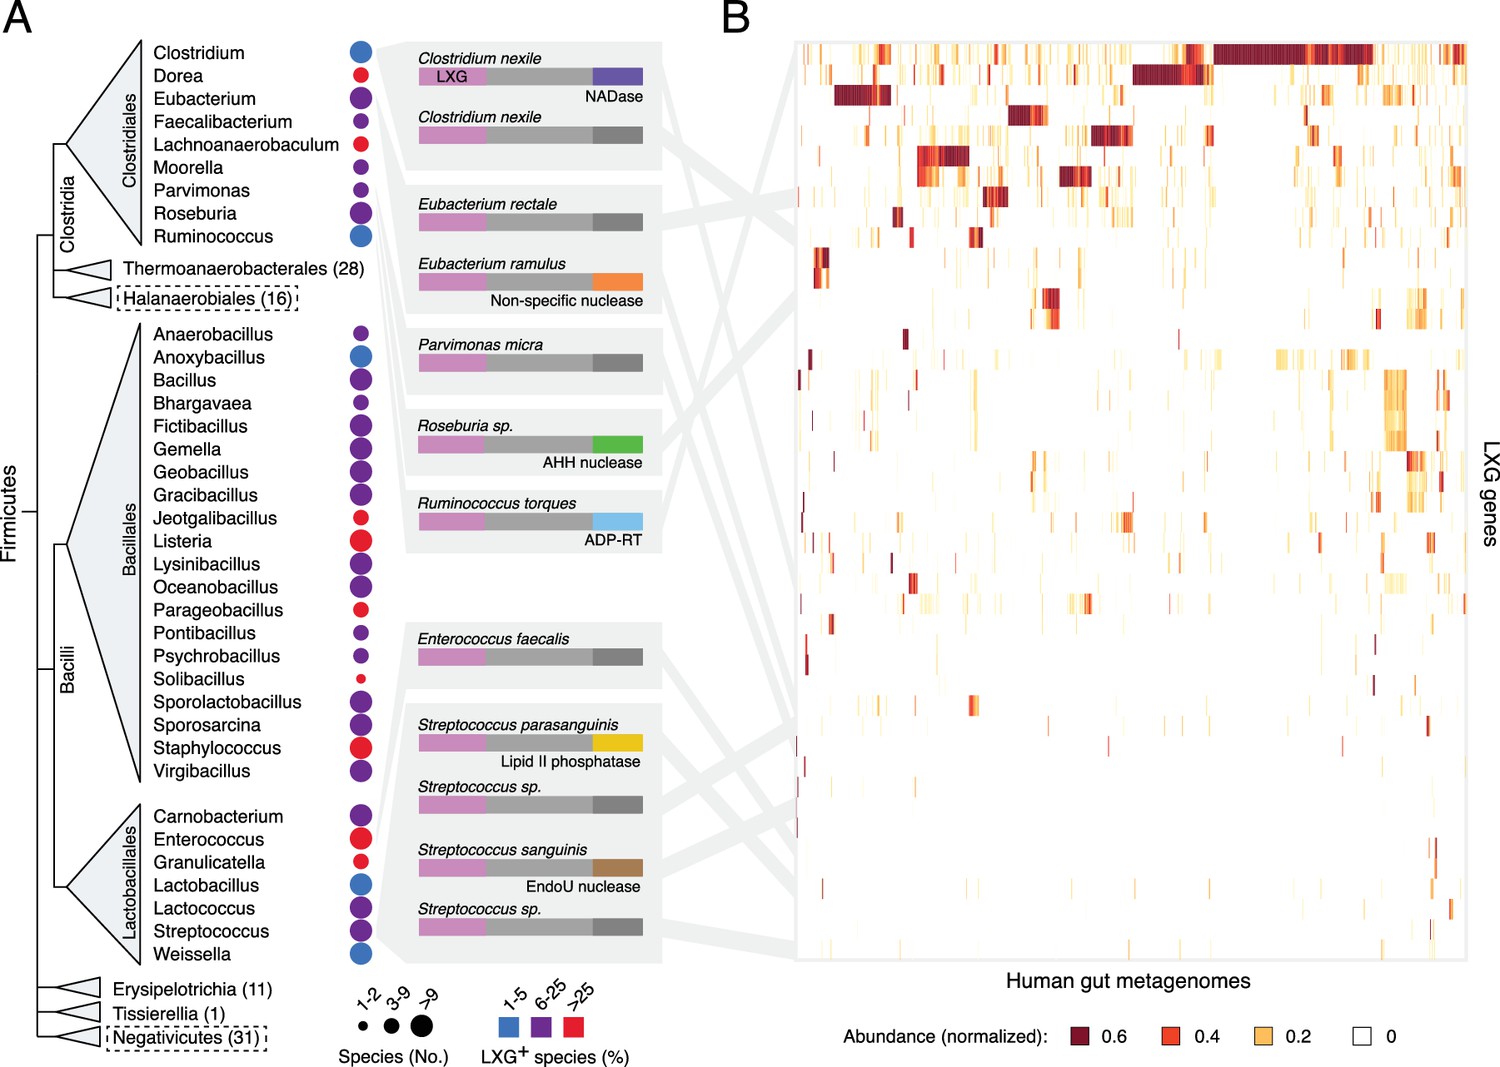
The LXG protein family contains diverse toxins that are broadly distributed in Firmicutes and found in the human gut microbiome.
(A) Dendogram depicts LXG-containing genera within Firmicutes, clustered by class and order. Circle size indicates the number of sequenced genomes searched within each genus and circle color represents percentage of those found to contain at least one LXG protein. For classes or orders in which no LXG domain-containing proteins were found, the number of genera evaluated is indicated in parentheses; those consisting of Gram-negative organisms are boxed with dashed lines. Grey boxes contain predicted domain structures for representative divergent LXG proteins. Depicted are LXG-domains (pink), spacer regions (light grey) and C-terminal polymorphic toxin domains (NADase, purple; non-specific nuclease, orange; AHH family nuclease, green; ADP-ribosyltransferase, blue; lipid II phosphatase based on orthology to TelC (defined biochemically herein), yellow; EndoU family nuclease, brown; unknown activity, dark grey). (B) Heatmap depicting the relative abundance (using logarithmic scale) of selected LXG genes detected in the Integrated Gene Catalog (IGC). A complete heatmap is provided in Figure 1—figure supplement 1. Columns represent individual human gut metagenomes from the IGC database and rows correspond to LXG genes. Grey lines link representative LXG toxins in (A) to their corresponding (≥95% identity) IGC group in (B).
Figure 1—figure supplement 1
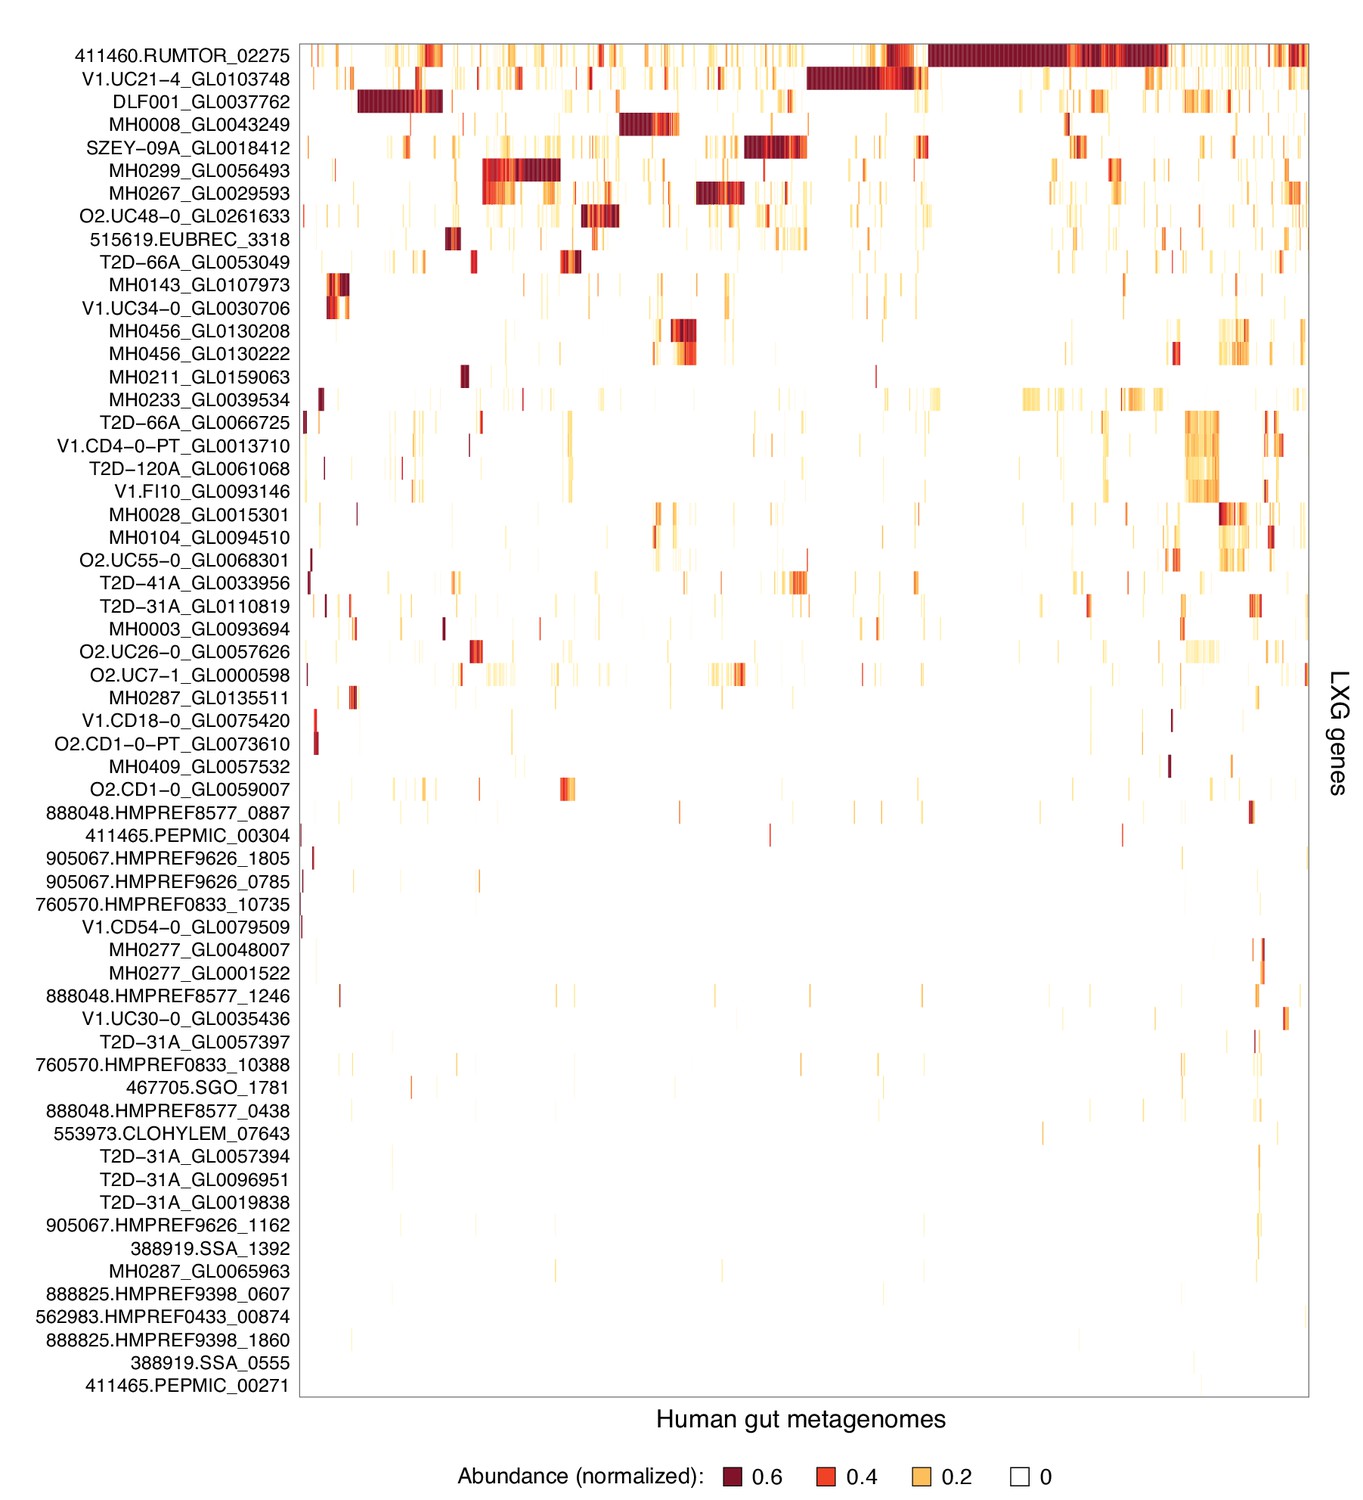
Complete list of LXG genes found in human gut metagenomes.
Heatmap depicting the relative abundance (using logarithmic scale) of LXG genes detected in the Integrated Gene Catalog (IGC). Columns represent individual human gut metagenomes from the IGC database and rows correspond to LXG genes. Row and column ordering was determined by hierarchical clustering using Euclidian distance and complete linkage.
Figure 2 with 1 supplement
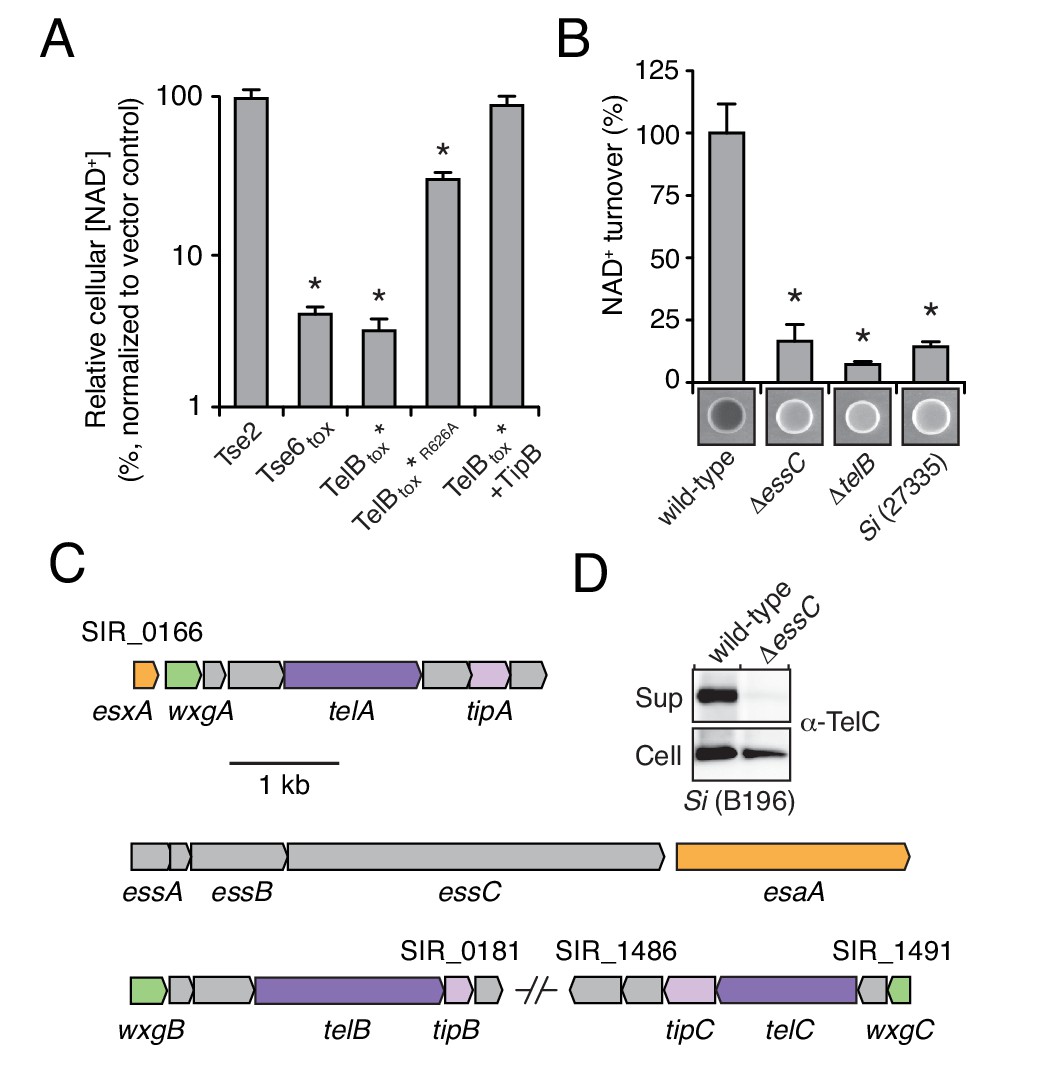
LXG-domain proteins of S. intermedius are secreted by the Esx-pathway.
(A) NAD+ levels in E. coli cells expressing a non-NAD+ -degrading toxin (Tse2), the toxin domain of a known NADase (Tse6tox), an inducibly toxic variant of the C-terminal toxin domain of TelB (TelBtox*), a variant of TelBtox* with significantly reduced toxicity (TelBtox*R626A) and TelBtox* co-expressed with its cognate immunity protein TipB. Cellular NAD+ levels were assayed 60 min after induction of protein expression and were normalized to untreated cells. Mean values (n = 3) ± SD are plotted. Asterisks indicate statistically significant differences in NAD+ levels compared to vector control (p<0.05). (B) NAD+ consumption by culture supernatants from the indicated Si strains. Fluorescent images of supernatant droplets supplemented with 2 mM NAD+ for 3 hr; brightness is proportional to NAD+ concentration and was quantified using densitometry. Mean values ± SD (n = 3) are plotted. Asterisks indicate statistically significant differences in NAD+ turnover compared to wild-type SiB196 (p<0.05). (C) Regions of the SiB196 genome encoding Esx-exported substrates. Genes are colored according to functions encoded (secreted Esx structural components, orange; secreted LXG toxins, dark purple; immunity determinants, light purple; WXG100-like proteins, green; other, grey). (D) Western blot analysis of TelC secretion in supernatant (Sup) and cell fractions of wild-type or essC-inactivated SiB196.
Figure 2—figure supplement 1
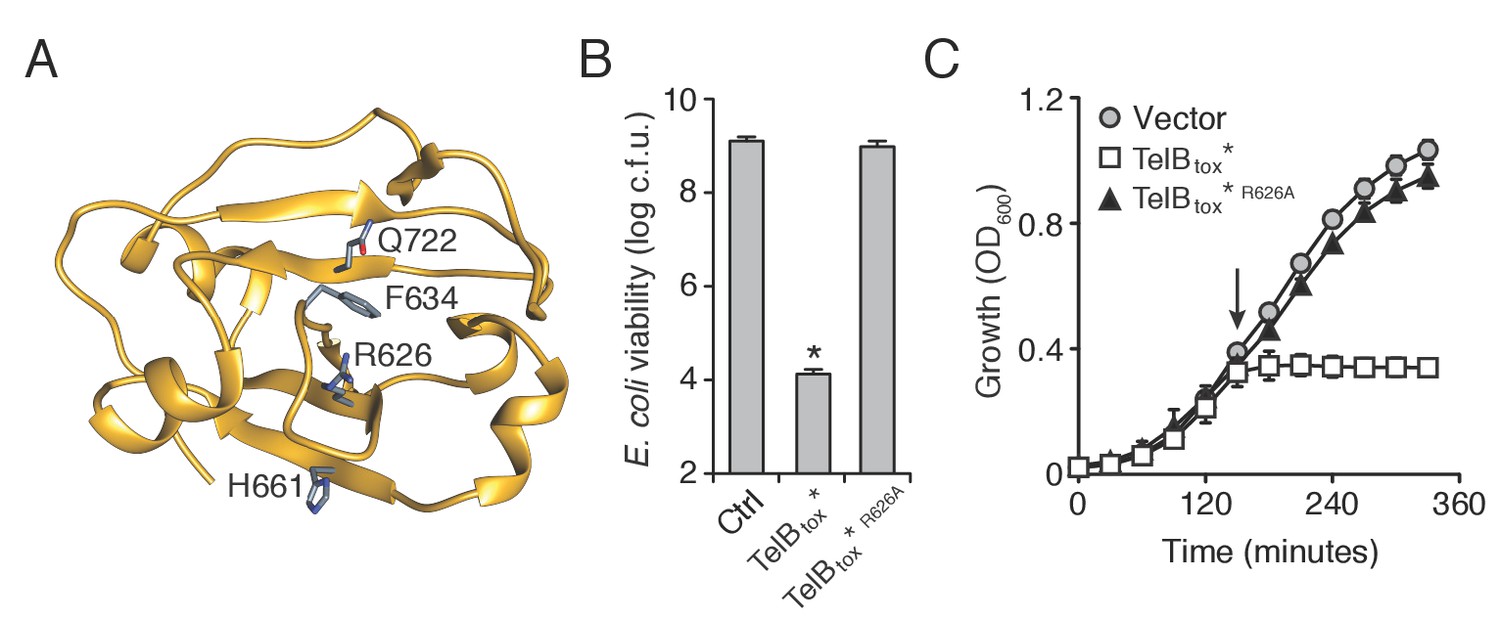
TelB resembles NADase toxins and inhibits the growth of bacteria.
(A) Structural model of TelBtox based on TNT toxin from M. tuberculosis. Conserved residues implicated in NAD+ binding are indicated. (B) Viability of E. coli cells grown on solid media harboring inducible plasmids expressing TelBtox*, TelBtox*R626A or an empty vector control. Mean c.f.u. values ± SD (n = 3) are plotted. Asterisk indicates a statistically significant difference in E. coli viability relative to vector control (p<0.05) (C) Growth in liquid media of E. coli cells expressing plasmids shown in (B). Protein expression was induced at the indicated time (arrow). Error bars indicate ± SD (n = 3).
Figure 3 with 2 supplements

S. intermedius LXG proteins inhibit bacterial growth and mediate contact-dependent interbacterial antagonism.
(A) Viability of E. coli cells grown on solid media harboring inducible plasmids expressing the C-terminal toxin domains of the three identified SiB196 LXG proteins or an empty vector control. (B) SiB196 colonies recovered after transformation with equal concentrations of constitutive expression plasmids carrying genes encoding the indicated proteins. ss-TelCtox is targeted to the sec translocon through the addition of the secretion signal sequence from S. pneumoniae LysM (SP_0107). Error bars represent ± SD (n = 3). Asterisk indicates a statistically significant difference in Si transformation efficiency relative to TelCtox (p<0.05). (C) Viability of E. coli cells grown on solid media harboring inducible plasmids co-expressing the indicated proteins. Empty vector controls are indicated by a dash. Mean c.f.u. values ± SD (n = 3) are plotted. Asterisks indicate statistically significant differences in E. coli viability relative to vector control (p<0.05) (D) Intra-species growth competition experiments between the indicated bacterial strains. Competing strains were mixed and incubated in liquid medium or on solid medium for 30 hr and both initial and final populations of each strain were enumerated by plating on selective media. The competitive index was determined by comparing final and initial ratios of the two strains. Asterisks indicate outcomes statistically different between liquid and solid medium (n = 3, p<0.05). (E) Intra-species growth competition experiments performed as in (D) except for the presence of a filter that inhibits cell-cell contact. No contact, filter placed between indicated donor and susceptible recipient (∆telB ∆tipB) strains; Contact, donor and susceptible recipient strains mixed on same side of filter. Asterisks indicate statistically different outcomes (n = 3, p<0.05). Note that recipient cell populations have an Esx-independent fitness advantage in these experiments by virtue of their relative proximity to the growth substrate. (F) Inter-species growth competition experiments performed on solid or in liquid (E. faecalis) medium between Si wild-type and ∆essC donor strains and the indicated recipient organisms. Si23775 lacks tipA and tipB and is therefore potentially susceptible to TelA and TelB delivered by SiB196. Asterisks indicate outcomes where the competitive index of wild-type was significantly higher than an ∆essC donor strain (n = 3, p<0.05). Genetic complementation of the mutant phenotypes presented in this figure was confounded by inherent plasmid fitness costs irrespective of the inserted sequence. As an alternative, we performed whole genome sequencing on strains ∆essC, ∆telB, ∆telC, ∆telB ∆tipB, and ∆telC ∆tipC, which confirmed the respective desired mutation as the only genetic difference between these strains. Sequences of these strains have been deposited to the NCBI Sequence Read Archive (BioProject ID: PRJNA388094).
Figure 3—figure supplement 1
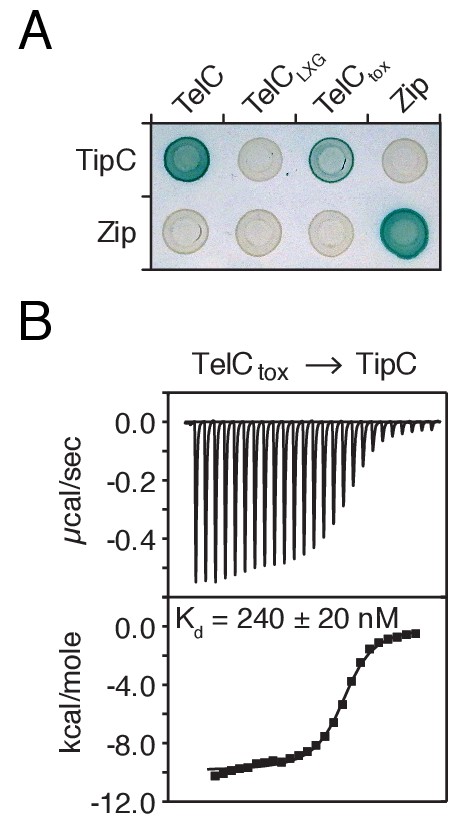
TelC directly interacts with its cognate immunity protein TipC.
(A) Bacterial two-hybrid assay for interaction between TelC and TipC. Adenylate cyclase subunit T25 fusions (TipC and Zip control protein) and T18 fusions (TelC and fragments thereof) were coexpressed in the indicated combinations. Successful interaction results in production of blue pigment. (B) ITC analysis indicates TelCtox and mature TipC (TipCΔSS) interact with nanomolar affinity. The top panel displays the heats of injection, whereas the bottom panel shows the normalized integration data as a function of the syringe and cell concentrations.
Figure 3—figure supplement 2
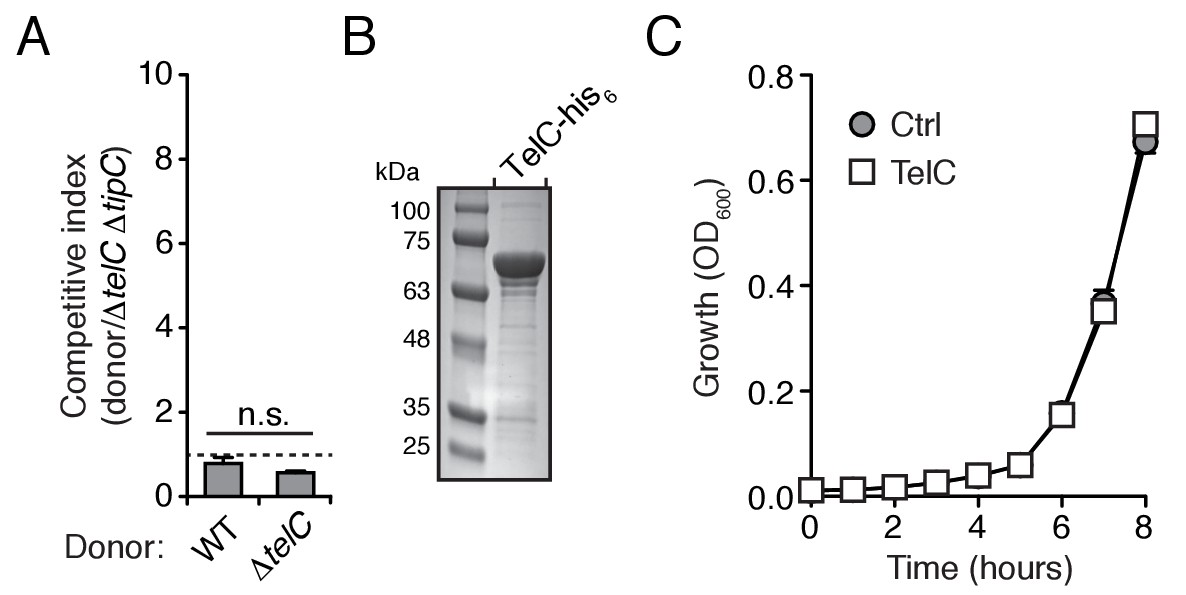
TelC levels elevated by high cell density or addition of purified protein fail to yield cellular intoxication in liquid media.
(A) Intra-species growth competition experiments between the indicated Si B196 strains. Competing strains were mixed at a ratio of 40:1 [donor:recipient] and concentrated to OD600nm = 20. Competition outcomes were determined after 24 hr by enumerating c.f.u. on selective media. (B) Coomassie stained gel of purified TelC-his6. (C) Growth in liquid media of SiB196ΔtelC ΔtipC cells incubated with buffer (Ctrl) or 0.1 mg/mL TelC-his6. Error bars indicate ± SD (n = 3).
Figure 4 with 3 supplements
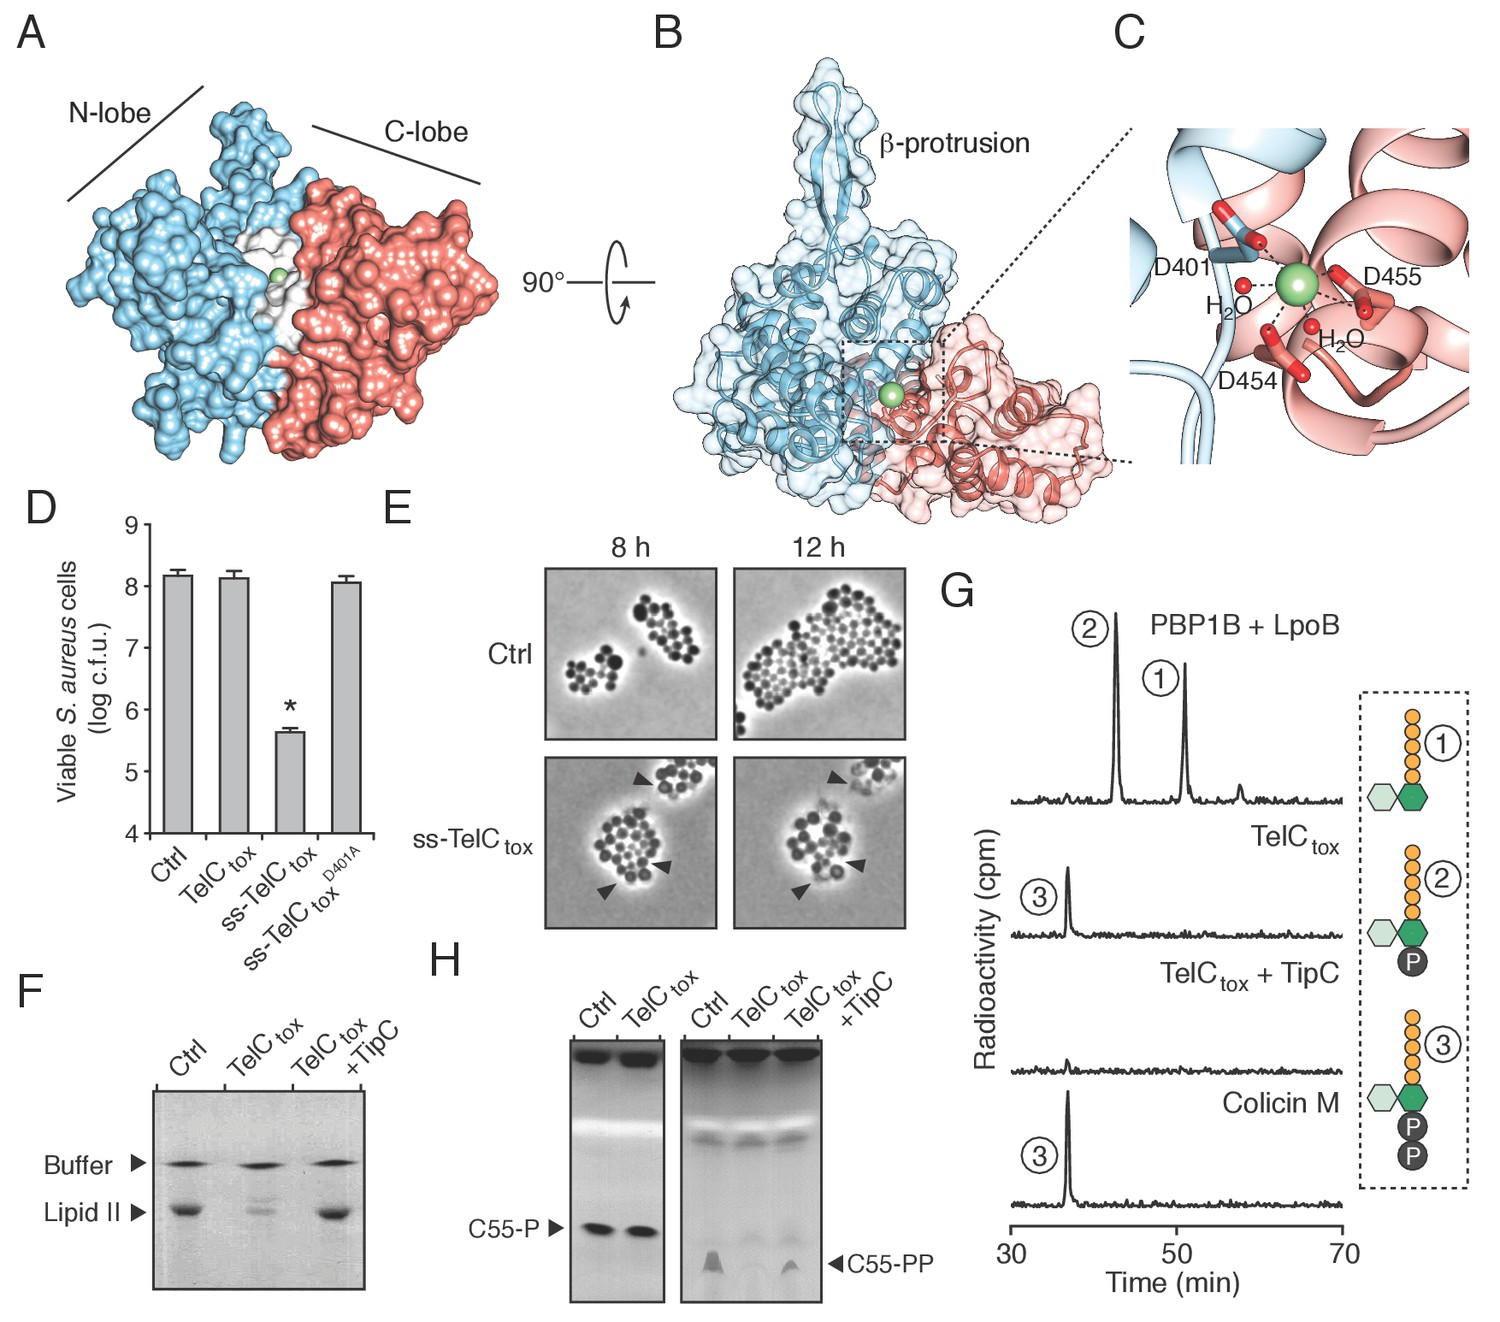
TelC is a calcium-dependent lipid II phosphatase.
(A) Space-filling representation of the 2.0 Å resolution TelCtox X-ray crystal structure. Protein lobes (red and blue), active site cleft (white) and Ca2+ (green) are indicated. (B) TelCtox structure rotated as indicated relative to (A) with transparent surface revealing secondary structure. (C) Magnification of the TelC active site showing Ca2+ coordination by conserved aspartate residues and water molecules. (D) Viability of S. aureus cells harboring inducible plasmids expressing the indicated proteins or a vector control. ss-TelCtox is targeted for secretion through the addition of the signal sequence encoded by the 5’ end of the hla gene from S. aureus. Mean c.f.u. values ± SD (n = 3) are plotted. Asterisk indicates a statistically significant difference in S. aureus viability relative to vector control (p<0.05) (E) Representative micrographs of S. aureus expressing ss-TelCtox or a vector control. Frames were acquired eight and 12 hr after spotting cells on inducing growth media. (F) Thin-layer chromotography (TLC) analysis of reaction products from incubation of synthetic Lys-type lipid II with buffer (Ctrl), TelCtox, or TelCtox and its cognate immunity protein TipC. (G) Partial HPLC chromatograms of radiolabeled peptidoglycan (PG) fragments released upon incubation of Lys-type lipid II with the indicated purified proteins. Schematics depict PG fragment structures (pentapeptide, orange; N-acetylmuramic acid, dark green; N-acetylglucosamine, light green; phosphate, black). Known fragment patterns generated by PBP1B + LpoB and colicin M serve as controls. (H) TLC analysis of reaction products generated from incubation of buffer (Ctrl), TelCtox or TelCtox and TipC with undecaprenyl phosphate (C55–P) (left) or undecaprenyl pyrophosphate (C55–PP) (right).
Figure 4—figure supplement 1

TelC contains an aspartate-rich motif required for toxicity.
(A) Sequence logo representation of the aspartate-rich motif found among TelC orthologous proteins. Numbers indicate the amino acid positions in TelC from SiB196. (B) Image of SiB196 colonies recovered from transformation with plasmids expressing the indicated TelCtox variants.
Figure 4—figure supplement 2
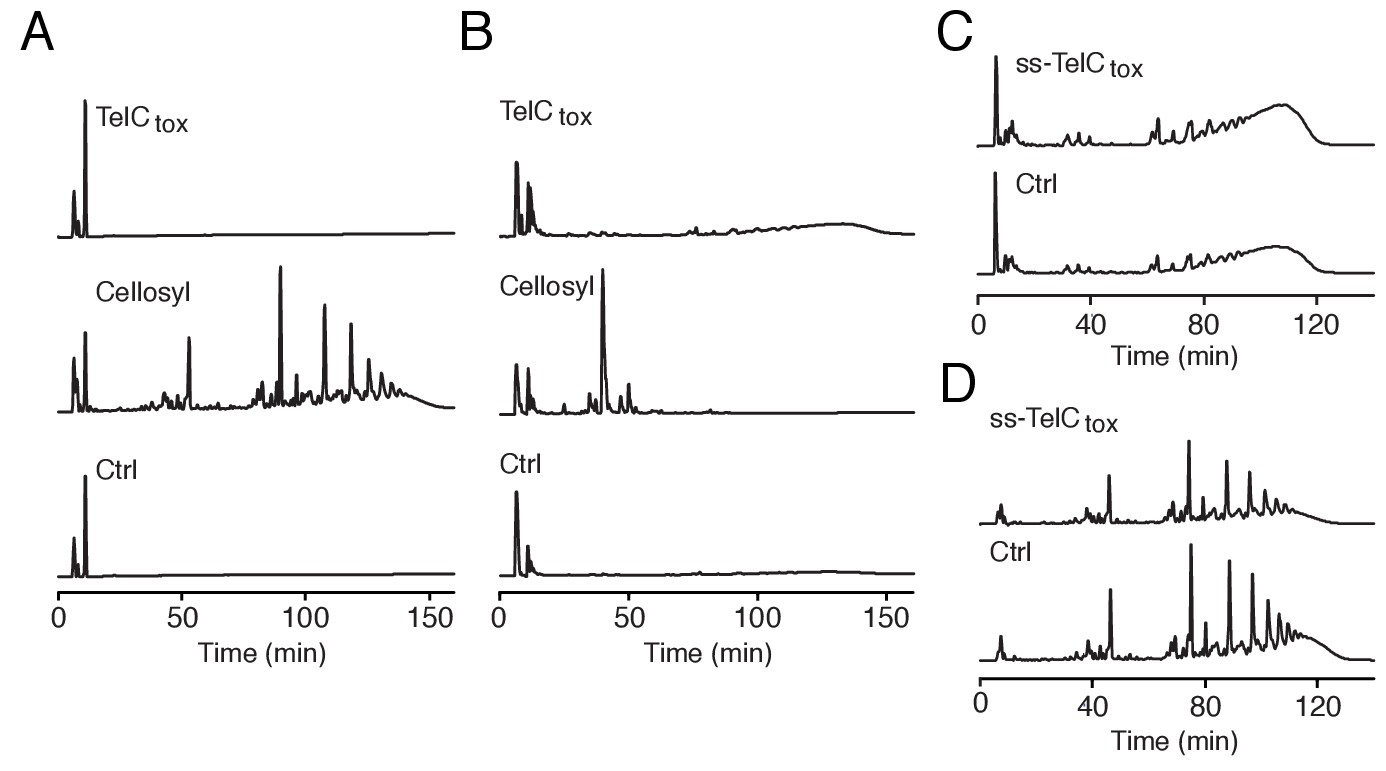
TelC does not degrade intact Gram-positive sacculi.
(A and B) HPLC analysis of muropeptides generated by incubation of TelCtox, cellosyl muramidase or buffer with either S. aureus peptidoglycan sacculi (A) or lysostaphin endopeptidase treated (non-cross-linked) peptidoglycan sacculi (B). (C and D) HPLC analysis of S. aureus cell wall extracts from cells expressing ss-TelCtox or a vector control. Prior to chromatographic separation, cell walls were treated with either lysostaphin endopeptidase (C) or cellosyl muramidase (D).
Figure 4—figure supplement 3
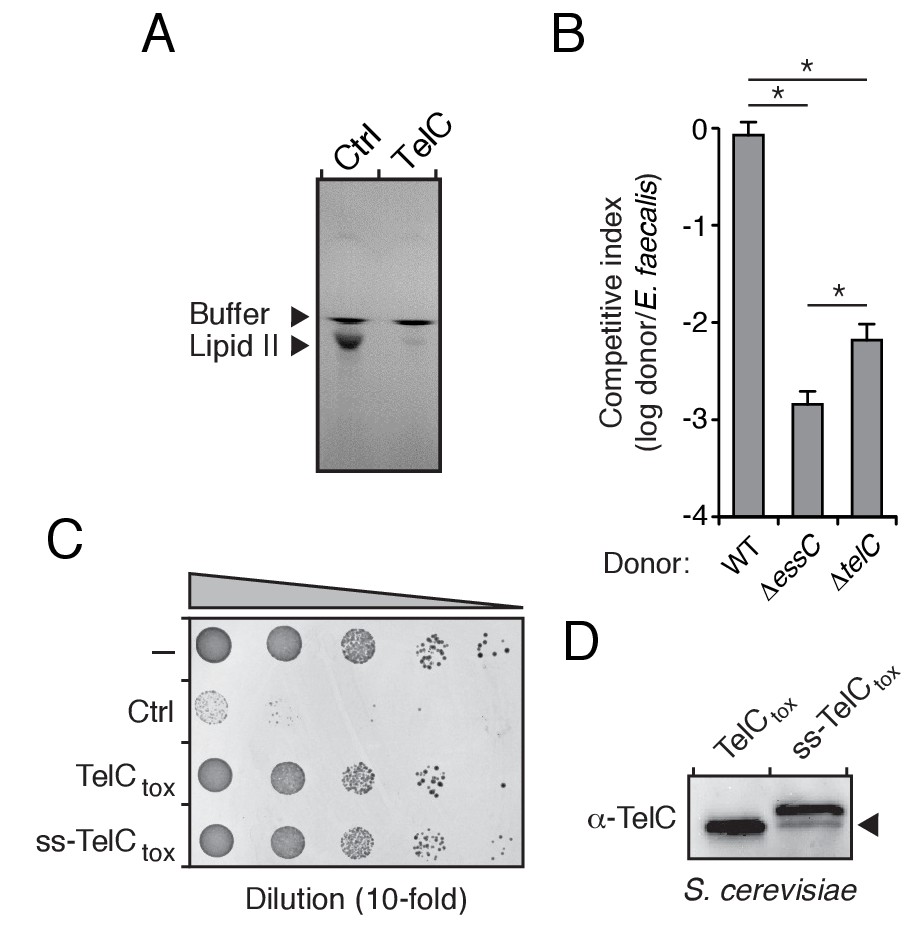
TelC degrades lipid II, contributes to interbacterial antagonism and is not toxic to yeast cells.
(A) TLC analysis of reaction products from incubation of synthetic Lys-type lipid II with buffer (Ctrl) or TelC. (B) Inter-species growth competition experiments performed on solid medium between the indicated Si donor strains and E. faecalis. Asterisks indicate statistically significant differences in competitive indices (n = 3, p<0.05). (C) Growth of Saccharomyces cerevisiae upon expression of native TelCtox, or a derivative in which an added signal sequence targets the protein to the yeast secretory pathway (ss-TelCtox). Yeast strains carrying the empty vector or a toxic protein (Ctrl) are included for comparison. (D) Western blot analysis of TelCtox and ss-TelCtox in Saccharomyces cerevisiae. Black arrow denotes proteolytically processed ss-TelCtox.
Figure 5 with 1 supplement
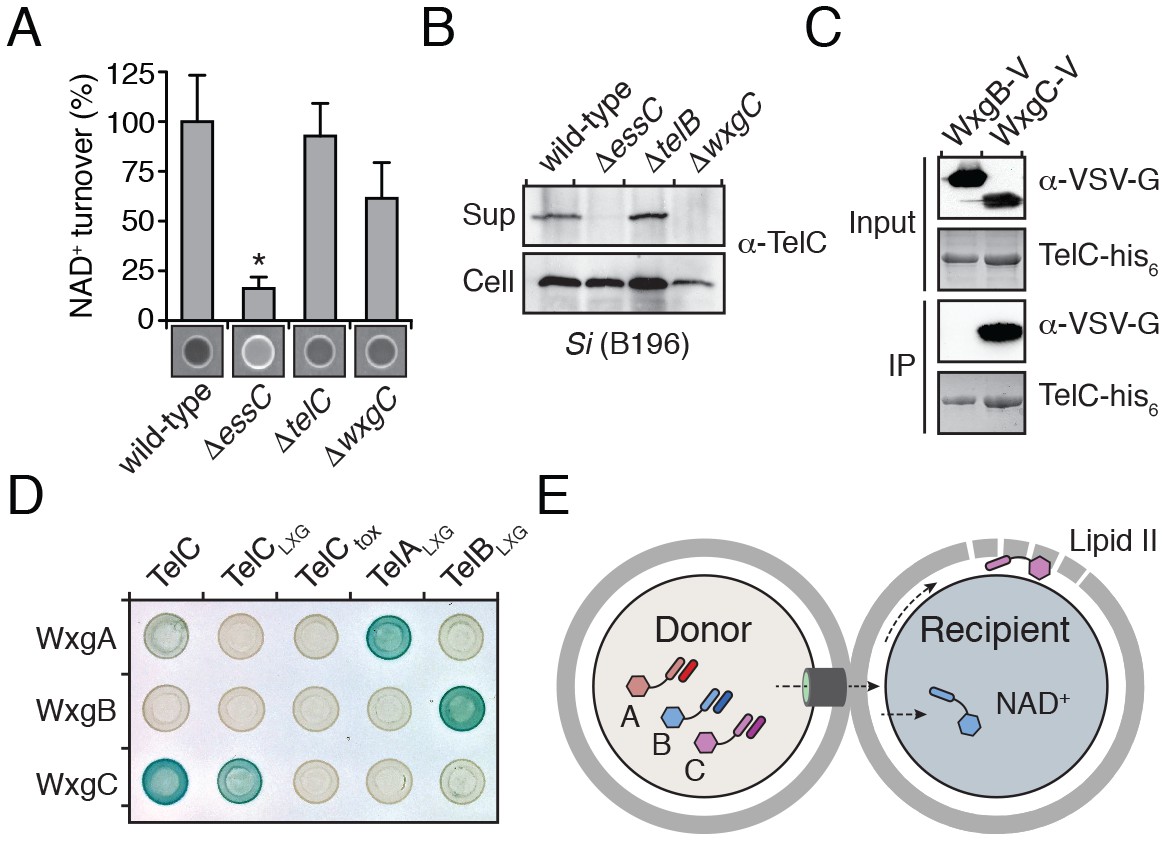
LXG domain proteins are independently secreted and require interaction with cognate WXG100-like partners for export.
(A) NAD+ consumption assay of culture supernatants of the indicated SiB196 strains. Mean densitometry values ± SD (n = 3) are plotted. Asterisk indicates statistically significant difference in NAD+ turnover compared to wild-type SiB196 (p<0.05). (B) Western blot analysis of TelC secretion in supernatant (Sup) and cell fractions. (C) Western blot and coomassie stain analysis of CoIP assays of TelC-his6 co-expressed with either WxgB-V or WxgC-V proteins. (D) Bacterial two-hybrid assay for interaction between Tel and WXG100-like proteins. Adenylate cyclase subunit T25 fusions (WXG100-like proteins) and T18 fusions (Tel proteins and fragments thereof) were co-expressed in the indicated combinations. Bait-prey interaction results in blue color production. (E) Model depicting Esx-dependent cell-cell delivery of LXG toxins between bacteria. The schematic shows an Si donor cell containing cognate TelA-C (light shades) and WxgA-C (dark shades) pairs intoxicating a susceptible recipient cell. Molecular targets of LXG toxins identified in this study are depicted in the recipient cell.
Figure 5—figure supplement 1
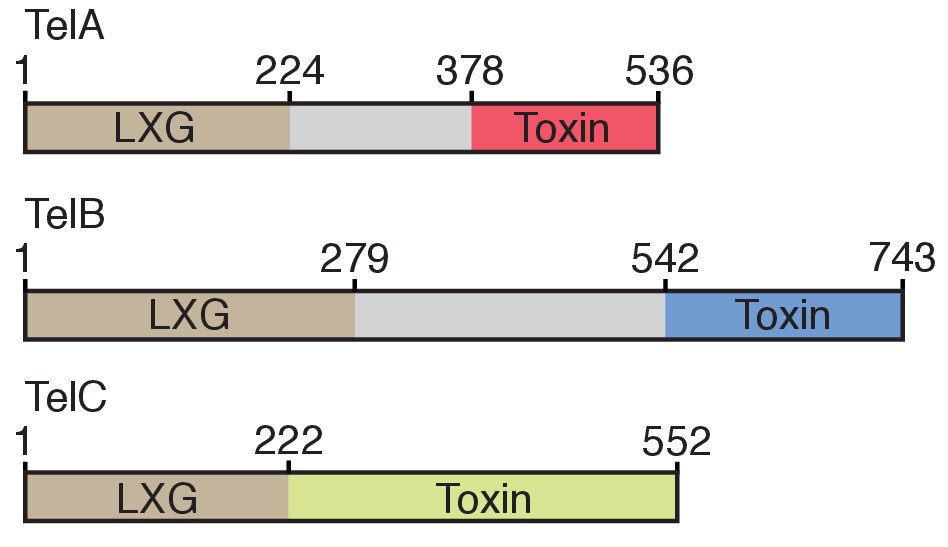
Domain architecture of the Tel proteins.
The boundaries for the LXG and toxin domains for each protein are based on the protein-protein interaction data and bacterial toxicity assays, respectively, described in this work.
Author response image 1

TelC does not irreversibly associate with polycarbonate membranes to a detectable level.
The indicated quantity of TelC (Before) was incubated with 16 cm2 of filter material in PBS. After an extended incubation, the filter was removed and the protein was again quantified (After).
Author response image 2
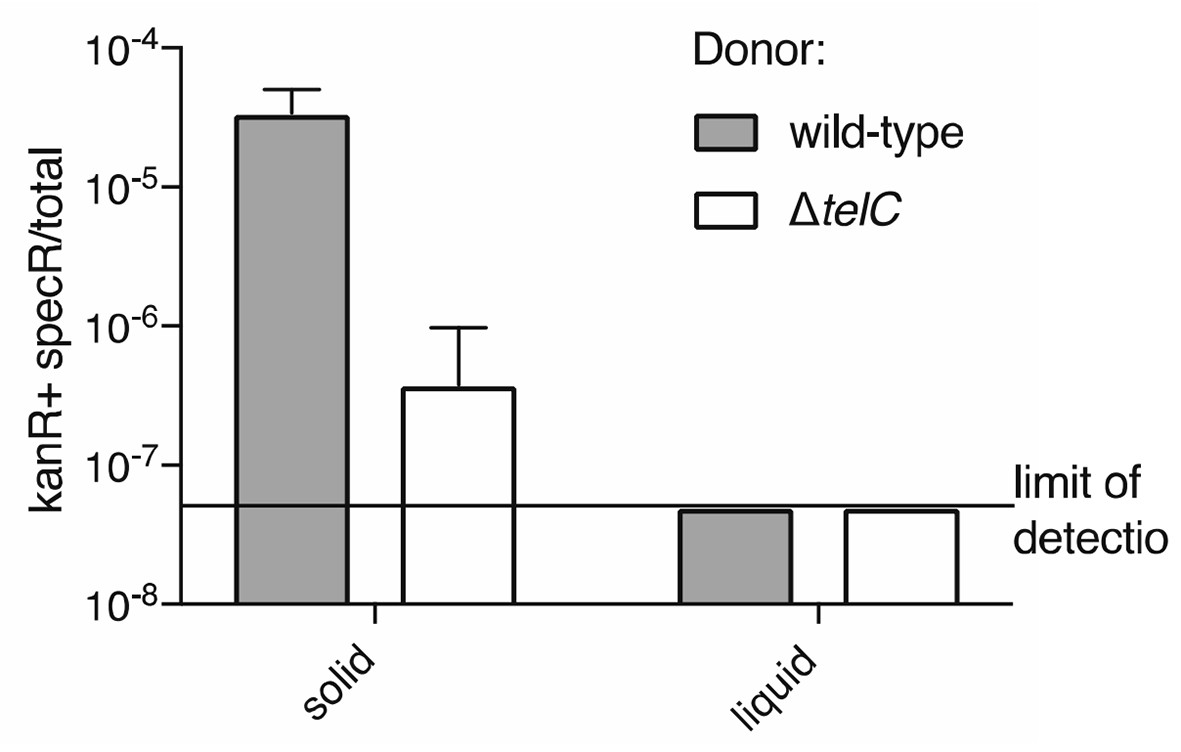
Frequency of double-resistant colonies resulting from co-culture of a streptomycin resistant donor and a kanamycin resistant recipient is elevated under conditions conducive to intoxication via intracellular transfer of TelC.
https://doi.org/10.7554/eLife.26938.023
Author response image 3

The Esx-pathway of S. intermedius mediates inhibition of E. faecalis growth.
CFUs were determined by plating on selective media after 24 hours growth of co-cultures. Populations of E. faecalis were equal between cultures at the start of the experiment.
Author response image 4
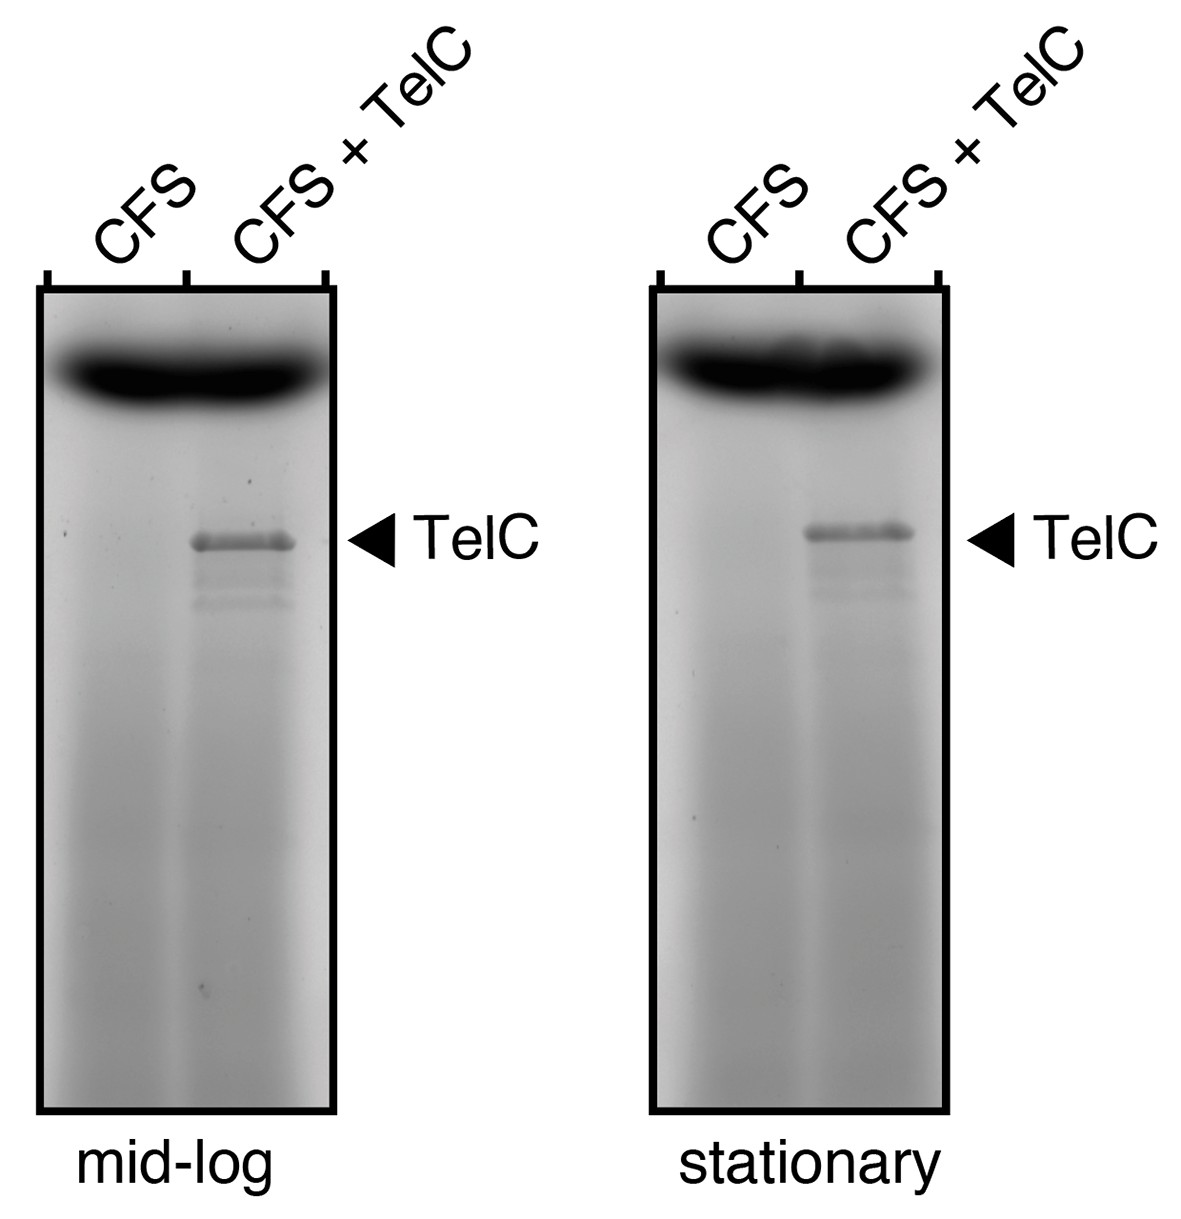
TelC levels in cell free supernatants (CFS) of S. intermedius do not approach 0.1 mg/mL.
SDS-PAGE analysis of the supernatant fraction of S. intermedius cells in mid-log or stationary growth. To examine the relative levels of endogenous TelC versus the exogenous purified active TelC we applied, supernatants were doped with 0.1 mg/mL TelC (CFS + TelC) and the protein was visualized alongside CFS alone.
Videos
Video 1
Time-lapse series of S. aureus USA300 pEPSA5 growth.
Cells were imaged every 10 min.
Video 2
Time-lapse series of S. aureus USA300 pEPSA5::ss-telCtox growth.
Cells were imaged every 10 min.
Tables
Table 1
The Esx-dependent extracellular proteome of S. intermedius B196.
| Locus tag | Wild-type | ΔessC | Relative abundance (Wild-type/ΔessC) | Esx function | Name |
|---|---|---|---|---|---|
| SIR_0169* | 19.67† | 0 | Not detected in ΔessC | LXG protein‡ | TelA |
| SIR_0176 | 14.67 | 0 | Not detected in ΔessC | Structural component | EsaA |
| SIR_1489 | 12.00 | 0 | Not detected in ΔessC | LXG protein | TelC |
| SIR_1516 | 9.33 | 0 | Not detected in ΔessC | - | Trigger Factor |
| SIR_0179 | 5.33 | 0 | Not detected in ΔessC | LXG protein | TelB |
| SIR_0166 | 140.00 | 17.48 | 8.01 | Structural component | EsxA |
| SIR_0273 | 15.33 | 2.28 | 6.73 | - | - |
| SIR_1626 | 15.00 | 2.28 | 6.58 | - | GroEL |
| SIR_0832 | 12.33 | 8.36 | 1.48 | - | Enolase |
| SIR_1904 | 49.00 | 37.24 | 1.32 | - | Putative serine protease |
| SIR_1382 | 26.00 | 19.76 | 1.32 | - | Fructose-bisphosphate aldolase |
| SIR_0648 | 21.67 | 17.48 | 1.24 | - | 50S ribosomal protein L7/L12 |
| SIR_0212 | 47.00 | 39.52 | 1.19 | - | Elongation Factor G |
| SIR_0081 | 8.67 | 7.60 | 1.14 | - | Putative outer membrane protein |
| SIR_1676 | 16.33 | 14.44 | 1.13 | - | phosphoglycerate kinase |
| SIR_1523 | 12.67 | 12.92 | 0.98 | - | DnaK |
| SIR_1154 | 10.33 | 10.64 | 0.97 | - | Putative bacteriocin accessory protein |
| SIR_1027 | 63.00 | 67.64 | 0.93 | - | Elongation Factor Tu |
| SIR_1455 | 14.00 | 15.96 | 0.88 | - | - |
| SIR_0758 | 13.00 | 15.20 | 0.86 | - | - |
| SIR_1387 | 9.33 | 11.40 | 0.82 | - | Putative extracellular solute-binding protein |
| SIR_0492 | 12.33 | 15.20 | 0.81 | - | Putative adhesion protein |
| SIR_1033 | 17.67 | 24.32 | 0.73 | - | - |
| SIR_1359 | 14.00 | 19.76 | 0.71 | - | Penicillin-binding protein 3 |
| SIR_0011 | 12.33 | 17.48 | 0.71 | - | Beta-lactamase class A |
| SIR_1546 | 8.33 | 12.16 | 0.69 | - | - |
| SIR_0040 | 101.67 | 160.36 | 0.63 | - | Putative stress protein |
| SIR_1608 | 11.00 | 18.24 | 0.60 | - | Putative endopeptidase O |
| SIR_1549 | 7.33 | 12.16 | 0.60 | - | - |
| SIR_1675 | 79.00 | 132.24 | 0.60 | - | Putative cell-surface antigen I/II |
| SIR_1418 | 11.33 | 21.28 | 0.53 | - | Putative transcriptional regulator LytR |
| SIR_0080 | 11.00 | 21.28 | 0.52 | - | - |
| SIR_1025 | 28.33 | 63.84 | 0.44 | - | Lysozyme |
| SIR_0113 | 10.67 | 24.32 | 0.44 | - | - |
| SIR_0297 | 8.33 | 24.32 | 0.34 | - | - |
-
*Rows highlighted in green correspond to proteins linked to the Esx pathway.
-
†Values correspond to average SC (spectral counts) of triplicate biological replicates for each strain.
-
‡Functional link of LXG proteins to Esx secretion pathway defined in the study.
Table 2
X-ray data collection and refinement statistics.
| TelC202-CT (Semet) | |
|---|---|
| Data Collection | |
| Wavelength (Å) | 0.979 |
| Space group | C2221 |
| Cell dimensions | |
| a, b, c (Å) | 127.4, 132.7, 58.3 |
| α, β, γ (°) | 90.0, 90.0, 90.0 |
| Resolution (Å) | 49.20–1.98 (2.03–1.98)* |
| Total observations | 891817 |
| Unique observations | 34824 |
| Rpim (%) | 6.6 (138.5) |
| I/σI | 11.4 (0.8) |
| Completeness (%) | 100.0 (99.9) |
| Redundancy | 25.6 (23.4) |
| Refinement | |
| Rwork / Rfree (%) | 22.4/24.6 |
| Average B-factors (Å2) | 53.8 |
| No. atoms | |
| Protein | 2539 |
| Ligands | 3 |
| Water | 145 |
| Rms deviations | |
| Bond lengths (Å) | 0.008 |
| Bond angles (°) | 0.884 |
| Ramachandran plot (%) | |
| Total favored | 96.9 |
| Total allowed | 99.7 |
| Coordinate error (Å) | 0.28 |
| PDB code | 5UKH |
-
*Values in parentheses correspond to the highest resolution shell.
Additional files
-
Supplementary file 1
Strains used in this study.
- https://doi.org/10.7554/eLife.26938.020
-
Supplementary file 2
Plasmids used in this study.
- https://doi.org/10.7554/eLife.26938.021
Download links
A two-part list of links to download the article, or parts of the article, in various formats.
Downloads (link to download the article as PDF)
Open citations (links to open the citations from this article in various online reference manager services)
Cite this article (links to download the citations from this article in formats compatible with various reference manager tools)
A broadly distributed toxin family mediates contact-dependent antagonism between gram-positive bacteria
eLife 6:e26938.
https://doi.org/10.7554/eLife.26938


