Cell size sensing in animal cells coordinates anabolic growth rates and cell cycle progression to maintain cell size uniformity
- Harvard Medical School, United States
- The Hospital for Sick Children, Canada
Figures
Figure 1 with 2 supplements

Small cells spend more time in G1.
(A–B) Two alternate models for the expected behavior of mean cell size as a function of cell age. (A) If G1 exit is independent of cell size, cell size should depend exclusively on cell age, regardless of cell cycle stage. (B) If the G1/S transition is regulated by a cell size checkpoint, cell size should reflect both cell age and cell cycle stage. S-phase cells are expected to have a larger mean size than G1 cells of the same age. We used time-lapse microscopy to image live HeLa and Rpe1 cells for a period of 1–3 days. At the end of the imaging session, cells were immediately fixed and stained with AlexaFluor 647-Succinimidyl Ester (SE-A647). Mean cell size and ‘cell age’ were determined as described in the Materials and methods as well as the Results sections. (C) Mean cell size as a function of age in HeLa cells. Shaded region marks 90% confidence intervals calculated by bootstrapping. (D) Mean size of G1 (red) and post-G1 (blue) HeLa cells as a function of cell age. Post-G1 cells are larger than G1 cells of the same age (student’s t-test p<3.92e-04). The discontinuous leap in average cell size that accompanies the G1/S transition does not imply a discontinuity in the growth curve of individual cells. Instead, differences between the average size of G1 cells and S phase cells are explained by the selective transition of large, but not small cells into S phase (i.e. a cell size checkpoint) as depicted in panel (B) of this figure. Data shown in (C) and (D) are representative examples of four biological replicates (full experimental repeats), n = 5537 cells. The raw data and source code necessary to generate (C–D) are included in Figure 1—source data 1.
-
Figure 1—source data 1
File contains the source code (Figure_1.m) and source data necessary to generate Figure 1C and D using Matlab.
Source data include individual measurements of cell age, cell size (total SE-A647 intensity), and cell cycle stage (total mAG-hGem intensity).
- https://doi.org/10.7554/eLife.26957.006
Figure 1—figure supplement 1
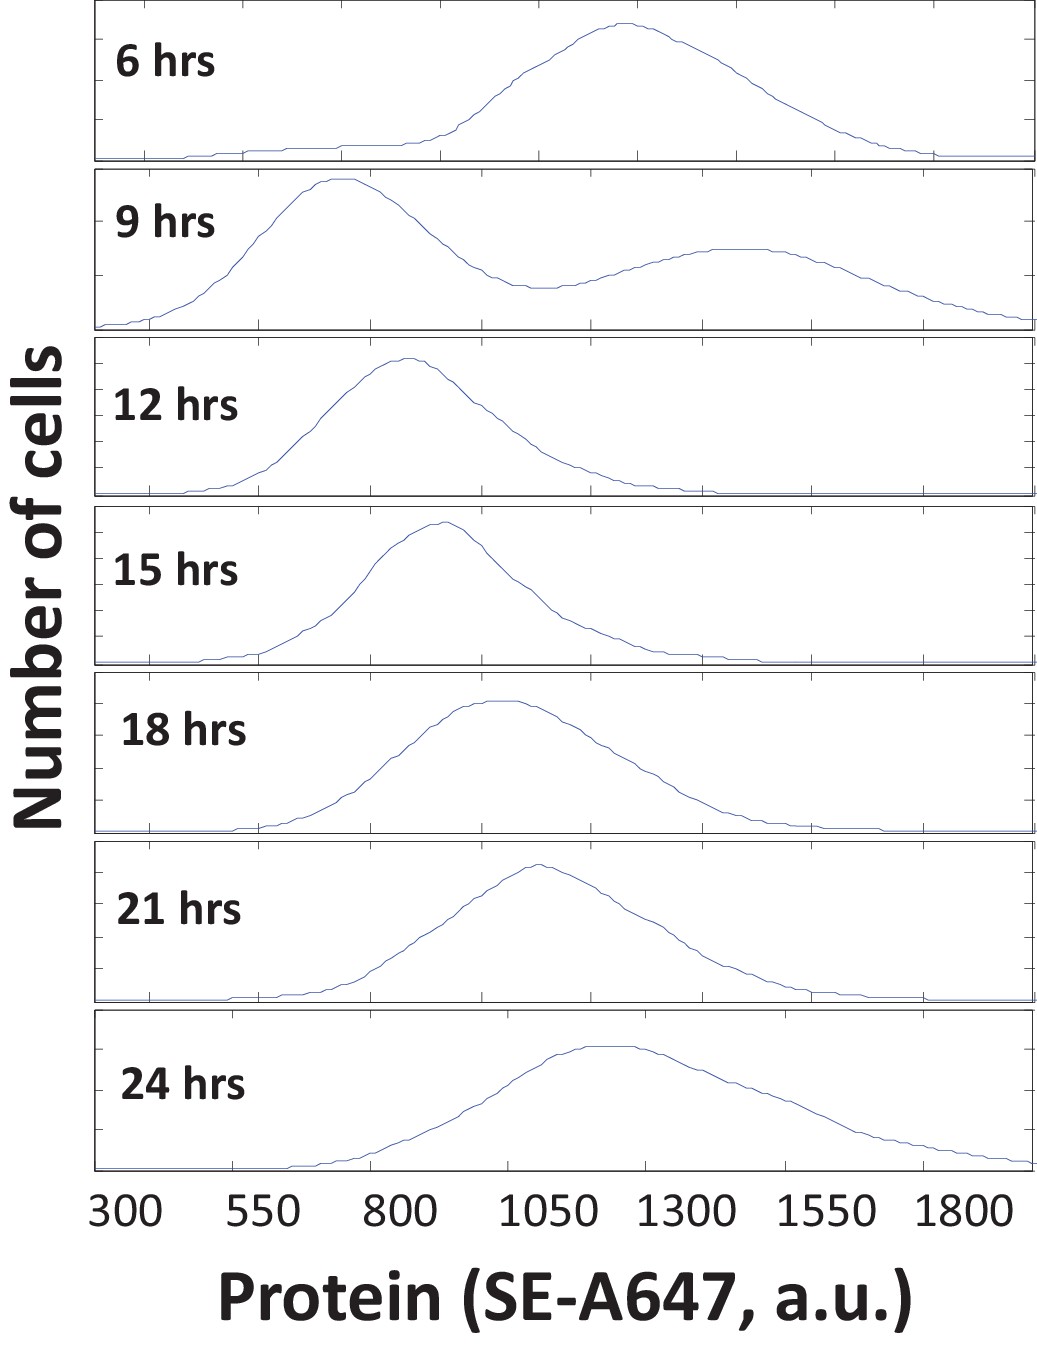
Protein mass quantification with SE-A647.
To measure the total protein content of single cells, we used the amine-reactive fluorescent dye AlexaFluor 647-Succinimidyl Ester (SE-A647) to covalently label lysine residues, as described previously (Kafri et al., 2013). The integrated fluorescence intensity of an SE-A647-stained cell reflects the amount of protein it contains and correlates well with its total dry mass measured by quantitative phase microscopy (Kafri et al., 2013). To demonstrate the utility of this method, we labeled the S-phase HeLa cells in an unsynchronized population with a 20 minute-long pulse of EdU and then used SE-A647 staining to measure the protein content of the EdU-positive cells at various time intervals after pulse-labeling. Our measurement is sensitive enough to detect the change in protein mass that occurs in less than three hours of growth. Six hours after labeling, most labelled cells are still in S-phase or G2. Nine hours after labeling, labeled cells have begun to divide, so the distribution is bimodal with its first peak (representing newborn cells) at approximately half the size of its second peak (representing older cells). Between twelve and twenty-four hours after labeling, all labeled cells have divided, and the size distribution gradually shifts to the right again as the cells grow.
Figure 1—figure supplement 2
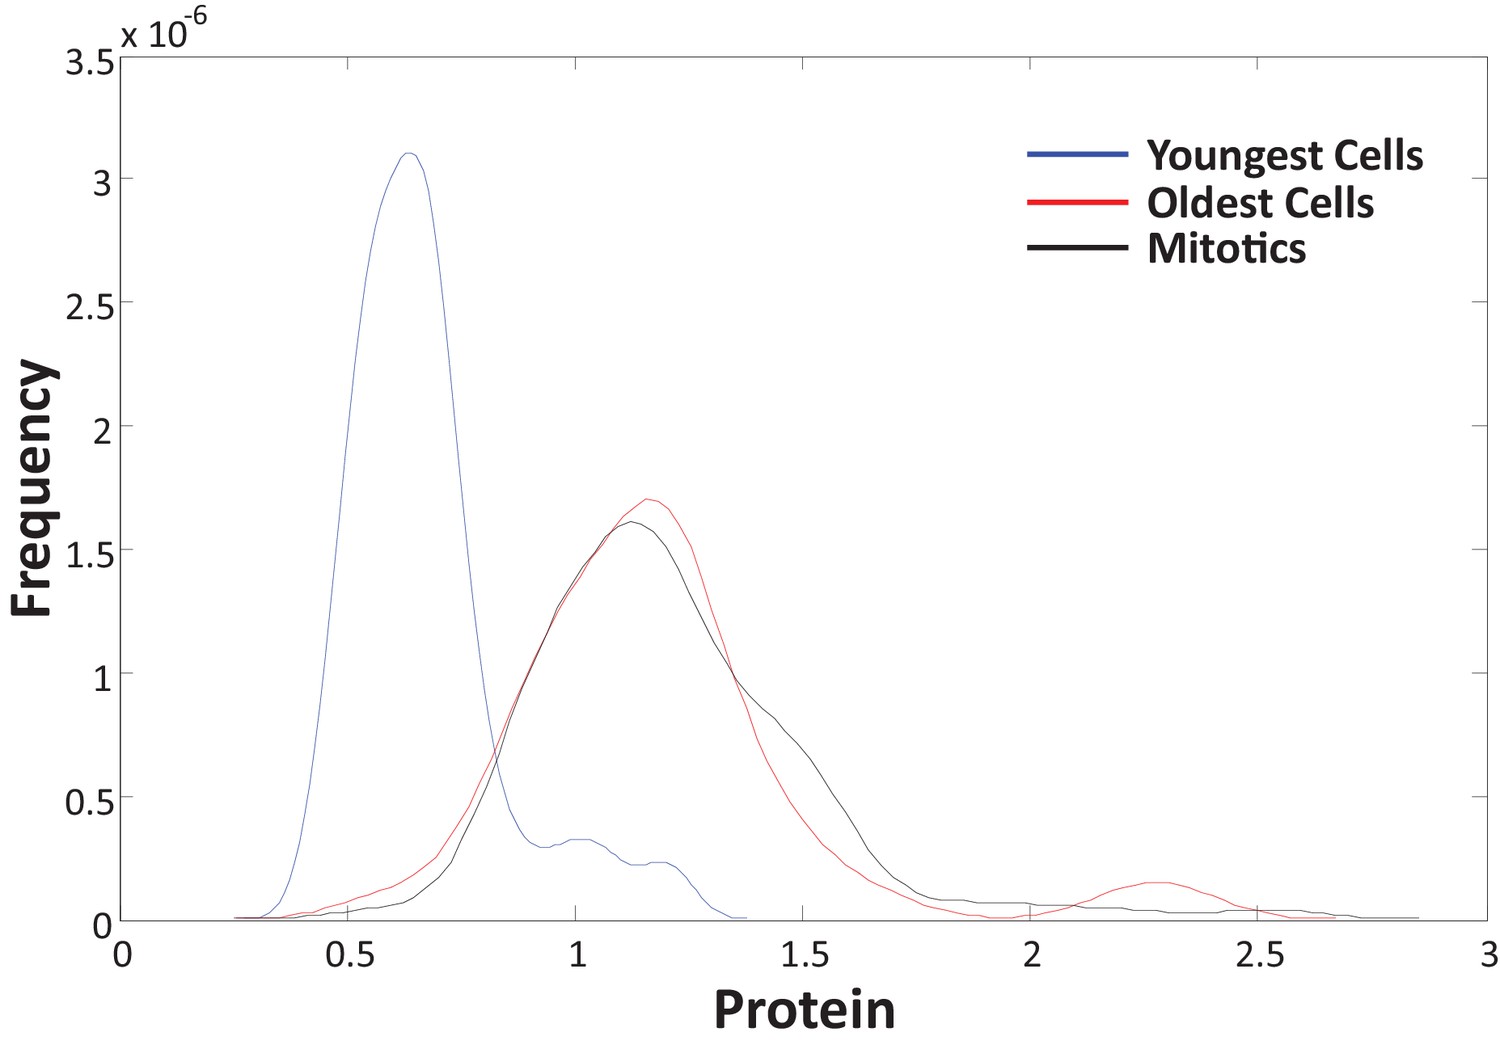
To confirm that the data in Figure 1C represent growth over the course of the entire cell cycle, we independently measured the size (SE-A647 intensity) of a sample of mitotic cells identified by their rounded shape and distinctive halo in phase-contrast microscopy.
Comparing the size distribution of the youngest cells (first 1.5 hr after birth) to that of mitotics (identified by their rounded shape) shows a doubling in cell size over the course of the cell cycle. As expected, the size distribution of mitotics is identical to that of the oldest cells tracked.
Figure 2 with 3 supplements
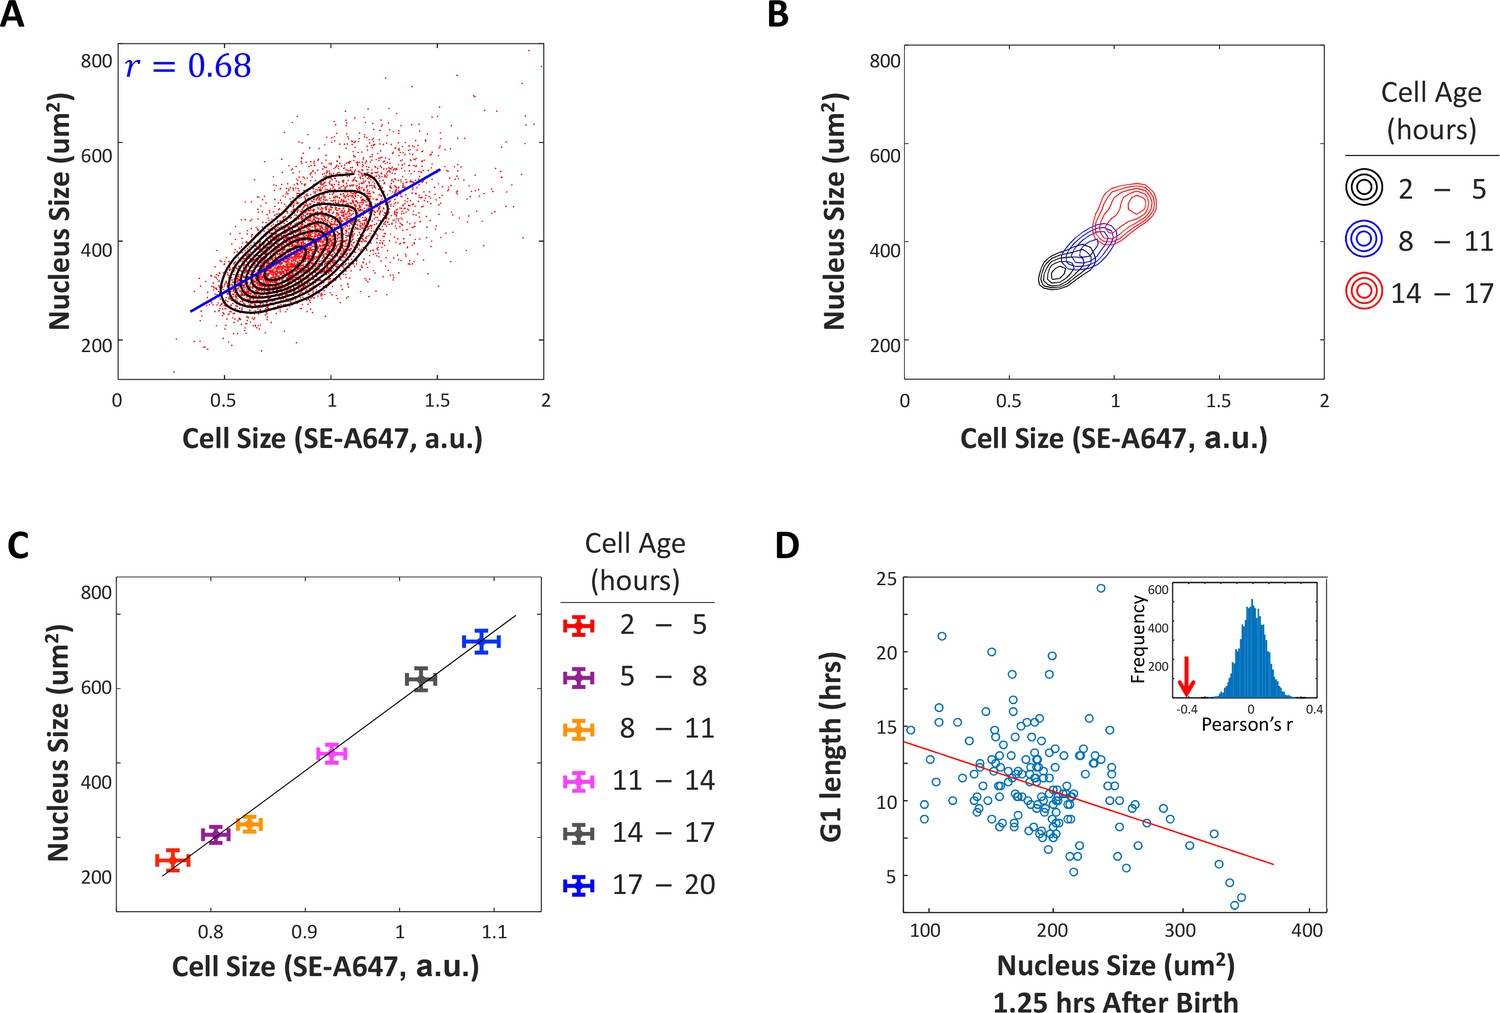
G1 length is negatively correlated with nuclear size at birth.
(A) A significant correlation between cell size and nucleus size suggests that nucleus size is an adequate proxy measurement of cell size. We imaged unsynchronized, unperturbed HeLa cells with time-lapse microscopy and monitored the size of their nuclei (estimated as the area covered by the nucleus in a widefield image), as a proxy for cell size. Datapoints (red) represent single-cell measurements of cell size (SE-A647 fluorescence) and nucleus size (projected area) in a population of HeLa cells. Also shown is the linear regression (blue line) between cell size and the size of the nucleus and the calculated Pearson correlation (r=0.68). Black contour lines represent the calculated joint probability density function, describing the frequency of cells for every given paired value of cell size and nucleus size. (B) Joint probability density functions of cell size and nucleus size for cells of different age groups, that is cells 2-5 hours after their most recent cell division (black), cells 8-11 hours after cell division (blue), and cells 14-17 hours after cell division (red). For (A–C), single cell measurements of cell age, cell size and nucleus size were performed on a large population of HeLa cells, as described for Figure 1. Measurements were performed in multiplex, such that all three parameters were quantified for each individual cell. We then sorted the single cell measurements into bins defined by cell age and separately calculated the joint probability of cell size and nucleus size for each age group. The figure demonstrates that the correlation of cell size and nucleus size consistently persists for cells of different ages. (C) Average cell size and nucleus size for cells of different age groups, as described in (B). This figure shows that as cells age, they increase in both nucleus size and cell size. Error bars represent standard error calculated as . The significant separation of the datapoints (in relation to errorbars) demonstrates that our cell size measurements and nucleus size measurements are sufficiently accurate to resolve average size differences that result from < 3 hours of growth, approximately 15% of cell cycle duration. (D) Size (area covered in widefield fluorescence image) of HeLa nucleus 1.25 hours after birth vs. G1 duration. Line shows least-squares linear fit. Pearson’s r = −0.41, p=6.7 x 10⁻⁸ (p-value calculated using a Student's t distribution for transformation of the correlation). Inset shows distribution of Pearson’s r-values generated by randomizing the data, with arrow marking the r-value of non-randomized data. Data shown in (D) are representative example of four biological replicates, n=158 cells. The raw data and source code necessary to generate (A–D) are included in Figure 2—source data 1.
-
Figure 2—source data 1
File contains the source code and source data necessary to generate Figure 2 and Figure 2—figure supplement 2 using Matlab.
Figure_2ABC_2S2.m generates Figures 2A, B and C, as well as Figure 2—figure supplement 2. Figure_2D.m generates Figure 2D. Source data include individual measurements of cell age, cell size (total SE-A647 intensity), and nucleus size.
- https://doi.org/10.7554/eLife.26957.011
Figure 2—figure supplement 1

Monitoring growth of the nucleus in cycling cells.
(A) Images show a HeLa cell expressing the Fucci cell cycle reporters (Sakaue-Sawano et al., 2008) at several time points during a single cell cycle. Widefield fluorescence images of mKO2-hCdt1 (red) and mAG-hGem (green) are overlaid on grayscale phase-contrast microscopy image. (B) To monitor nuclear growth over time in single cells, widefield fluorescence and phase contrast images like those shown in (A) were collected at 15 min intervals, as described in Materials and methods: Time-lapse microscopy. Cells were tracked yielding trajectories of projected nuclear area and cell cycle reporter levels, which are used to cut out and synchronize single-cell-cycle trajectories by the time of cell birth (see Materials and methods: Monitoring nuclear growth in live cells). The rapid fluctuations in the nuclear size trajectories at the onset of mitosis reflect the breakdown of the nuclear envelope, at which time the nuclear-localized fluorescent probes flood the cell. The mitosis segment of each trajectory was trimmed away before data were analyzed, to remove this artifact.
Figure 2—figure supplement 2
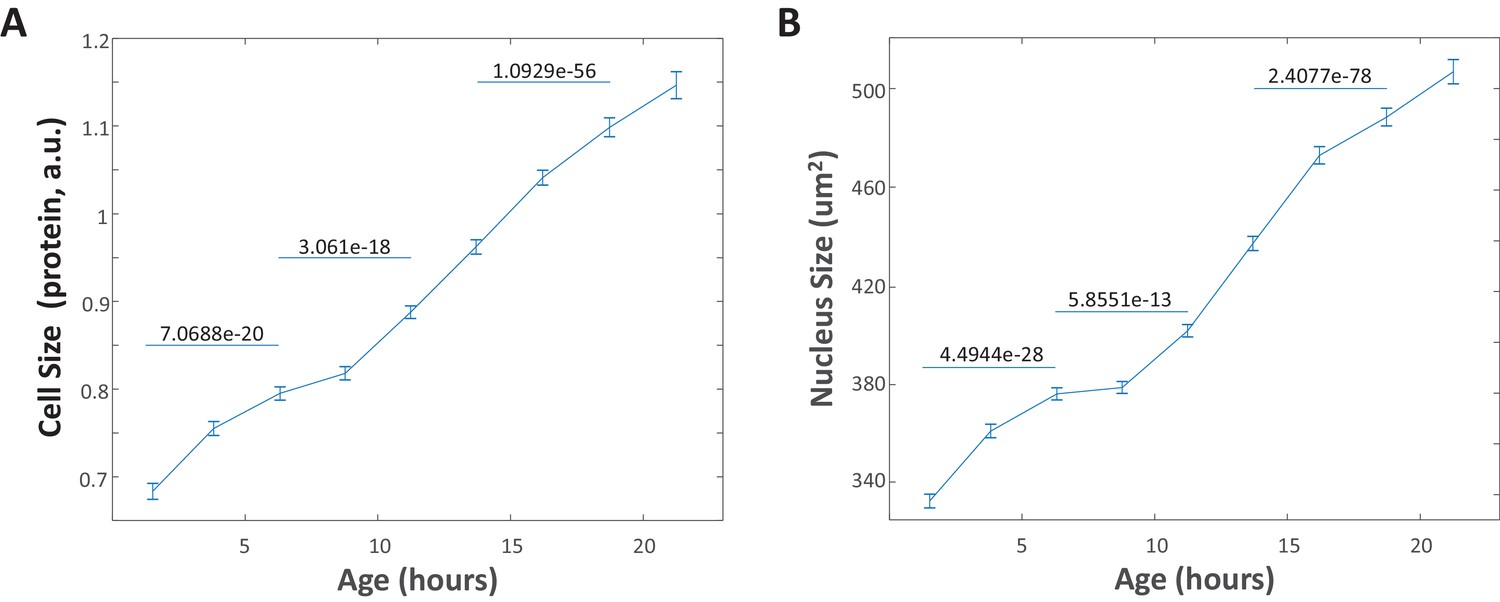
Changes in nucleus size mimic changes in cell size.
(A) Average cell size (SE-A647 intensity) vs. cell age plotted for a representative population of unsynchronized HeLa cells. Each data point marks the mean size of cells with ages within a 2.25 hr window, centered at that data point. Error bars represent the standard error of the mean. To illustrate that changes occurring in the cell size distribution over the course of a few hours are well-resolved, the p-values generated by a two-sample t-test comparing the two size distributions are shown for several pairs of data points. (B) Average nucleus size vs. cell age plotted as described in (A) for the same cells represented in (A). The raw data and source code necessary to generate this figure are included in Figure 2—source data 1.
Figure 2—figure supplement 3
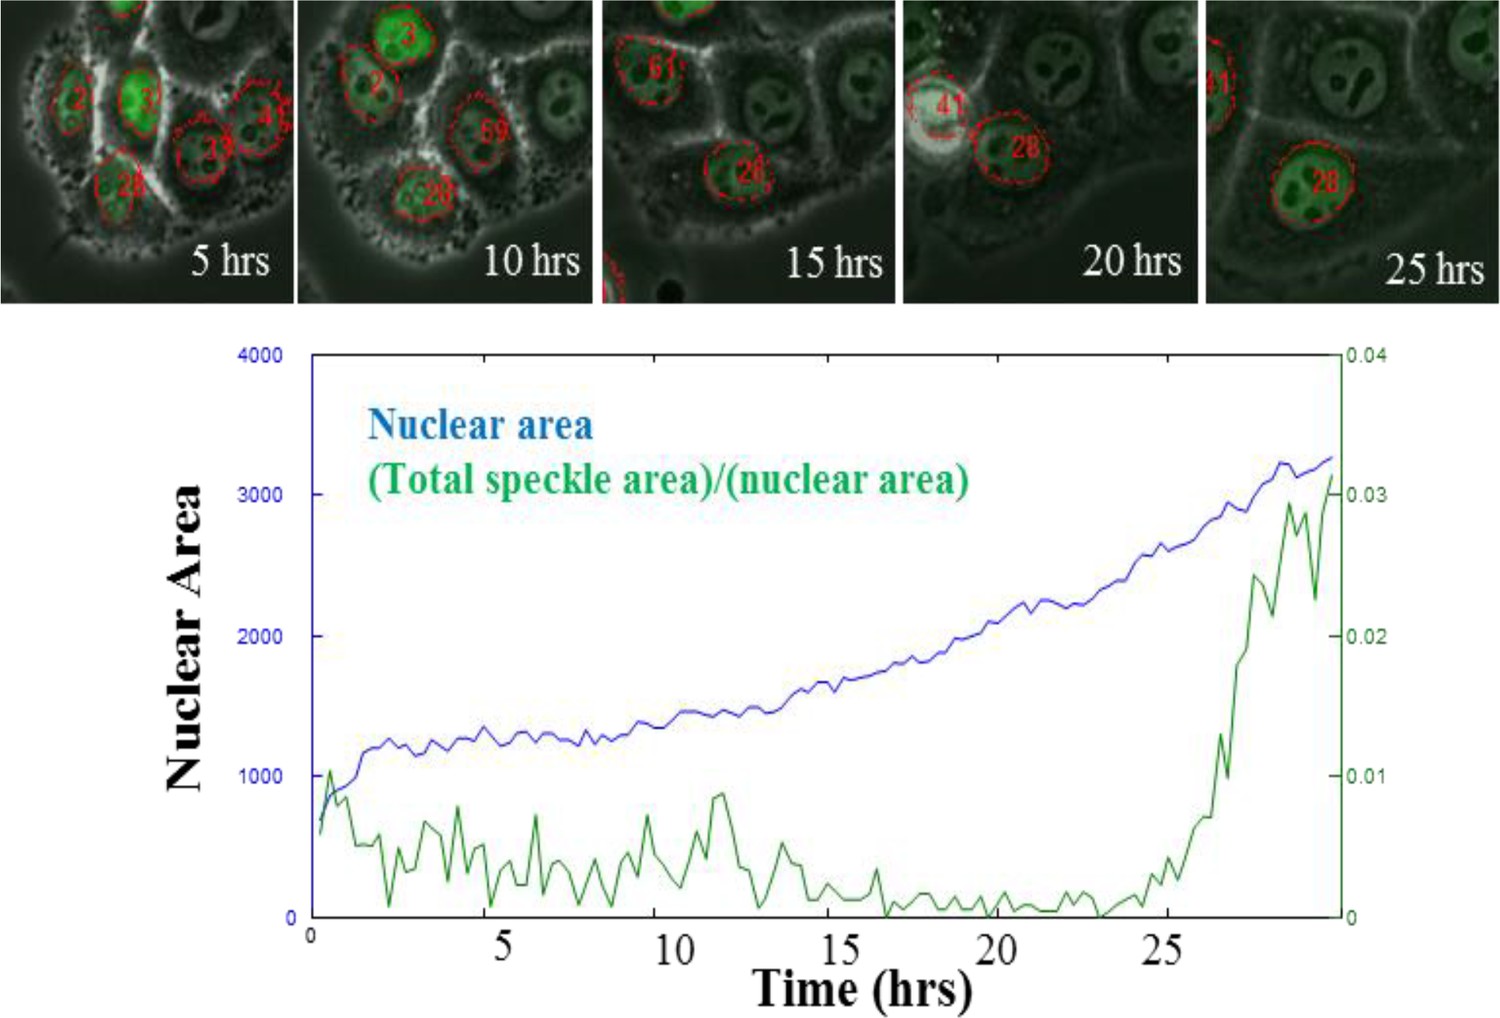
Nucleus grows with cell during aphidicolin arrest.
Images show HeLa cells, transfected with DNA-ligase-I-dsRed (gift from M. Cristina Cardoso, described in Cardoso et al., 1997), at several time points during a 25 hr incubation in aphidicolin. Widefield fluorescence images of DNA-ligase-I-dsRed (green) are overlaid on grayscale phase-contrast microscopy image. Red outlines mark nuclear boundaries. Red numbers label cells that were tracked throughout the time-lapse movies acquired during aphidicolin treatment. Nuclear size for the cell labeled 28 is plotted below (blue). Green trace quantifies the density of DNA-ligase foci within the nucleus, showing that cell does not enter S-phase for 25 hr.
Figure 3
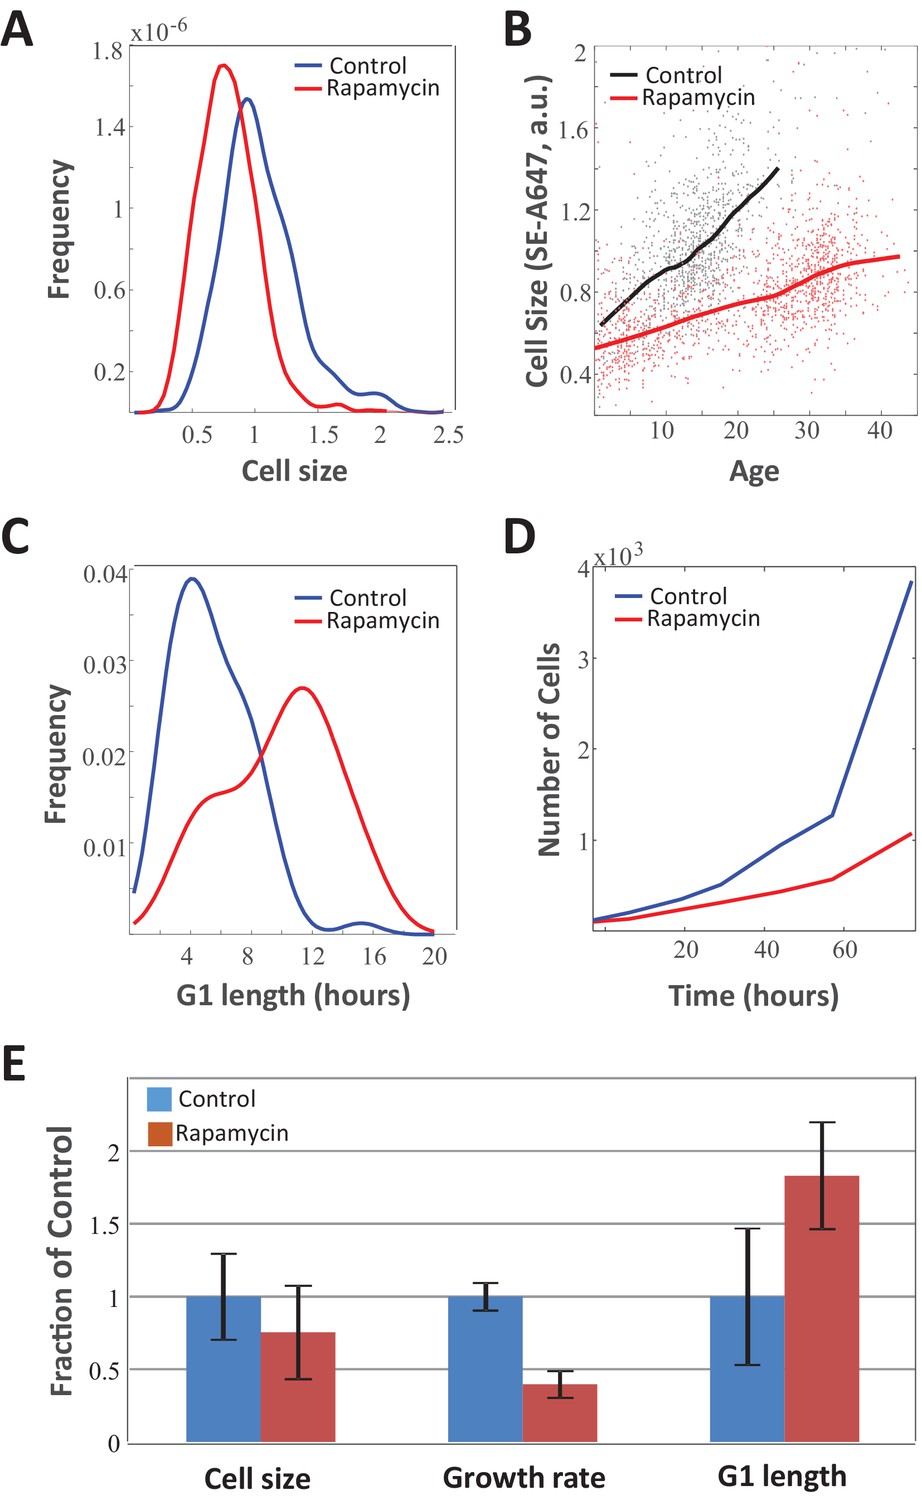
Slow growth rate in mTOR-inhibited cells is counteracted by increase in G1 duration.
Unsynchronized Rpe1 cells were cultured in the absence or presence 70 nM rapamycin for a period of 3 days. The distribution of (A) cell size (protein content assayed by SE-A647 fluorescence), (B) average growth rate, (C) G1-length, and (D) proliferation rate were obtained as described in the Materials and methods section. Solid lines in (B) show mean size vs. age for control and rapamycin-treated cells, while points represent single cell measurements. (E) Bar plot comparing the influence of rapamycin on growth rate, G1 length, and cell size. Bar heights represent mean, error bars represent standard deviation (n = 975 cells in control, n = 1268 cells in rapamycin). Data shown are representative examples of two biological replicates (full experimental repeats). The raw data and source code necessary to generate (A–B) are included in Figure 3—source data 1.
-
Figure 3—source data 1
File contains the source code (Figure_3AB.m) and source data necessary to generate Figure 3A and B using Matlab, as well as any necessary functions called by the source code.
Source data include individual measurements of cell age and cell size (total SE-A647 intensity) for control and rapamycin-treated samples.
- https://doi.org/10.7554/eLife.26957.013
Figure 4 with 3 supplements
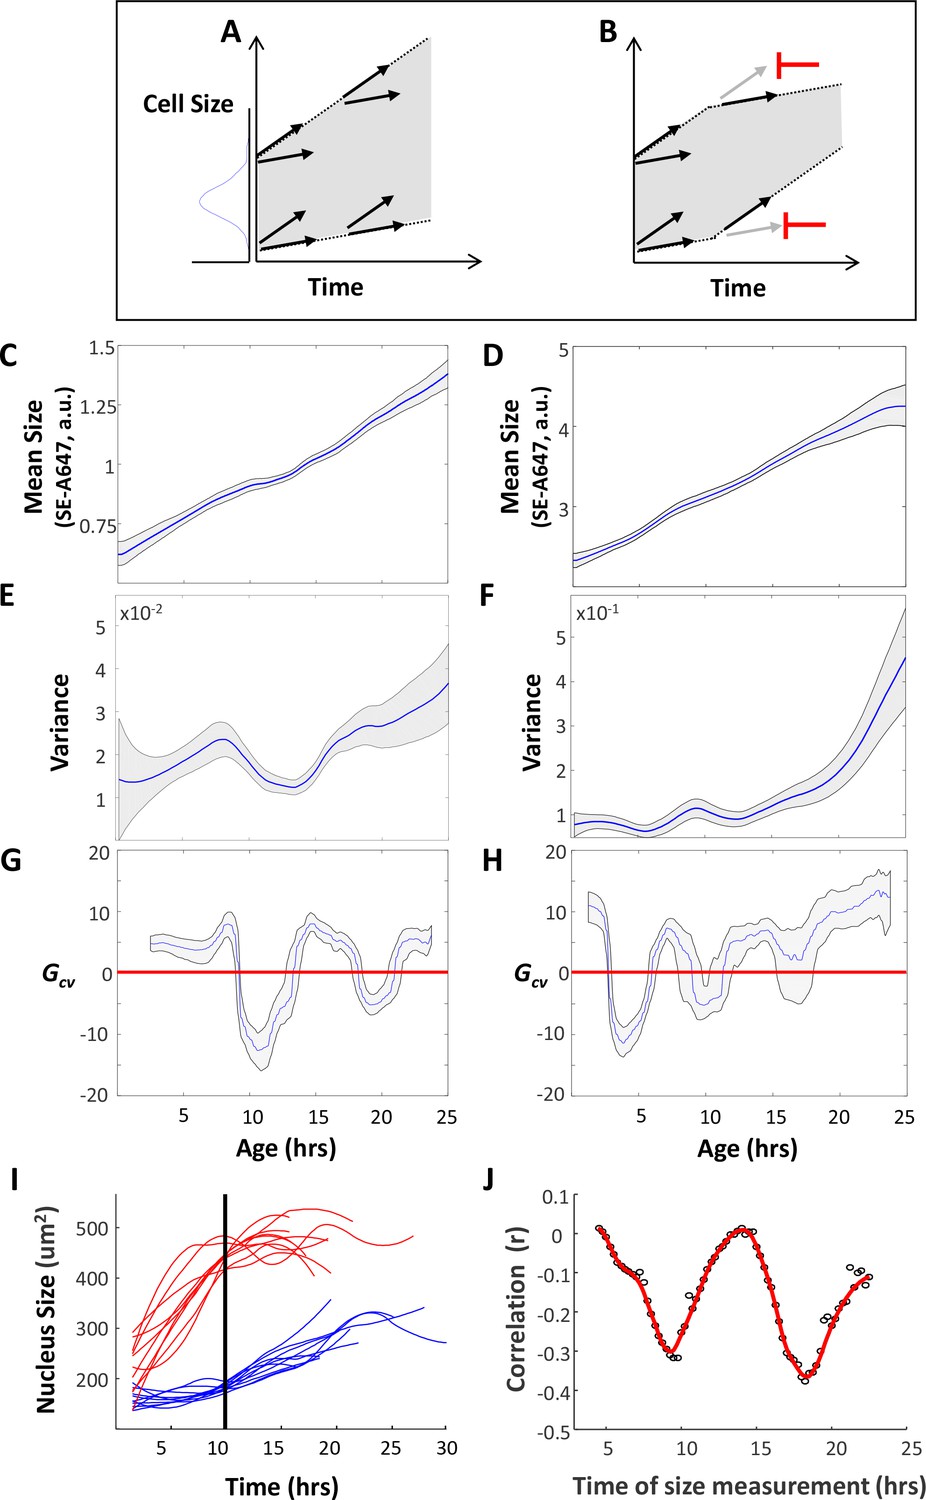
Cells adjust their growth rates in a size-dependent manner.
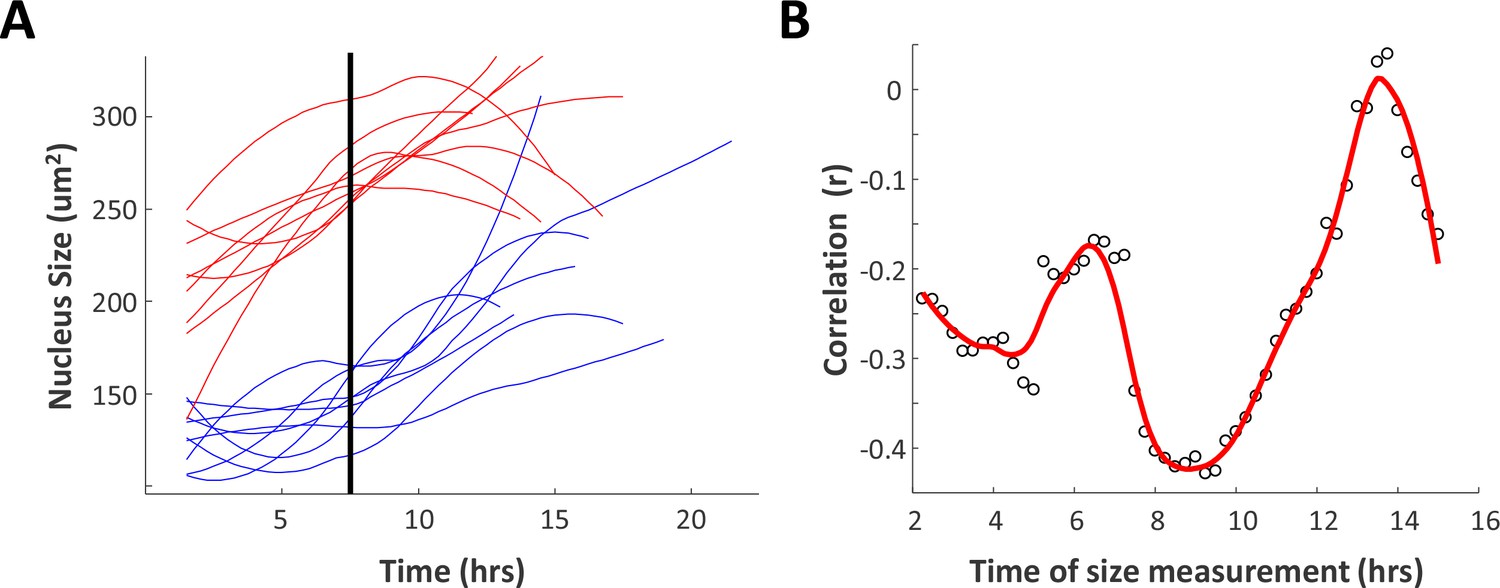
(A) Variation in growth rates drives an increase in cell size variance over time. (B) Regulation that limits cell size variance must function via feedback between cell size and growth in individual cells. HeLa and Rpe1 cells were imaged as described in the legend of Figure 1. (C–D) Mean cell size (protein content assayed by SE-A647 fluorescence, a.u.) was plotted as a function of age for Rpe1 (C) and HeLa (D) cells. Shaded region marks 90% confidence intervals calculated by bootstrapping. (E–F) Variance in cell size plotted as a function of age for Rpe1 (E) and HeLa (F) cells. Calculation of age-dependent variance was performed as described in Wasserman et al. (Wasserman, 2010) as well as in the Results section. Shaded region marks 70% confidence intervals calculated by bootstrapping. (G–H) Gcv plotted as a function of age for Rpe1 (G) and HeLa (H) cells. Since Gcv values are derivatives of the variance plots, minima in the Gcv plots are displaced in time, as compared to the minima in the variance plots. Shaded regions mark 50% bootstrapping confidence intervals, and identical trends were seen in all replicates. For Rpe1 plots (C,E,G), n = 975 cells, and data shown are representative examples of four biological replicates. For HeLa plots (D,F,H), n = 721 cells, and data shown are representative examples of four biological replicates. (I) Comparison of growth trajectories of smallest and largest cells. HeLa cells were sorted based on their nucleus size at 10 hr after birth. Nucleus size trajectories for the ten largest (red) and smallest (blue) cells are shown. (J) Correlation (Pearson’s r) between size and subsequent growth rate (2.5 hr later), calculated as a function of age (time since birth). Data shown in (I) and (J) are representative examples of four biological replicates, n = 158 cells. The raw data and source code necessary to generate (C–J) are included in Figure 4—source data 1.
-
Figure 4—source data 1
File contains the source code and source data necessary to generate Figure 4C–J using Matlab, as well as any necessary functions called by the source code.
Figure_4CEG.m generates Figures 4C, E and G. Figure_4DFH.m generates Figures 4D, F and H. Figure_4IJ.m generates Figure 4I and J. Source data include individual measurements of cell age, cell size (total SE-A647 intensity), and nucleus size.
- https://doi.org/10.7554/eLife.26957.018
Figure 4—figure supplement 1
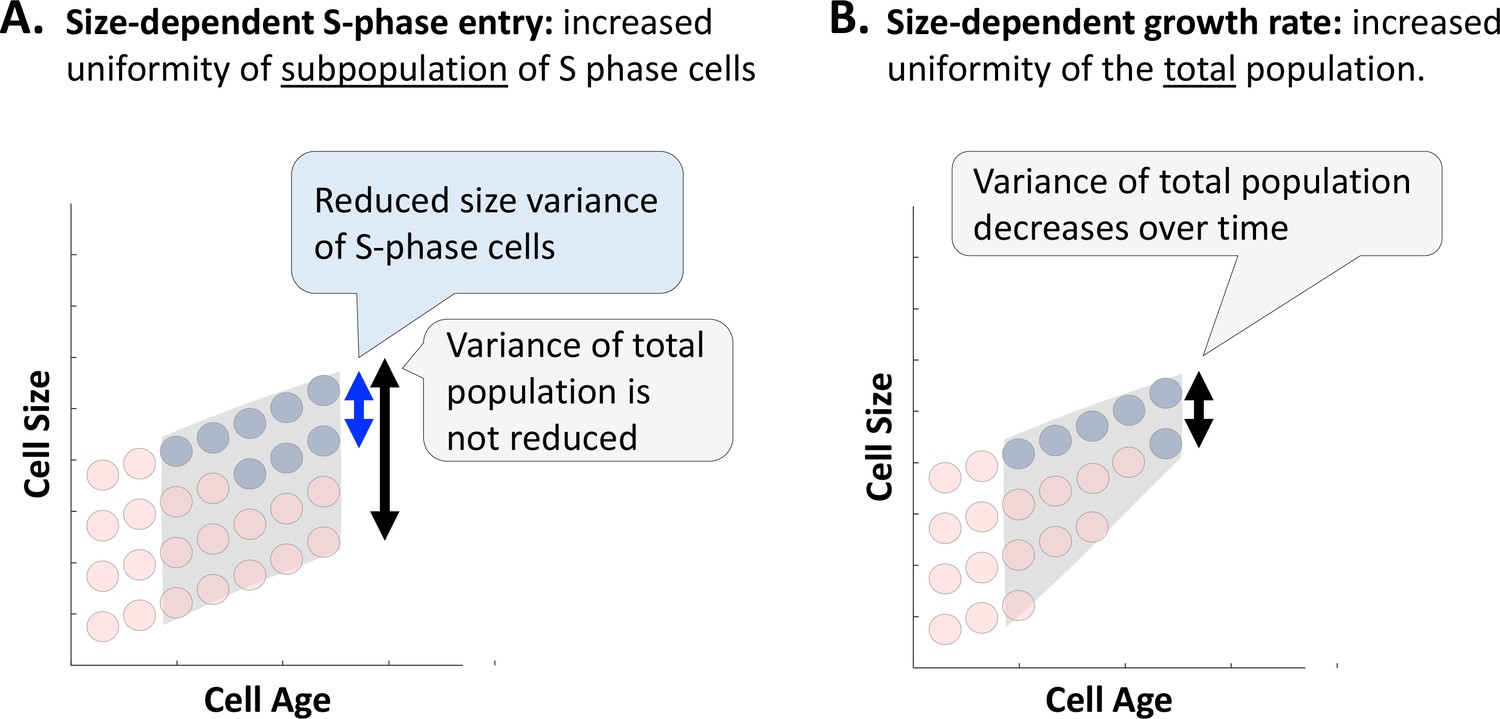
A decrease in cell size variance as a function of cell age reveals cell-size-dependent growth rate regulation.
The expected influence of (A) a cell size checkpoint and (B) growth rate regulation on cell size variance as a function of cell age (time elapsed since last cell division). We use red and blue circles to depict G1 cells and S-phase cells, respectively. The gray region depicts variance of the total population. (A) By selectively permitting S-phase entry only to cells that exceed a size threshold, a size checkpoint will result in increased uniformity of the subpopulation of cells that have recently entered S-phase. However, for any given cell age, the total population will include not only cells that met the size threshold, but also cells of the same age that were too small to enter S-phase. Therefore, a cell size checkpoint gating S-phase entry is not expected to cause a time-dependent decrease in the size variance of the total population. (B) By selectively promoting faster growth of small cells, relative to large cells, size-dependent growth rate regulation will cause a reduction in cell size variance over time.
Figure 4—figure supplement 2
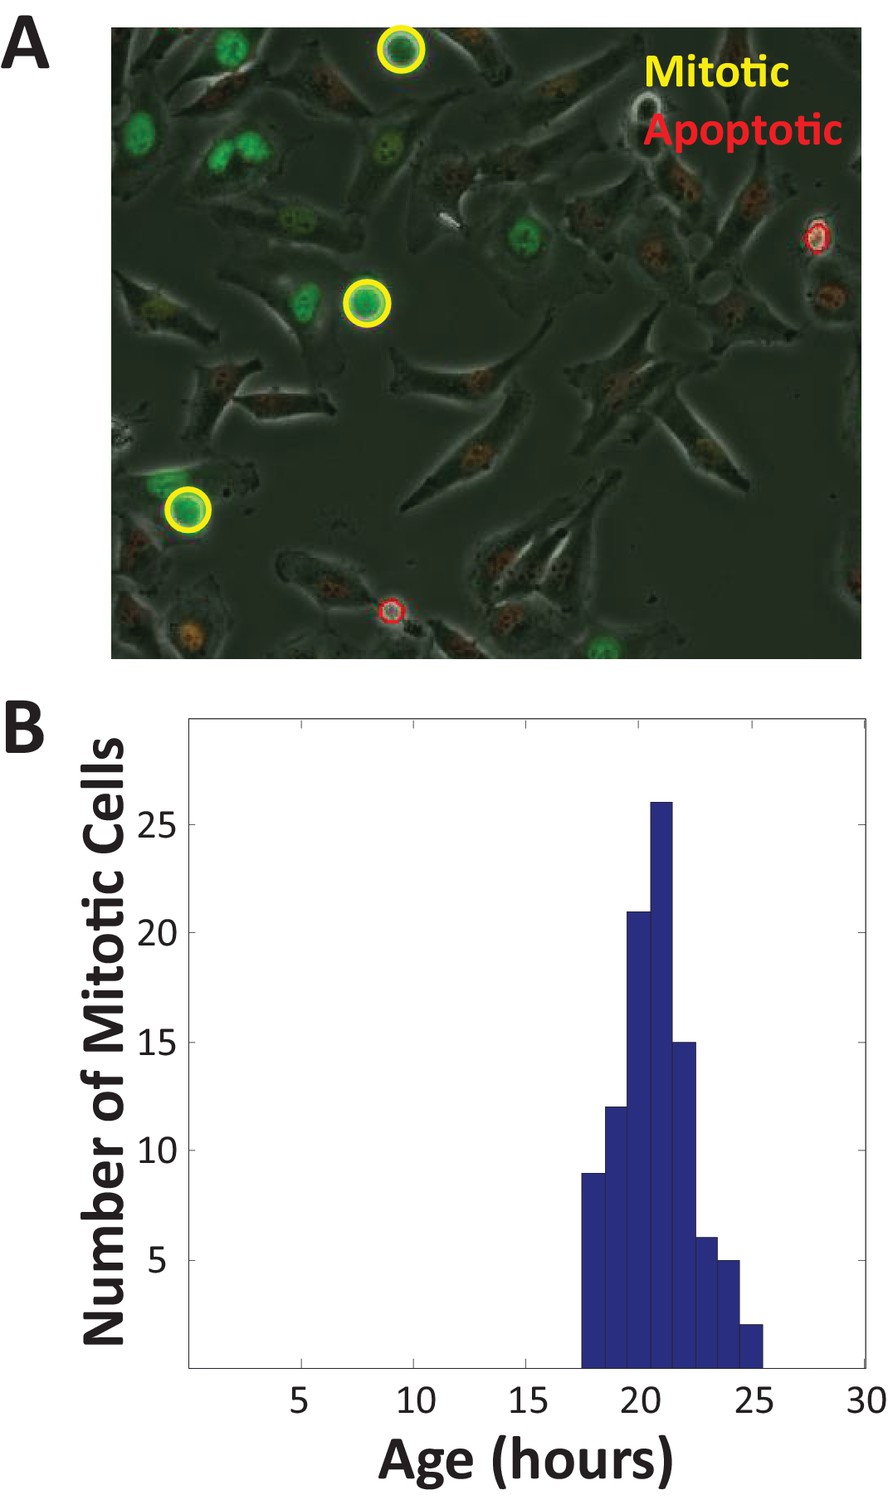
Cell cycle length distribution of proliferating cells.
The dips in cells size variance shown in Figure 4E–H are evidence of size-dependent regulation of growth rate. The only other explanation for these dips in variance is that cells are removed from the distribution, by either dividing or dying in a size-dependent manner. To test this possibility, we developed a computational strategy to automatically identify mitotic and apoptotic cells, based on their characteristic appearance in phase-contrast microscopy images. (A) Demonstration of automatic detection of mitotic and apoptotic cells. Phase-contrast image of HeLa cells, expressing Fucci cell cycle probes, with widefield fluorescence images overlaid in red (cdt1) and green (geminin). Cells identified as mitotic are circled in yellow. Cells identified as apoptotic are circled in red. Mitotic cells are surrounded by a symmetrical halo in phase-contrast images, due to cell rounding. Apoptotic cells appear bright throughout and are less symmetric and more fragmented than mitotic cells. (B) Age distribution of mitotic cells. We tracked cells over the course of a two-day-long time-lapse movie and recorded the age (time since last division) of all mitotic and apoptotic cells. The mean age of mitotic cells is 21 hr, with a standard deviation of 1.6 hr. There was a very low rate of apoptosis observed (<1% of cells imaged from birth died before dividing).
Figure 4—figure supplement 3
Time-lapse imaging confirms that Rpe1 cells adjust their growth rates in a size-dependent manner.
Growth of proliferating Rpe1 cells was monitored by time-lapse microscopy as described in Materials and methods (to obtain results analogous to those presented for HeLa cells in Figure 4I,J). (A) Comparison of growth trajectories of smallest and largest cells. Rpe1 cells were sorted based on their nucleus size at 7.5 hr after birth. Nuclear size trajectories for the ten largest (red) and smallest (blue) cells are shown. (B) Correlation (Pearson’s r) between size and subsequent growth rate (2.5 hr later), calculated as a function of age (time since birth). Data shown in (I) and (J) are representative examples of four biological replicates, n = 80 cells. (Fewer Rpe1 cells could be monitored than in the analogous experiment with HeLa cells (Figure 4I,J), because the high motility of Rpe1 cells means many cells escape the microscope field of view before completing a full cell cycle. However, the observed trend is similar to that seen in HeLa cells.) The raw data and source code necessary to generate (A) and (B) are included in Figure 4—source data 1.
Figure 5
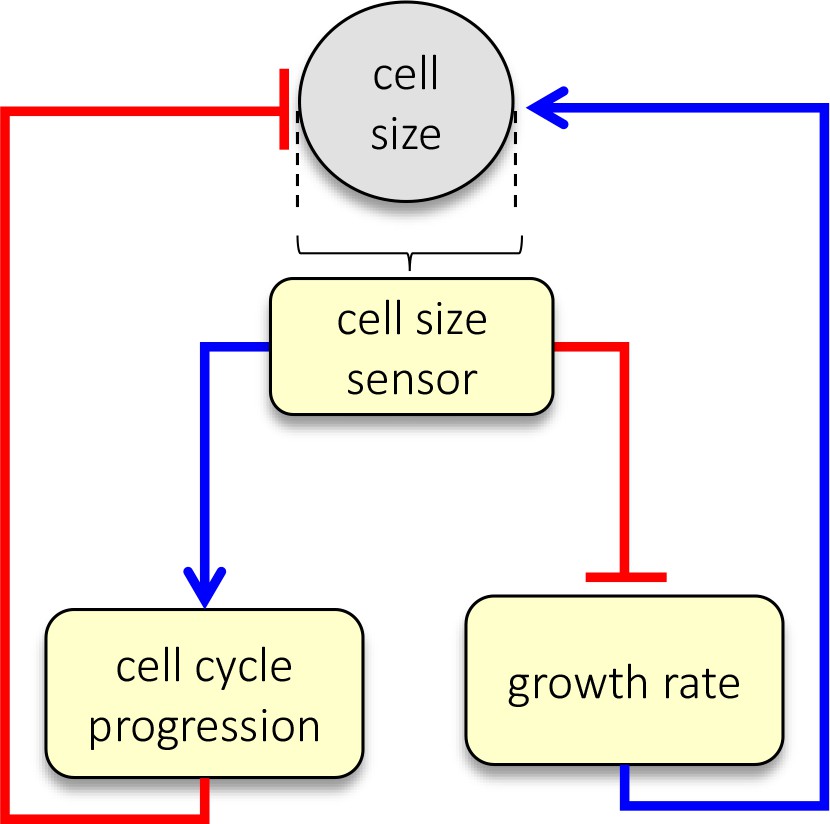
Dual-mechanism model of cell size specification.
Data presented here are consistent with a model where cells sense their own size and employ two strategies, adjusting both growth rate and cell cycle length, to correct aberrant sizes.
Figure 6
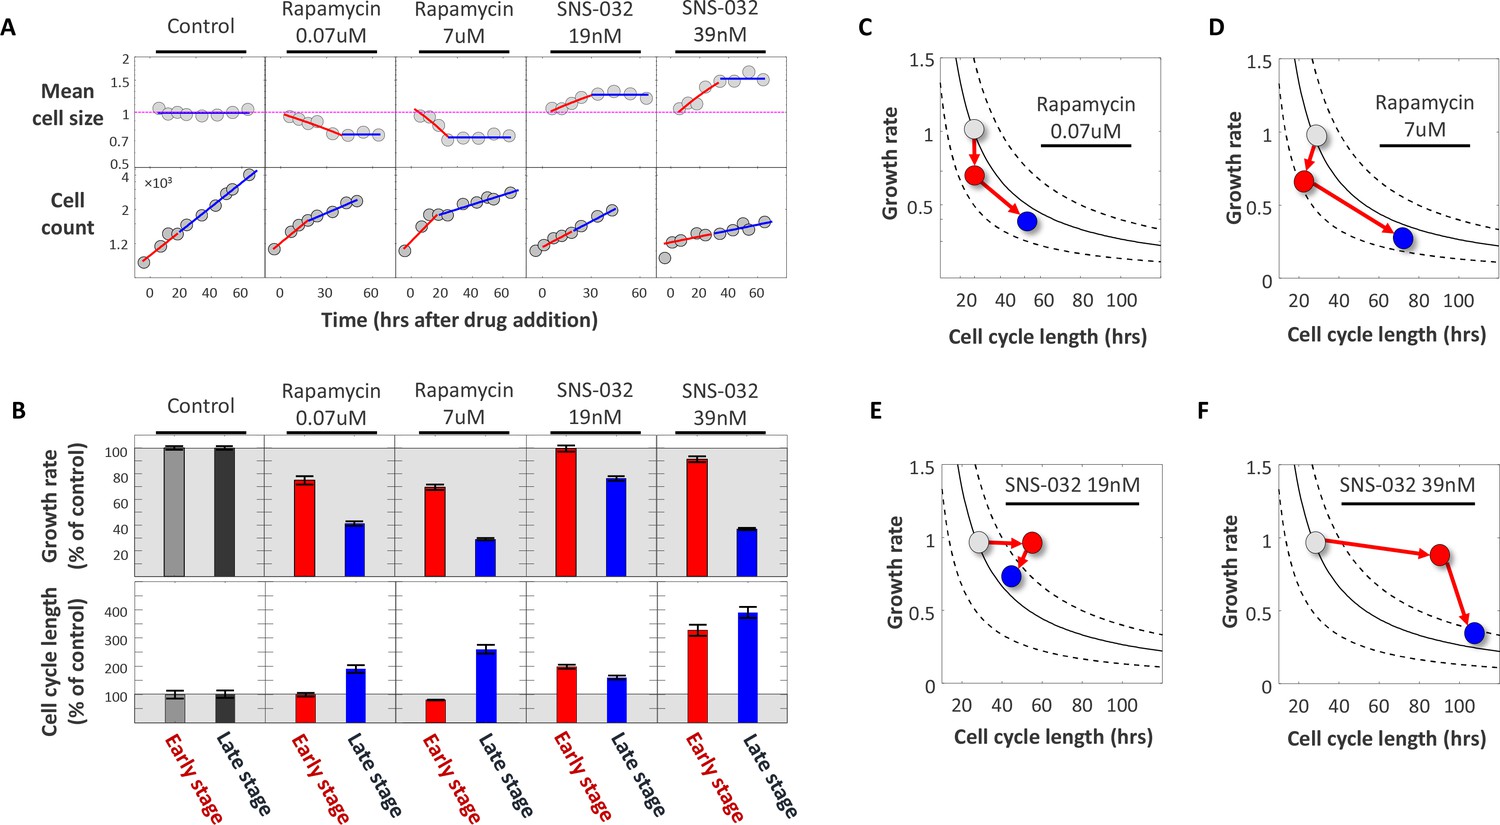
Using SNS-032 and rapamycin to examine the coordination of growth rate and cell cycle length.
Populations of Rpe1 cells were treated with DMSO (control), rapamycin and SNS-032. Each of the two drugs was used at two different concentrations, as indicated by the plot titles. (A) Measurements of average cell size with SE-A647 (top panel) and cell count (bottom panel) were performed (as described in the Materials and methods section) at different time points after drugs were added. Note log scale of y-axes. Each cell size datapoint is an average from a population of >2000 cells. Values of cell size are normalized to control, such that average cell size of the control populations has the value of 1. (B) Average growth rate (top panel) and cell cycle length (bottom panel) calculated from data shown in (A). Cell cycle length was calculated by fitting exponential curves to measurements of cell count over time shown in the bottom panel of (A). For each drug treatment, two separate estimates of growth rate and two separate estimates of cell cycle length were calculated; one for the early stage of the time course (red) and one for the late stage (blue), as described in the text. The separate estimates were calculated by fitting the time course data in (A) with two separate regressions, indicated by the blue and red regression curves in (A). Values of growth rate and cell cycle length are shown as percent of control. Shaded (gray) area marks growth rate and cell cycle length in the control populations. (C–F) Data from (B) are plotted as average growth rate versus cell cycle length for each of the separate drug treatments. Data points are color coded with the same color scheme that is used in the bar-plot (B), that is colors represent the temporal stages of the drug treatments: gray data-points represent measurements on control populations prior to drug treatment, red data-points represent measurements of populations during the early stage of drug treatment, and blue data-points represent measurements of populations during the late stage of drug treatment. Trend-lines are defined by , where is a constant that defines a cell’s target size. In other words, all points on a given trend-line represent paired values of growth rate and cell cycle length that correspond to a single fixed, constant product, . An important observation emphasized by panels C-F is that, while drug treatments cause a change in both and , the product, , is only temporarily perturbed and returns close to its homeostatic value in the late stage of drug treatment. This is seen by the fact that only the red datapoints fall off the trendlines. Also, the panels clearly highlight the distinction in the order of events that result from cell cycle inhibitors versus growth rate inhibitors, as explained in the text. The raw data and source code necessary to generate (A–F) are included in Figure 6—source data 1.
-
Figure 6—source data 1
File contains the source code (Figure_6 .m) and source data necessary to generate Figure 6 using Matlab.
Source data includes time-course measurements of cell count and cell size (total SE-A647 intensity) under the conditions labeled in Figure 6.
- https://doi.org/10.7554/eLife.26957.021
Figure 7 with 1 supplement

Cell size is stabilized by a compensatory relationship between cell cycle length and growth rate.
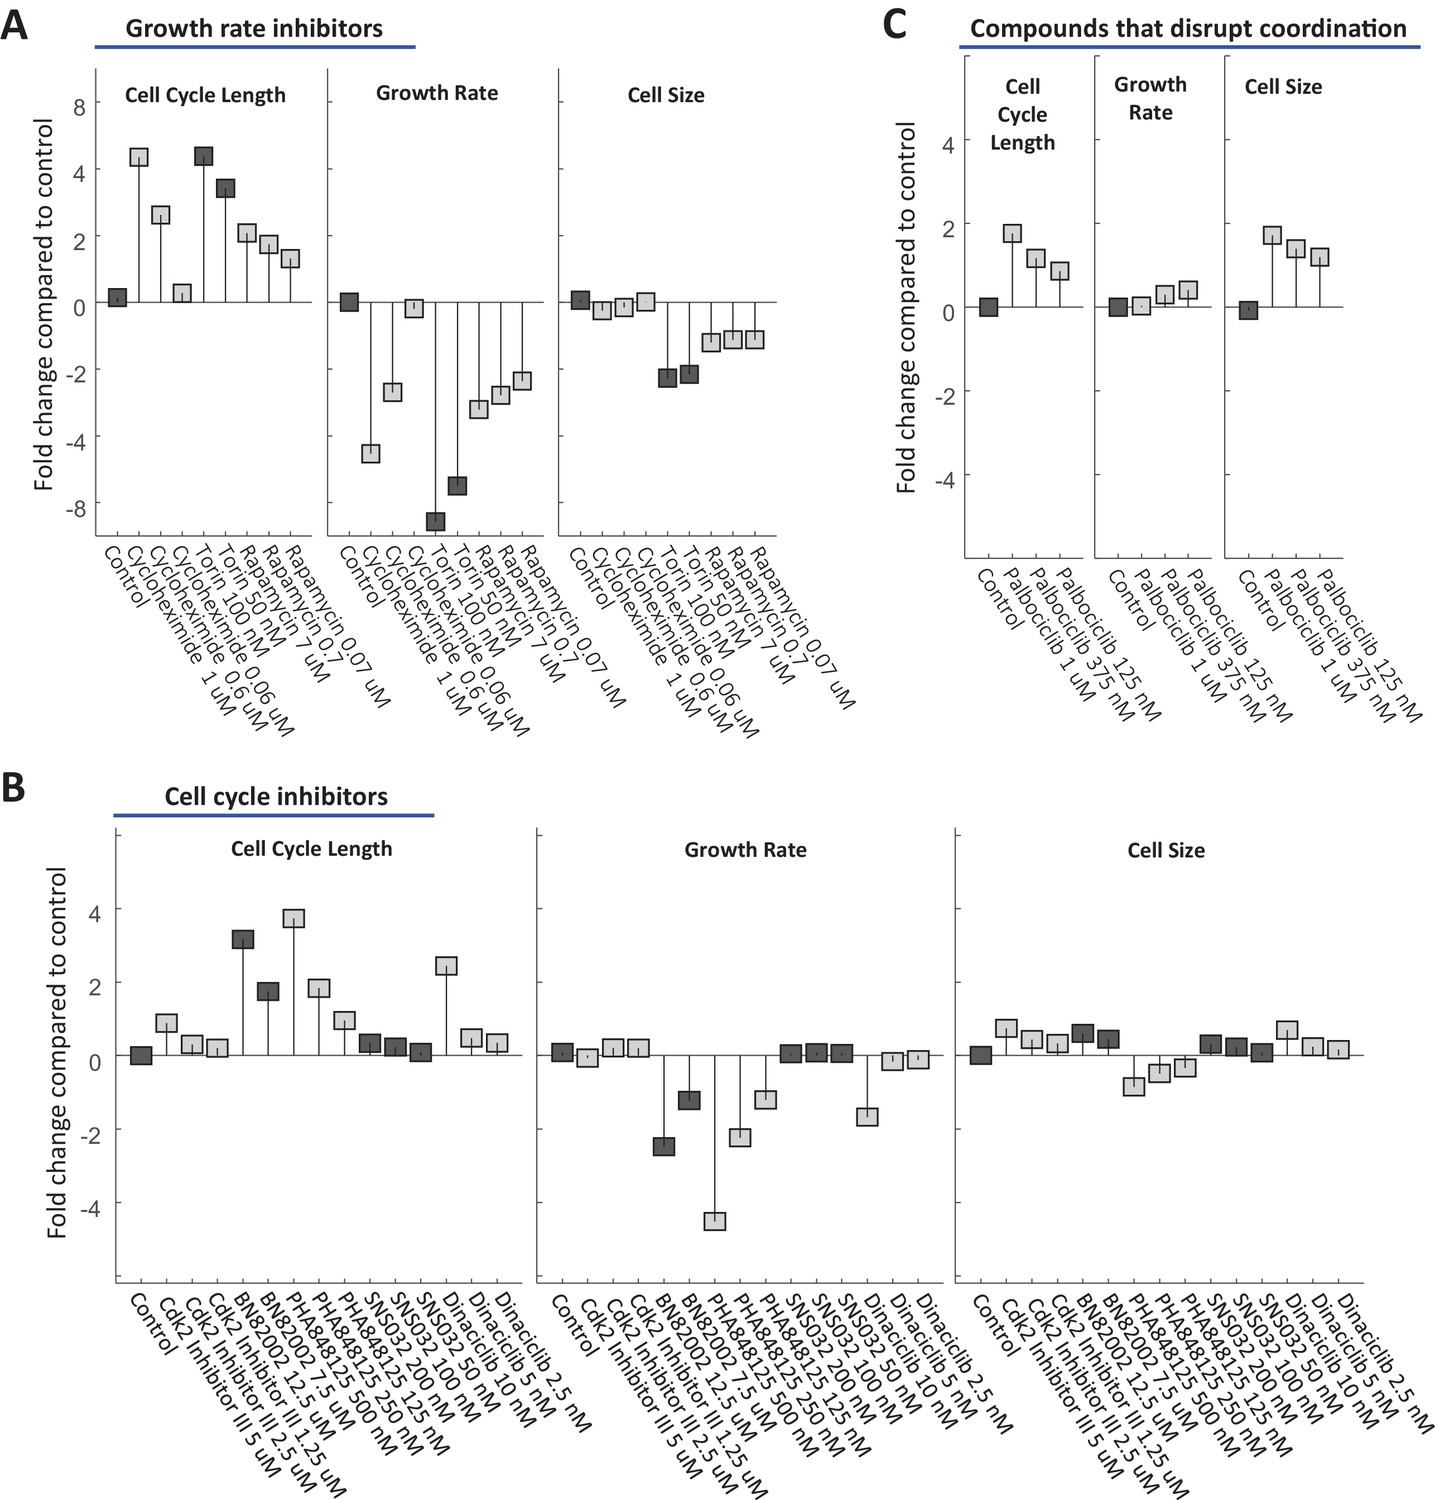
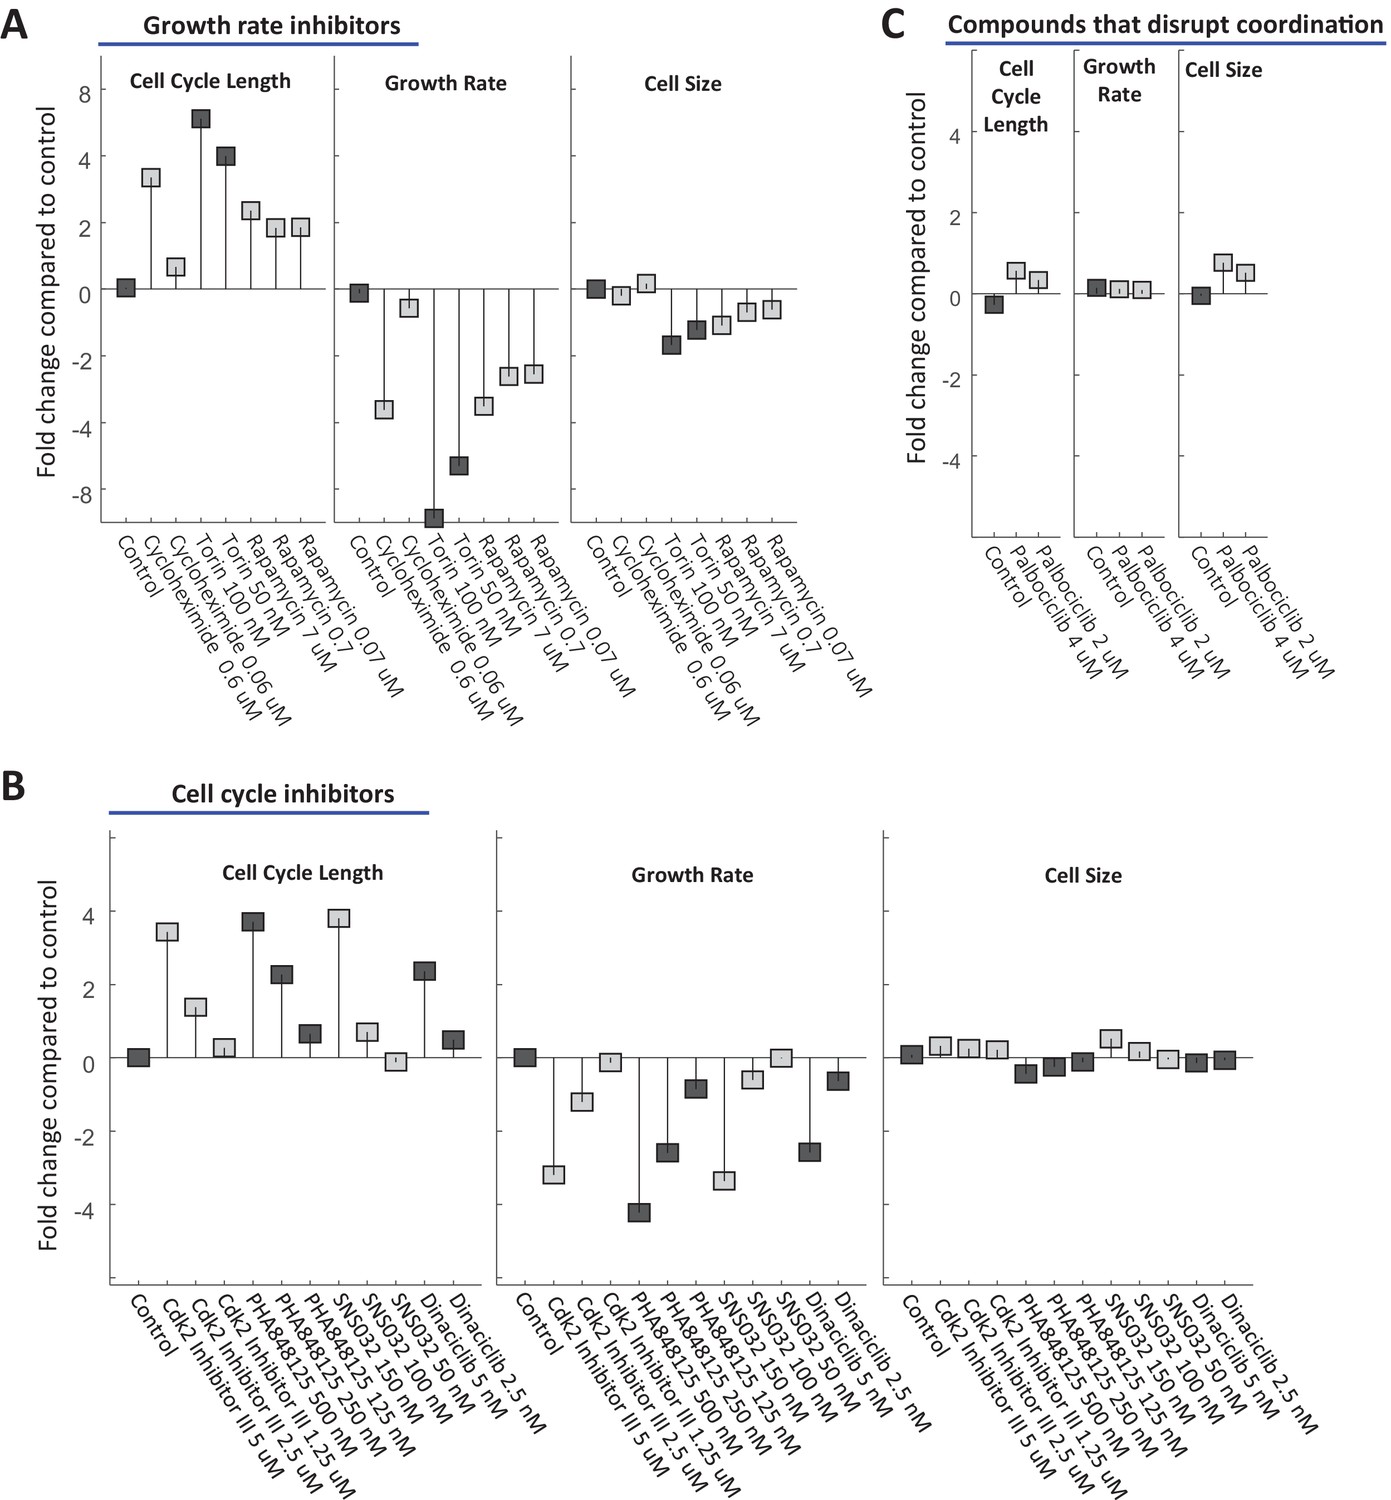
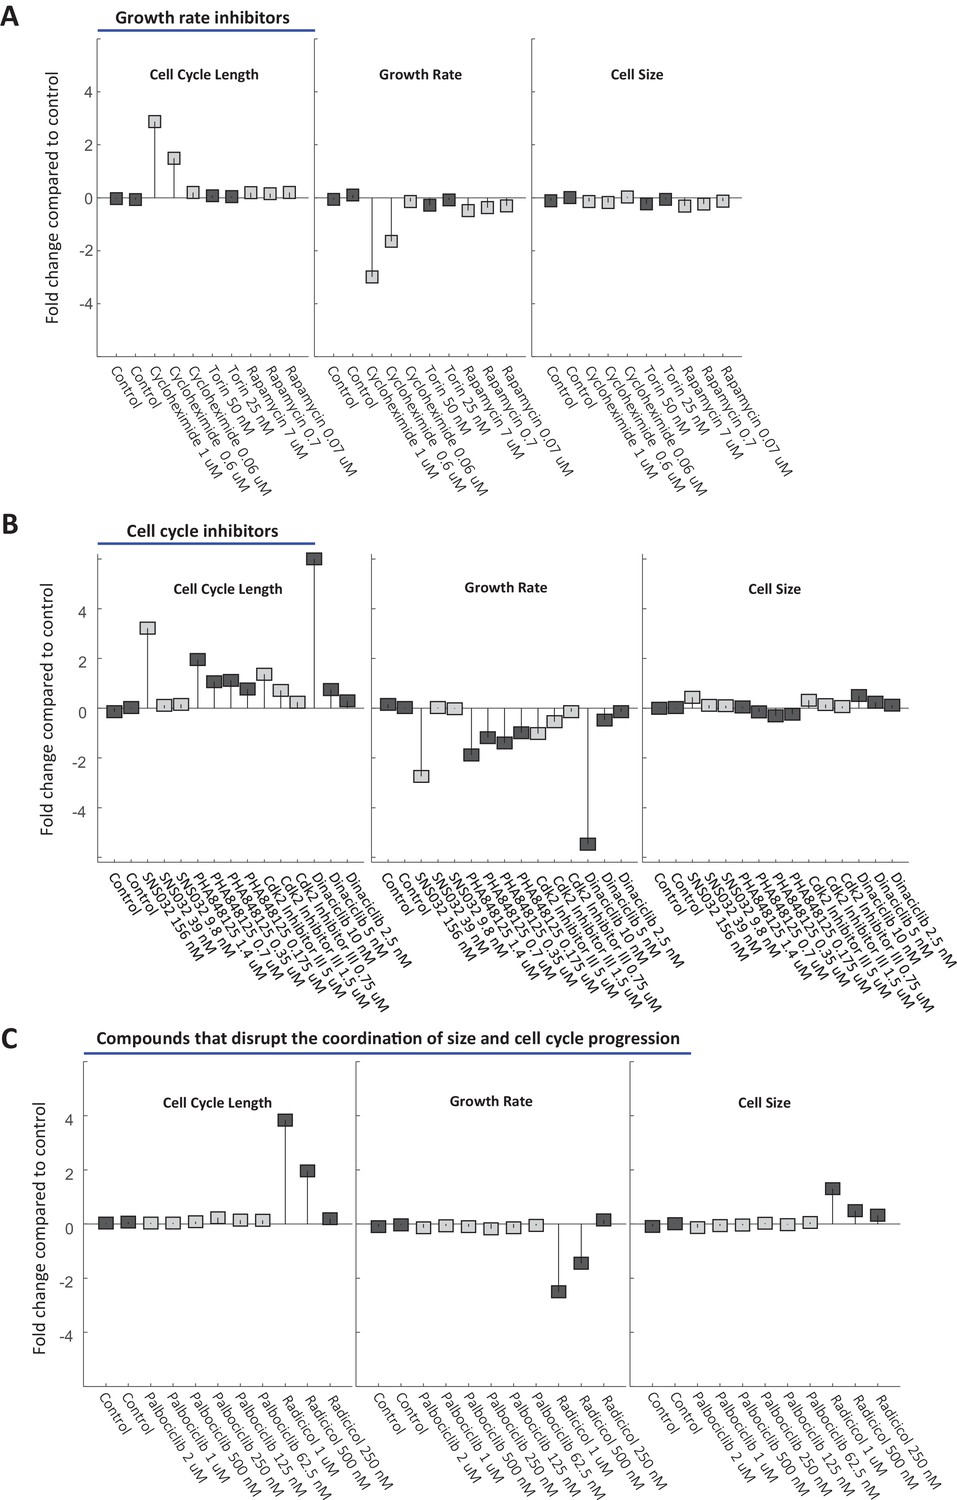
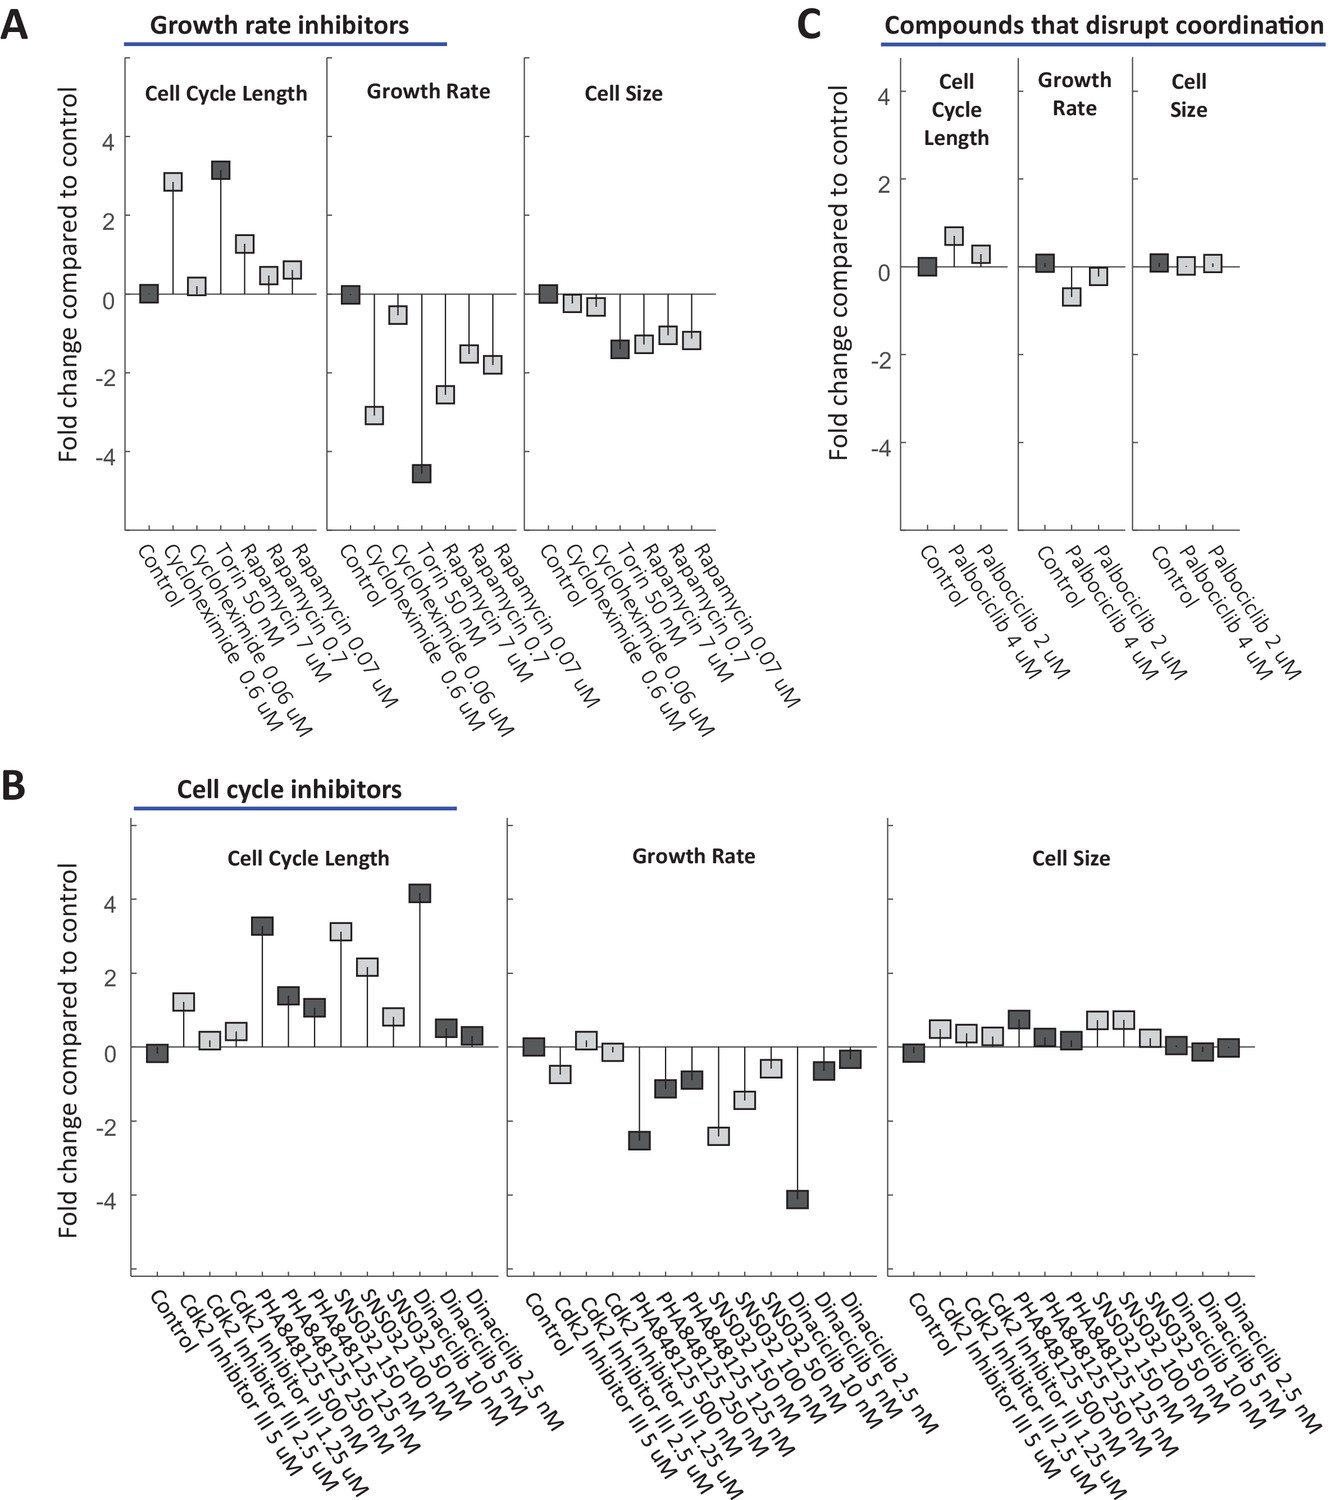
Rpe1 cells were treated with varying doses of drugs inhibiting growth (A) or cell cycle progression (B). The fold change in mean cell cycle length (left panel), growth rate (middle panel), and cell size (right panel), relative to untreated cells, is plotted for each condition. The mean cell cycle length and mean growth rate of cells in each condition were calculated from measured increases in bulk protein and number of cells over the course of a 68 hr incubation, as described in the text. Mean cell size (protein content assayed by SE-A647 staining) was measured after 44 hr of incubation in each condition. To better characterize their influence, all drugs were applied at a range of concentrations, as indicated by the titles in the x-axes. The drug concentrations shown were found to be non-toxic and meet the following two criteria in preliminary tests: (i) They cause a detectable effect on growth rate and/or cell cycle progression. (ii) They do not block proliferation entirely. Each drug treatment was done in duplicate, alongside six control (DMSO) samples, with several thousand cells in each sample. Fold-changes are shown relative to the average cell cycle length, growth rate, and cell size of all six control samples. The raw data and source code necessary to generate (A–B) are included in Figure 7—source data 1. The drugs used and their targets are as follows: mTOR inhibitors (Torin and Rapamycin), protein synthesis inhibitor (Cycloheximide), cdk1/2 inhibitors (SNS-032, cdk2 Inhibitor II, PHA848125, Dinaciclib).
-
Figure 7—source data 1
File contains the source code (Figure_7 .m) and source data necessary to generate Figure 7 using Matlab.
Source data include measurements of cell cycle length, cell size (total SE-A647 intensity), and growth rate under the conditions labeled in Figure 7.
- https://doi.org/10.7554/eLife.26957.024
Figure 7—figure supplement 1
Drug-induced changes in cell cycle length or growth rate are followed by compensatory changes.
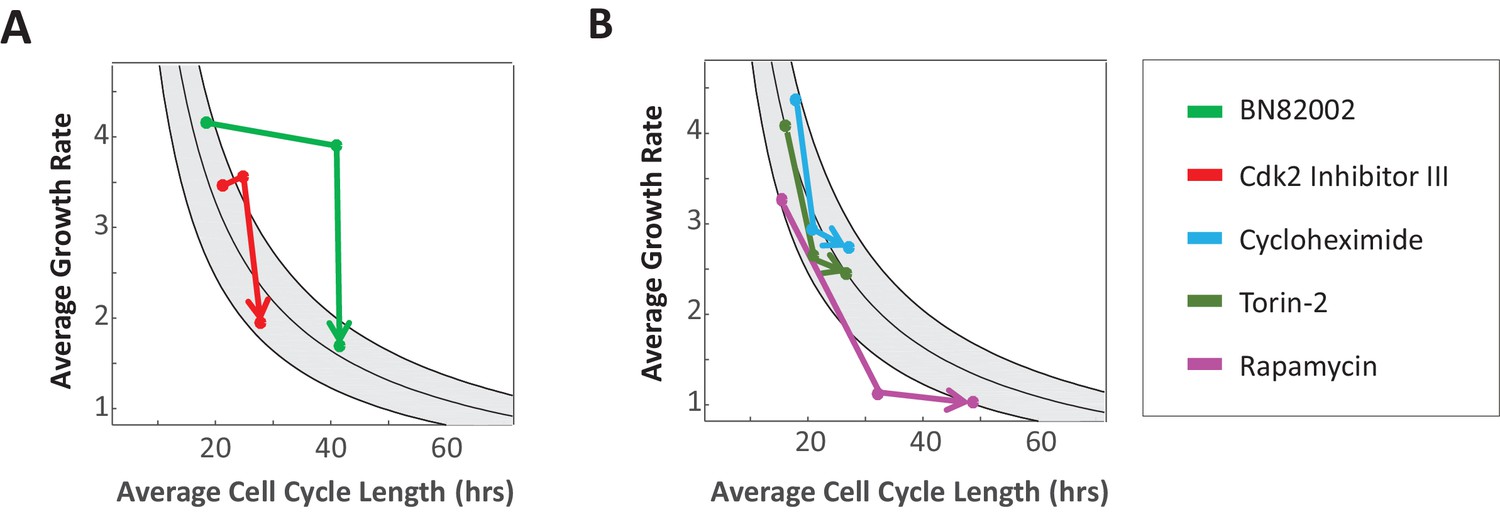
Mean growth rate vs. mean cell cycle length for cells treated with drugs inhibiting cell cycle progression (A) or protein production (B), calculated for three time intervals during drug treatment: 0–14, 14–44, 44–68 hr. Lines connect time-points in sequential order, with arrowheads pointing to latest time-point. Data are shown for 25 µM cdc25 phosphatase inhibitor BN82002 (E, green), 1.5 µM Cdk2 Inhibitor III (E, red), 0.06 µM Cycloheximide (F, blue), 10 nM Torin-2 (F, orange), and 7 µM Rapamycin (F, purple). Each treatment was done in duplicate, with several thousand cells in each sample.
Figure 8 with 1 supplement
Perturbing the relationship between cell cycle length and growth rate.
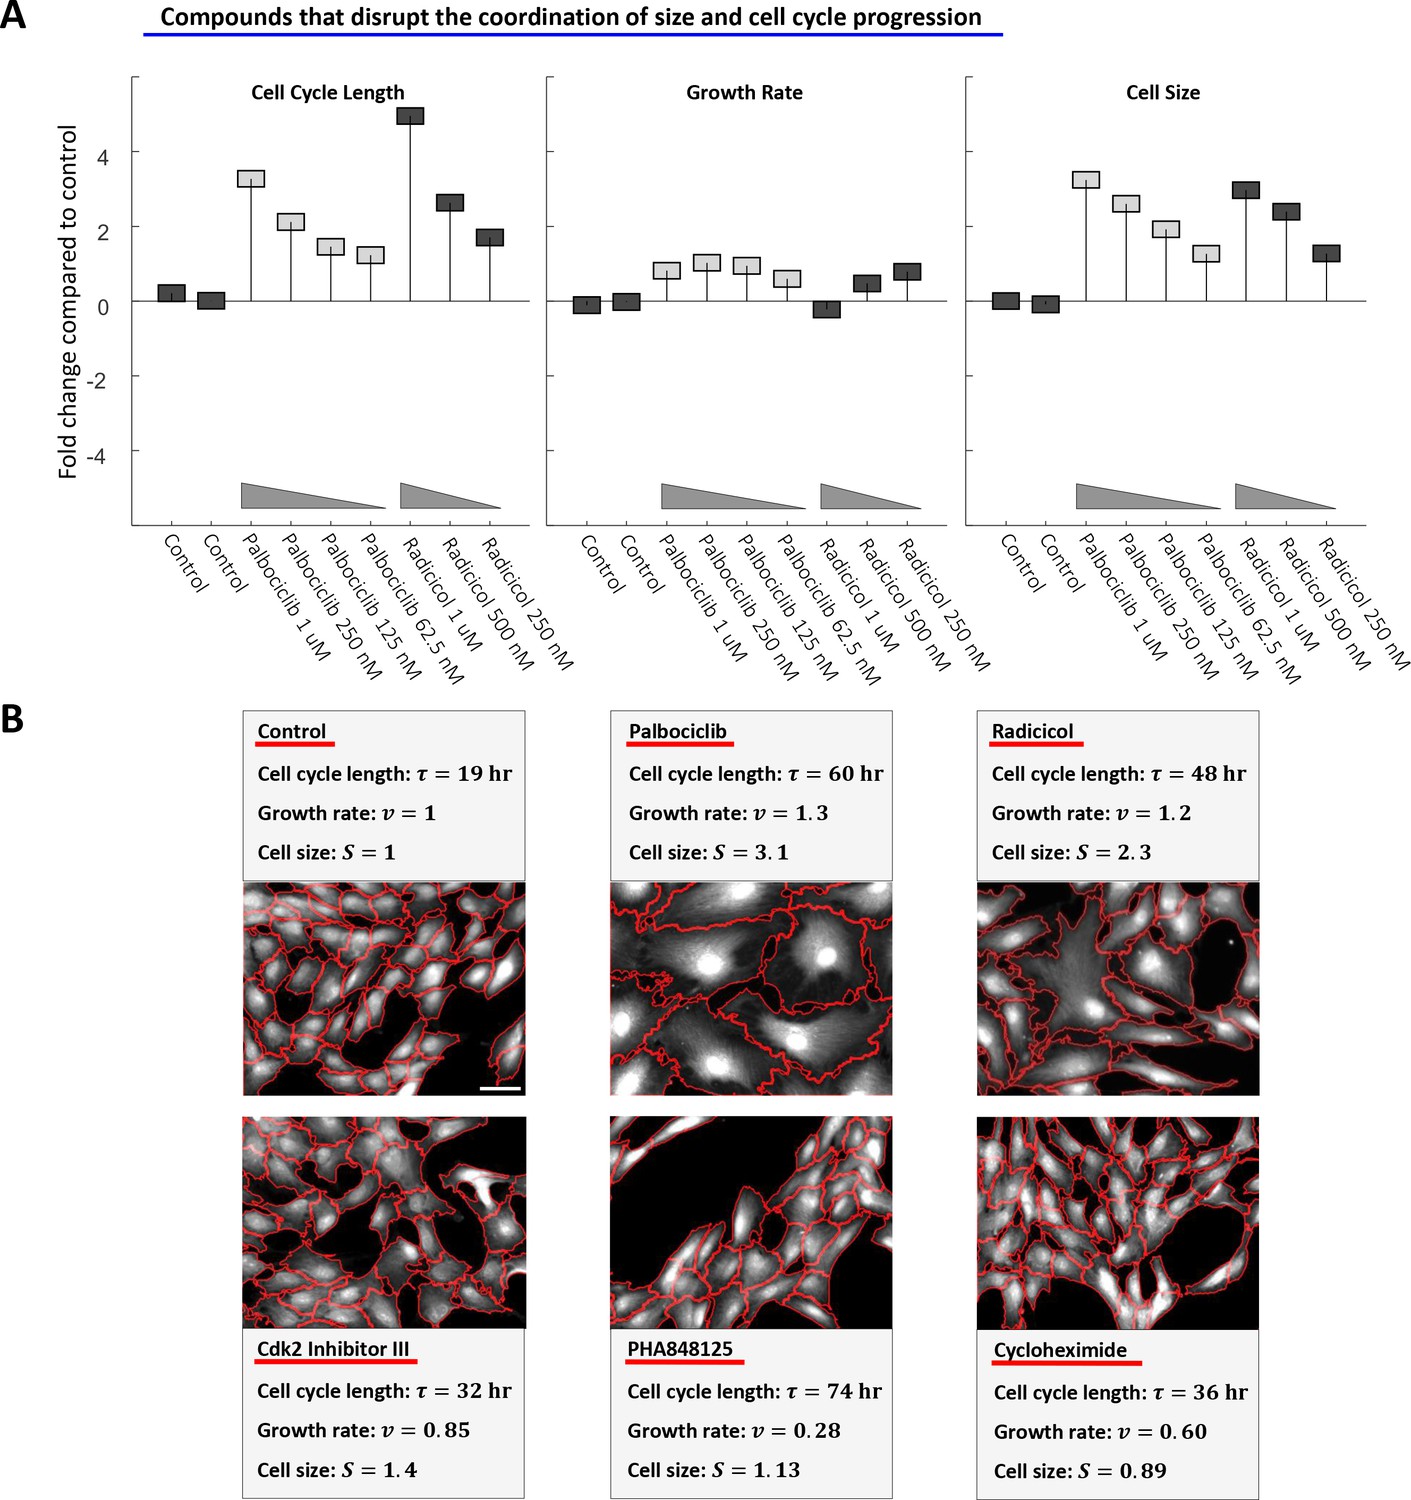
(A) Rpe1 cells were treated with varying doses of palbociclib (cdk4/6 inhibitor) or radicicol (hsp90 inhibitor). (A) The fold change in mean cell cycle length (left panel), growth rate (middle panel), and cell size (right panel), relative to untreated cells, is plotted for each condition. The mean cell cycle length and mean growth rate of cells in each condition were calculated from measured increases in bulk protein and number of cells over the course of a 68 hr incubation, as described in the Materials and methods and Results sections. Mean cell size (protein content assayed by SE-A647 staining) was measured after 68 hr of incubation in each condition. Each drug treatment was done in duplicate, alongside six control (DMSO) samples, with several thousand cells in each sample. Fold-changes are shown relative to the average cell cycle length, growth rate, and cell size of all six control samples. (B) Representative widefield fluorescence images (SE-A647 stain) of unperturbed cells and cells treated with 600 nM cycloheximide, 175 nM PHA848125, 5 uM Cdk2 Inhibitor III, 500 nM palbociclib, or 500 nM radicicol. All images are shown at the same scale, scale bar = 50 um. Red lines delineate cell boundaries. The raw data and source code necessary to generate (A) are included in Figure 8—source data 1.
-
Figure 8—source data 1
File contains the source code (Figure_8 .m) and source data necessary to generate Figure 8A using Matlab.
Source data include measurements of cell cycle length, cell size (total SE-A647 intensity), and growth rate under the conditions labeled in Figure 8.
- https://doi.org/10.7554/eLife.26957.027
Figure 8—figure supplement 1

siRNA knockdown of CDK4 and CDK6 causes an increase in cell size.
Rpe1 cells were transfected with 25 nM control siRNA (siCON) or 25 nM siRNA targeting: (1) CDK6, (2) CDK4, (3) both CDK4 and CDK6. (A,B) Cells were harvested at 48 and 72 hr post-transfection, for western blot verification of siRNA knockdown. Western blots probed for CDK4 (A) and CDK6 (B) confirm that these proteins are depleted after treatment with siCDK4 and siCDK6, respectively, but are present in control samples (siCON). (C) After 72 hr of siRNA treatment, cells were fixed and protein was stained with SE-A647 to measure cell size. Experiment was performed on five replicates for each condition (ten replicates for control), with several thousand cells in each replicate. Median cell size (protein content as measured by SE-A647 fluorescence) is shown for each condition, with error bars indicating the standard deviation of replicates.
Figure 9 with 4 supplements
Compensatory relationship between cell cycle length and growth rate.
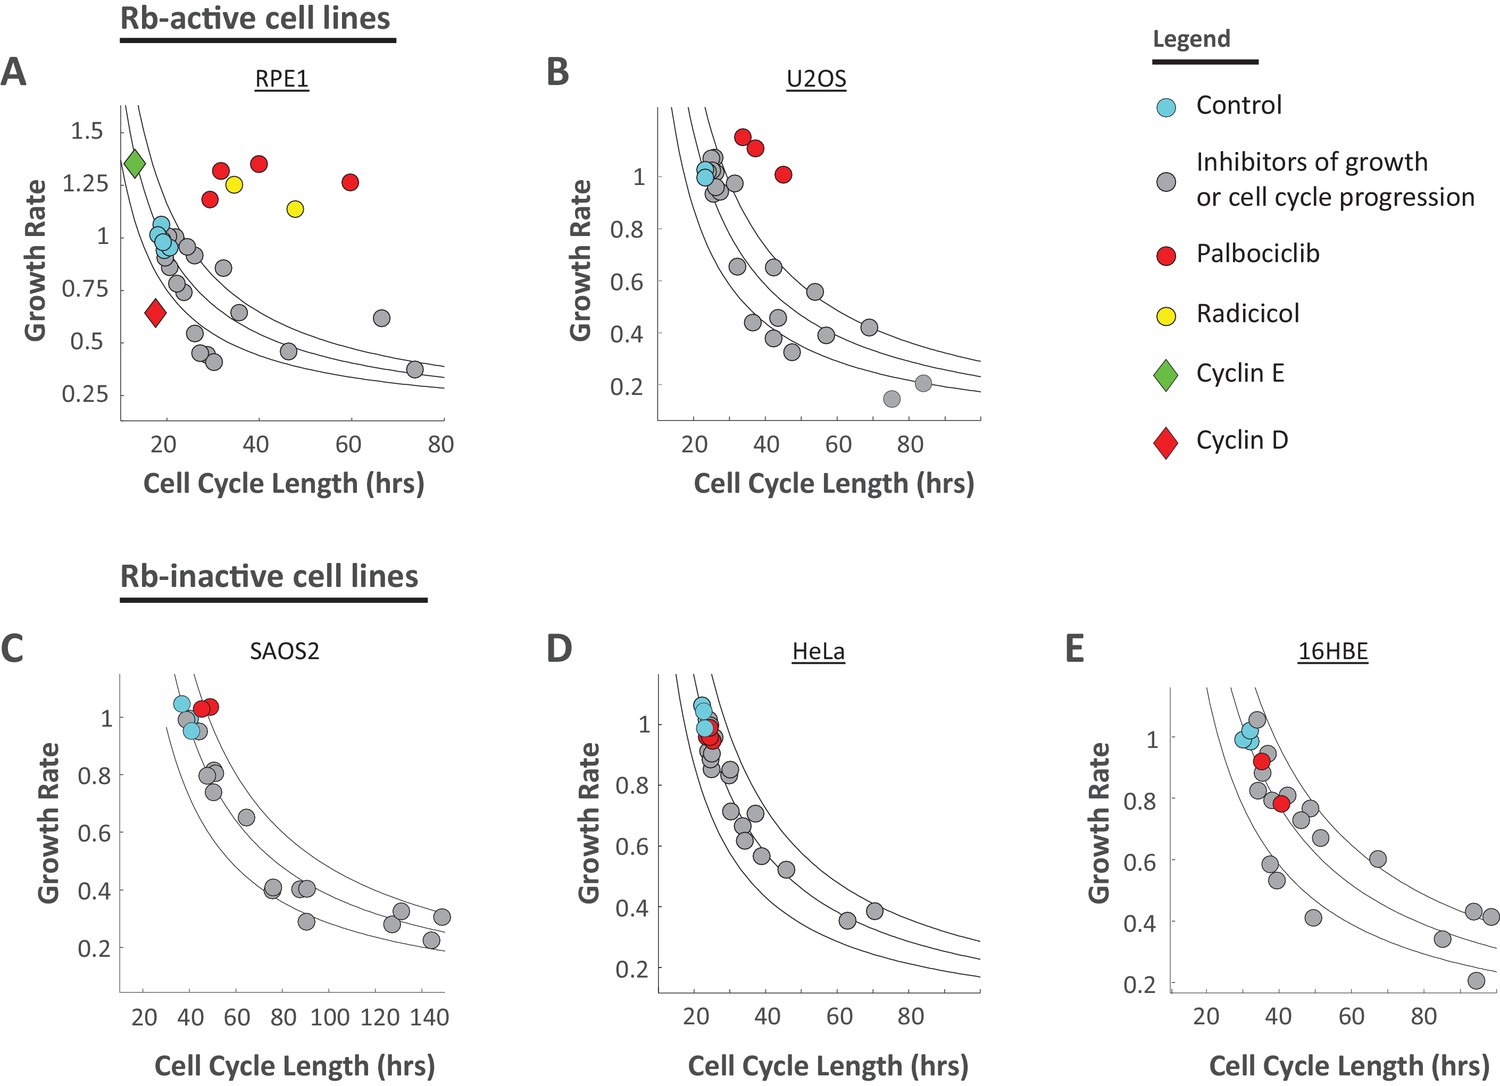
(A) Rpe1 cells were treated with varying doses of drugs inhibiting growth or cell cycle progression, as described in the legends of Figures 7 and 8. Mean growth rate vs. mean cell cycle length are plotted for cells in each condition shown in Figure 7. Cyan circles represent unperturbed cells (DMSO). Gray circles represent the inhibitors of growth or cell cycle progression shown in Figure 7A and B. Red circles (palbociclib) and yellow circles (radicicol) represent the conditions that disrupt the coordination of cell growth and cell cycle progression shown in Figure 8A. Mean growth rate vs. mean cell cycle length are also plotted for stable Rpe1 cell lines inducibly overexpressing cell cycle regulators (diamonds). Green diamond represents overexpression of cyclin E1 (average of four replicates, several thousand cells per sample), and red diamond represents overexpression of cyclin D1 (average of three replicates, several thousand cells per sample). Black lines mark iso-cell-size contours. Region between lines spans a 25% shift in cell size. Calculation of the Pearson correlation coefficient between log(growth rate) and log(cell cycle length), using data from conditions marked by gray circles (inhibition of growth or cell cycle progression) and green diamond (cyclin E1 overexpression), yields r = −0.76, p=2.1×10⁻⁷, by two-tailed Student’s t-test, indicating a significant inverse correlation between growth rate and cell cycle length in these conditions. (B–E) The experiment presented in Figure 7 and Figure 8A was repeated in several additional cell lines. The resulting mean growth rate vs. mean cell cycle length plots are shown for U2OS (B), SAOS2 (C), HeLa (D), and 16HBE (E). The corresponding plots of fold change in cell cycle length, growth rate, and size in each condition, for these four cell lines, are shown in Figure 9—figure supplements 1–4. For (A–E), growth rates are measured in arbitrary units of accumulated SE-A647 intensity per hour. In each experiment, all calculated growth rates were divided by a scaling factor such that the average growth rate of control samples = 1, to aid in comparison between cell lines. The raw data and source code necessary to generate (A–E) are included in Figure 9—source data 1.
-
Figure 9—source data 1
File contains the source code and source data necessary to generate Figure 9 and its associated figure supplements, using Matlab.
Figure_9A.m generates Figure 9A, and Figure_9 .m generates Figure 9B–E and Figure 9—figure supplements 1–4. Source data include measurements of cell cycle length, cell size (total SE-A647 intensity), and cell count over time, under the conditions labeled in Figure 9—figure supplements 1–4.
- https://doi.org/10.7554/eLife.26957.033
Figure 9—figure supplement 1
U2OS cell size is stabilized by a compensatory relationship between cell cycle length and growth rate.
U2OS cells were treated with varying doses of drugs inhibiting growth (A) or cell cycle progression (B), as well as drugs that were found to disrupt size specification in Rpe1 cells (C). The fold change in mean cell cycle length (left panel), growth rate (middle panel), and cell size (right panel), relative to untreated cells, is plotted for each condition. Experimental details as described in Figure 7. The raw data and source code necessary to generate this figure are included in Figure 9—source data 1.
Figure 9—figure supplement 2
SAOS2 cell size is stabilized by a compensatory relationship between cell cycle length and growth rate.
SAOS2 cells were treated with varying doses of drugs inhibiting growth (A) or cell cycle progression (B), as well as drugs that were found to disrupt size specification in Rpe1 cells (C). The fold change in mean cell cycle length (left panel), growth rate (middle panel), and cell size (right panel), relative to untreated cells, is plotted for each condition. Experimental details as described in Figure 7. The raw data and source code necessary to generate this figure are included in Figure 9—source data 1.
Figure 9—figure supplement 3
HeLa cell size is stabilized by a compensatory relationship between cell cycle length and growth rate.
HeLa cells were treated with varying doses of drugs inhibiting growth (A) or cell cycle progression (B), as well as drugs that were found to disrupt size specification in Rpe1 cells (C). The fold change in mean cell cycle length (left panel), growth rate (middle panel), and cell size (right panel), relative to untreated cells, is plotted for each condition. Experimental details as described in Figure 7. The raw data and source code necessary to generate this figure are included in Figure 9—source data 1.
Figure 9—figure supplement 4
16HBE cell size is stabilized by a compensatory relationship between cell cycle length and growth rate.
16HBE cells were treated with varying doses of drugs inhibiting growth (A) or cell cycle progression (B), as well as drugs that were found to disrupt size specification in Rpe1 cells (C). The fold change in mean cell cycle length (left panel), growth rate (middle panel), and cell size (right panel), relative to untreated cells, is plotted for each condition. Experimental details as described in Figure 7. The raw data and source code necessary to generate this figure are included in Figure 9—source data 1.
Figure 10 with 1 supplement
Genetic perturbations of cell cycle length.
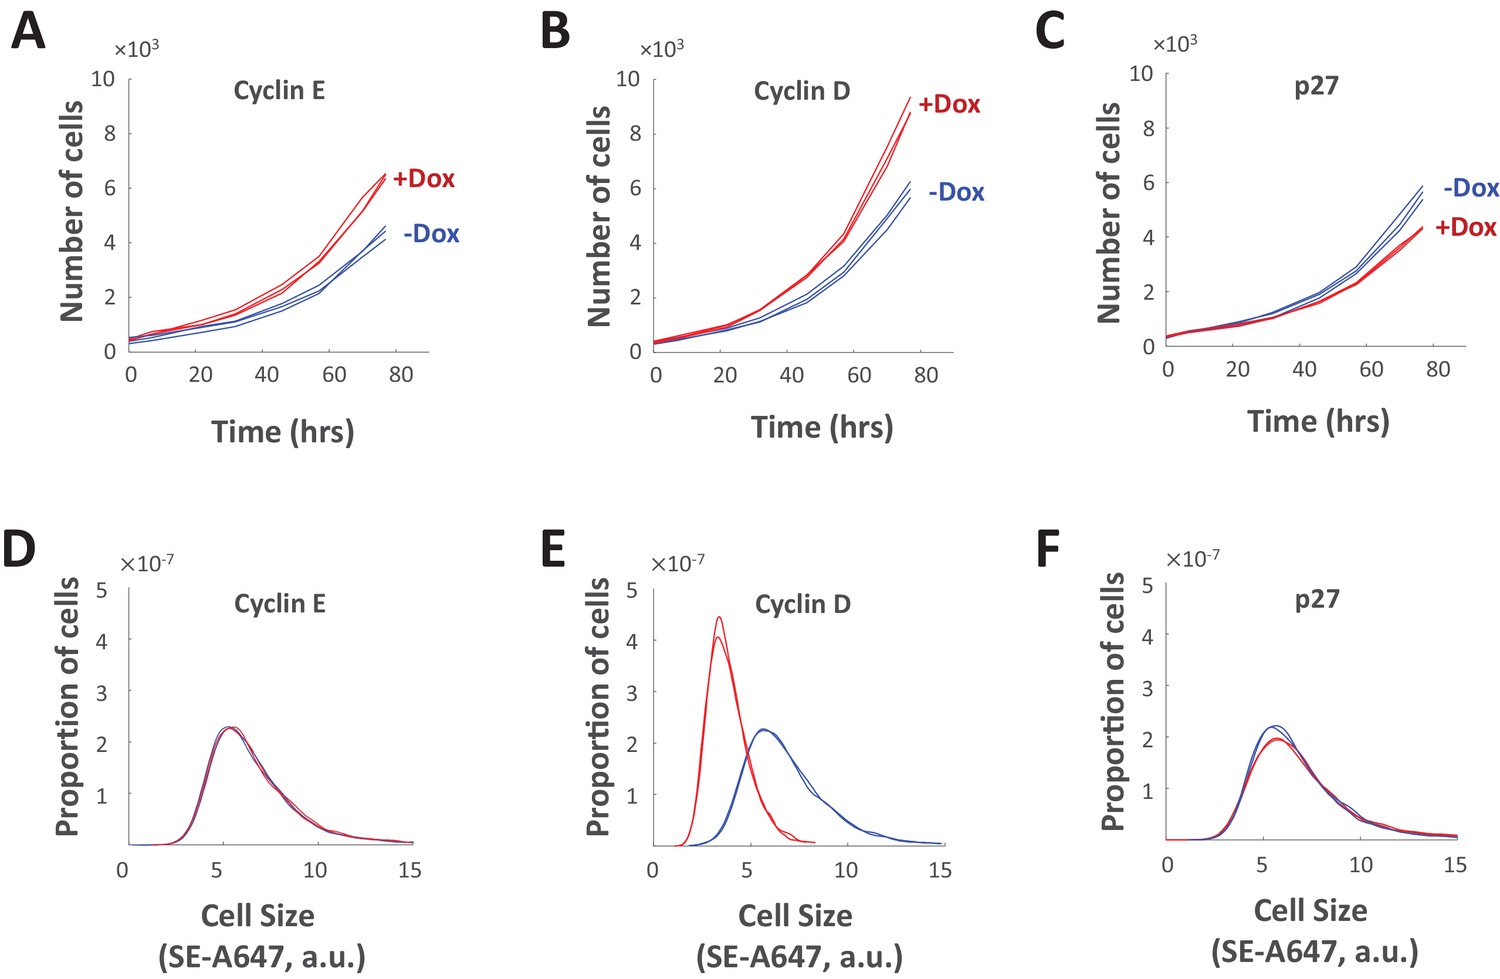
(A–C) Proliferation of Rpe1cells with doxycycline-induced overexpression of cyclin E1 (A), cyclin D1 (B), or p27 (C). For (A–C), proliferation was monitored by differential phase contrast imaging of untreated cells (blue) and doxycycline-treated cells (red). (D–F) Cell size distributions of Rpe1 cells after 77 hr of doxycycline-induced overexpression of cyclin E1 (D), cyclin D1 (E), or p27 (F). For (D–F), cell size was measured by SE-A647 staining of untreated cells (blue) and doxycycline-treated cells (red). The experiment was done in triplicate, and cell size was measured in several thousand cells per sample. The raw data and source code necessary to generate (A–F) are included in Figure 10—source data 1.
-
Figure 10—source data 1
File contains the source code (Figure_10 .m) and source data necessary to generate Figure 10 using Matlab.
Source data include measurements of cell cycle length, cell size (total SE-A647 intensity), and cell count over time, under the conditions labeled in Figure 10.
- https://doi.org/10.7554/eLife.26957.036
Figure 10—figure supplement 1

Doxycycline-inducible overexpression of cyclin E, p27, and cyclin D1.
Stable Rpe1 cell lines were generated with doxycycline-inducible overexpression of cyclin E1 (A), p27 (B), or cyclin D1 (C), as described in Materials and methods. Western blots confirm overexpression of expected protein 6 hr after induction with doxycycline.
Additional files
-
Transparent reporting form
- https://doi.org/10.7554/eLife.26957.037
Download links
A two-part list of links to download the article, or parts of the article, in various formats.
Downloads (link to download the article as PDF)
Open citations (links to open the citations from this article in various online reference manager services)
Cite this article (links to download the citations from this article in formats compatible with various reference manager tools)
Cell size sensing in animal cells coordinates anabolic growth rates and cell cycle progression to maintain cell size uniformity
eLife 7:e26957.
https://doi.org/10.7554/eLife.26957


