Ingression-type cell migration drives vegetal endoderm internalisation in the Xenopus gastrula
- University of Toronto, Canada
Figures
Figure 1
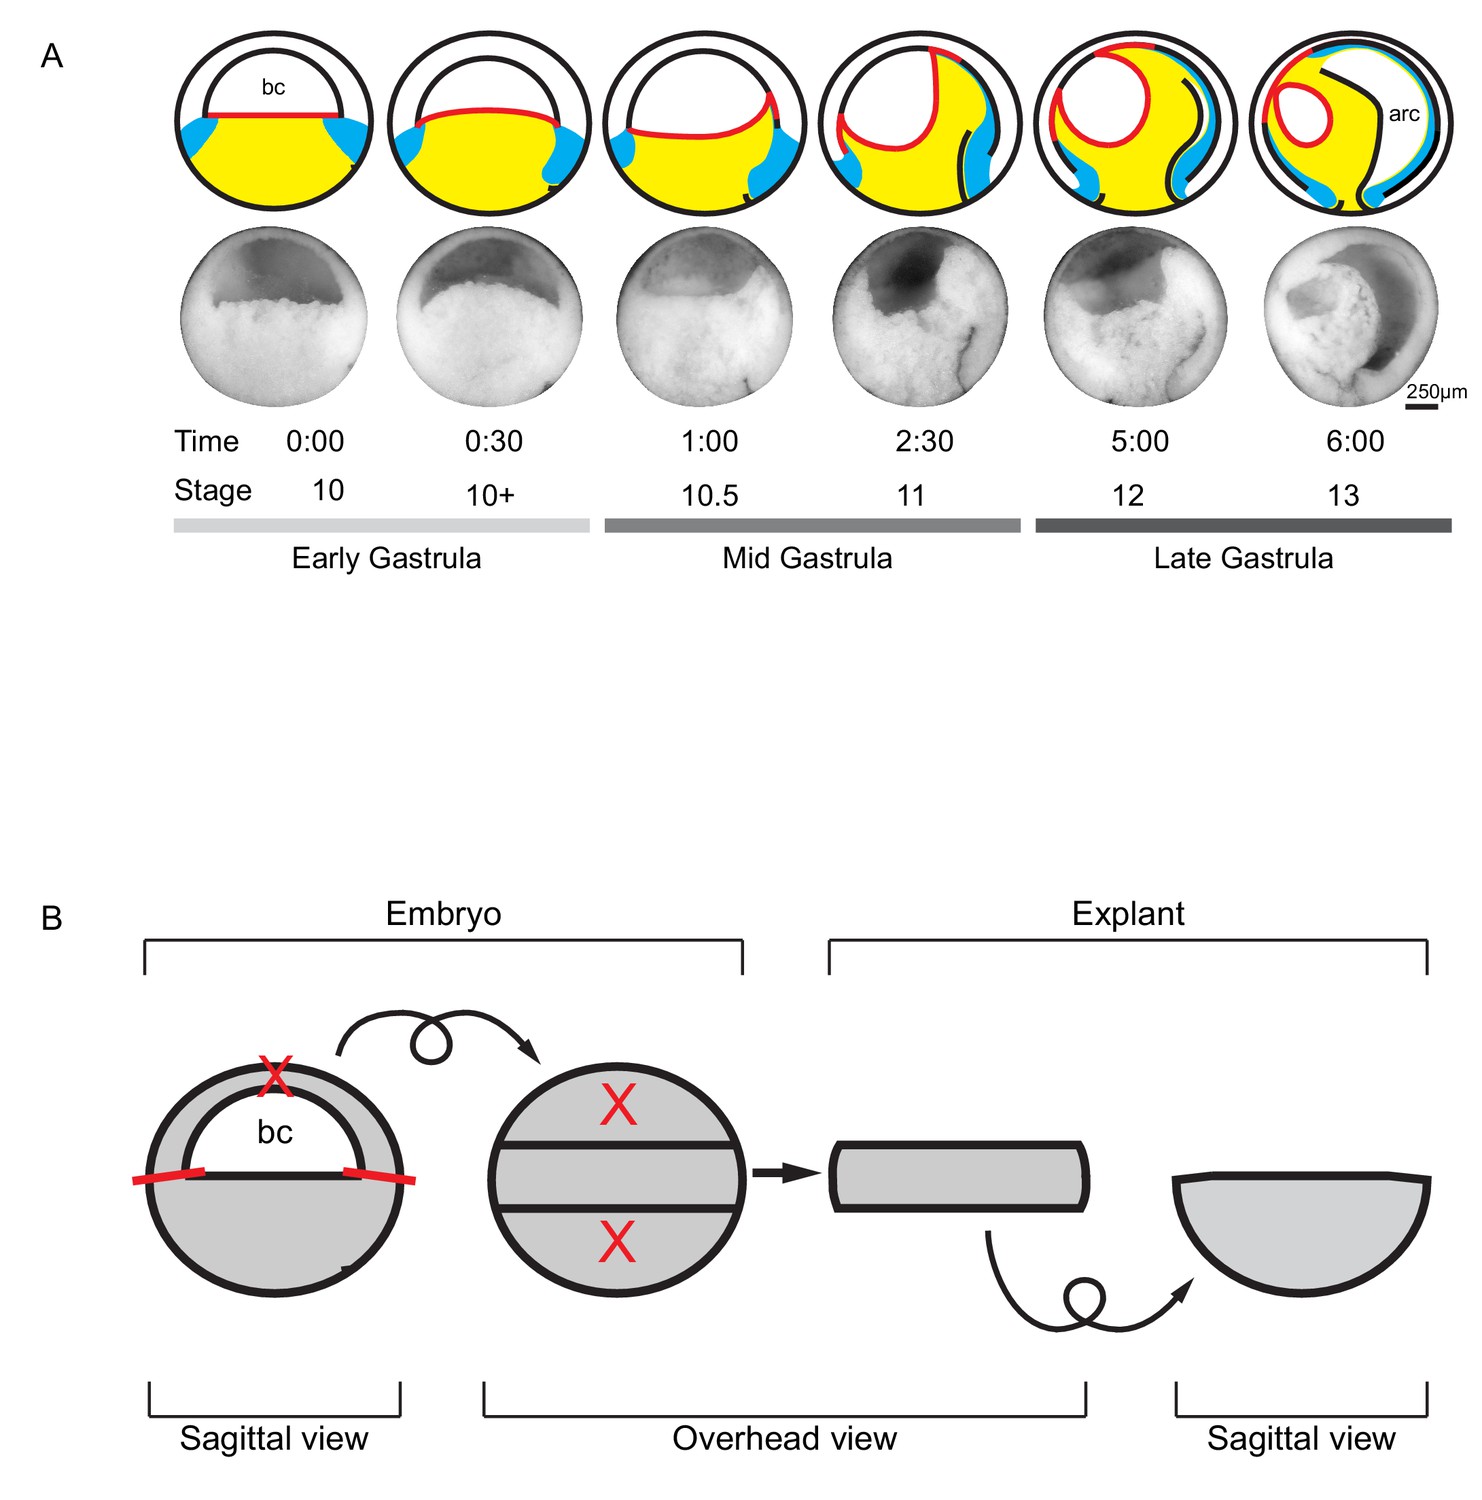
Tissue movements during Xenopus laevis gastrulation.
(A) Fate map and tissue deformation of X. laevis germ layers for stages 10–13. Movements of the ectoderm (white), mesoderm (blue), and endoderm (yellow) are indicated (top row). Blastocoel floor expansion throughout developmental stages is shown (red line). Mid-sagittally fractured gastrulae at stages 10–13 (mid row). Animal is to the top, vegetal to the bottom, ventral to the left, and dorsal to the right. Early, mid, and late stage gastrulae are shown together with the corresponding developmental stage and timeline (bottom row). The onset of gastrulation is set as 0:00 in hours and minutes. Blastocoel (bc) and archenteron (arc) are indicated. (B) Schematic of vegetal explant. The ectodermal BCR was removed with incisions shown (red lines). A mid-sagittal slice of about 5 cell layers thick was removed from the vegetal half of stage 10 embryos and placed under a coverslip for observation. Discarded regions are indicated (X’s). Arrows indicate that the explant was tilted 90° toward the viewer to provide an overhead view, and then flipped back to the sagittal view.
Figure 2 with 1 supplement
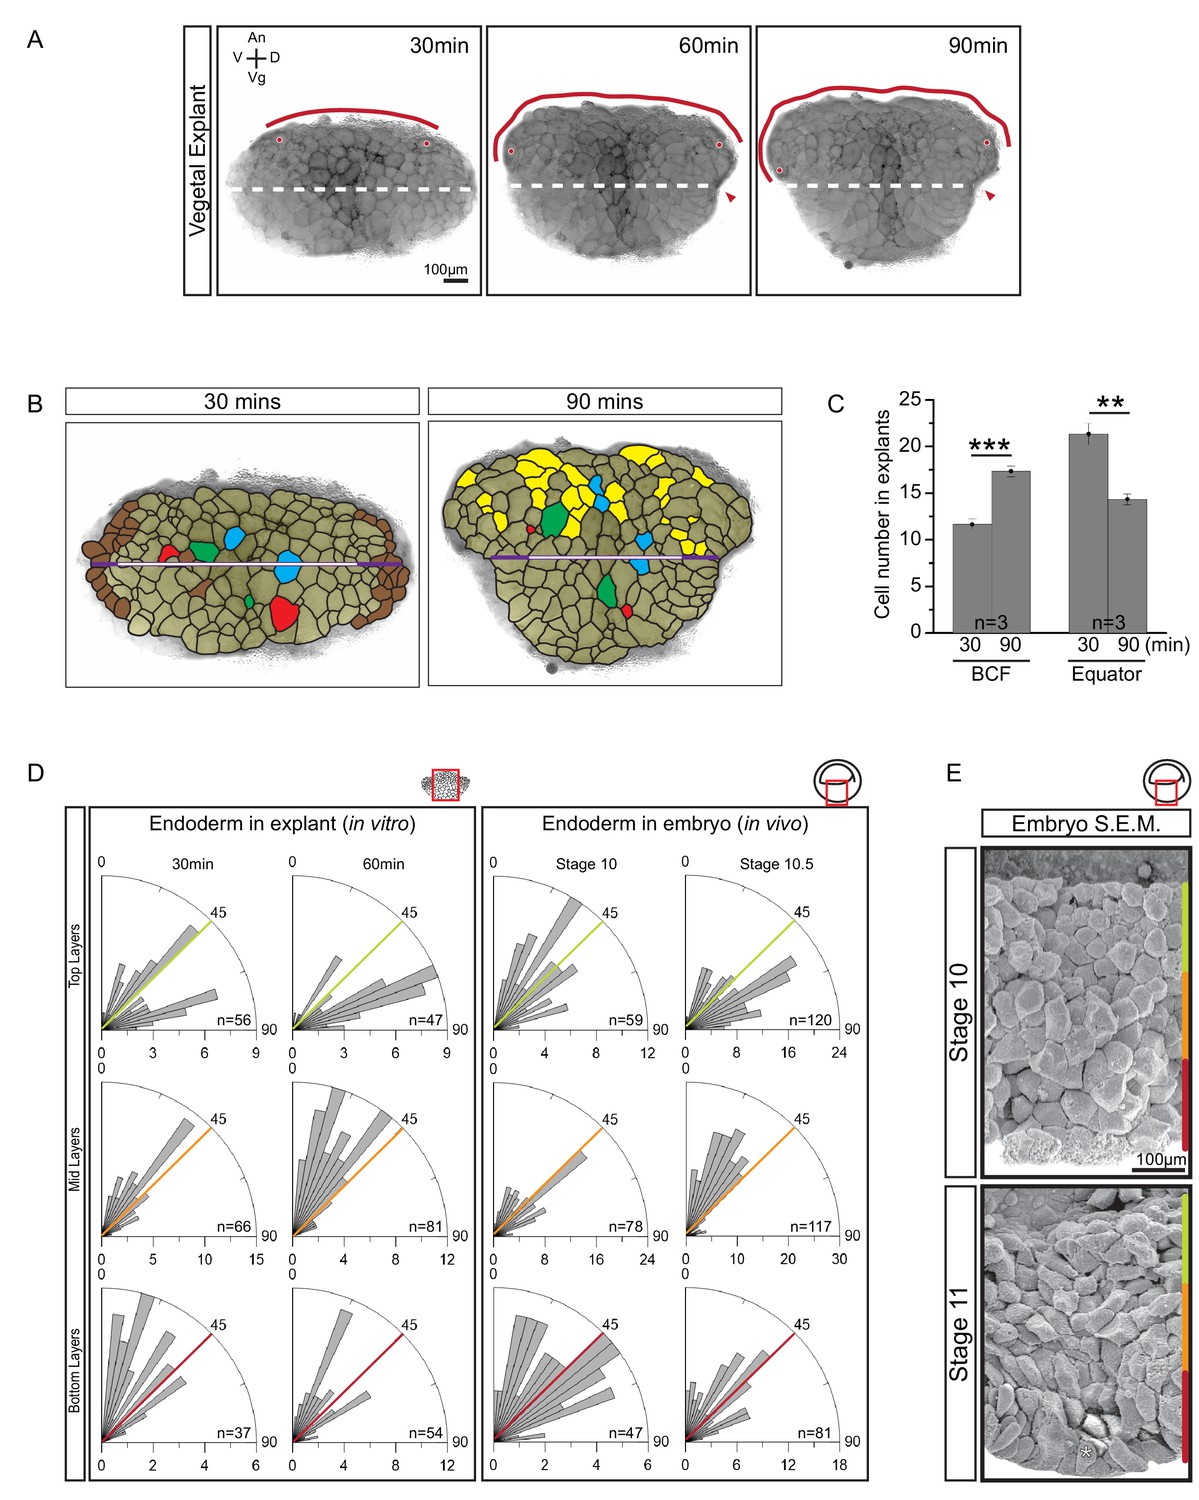
Cellular basis of vegetal rotation.
(A) Tissue autonomous movement in live explants. Blastocoel floor (BCF) expansion was followed in explants (red line). BCF length was determined by tracking positions of peripheral endoderm cells (red dots). The equatorial waist (white dashed line) at the explant mid-point runs at the level of the dorsal blastopore (red arrowhead). Animal (An) is to the top, vegetal (Vg) to the bottom, ventral (V) to the left, and dorsal (D) to the right. (B) Cell behaviours in explants. Cells are outlined for the explant shown in Figure 2A, and morphogenetic cell behaviours from 30 to 90 min are indicated (coloured cells). Elongated marginal cells (purple zones) are shown with respect to the cells of the vegetal cell mass (white zone) of the equatorial waist (white and purple solid line). Cells that disappeared from the surface (Brown), cells that emerged at the surface from deep layers (Yellow), cells undergoing division (Blue), cells that reduced their area at the surface as they migrated into deep layers (Red), and cells that increased their surface as they spread out during migration (Green) are shown. (C) Quantification of cell numbers at the BCF and equatorial waist. Error bars indicate S.D. (D) Quantification of cell orientation. Rose diagrams indicate the number of cells in explants (left) or in embryos (right) oriented at given angles relative to the A–V axis in the top (yellow), mid (orange), and bottom (red) cell layers. At stage 10, the endoderm has an average of twelve cell layers, which were evenly divided into three regions. The lengths of bars indicate the number of occurrences in 5° bins. (E) Endoderm cells depicted in scanning electron micrographs of mid-sagittally fractured gastrulae. An apically constricted epithelial surface cell is indicated (asterisk). Corresponding stages are indicated on the left. A schematic of the region of interest (red box) is indicated in the top right corner of select panels. A ruler corresponding to the approximate position of top (yellow), mid (orange), and bottom (red) cell layers is shown in each panel. Panels show data from 14 embryos collected from different egg batches.
-
Figure 2—source data 1
Quantification of cellular changes during vegetal rotation.
- https://doi.org/10.7554/eLife.27190.007
Figure 2—figure supplement 1
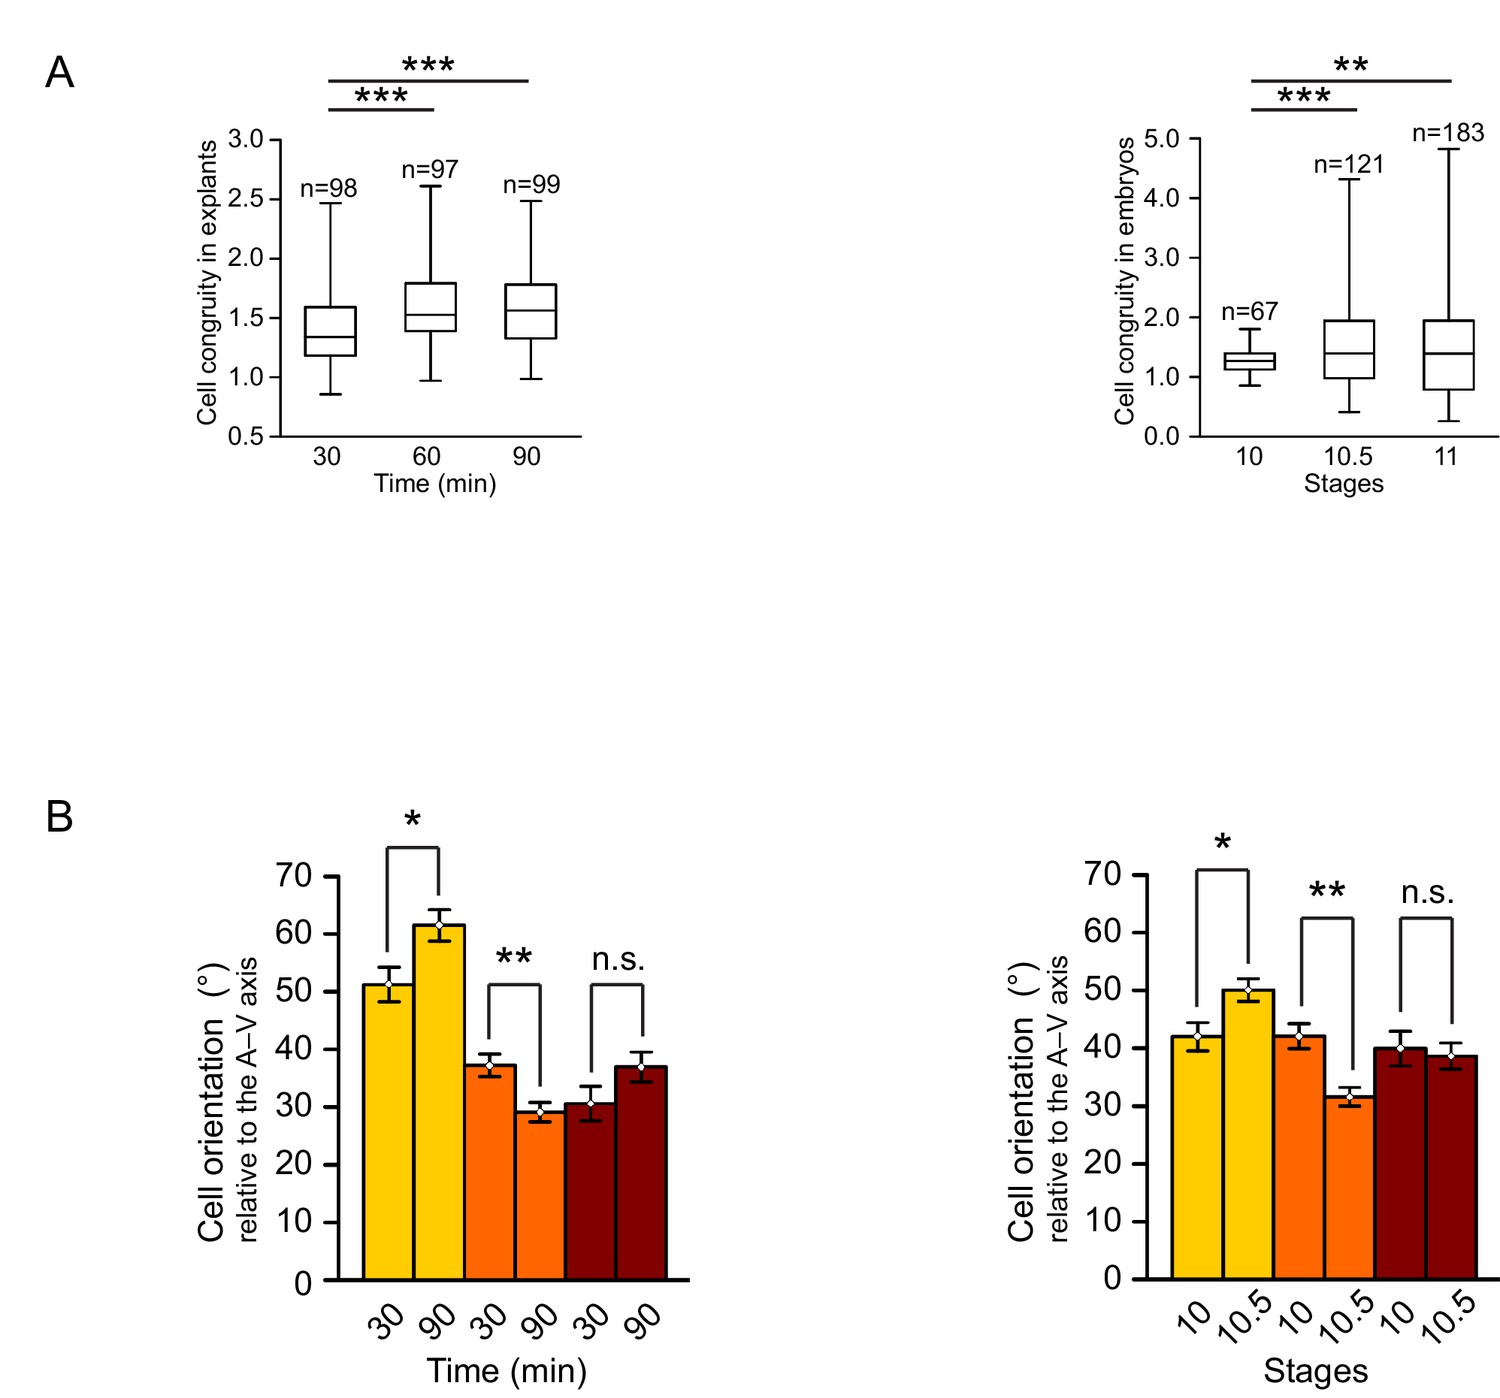
Quantification of cellular changes during vegetal rotation.
(A) Cell congruity (defined in Figure 6—figure supplement 1) in explants (left) and embryos (right). Averages were 1.41 (30 min), 1.57 (60 min), and 1.57 (90 min) in explants; 1.27 (S10), 1.53 (S10.5), and 1.46 (S11) in embryos. Box plots show the median, interquartile range, maximum and minimum. (B) Cell orientation angles (°) from Figure 2D represented as a histogram of mean angles. Plots show average angles in explants (left) and embryos (right). Colours indicate top (yellow), mid (orange), and bottom (red) cell layers. Plots show data cumulatively sampled from 14 embryos collected from different egg batches. Bars indicate S.E.
-
Figure 2—figure supplement 1—source data 1
Quantification of cellular changes during vegetal rotation.
- https://doi.org/10.7554/eLife.27190.008
Figure 3
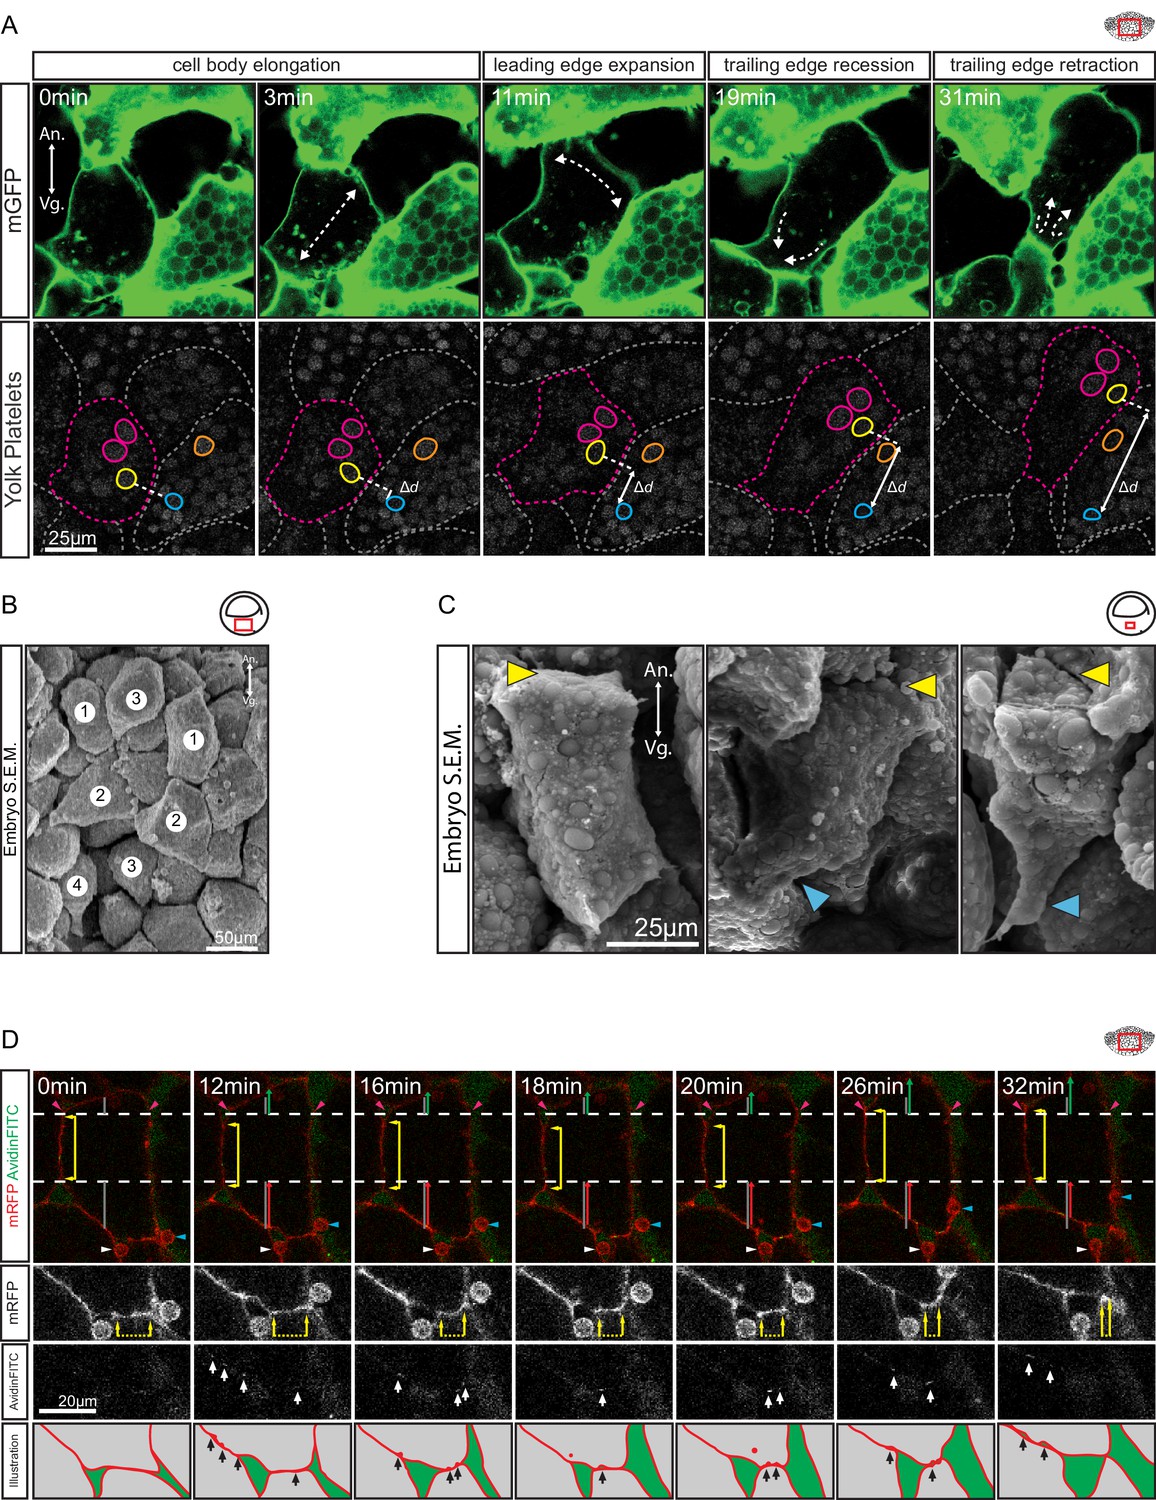
Amoeboid cell behaviours.
(A) Amoeboid migration of vegetal endoderm cells. mGFP-labelled cells (top row) are shown. Major cell shape changes (dashed arrows) are indicated. Yolk platelets in the same cells are shown in bottom row. A select cell (pink dashed outline) moves with respect to neighbouring cells (grey dashed outlines). Select yolk platelets (pink and yellow outlines) within the moving cell and platelets in a neighbour cell (blue and orange platelets) are indicated. Platelets in different cells move relative to each other, indicating cell migration. Degree of platelet displacement is indicated (Δd, white double arrow). (B, C) Endoderm cell morphology in the embryo, as seen in SEM. (B) Morphology is consistent with amoeboid movement, cells are numbered as showing (1) cell elongation, (2) leading edge expansion, (3) trailing edge recession, and (4) retraction. (C) Higher magnification of cells undergoing leading edge expansion (left), trailing edge recession (center), and trailing edge retraction (right). Cell front (yellow arrows) and rear (blue arrows) are indicated. (D) Coordinate behaviors during cell locomotion. An elongated cell maintains stable lateral borders (yellow arrowed line) throughout time interval (parallel dashed white lines). To advance, the leading edge is extended (green arrow) relative to its initial length (top grey line), while the trailing edge is retracted (red arrow) relative to its initial length (bottom grey line). Extracellular debris attached to the leading cell (blue arrow) and lagging cell (white arrow) are indicated to show displacement. Enlargement of the trailing edge shows contact reduction (mRFP panels, dashed line flanked by arrows) between cells. AvidinFITC puncta are visible (white arrows) at sites of membrane undulation. Interpretation of trailing edge retraction is depicted in bottom rows. AvidinFITC puncta are indicated (black arrows). Area in green corresponds to interstitial space. In all panels, animal (An) is to the top, and vegetal (Vg) to the bottom. Schematic showing the region of interest (red box) is indicated in the top right corner of select panels.
Figure 4 with 1 supplement
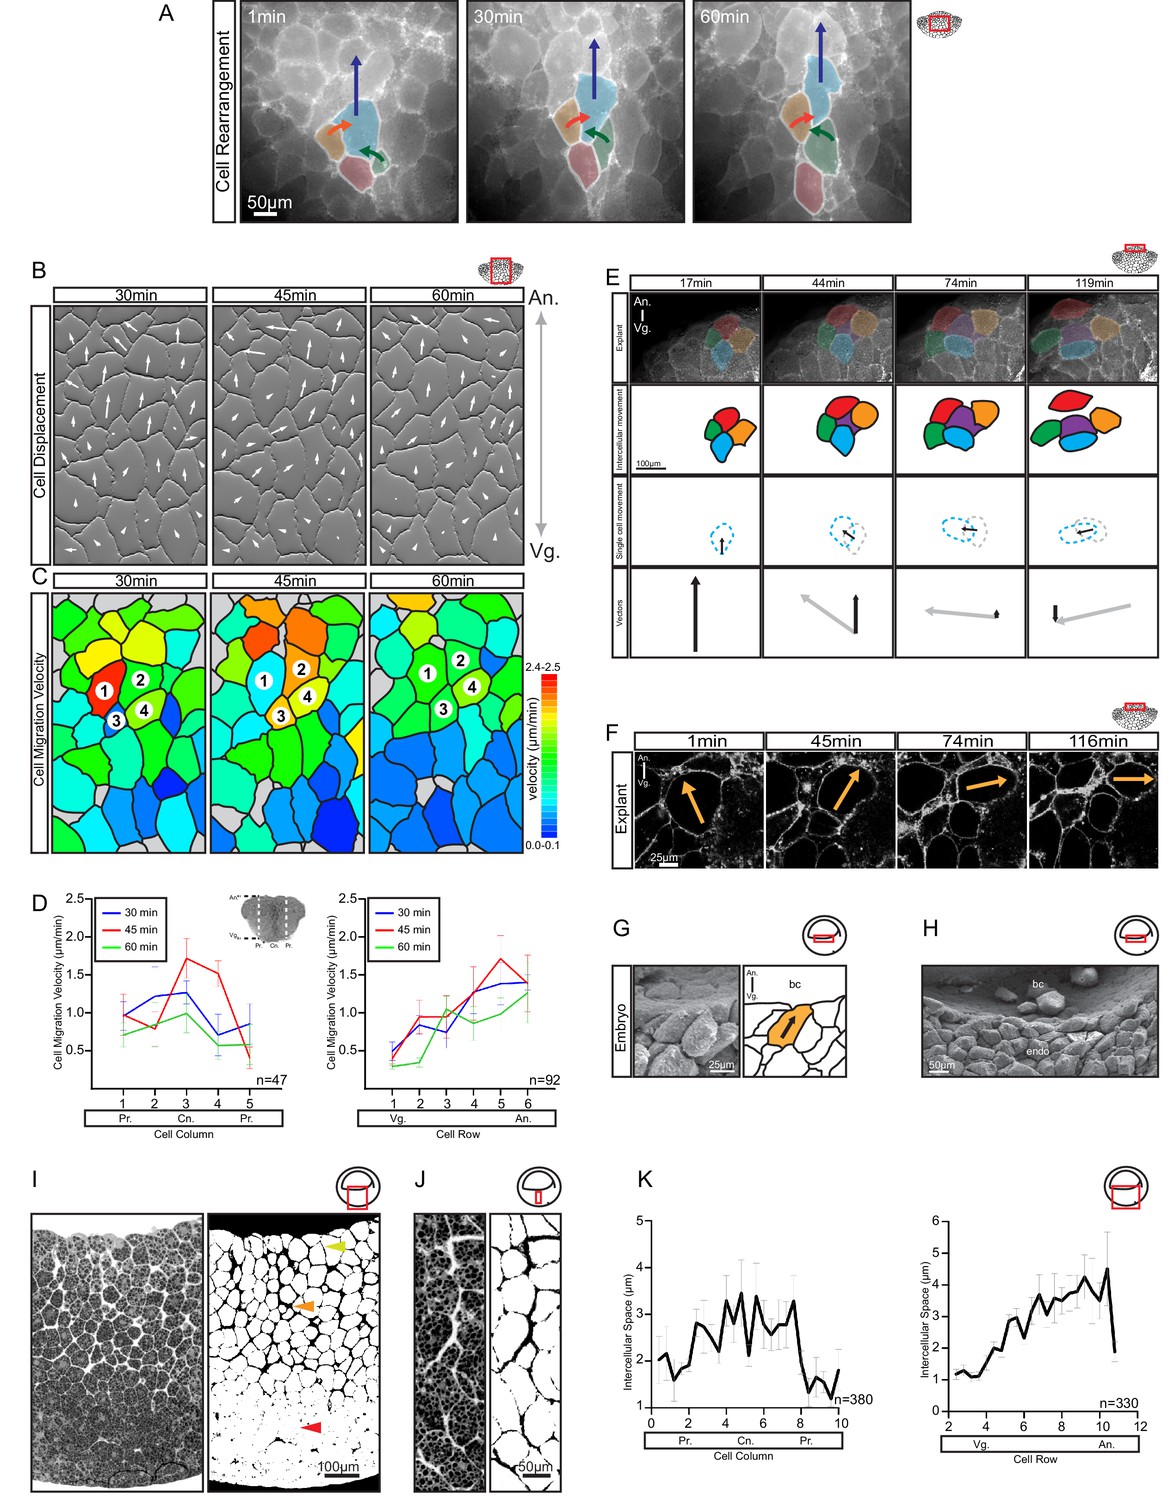
Differential cell migration.
(A) Cell rearrangement in explants. A leading cell (blue) moves away from the lagging cell (red), neighbouring cells (orange, green) converge to fill the gap. Corresponding trajectories are shown (coloured arrows). (B) Cell displacement in explants. Displacements were recorded starting 15 min after explantation. Panels indicate changes in cell positions between 15–30, 30–45, and 45–60 min. Direction and magnitude of displacements (white arrows) are indicated. (C) Migration velocity variability in explants. Velocities correspond to displacements shown in (B). Cells 1–4 move as described in (A). Colours refer to velocity scale (right). Grey cells were not tracked due to poor visibility. (D) Migration velocity in cell columns (left) and rows (right). Plots show average instantaneous velocities at different time intervals after explantation (colours). Bars indicate S.E. Schematic marks the explant center (Cn), periphery (Pr), animal (An), and vegetal (Vg) boundaries. Panels show data from three embryos from different egg batches. (E) Total velocity is maintained while its vertical component is reduced at the BCF as cells change orientation. Cell movement (top row). Cohort (top-mid row) shows a leading cell (green) advancing laterally relative to the lagging cell (orange), the gap that opens is filled by an inserting deep cell (purple). Cell near the surface (red) remained parallel to the BCF. A deep cell (blue) initially oriented perpendicular to the surface re-oriented to a parallel alignment with the BCF. Cell re-orientation (bottom-mid row) of deep cell (blue dashed outline) relative to its previous position (grey dashed outline) is indicated (arrow). Re-orienting cell velocity vectors (bottom) showing the vertical component (black arrow) relative to the total velocity vector (grey arrow). (F) Cell re-orientation. Optical section shows that the entire cell body is rotated during re-orientation. Movement is indicated (orange arrow). (G, H) Cell morphology in the embryo is consistent with cell reorientation and insertion at the BCF. SEM of cells at the BCF of stage 10.5 gastrulae (left), elongated cell is highlighted (orange, black arrow), blastocoel (bc) is indicated. endo, vegetal endoderm cells. (I, J) Interstitial gaps between cells in the embryo. (I) TEM section through the endoderm (left), negative of TEM (right). Gap width varies between the top (yellow arrow), mid (orange arrow), and bottom cell layers (red arrow). (J) A vertical series of gaps shows gap-width increase in a vegetal to animal direction. (K) Gap width in cell columns (left) and rows (right) in gastrulae. Error bars indicate S.E. Panels show data from six embryos from different egg batches. Schematic of the region of interest (red box) is indicated in the top right corner of select panels.
-
Figure 4—source data 1
Quantification of differential cell migration.
- https://doi.org/10.7554/eLife.27190.012
Figure 4—figure supplement 1
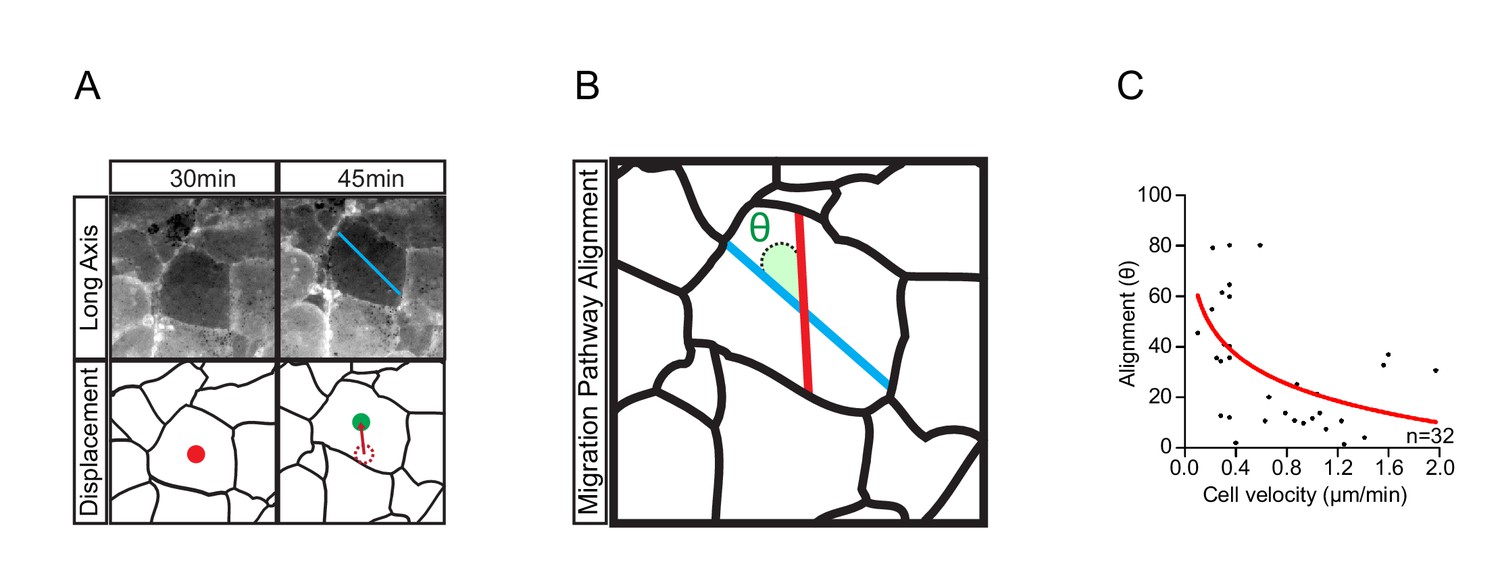
Cell translocation is a result of active cell movement and passive drift imposed by surrounding cells.
(A) The longitudinal axis of the cell (blue line, top row) which coincides with the direction of active cell movement does not always align with the resultant path of cell displacement (red line, bottom row). Original position (red centroid) of the cell is indicated at 30 min. Cell position after 15 min (green centroid) is indicated at 45 min. Cell displacement from origin to destination is indicated (dashed centroid outline). (B) Trajectory alignment of cell in (A). Deviation of the resultant path (red line) from the intended path (blue line) is represented by alignment angle (θ). Alignment is high when θ is small, or poor when θ is large. Thus, during movement, cells may drift sideways to some extent. (C) Inverse relationship of alignment angle (θ) to cell velocity in explants (i.e. cells with less drift tend to move faster). Fitted curve (red line) is indicated in scatter-plot. Panels show data cumulatively sampled from three embryos collected from different egg batches.
-
Figure 4—figure supplement 1—source data 1
Quantification of cell alignment with respect to cell velocity.
- https://doi.org/10.7554/eLife.27190.013
Figure 5
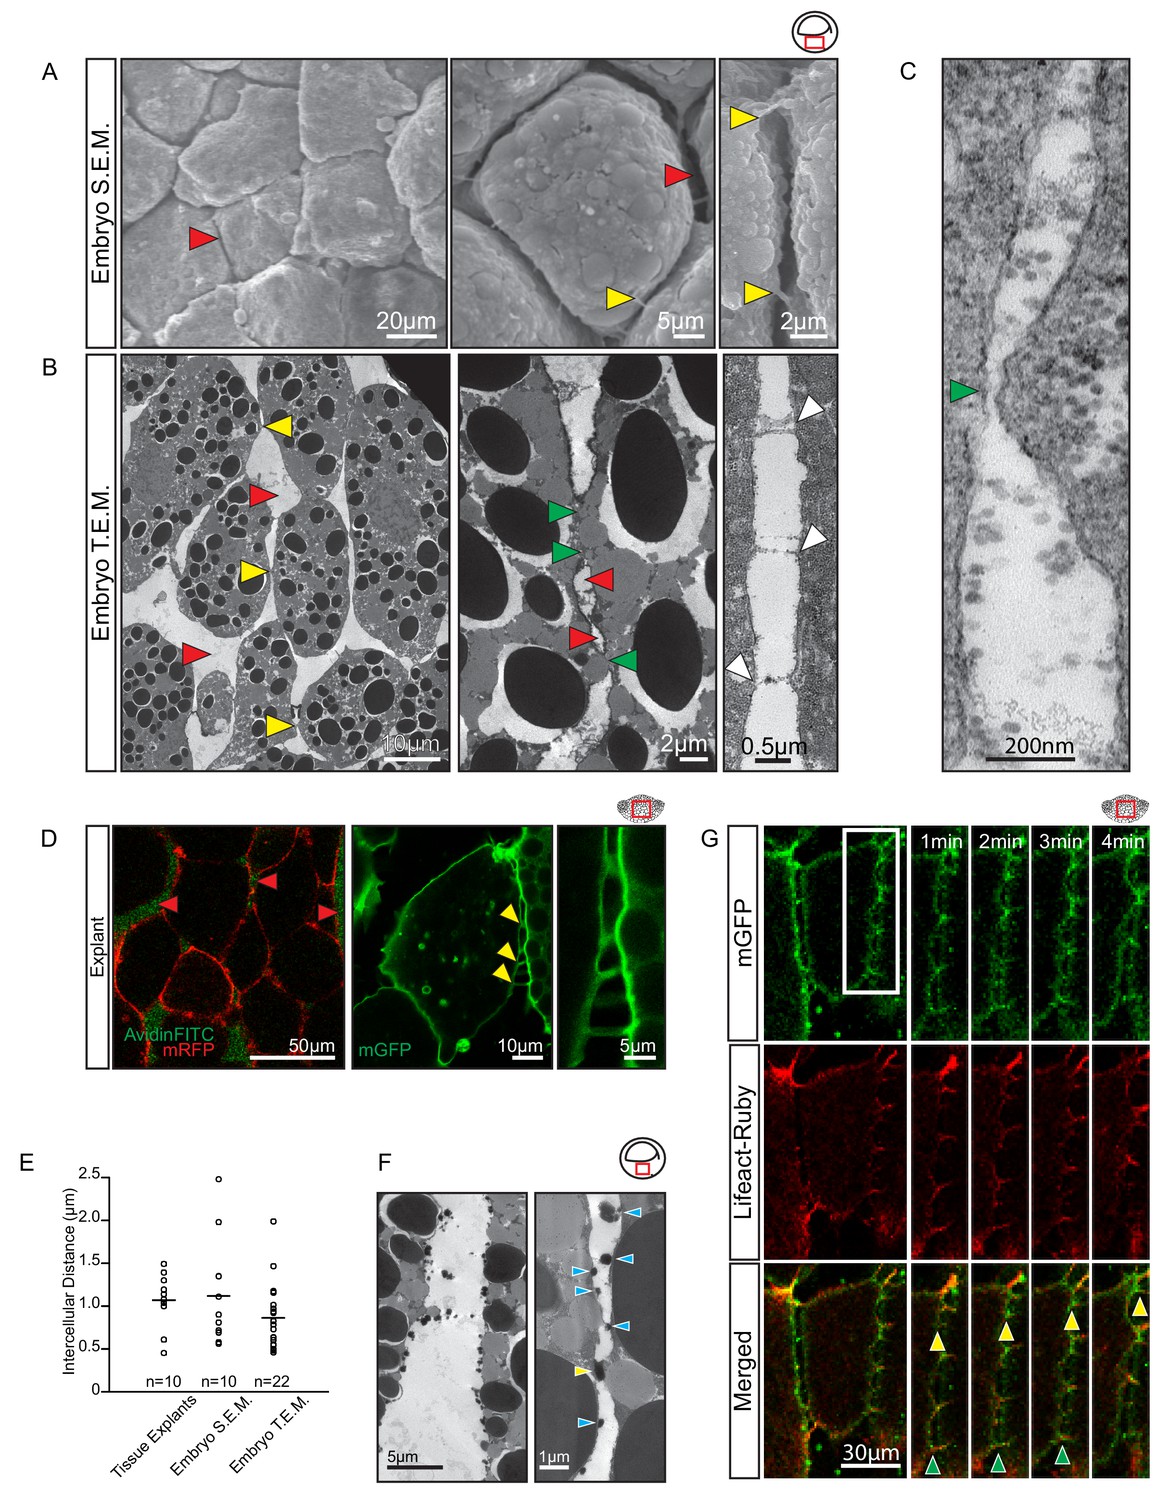
Vegetal endoderm cells migrate through wide interstitial spaces.
(A) SEM of endoderm in embryos. Overview (left). High magnification (center) reveals interstitial spaces between cells (red arrows). Cells are linked by stitch contacts (right; yellow arrows). (B) TEM of endoderm in embryos. Overview (left), cell gaps (3- or 4 cell junctions; red arrow) and cell–cell contacts (yellow arrow) are indicated. Higher magnification (center) show contacts (green arrows) interspersed between gaps (red arrows). Base of stitch contacts appear raised (white arrows), indicating tethers are taut (right). (C) A cell-cell contact (green arrow) compatible with cadherin-based adhesion (~30 nm). (D) Interstitial gaps in explants. Labelled (mRFP) explants (left) in medium with AvidinFITC to visualize gaps (red arrows). Stitch contacts (yellow arrows) extend between cells (center). Magnified view of contacts (right). (E) Quantification of intercellular distance in explants, whole embryo SEM, and TEM. Measurements were taken from the central, mid-endodermal region. (F) Interstitial gaps contain extracellular matrix. Putative heteroglycans stained using Alcian Blue appear as black cell surface residues under TEM (blue arrows) or link cells (yellow arrow). Plot shows data cumulatively sampled from four embryos collected from different egg batches. (G) Cells form dynamic intercellular contacts. Membrane label (mGFP; top) and Lifeact-Ruby (middle) co-expressing cells show contacts containing F-actin (merged; bottom). Time-lapse sequence (four right panels) of a region of interest (box) shows that protrusions extend (yellow arrows) and retract (green arrows). Region of interest (red box) is indicated in the top right corner of select panels.
-
Figure 5—source data 1
Quantification of intercellular distance.
- https://doi.org/10.7554/eLife.27190.017
Figure 6 with 1 supplement
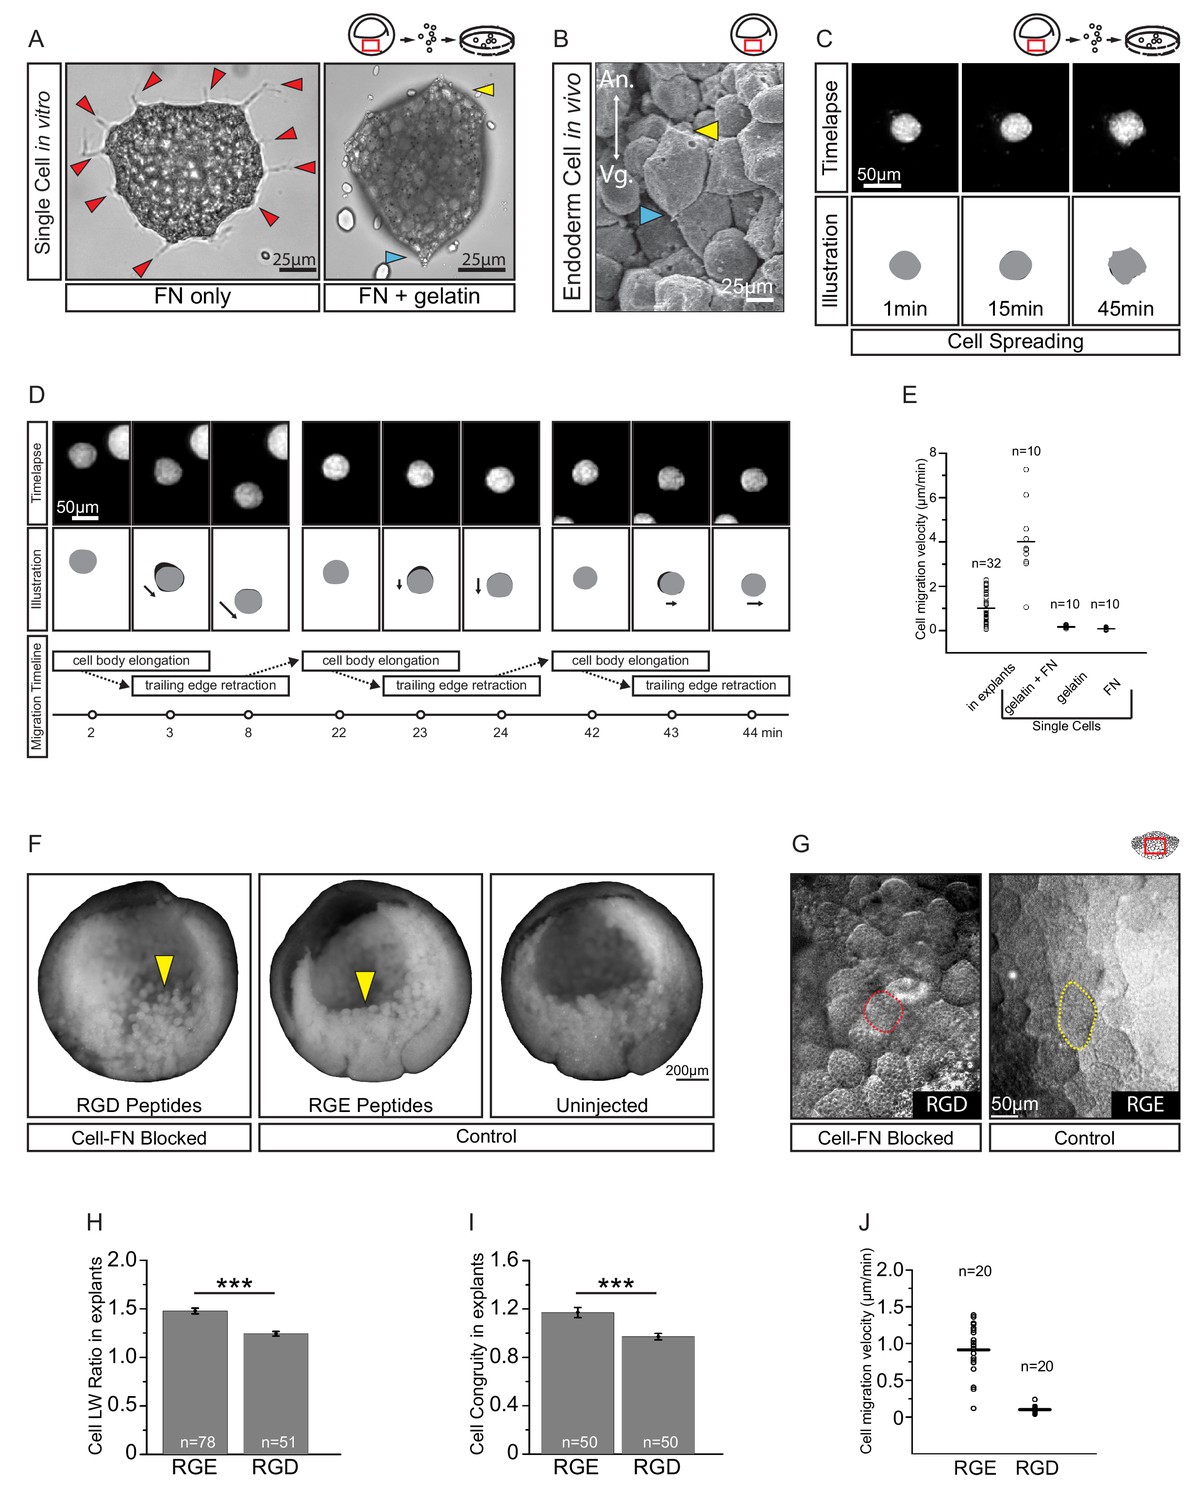
Fibronectin is required for vegetal endoderm cell migration.
(A) Endoderm cell morphology on different substrates. Cells on plastic coated with FN (left) are multipolar (red arrows). Cells on gelatin coated with FN (right) are unipolar with front (yellow arrow) and rear (blue arrow). (B) Morphology in vivo. Endoderm cell with front (yellow arrow) and rear (blue arrow) polarity. Animal (An) is up, vegetal (Vg) is down. (C) Cell spreading on FN. Cell shape changes (top row) are outlined (bottom row), consecutive shapes (grey) differ from shapes at previous time points (difference in black). Time in minutes is indicated. (D) Cell locomotion on gelatin-FN in vitro. Morphological changes (top row) are outlined (mid row) along with movement direction (black arrows) and differences in cell shape (black) between time points. A representative cell is followed, panels show bursts of movement over the course of 45 min. Interpretation of cell behaviours (bottom row). (E) Cell migration velocity in vitro. Velocities of cells in explants with respect to the epithelium, and of single cells with respect to in vitro substrates. (F) Inhibition of FN binding in embryos. Embryos were injected with RGD (left) or RGE peptides (center) into the blastocoel at blastula stage 8, or left uninjected (right), cultured until stage 11, fixed, and sectioned sagittally. RGD treatment perturbed endoderm morphology relative to controls (yellow arrows). (G) Inhibition of FN binding in explants. Explants in medium containing RGD (left), or RGE (right) peptides. RGD-treated cells appear rotund (pink outline), RGE-treated cells elongated (yellow outline). Region of interest (red box) is indicated in the top right corner of select panels. (H) Cell length-width ratio in explants incubated in RGE (left) or RGD peptides (right). (I) Cell elongation congruity (defined in Figure 6—figure supplement 1) in explants incubated in RGE (left) or RGD peptides (right). (J) Cell migration velocity in explants incubated in RGE (left) or RGD peptides (right). For H–J, plots show data sampled from three embryos from different egg batches.
-
Figure 6—source data 1
Quantification of cell migration velocity and congruity.
- https://doi.org/10.7554/eLife.27190.020
Figure 6—figure supplement 1
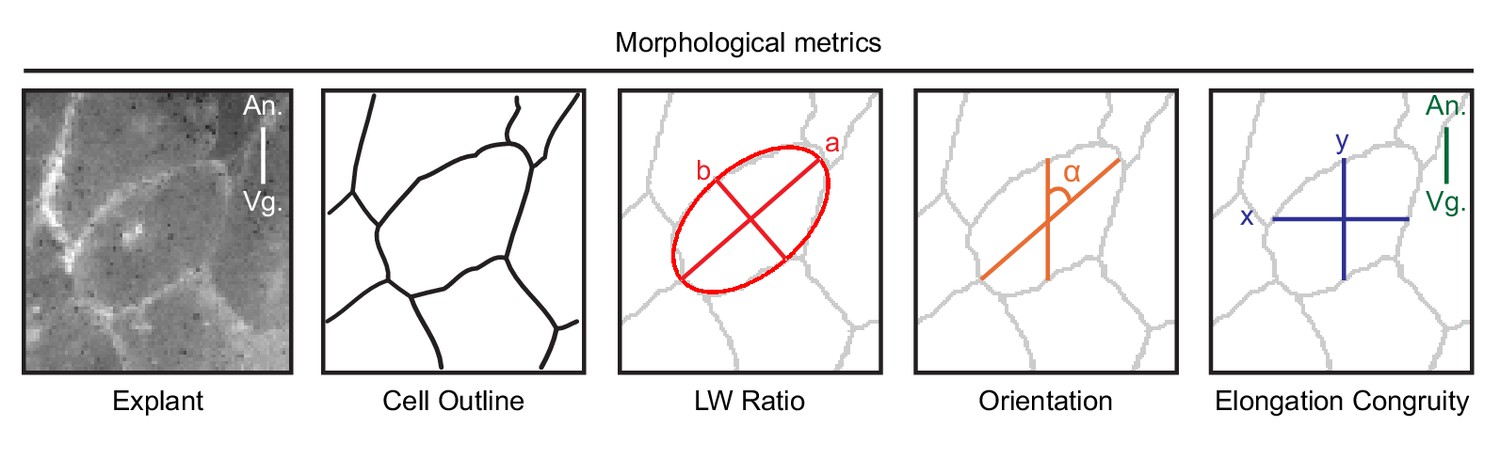
Schematic of morphometric analyses.
To characterize cell morphology, we analyzed time-lapse recordings of membrane-labelled cells in explants, and in the embryo. For computer-assistant analysis, we first used cell segmentation to identify cell outlines. Segmentation accuracy was manually verified. To find the long-axis of cells, we used the best-fit ellipse to identify the major (a) and minor (b) axes of cells. The cell aspect ratio (a/b) was used to measure the cell body length-width ratio. The long (major) axis of cells were used to determine cell orientation (α) with respect to the animal (An) – vegetal (Vg) axis. To measure the congruence (y/x) of cell elongation relative to the direction of cell migration (along the A-V axis) we measured the corresponding horizontal (x) and vertical (y) cell axes.
Figure 7 with 1 supplement

C-cadherin is required for endoderm cell migration.
(A) Protrusions engage in cell-cell adhesion. Labelled (mRFP) endoderm cells are elongated (yellow outline) in explants (left). Cells project protrusions (yellow arrows) onto neighbouring cells (center). Protrusions are enriched with α-catenin (blue arrow) at sites of cell-cell contact (right). (B) C-cadherin knockdown altered cell morphology and reduced protrusion formation. C-cadherin morpholino (CcadMO) injected cells appear rotund (pink outline) (left) and extend few protrusions (center). However, α-catenin (blue arrow) was still present within protrusions (right). Region of interest (red box) is indicated in the top right corners. (C) Cell length-width ratio in uninjected and CcadMO-injected explants. Cells were sampled from the middle of the central column of the endoderm. (D) Cell elongation congruity in uninjected and CcadMO-injected explants. For C and D, plots show data sampled from three embryos from different egg batches. (E) Average number of protrusions per cell in uninjected and CcadMO-injected explants. For all histograms, error bars indicate S.E. (F, G). Protrusion dynamics of uninjected and CcadMO-injected cells. Zero indicates no change (dash grey line), net gain (positive axis) and net loss (negative axis) of protrusions between consecutive time points are shown. Colours represent individual cells. For E–G, plots show data from three embryos from different egg batches. (H) Quantification of tissue cohesion. Tissue surface tension measured from uninjected and CcadMO-injected endoderm. Plot shows data from 22 embryos from different egg batches. (I) Cell migration velocity in explants comparing uninjected and CcadMO-injected cells. (J, K) Movement trajectories of cells in explants. (J) Uninjected, (K) CcadMO-injected explant after 60 min. Colours represent individual cells. For I–J, plots show data from four embryos collected from different egg batches.
-
Figure 7—source data 1
Quantification of the effects of C-cadherin knockdown on cell morphology and behaviour.
- https://doi.org/10.7554/eLife.27190.024
Figure 7—figure supplement 1
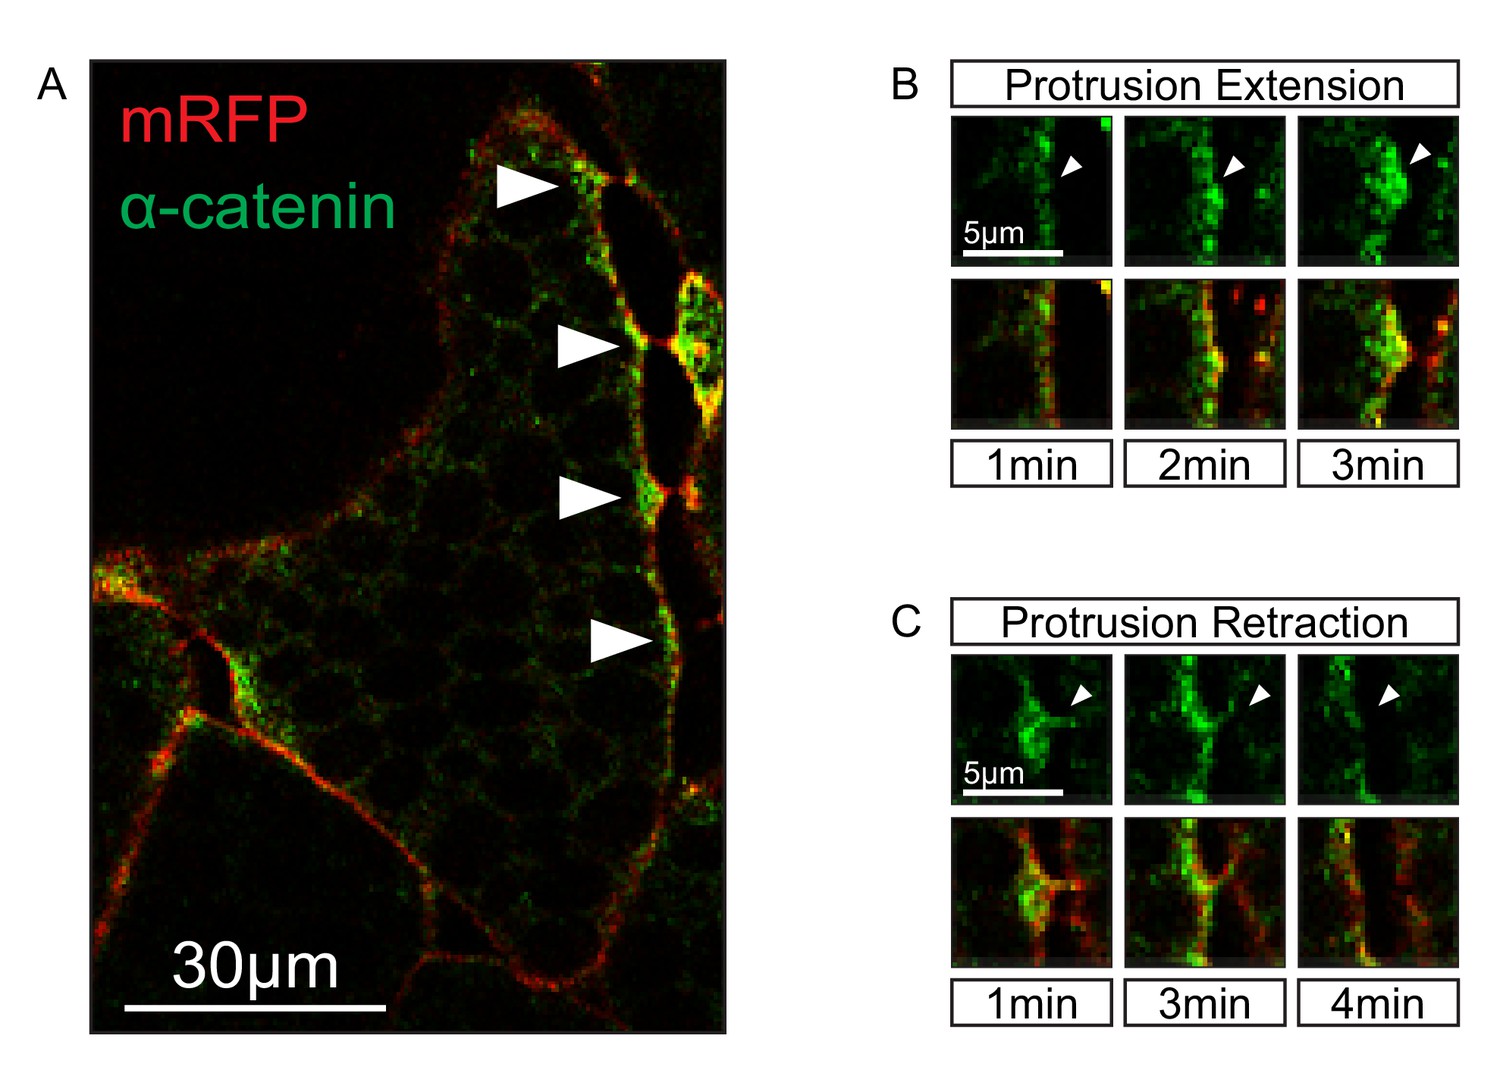
Localization of α-catenin.
(A) Localization of α-catenin-GFP at sites of cell–cell contact (white arrows). (B) Protrusion extension is correlated with α-catenin accumulation (top row, white arrows). α-catenin enrichment fills protrusions from the tip to the base (bottom row). (C) Protrusion retraction is correlated with α-catenin reduction (white arrows). After complete retraction, α-catenin is diminished in the cortex (bottom row).
Figure 8 with 1 supplement
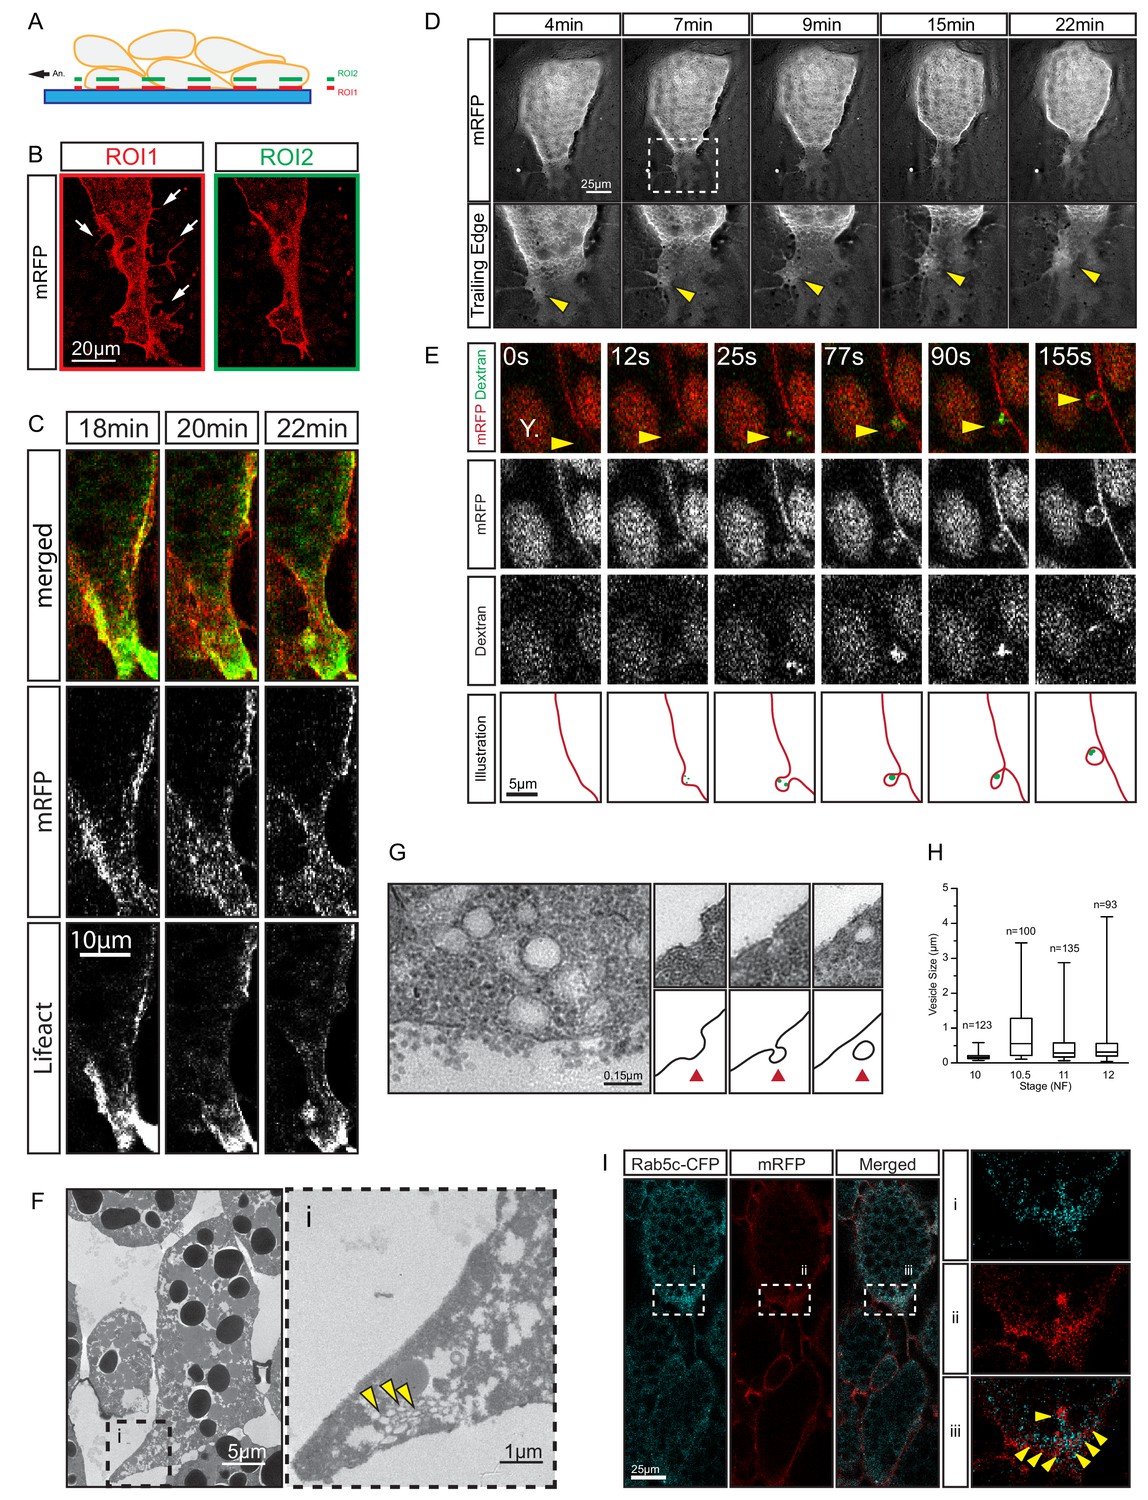
Trailing edge retraction by rear-end membrane remodeling and macropinocytosis.
(A) Regions of interest. Schematic illustrates endoderm cells in a vegetal explant, viewed through a glass slide with non-adhesive BSA coating. Direction of migration is to the left. Region 1 (ROI1) shows the plane of focus at the level of the surface of the outermost cells, and region 2 (ROI2) a plane through the cell bodies. ROI1 and ROI2 are approximately 0.5 µm apart. (B) Trailing edge representation at different planes of focus. The cell rear of a membrane labelled endoderm cell within the vegetal explant is shown. Images represent ROI1 and ROI2 introduced in (A). Membrane protrusions (arrows) are clearly visible at the substrate level. (C) Tail retraction of cell co-expressing mRFP and Lifeact-GFP. (D) Cluster of vesicles (yellow arrow) is visible at the trailing edge (top row). Enlargement of inset (box) region for all panels of the sequence (bottom row). (E) Uptake of extracellular fluid at the trailing edge (top row). Membrane label (mRFP) and probe (dextran) are shown separately in black and white (middle panels). Vesicle of interest (yellow arrow) is indicated. A nearby yolk platelet (Y) is noted. Sequence of process is illustrated below. (F) Ultrastructure of endoderm cell tail in the embryo. Overview (left), higher magnification (i) of the trailing edge shows vesicle clusters (yellow arrows). (G) Ultrastructure of vesicles near the rear membrane (left). Putative stages of vesicle internalization (right, top row) and corresponding illustrated interpretations (red arrows; bottom row) are shown. (H) Quantification of vesicle sizes from the trailing edge at different gastrula stages. Box plots show the median, interquartile range, maximum and minimum. Data were cumulatively sampled from 12 embryos collected from different egg batches. (I) Rab5c-CFP is enriched at the trailing edge during migration (left panels). Magnification of the cell-rear (inset i–iii) shows that Rab5 is localized to sites of prominent membrane remodeling (yellow arrows).
-
Figure 8—source data 1
Quantification of vesicle diameter.
- https://doi.org/10.7554/eLife.27190.027
Figure 8—figure supplement 1
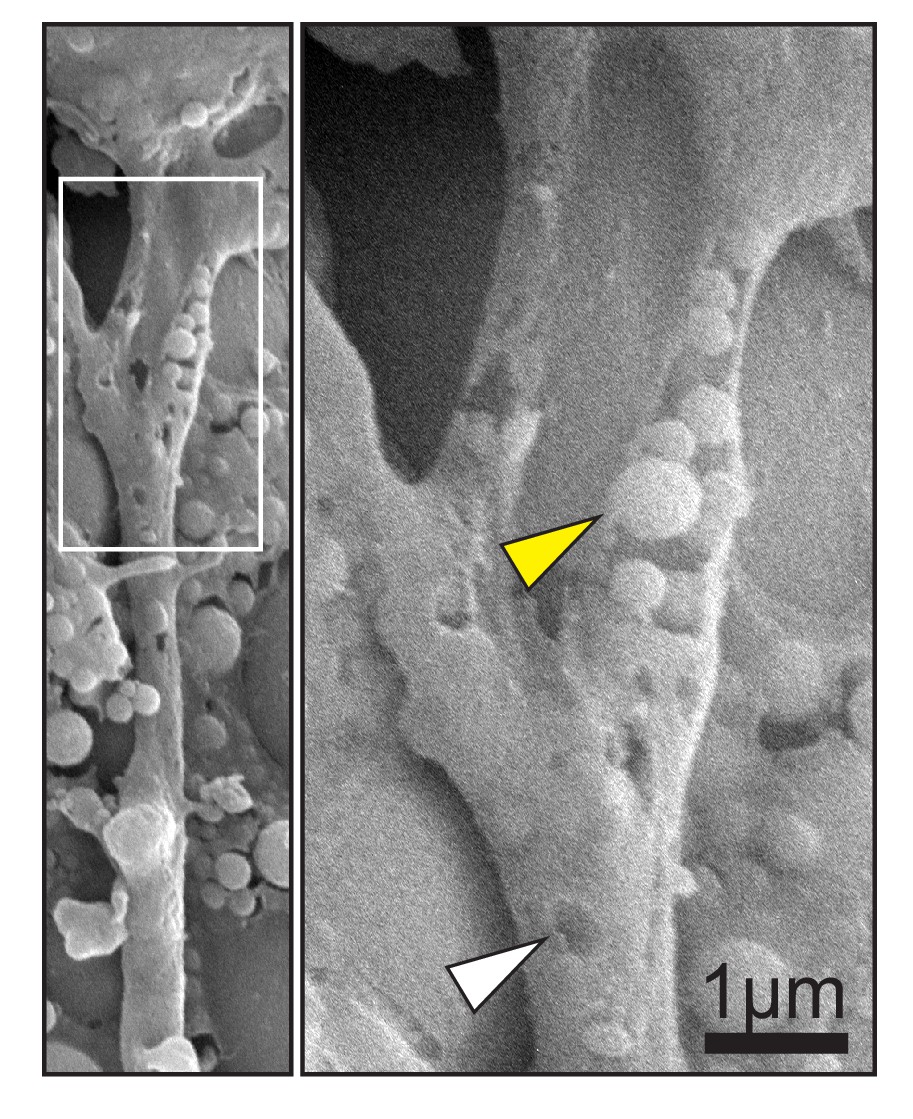
Scanning electron micrograph of cell trailing edge in vivo (left).
Magnification (right) shows heterogeneous vesicles (yellow arrow) inside a partially removed membrane, and pits (white arrow) in the intact membrane.
Figure 9 with 2 supplements
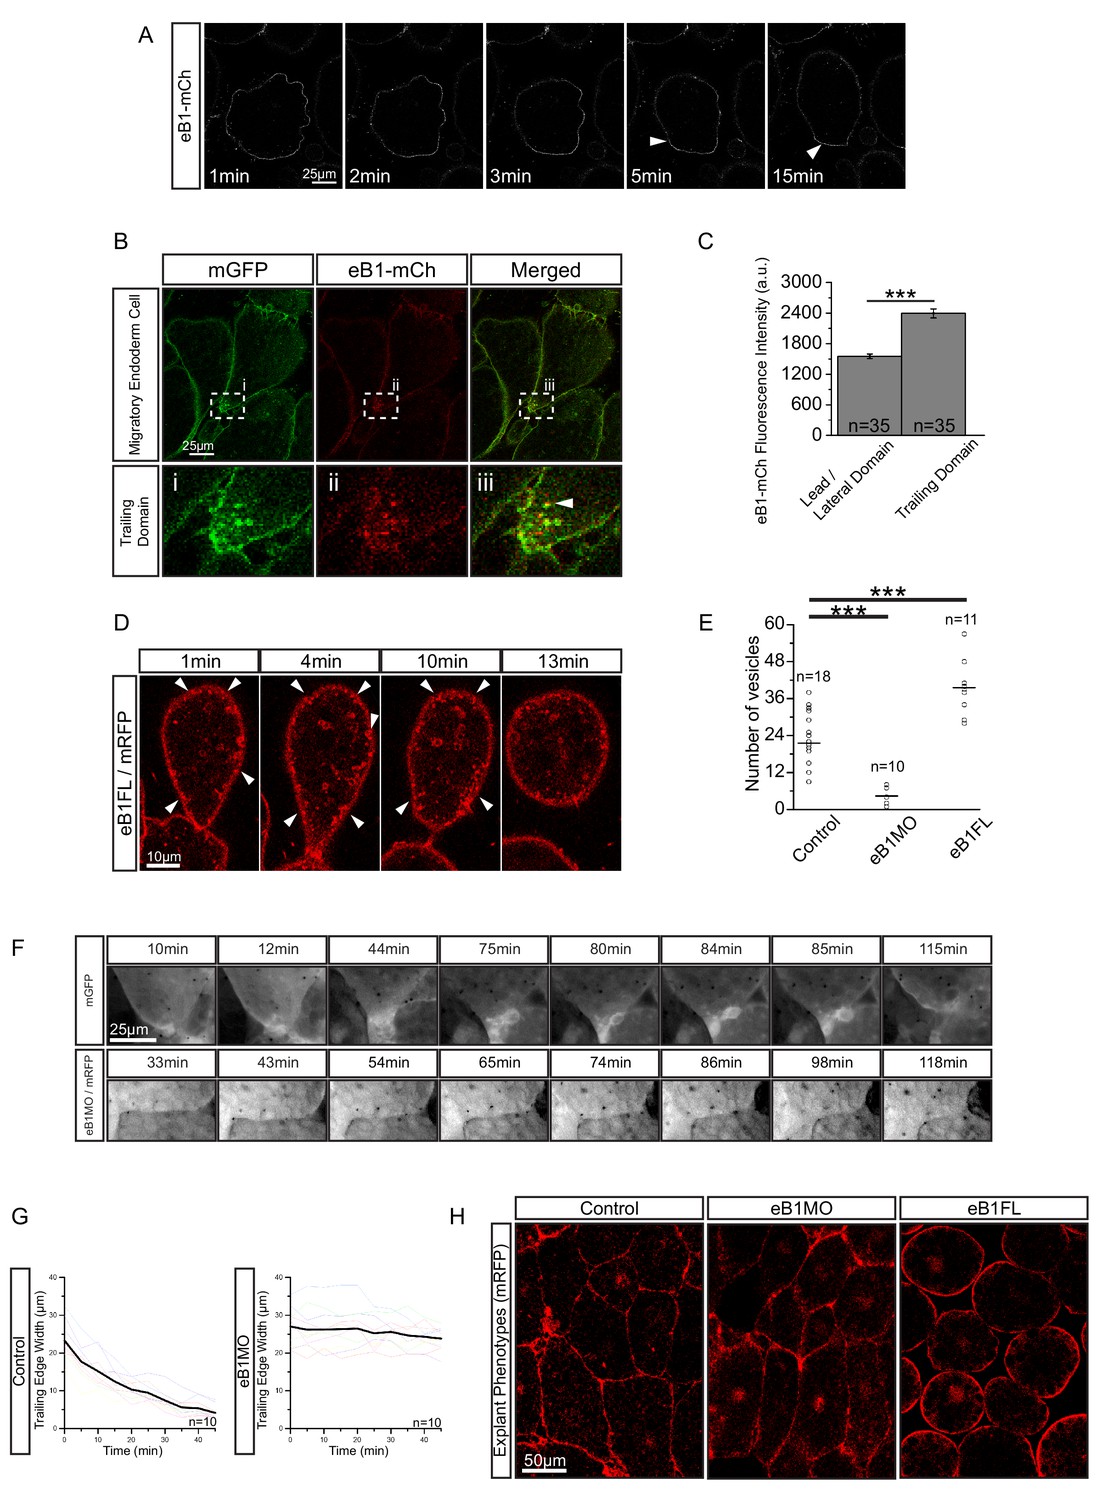
EphrinB1 involvement in endosome biogenesis.
(A) Time-lapse sequence of ephrinB1-mCherry distribution following explantation. After 5 min, ephrinB1 (eB1) has become enriched at the trailing membrane (white arrows). (B) Co-localization of ephrinB1 with endosomes (top row). Higher magnification (bottom row, i–iii) shows that ephrinB1 is enriched near endosomes (white arrow). (C) Quantification of ephrinB1-mCherry fluorescence intensity relative to mGFP at different plasma membrane domains. Bars indicate S.E. (D) Overexpression of full-length ephrinB1 (eB1FL) in membrane-labelled cells causes aberrant vesicle formation at the entire cell cortex (white arrows). (E) Quantification of vesicle number at the trailing edge of uninjected (control), ephrinB1-morpholino (eB1MO) injected, and eB1FL mRNA-injected cells. (F) Trailing edge membrane tapering during retraction. Uninjected cells show typical recession behaviour (top row), while the rear of eB1MO-injected cells remains blunt (bottom row). (G) Quantification of trailing edge width in uninjected (left) and eB1MO-injected (right) cells. Average rate change is shown (black line). Colours represent individual cells. (H) Morphology of uninjected (left), eB1MO-injected (center), and eB1FL mRNA-injected (right) labelled (mRFP) cells in live explants. Animal is to the top, vegetal to the bottom. For C, E, and G, plots show data sampled from five embryos collected from different egg batches.
-
Figure 9—source data 1
Quantification of ephrinB1 distribution, effects of ephrinB1 on vesicle number and trailing edge width.
- https://doi.org/10.7554/eLife.27190.034
Figure 9—figure supplement 1
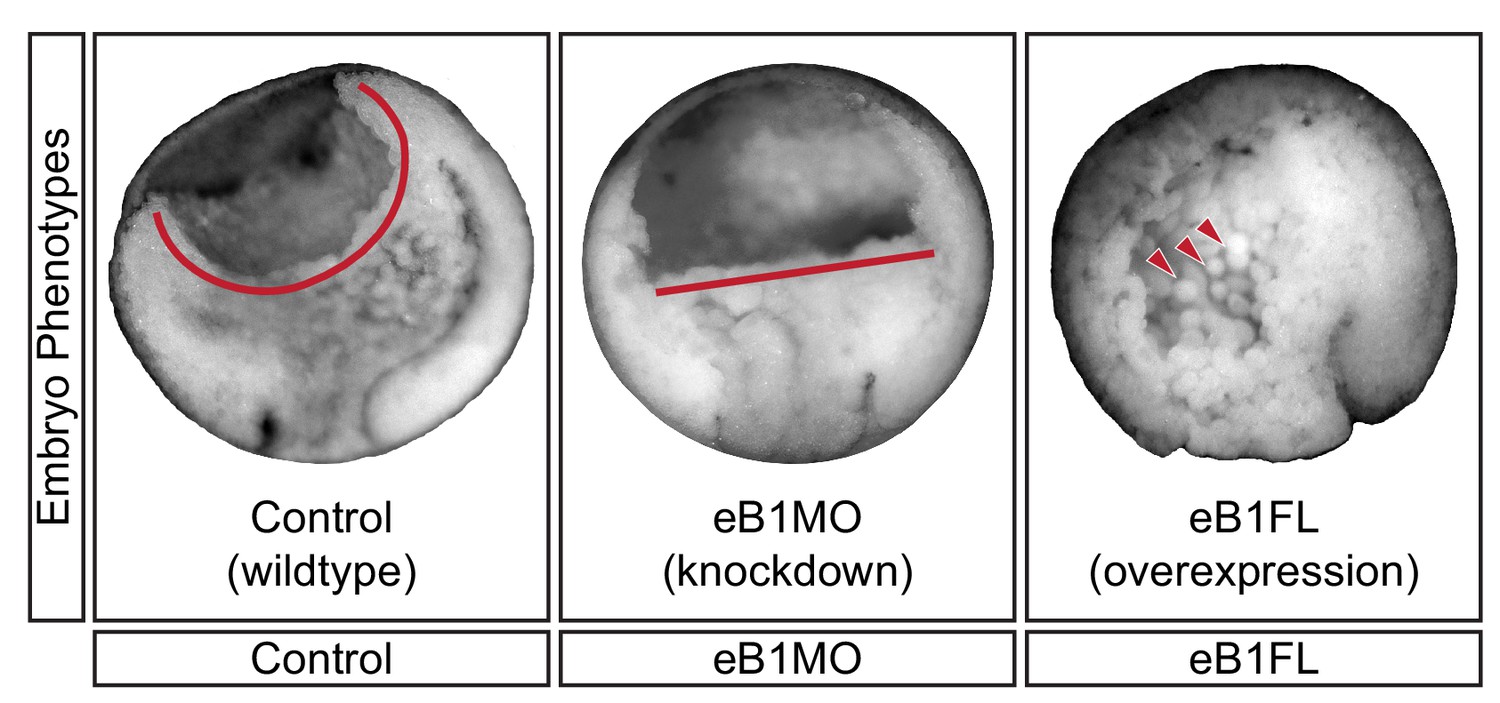
Mid-sagittal fractures of stage 12 uninjected (left), eB1MO-injected (centre), and eB1FL mRNA-injected (right) gastrulae.
BCF length (red line) and dissociated cells (red arrows) are indicated.
Figure 9—figure supplement 2
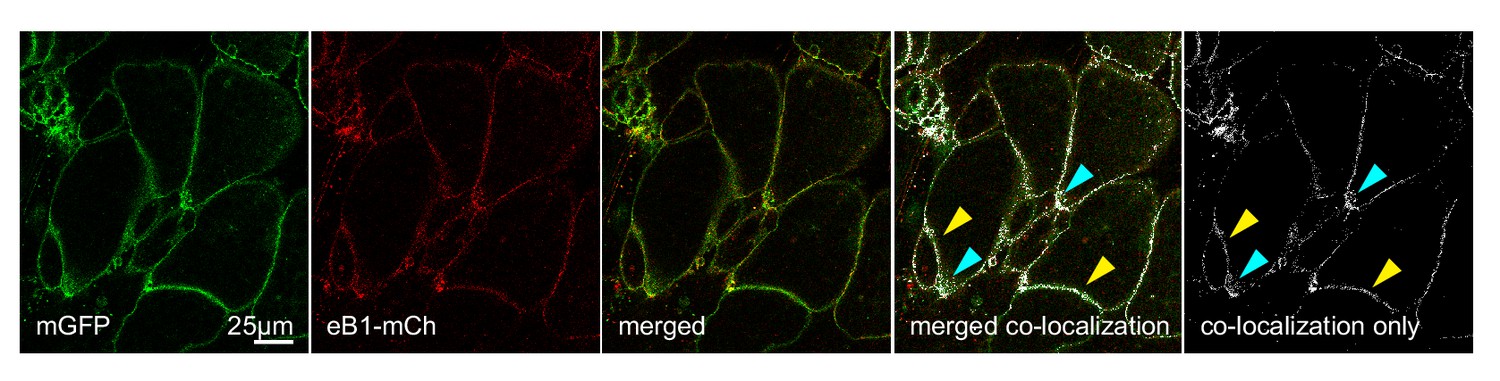
Co-localization of ephrinB1 (eB1-mCh) with membrane-label (mGFP) shows that ephrinB1 is dispersed over the entire membrane, but enriched at the trailing edge membrane (yellow arrows), particularly at the rear (blue arrows).
Individual images are shown alongside the merged image. From left to right, the images represent mGFP only, eB1-mCh only, merged composite, a co-localisation rendering showing sites of co-localisation in white (white areas) superimposed on a composite image of mGFP and eB1-mCh, and a co-localisation-only panel, with the composite image removed for clarity.
Figure 10
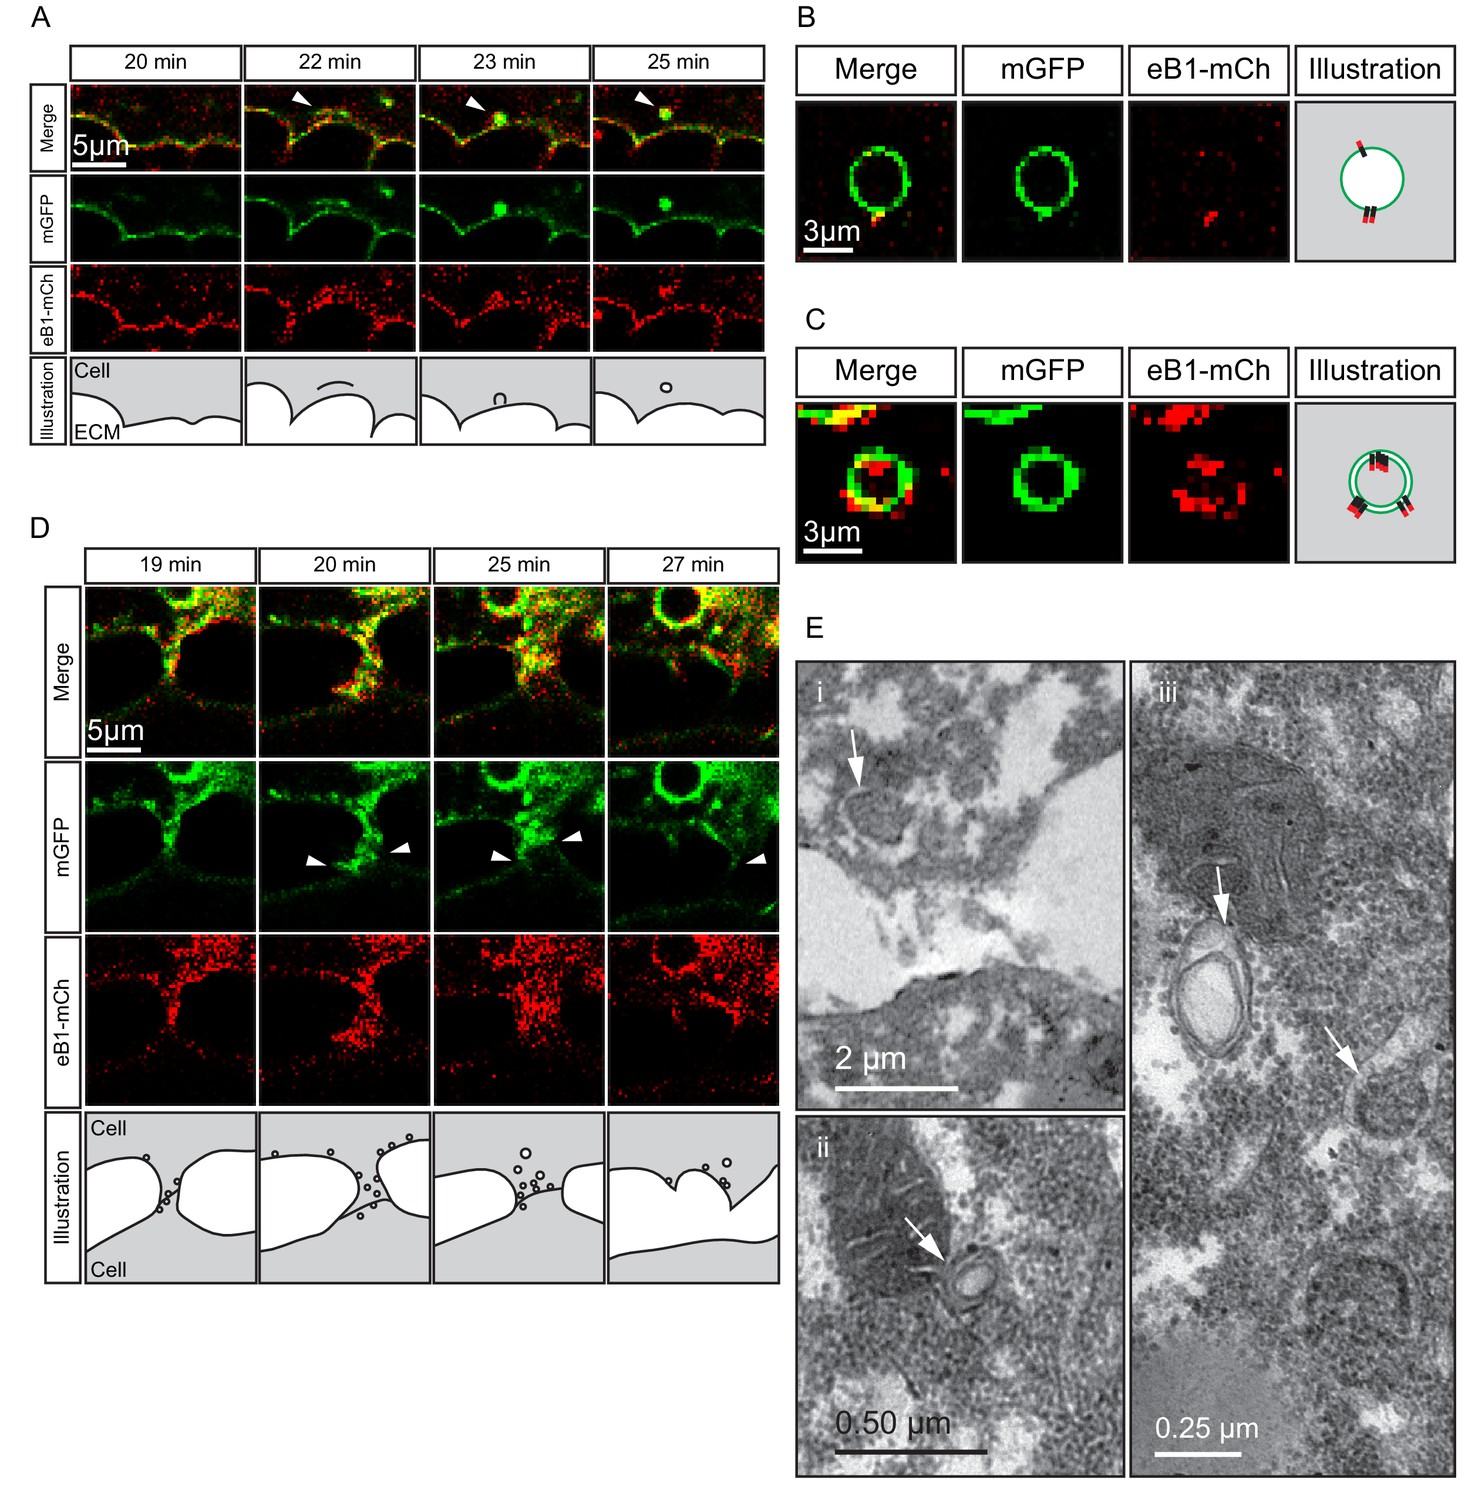
Macropinocytosis, trans-endocytosis and cell detachment.
(A) Macropinosome formation. Sequence shows membrane undulations of an eB1-mCh and mGFP co-expressing cell at the trailing edge. A membrane indentation is pinched off to form an endosome (arrows). Separate panels are shown for mGFP and eB1-mCh, an interpretation of the process at the bottom. (B) Single membrane vesicle. A vesicle in the trailing edge cytoplasm of an eB1-mCh and mGFP co-expressing cell shows eB1-mCh at the outside. An interpretative illustration is shown (right). (C) Double membrane vesicle. A vesicle located in the trailing edge cytoplasm of an eB1-mCh and mGFP co-expressing cell shows label on both sides of the vesicle membrane. An interpretation is shown (right). (D,E) Membrane endocytosis during cell-cell contact resolution. (D) Sequence shows cell detachment of mGFP and ephrinB1-mCh co-expressing cells. A leader cell (upper) resolves its contact (arrows) with a follower (lower) cell. Composite and individual channels are shown. Numerous vesicles are seen at the site of contact during detachment in the leading cell. An interpretation of the process is shown (bottom). (E) TEM of putative trans-endocytotic vesicles. (i) A leading cell presumably undergoing membrane trans-endocytosis as it detaches from a follower cell. A double layered vesicle containing cytoplasmic cargo is indicated (arrow). (ii) Another example of a cytoplasm-filled vesicle within a vesicle (arrow) in the trailing edge cytoplasm. (iii) Various vesicles (arrows) within the trailing edge cytoplasm.
Figure 11
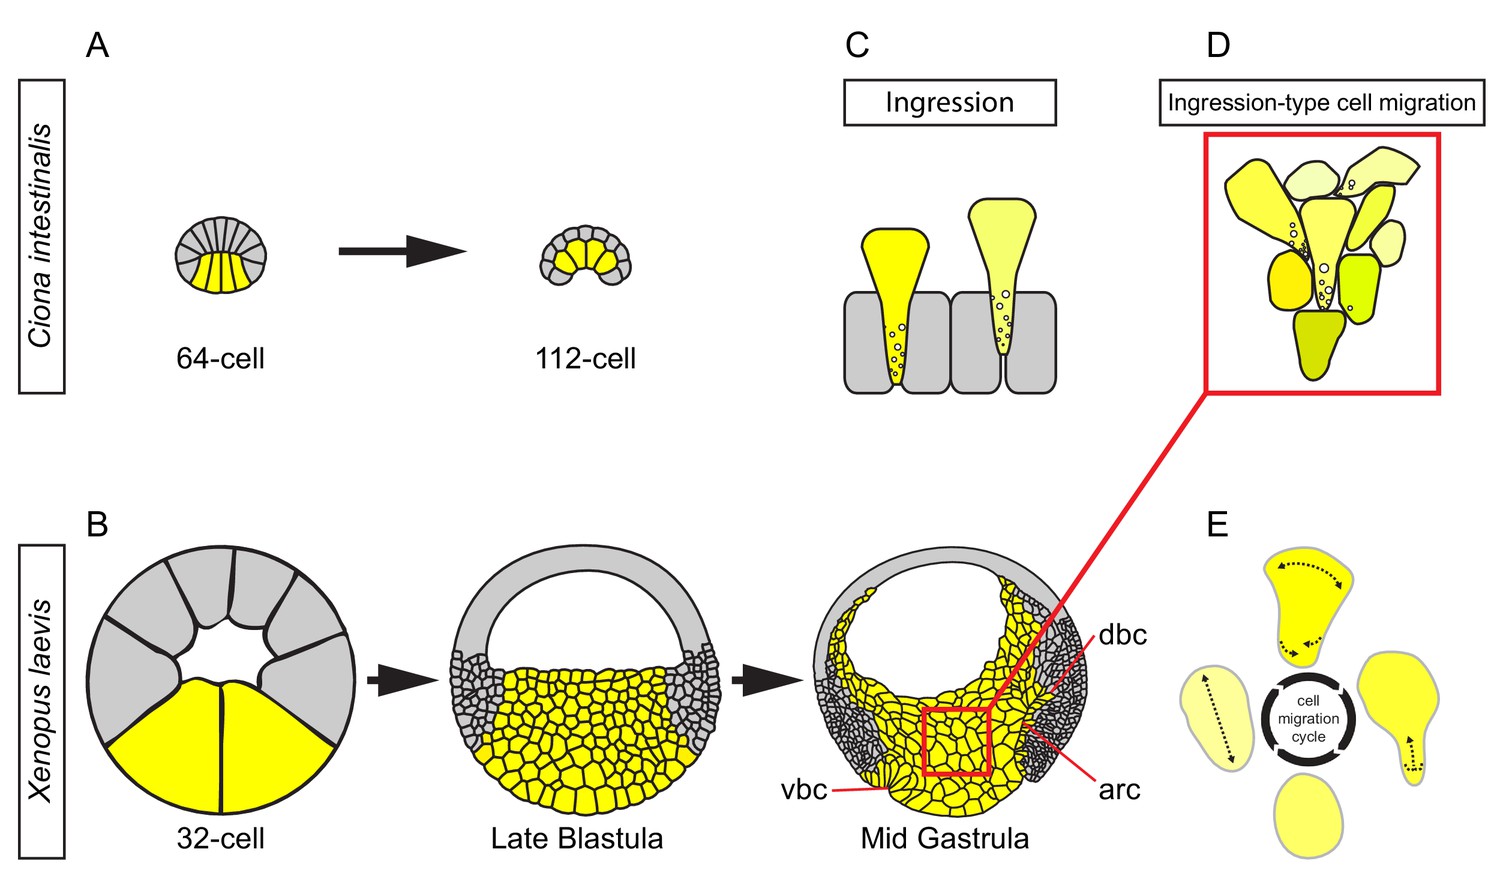
Ingression-type cell migration during X.
laevis vegetal rotation. (A) Endodermal cells (yellow) invaginate in ascidians. Schematic of Ciona intestinalis embryos at 64 and 112 cell stages. (B) Vegetal rotation in amphibians. Schematic of Xenopus laevis embryos at 32 cell, late blastula, and mid-gastrula stages. Endoderm cells of the vegetal endoderm, the suprablastoporal endoderm, and bottle cells are shown in yellow. Inset indicates cells shown in (D). Archenteron (arc), dorsal bottle cells (dbc), and ventral bottle cells (vbc) are indicated. (C) Generalized schematic of epithelial cell ingression shows ingressing cells (yellow) next to non-ingressing cells (grey). Internalized membrane vesicles are shown at the trailing edges. (D) Ingression-type cell migration. Schematic shows endoderm cells undergoing differential amoeboid migration in the vegetal cell mass. (E) Endoderm cells rearrange by cycling through a series of amoeboid migration behaviours (indicated by dashed lines) which include cell body elongation, cell front expansion in tandem with cell rear narrowing which is required for trailing edge retraction.
Videos
Video 1
Vegetal ‘slice’ explant.
Explant was excised from a stage 10 gastrula. Movie shows tissue autonomous vegetal rotation movement over the course of 60 min. Cells are labelled with membrane-GFP. Animal is to the top, vegetal to the bottom.
Video 2
Endoderm cell rearrangement.
Neighbour exchange of central endoderm cells during differential migration viewed from a magnification of Video 1. Cells are labelled with membrane-GFP. Animal is to the top, vegetal to the bottom.
Video 3
Cell rearrangement at the BCF.
Movement of cells near the BCF in explants viewed from a magnification of Video 1. Cells are labelled with membrane-GFP. Animal is to the top, vegetal to the bottom.
Video 4
Endoderm cell migration in vitro.
Cell behaviours on FN-adsorbed tissue culture plastic (left), and FN-adsorbed gelatin coated dish (right). Movie shows autonomous cell behaviours over the course of 10 min.
Video 5
Cell rear retraction during translocation is associated with trailing edge membrane undulation.
Time-lapse video shows a membrane-labelled endoderm cell moving animally between unlabelled endoderm cells within a mosaic-labelled vegetal explant.
Video 6
Trailing edge undulation is associated with membrane protrusion formation and resolution.
High-resolution time-lapse video shows numerous lamelliform projections extending outward from the cell body and then retracting. Membrane-bound vesicles could be observed at sites of membrane fluctuation which are taken up into the cytoplasm.
Video 7
Cells co-expressing Rab5c-CFP and membrane-RFP in explant.
An animally-located endoderm cell is seen detaching from a vegetally-located cell. Rab5 enrichment could be observed at the trailing edge of the retracting cell.
Video 8
EphrinB1 is enriched at the trailing edge membrane and is present within the membrane of internalized vesicles at the cell rear.
For clarity, panels show ephrinB1-mCherry alone (left), membrane-GFP alone (center), and the corresponding merged composite (right).
Additional files
-
Transparent reporting form
- https://doi.org/10.7554/eLife.27190.038
Download links
A two-part list of links to download the article, or parts of the article, in various formats.
Downloads (link to download the article as PDF)
Open citations (links to open the citations from this article in various online reference manager services)
Cite this article (links to download the citations from this article in formats compatible with various reference manager tools)
Ingression-type cell migration drives vegetal endoderm internalisation in the Xenopus gastrula
eLife 6:e27190.
https://doi.org/10.7554/eLife.27190


