Extensive alternative splicing transitions during postnatal skeletal muscle development are required for calcium handling functions
- Baylor College of Medicine, United States
Figures
Figure 1 with 1 supplement

RNA-seq data is high quality and reproducible.
(A and B) Biological replicates for PN14 were compared to analyze variation in gene expression (A) and alternative splicing (B) using Cufflinks and MISO, respectively. (C) RT-PCR to quantitate splicing use primers that anneal to the constitutive exons flanking an alternative exon, displayed on the UCSC Genome Browser (above) to determine the percent spliced in (PSI). (D) RT-PCR splice products for alternative splicing events comparing PN2 to PN28. (E) Plot comparing PN2 to PN28 RNA-seq ΔPSI values and ΔPSI values obtained by RT-PCR.
Figure 1—figure supplement 1
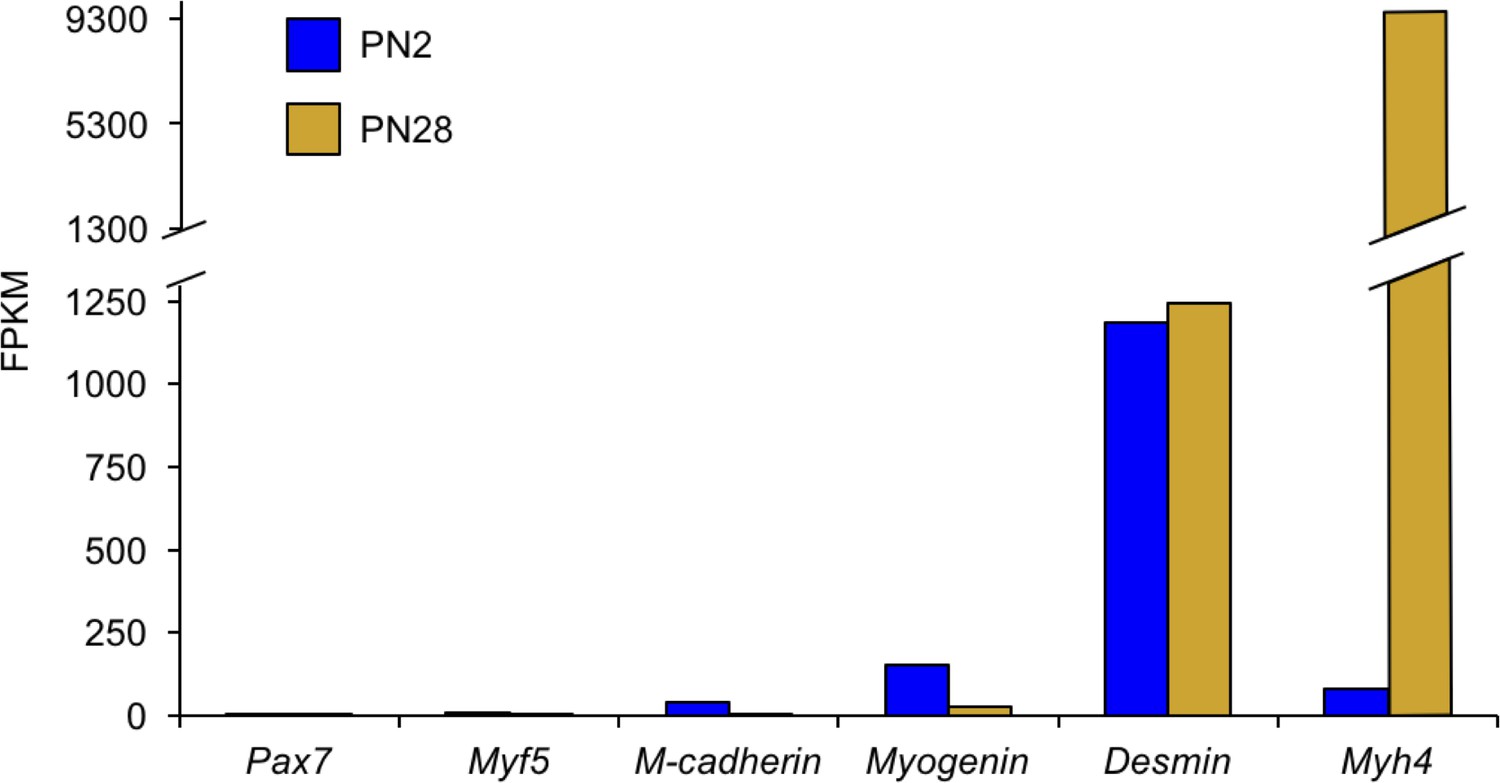
The vast majority of transcriptome changes observed in the RNA-seq data are from myofibers with a minimal contribution from satellite cells.
Genes for activated satellite cells (Pax7, Myf5, Cdg15) had little or undetectable expression. In contrast, genes expressed in myofibers (Myog, Des, Myh4) are readily detected.
Figure 2 with 1 supplement
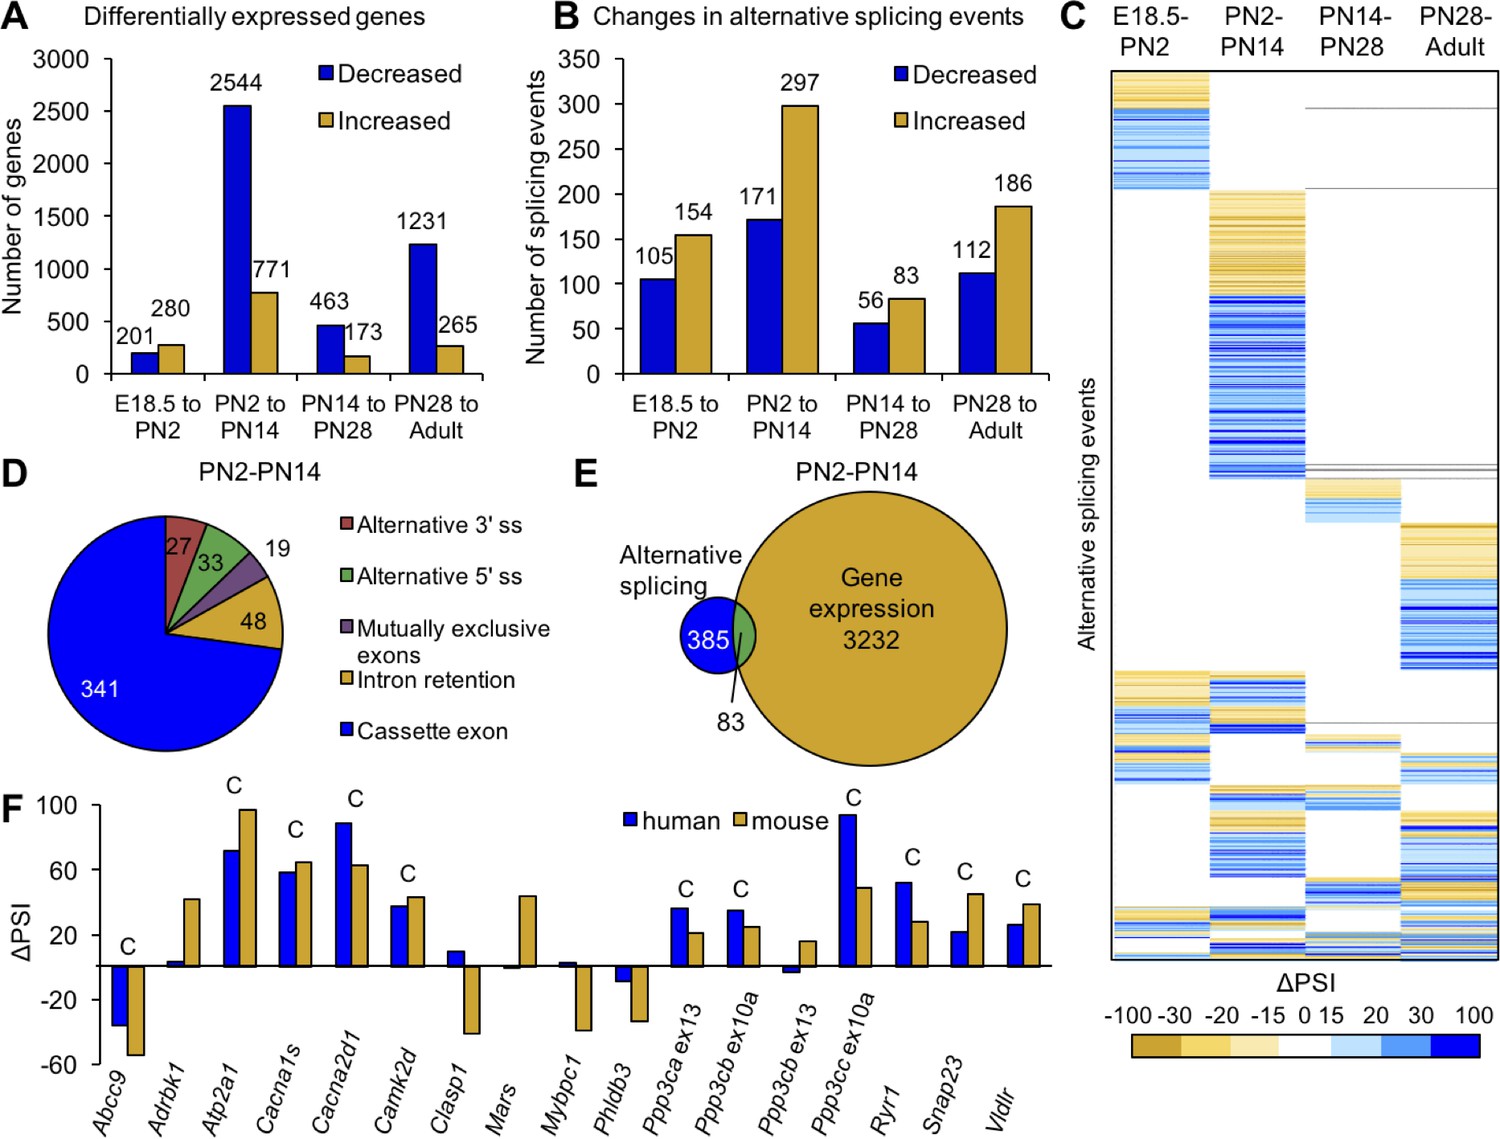
Postnatal gene expression and alternative splicing transitions in mouse skeletal muscle are largely independent, temporally restricted and conserved.
(A) Genes with ≥2.0 fold increase or decrease in expression between E18.5-PN2, PN2-PN14, PN14-PN28 and PN28-Adult (Table 1). (B) Alternative splicing events with ΔPSI ≥± 15% between E18.5-PN2, PN2-PN14, PN14-PN28 and PN28-Adult. Decreased indicates more skipping of a splicing event during development, and increased indicates more inclusion of an alternative splicing event during development. (C) Heat map of alternative splicing transitions between four time intervals. Most gene expression and splicing transitions occur between PN2 and PN14. (D) Splicing patterns of events with 15% ΔPSI or greater between PN2 and PN14. (E) Venn diagram of genes with gene expression changes (2.0-fold or greater) compared to alternative splicing transitions (15% ΔPSI or greater) between PN2 and PN14. (F) Conservation of splicing transitions during mouse and human skeletal muscle development. The ∆PSI between PN2 to PN28 mouse gastrocnemius samples were compared to the ∆PSI between gestation week 22 to adult human skeletal muscle by RT-PCR. Events showing a 15% ΔPSI or greater in the same direction in mouse and human samples were scored as conserved (indicated by C).
Figure 2—figure supplement 1
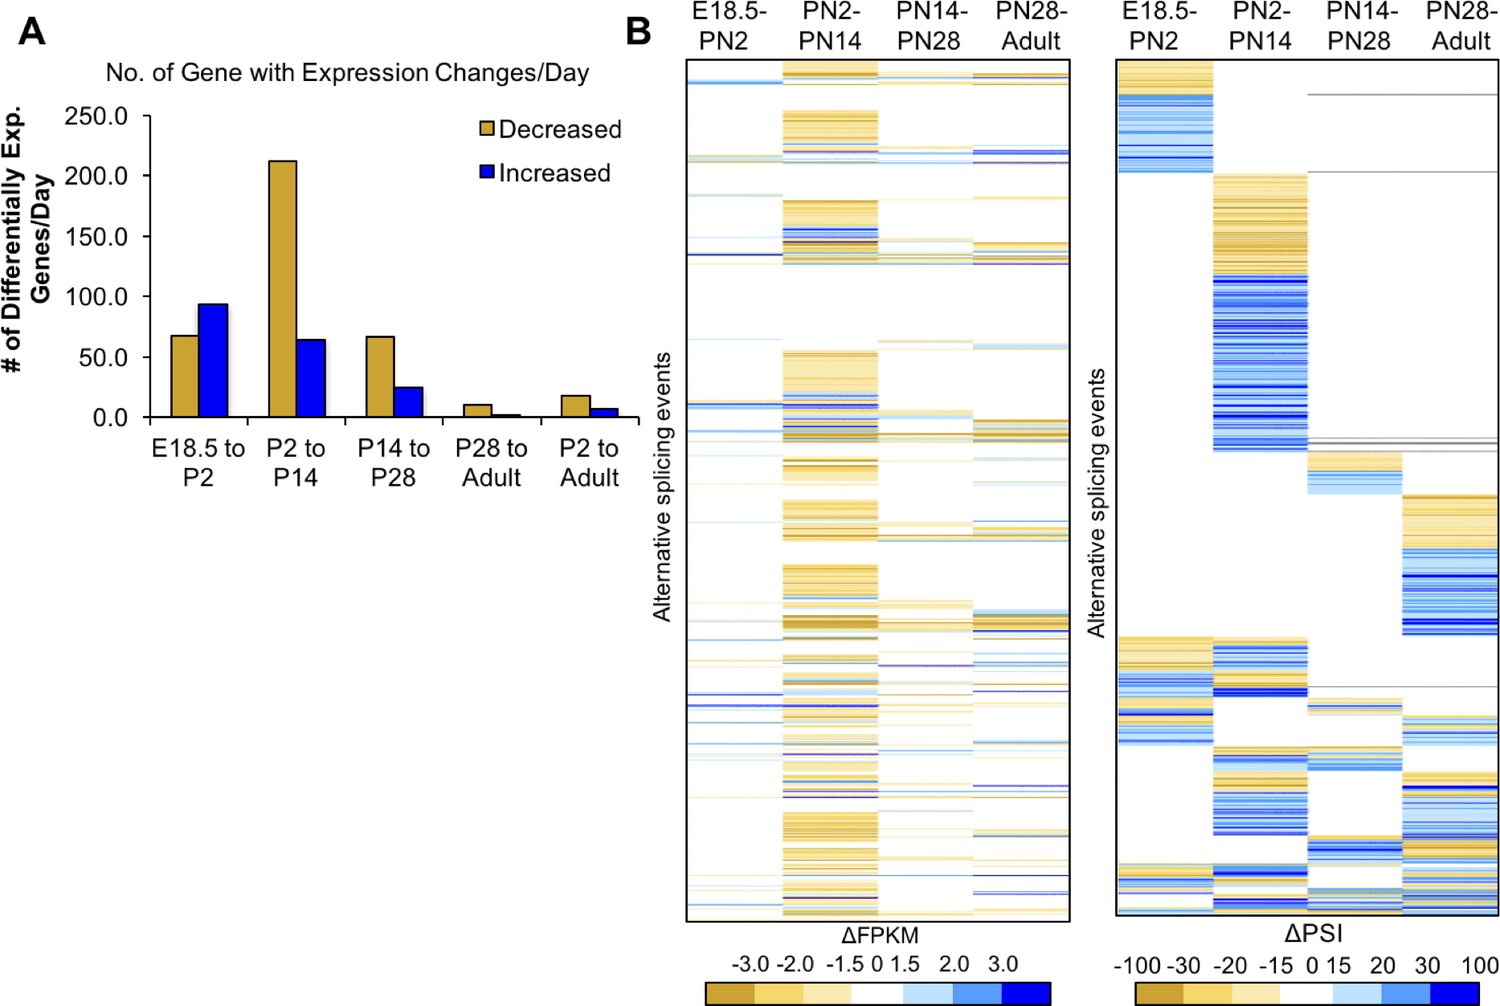
Most changes in gene expression occur before PN14.
(A) Differential gene expression changes standardized to the number of days in the time interval. (B) Heat map of differential gene expression of genes (left) with alternative splicing (right) between four intervals. The gene list is aligned in the heat maps for differential expression and alternative splicing, the latter is reproduced from Figure 2C. Largest changes are denoted by the darkest colors of yellow (decreased) or blue (increased). White indicates unchanged.
Figure 3

Distribution of cassette alternative exons within mRNAs.
The graphs display the number of genes and the relative position of the alternative cassette exon from the 5’ end of the spliced mRNA. The relative exon position is expressed as the percent of the total number of exons. The alternative exons analyzed (223 exons) have a ΔPSI of 15% or greater from PN2 to PN28 and contain at least three constitutive exons. (A) In-frame alternative exons that maintain the reading frame. Colors indicate whether the alternative exon contains a translational stop codon (red), start codon (green), only 3’ UTR sequence (yellow), only 5’ UTR sequence (blue), or if the exon is within the open reading frame (gray). (B) Representation of potential protein-coding consequences of in-frame alternative exons. (C) Out of frame alternative exons that shift the reading frame. (D) Representation of potential protein-coding consequences of alternative exons that are a non-multiple of three.
Figure 4

Gene ontology analysis for differential gene expression and alternative splicing.
Ingenuity analysis was performed for both gene expression and alternative splicing, with a significance cut-off of –log(1.3). (A) Ingenuity analysis for gene expression differences between PN2 and PN28 (2-fold cut-off). The top 30 GO terms are displayed. For significant GO terms not shown, none of the highlighted, colored terms were present. (B) Ingenuity analysis for alternative splicing for genes with a 15% ΔPSI or greater between PN2 and PN28. All significant GO terms are shown.
Figure 5
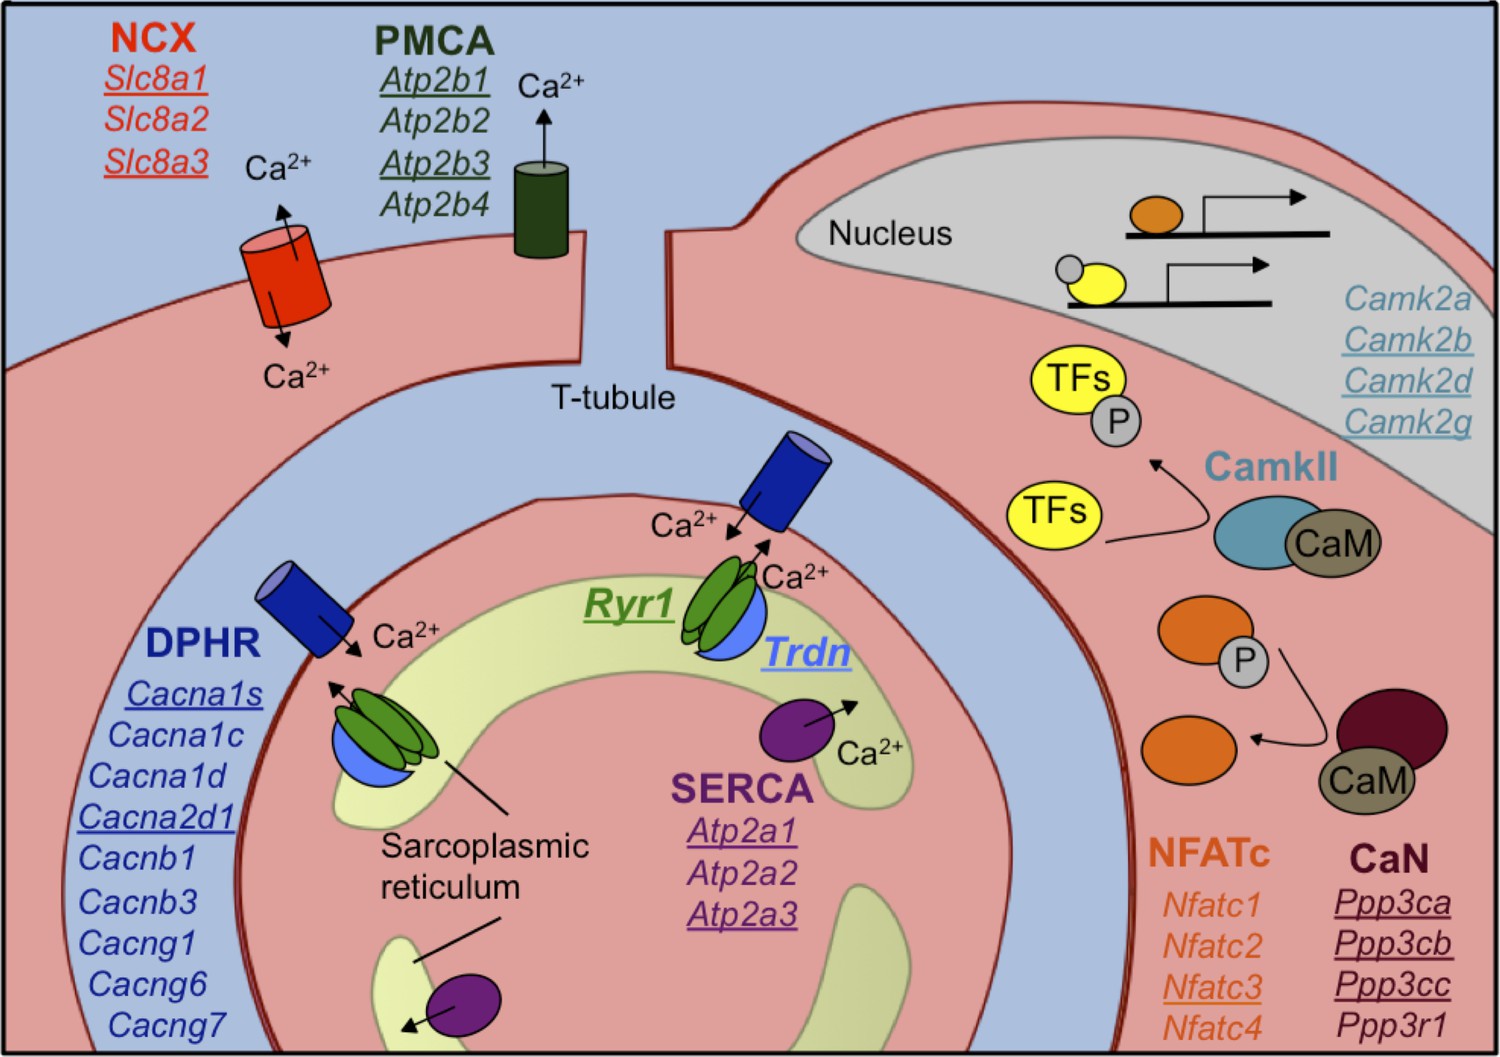
Calcium handling genes that undergo alternative splicing transitions in postnatal skeletal muscle development.
Diagram of calcium handling genes that are expressed in skeletal muscle. Genes with 15% or greater ΔPSI from PN2 to PN28 are underlined and include members of several calcium channels: NCX (sodium calcium exchanger), PMCA (plasma membrane Ca2+-ATPase), SERCA (sarco/endoplasmic reticulum Ca2+-ATPase), and RYR (ryanodine receptor); triadin (Trdn) which associates with Ryr1, junctin (Asph) and FKBP12 (Fkbp1a). Signaling cascades that are affected by alternative splicing include Ca2+/camodulin (CaM)-dependent calcineurin (CaN) and calmodulin-dependent protein kinase II (CamkII) along with the downstream transcription factor NFATC. NFATC and transcription factors (TFs) regulated by CamkII activate genes for hypertrophy and fiber type specification.
Figure 6 with 1 supplement
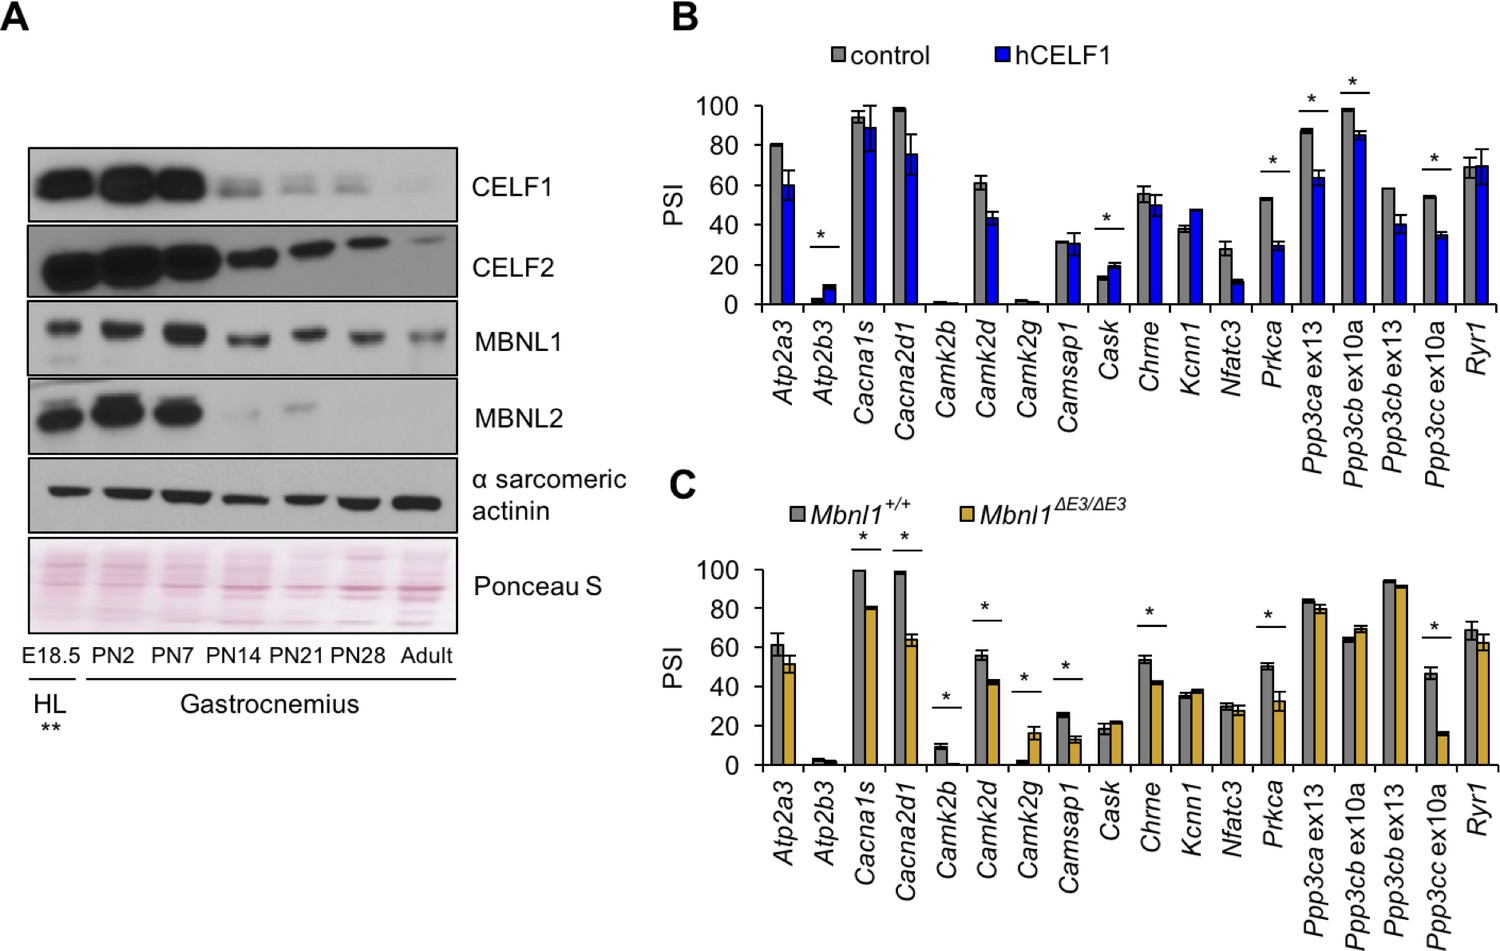
Postnatal down-regulation of CELF and MBNL alternative splicing regulators promote splicing transitions of calcium handling genes.
(A) Western blot of Celf1, Celf2, Mbnl1, and Mbnl2 during gastrocnemius postnatal development. **All E18.5 samples are from hindlimb (HL) except Celf1 blot which is E18.5 gastrocnemius. Ponceau S and α sarcomeric actinin serve as loading markers. (B) Comparing PSI of control mice (MDAFrtTA + dox) and human CELF1 overexpressing mice (MDAFrtTA/TRECUGBP1 + dox) (C57BL6/DBA;FVB). (C) Comparing PSI of wild type and Mbnl1 KO mice, Mbnl1ΔE3/ΔE3 (FVB). Single asterisk (*) denotes p<0.05 using student T-test, n = 3 mice per group. Displayed are mean with SD bars.
Figure 6—figure supplement 1
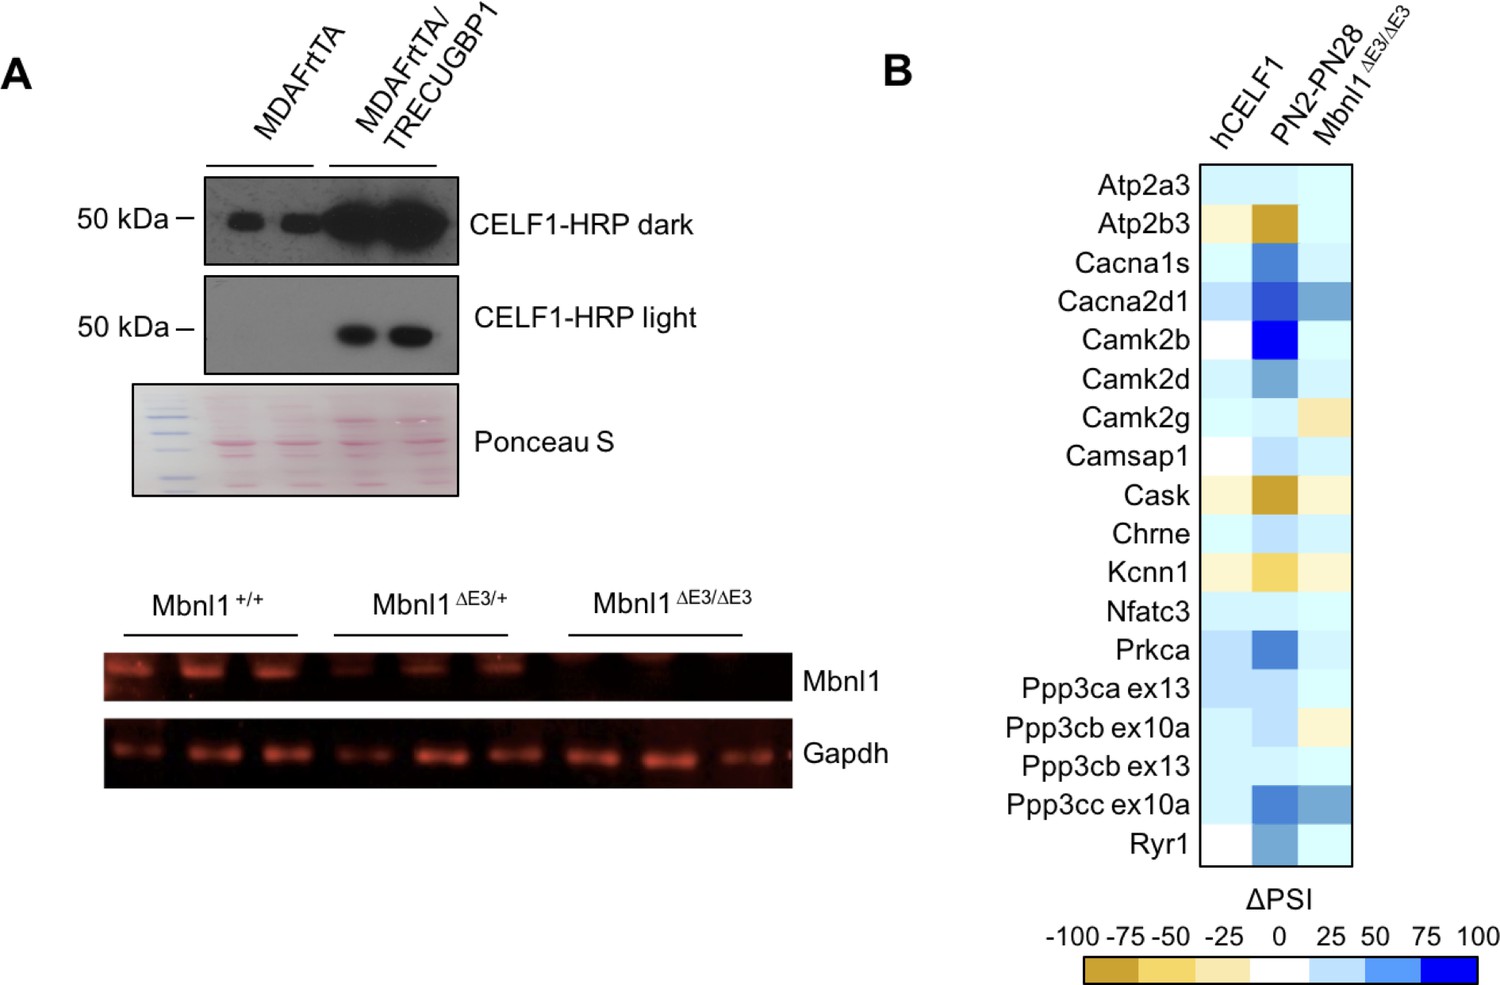
CELF1 overexpression and Mbnl1 KO effect on calcium-handling splicing.
(A) Western blots of hCELF1 overexpressing mice compared to controls (MDAFrtTA/TRECUGBP1 + dox and MDAFrtTA +dox) and Mbnl1 KO mice (Mbnl1+/+, Mbnl1ΔE3/+, and Mbnl1ΔE3/ΔE3) validating protein level changes. (B) Heat map of ΔPSI between PN2 and PN28 in wild type FVB gastrocnemius; between control mice (MDAFrtTA +dox) and hCELF1 overexpressing adult mice (MDAFrtTA/TRECUGBP1 + dox) (C57BL6/DBA;FVB) quadriceps; and between adult Mbnl1+/+ and Mbnl1ΔE3/ΔE3 (FVB) quadriceps.
Figure 7 with 1 supplement
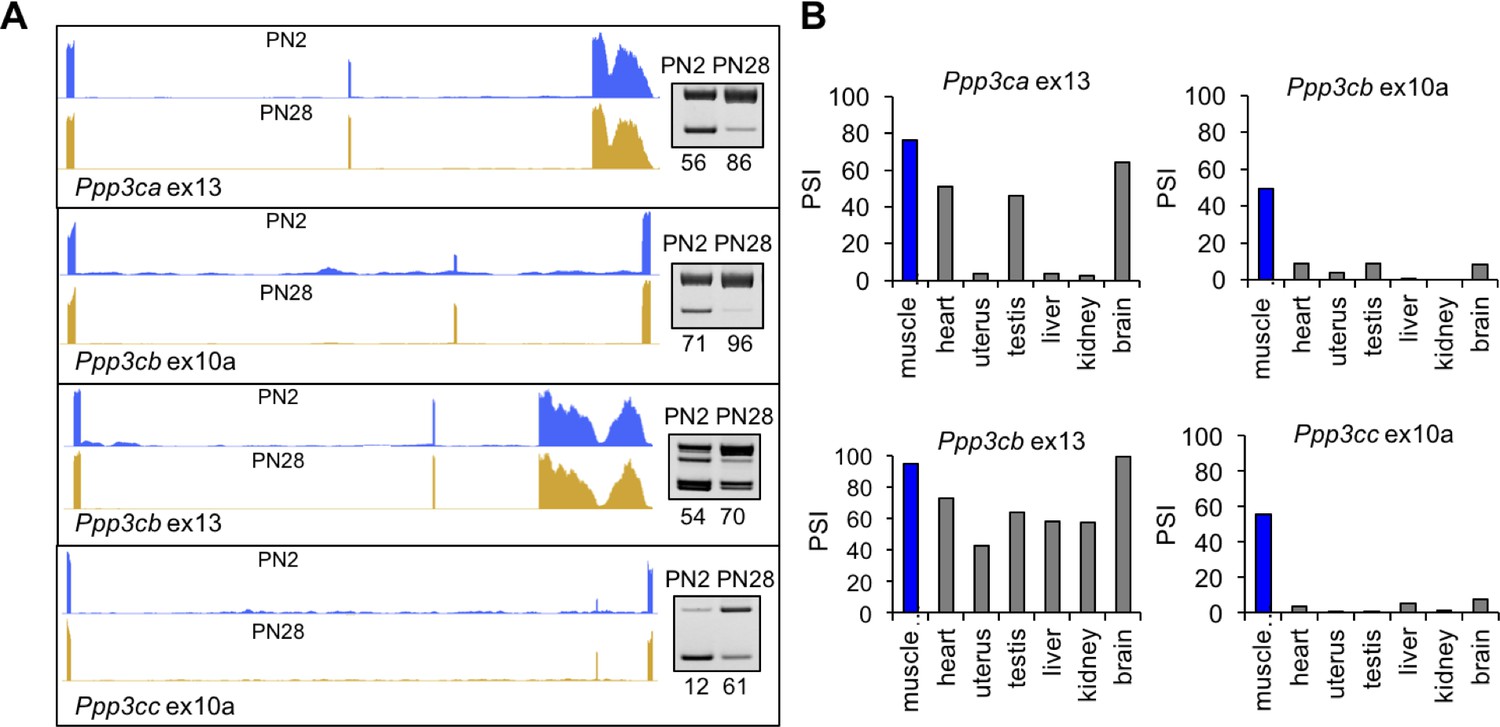
Calcineurin A splicing during PN development in different tissues.
(A) UCSC Genome Browser displays of calcineurin A alternative exons (Ppp3ca ex13, Ppp3cb ex10a, Ppp3cb ex13, and Ppp3cc ex10a) side-by-side with RT-PCR of RNA from PN2 and PN28. (B) RT-PCR comparing inclusion of calcineurin A alternative exons in diverse adult tissues (BioChain tissue array mRNA).
Figure 7—figure supplement 1
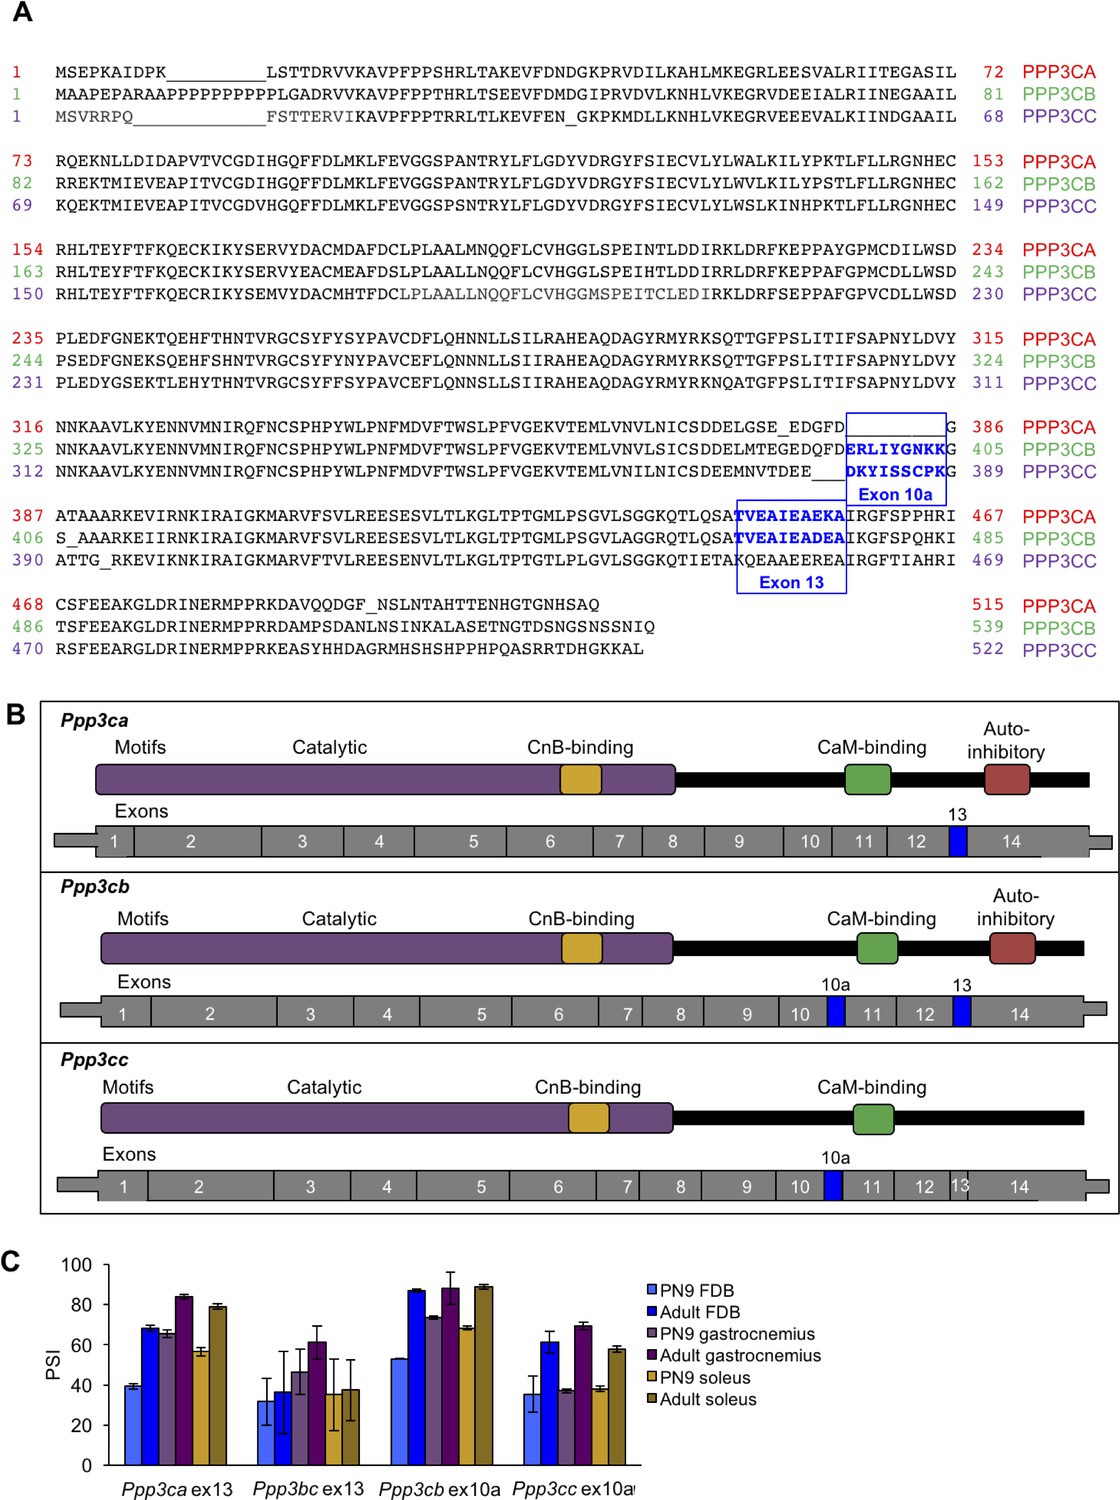
Alignment of calcineurin A alternative exons.
(A) The protein sequences of the three mouse calcineurin A paralogs are aligned. (B) Diagrams aligning calcineurin A mRNAs and proteins showing relative positions of known protein domains and alternatively spliced regions. (C) RT-PCR of calcineurin A exons during postnatal development of muscle groups with differing fiber type contributions: gastrocnemius (blue), soleus (purple), and flexor digitorum brevis (yellow). Gastrocnemius contains 6%, soleus contains 37%, and FDB contains 13% slow fiber type (type I)(Katz et al., 2010; Close, 1972). N = 3 adult mice or three pooled litters for PN9. Displayed are mean with SD bars.
Figure 8 with 2 supplements
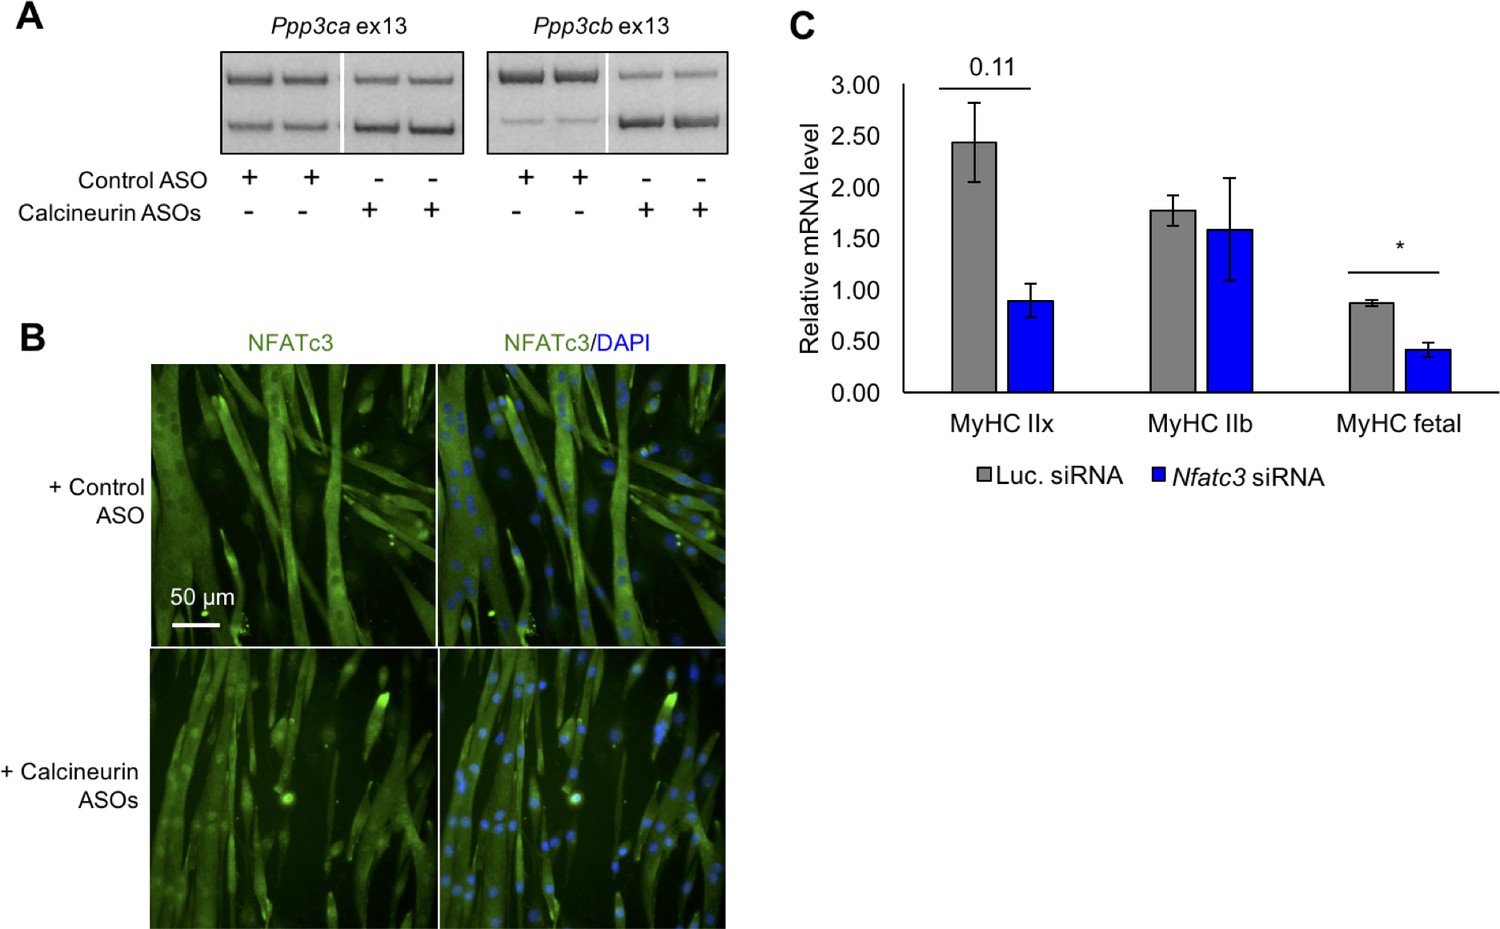
Redirected calcineurin A splicing in differentiated C2C12 myotubes.
(A) RT-PCR of redirected splicing of calcineurin A events in differentiated C2C12 cells. Two of the four calcineurin A splicing events are present in C2C12. For calcineurin A ASO, 9 μM Ppp3ca ex13 3’ss and 15 μM Ppp3cb ex13 5’ss morphlinos were delivered, and for control ASO, 24 μM standard control morpholino were delivered. (B) Immunofluorescence of Nfatc3 in differentiated C2C12 after morpholino delivery. (C) mRNA levels of Nfatc targets after knockdown of Nfatc3 in differentiated C2C12 cells. Relative mRNA levels are standardized to Mrps7 mRNA levels; single asterisk (*) denotes p<0.05 significance by student T-test, n = 3 biological replicates. Displayed are mean with SD bars.
Figure 8—figure supplement 1
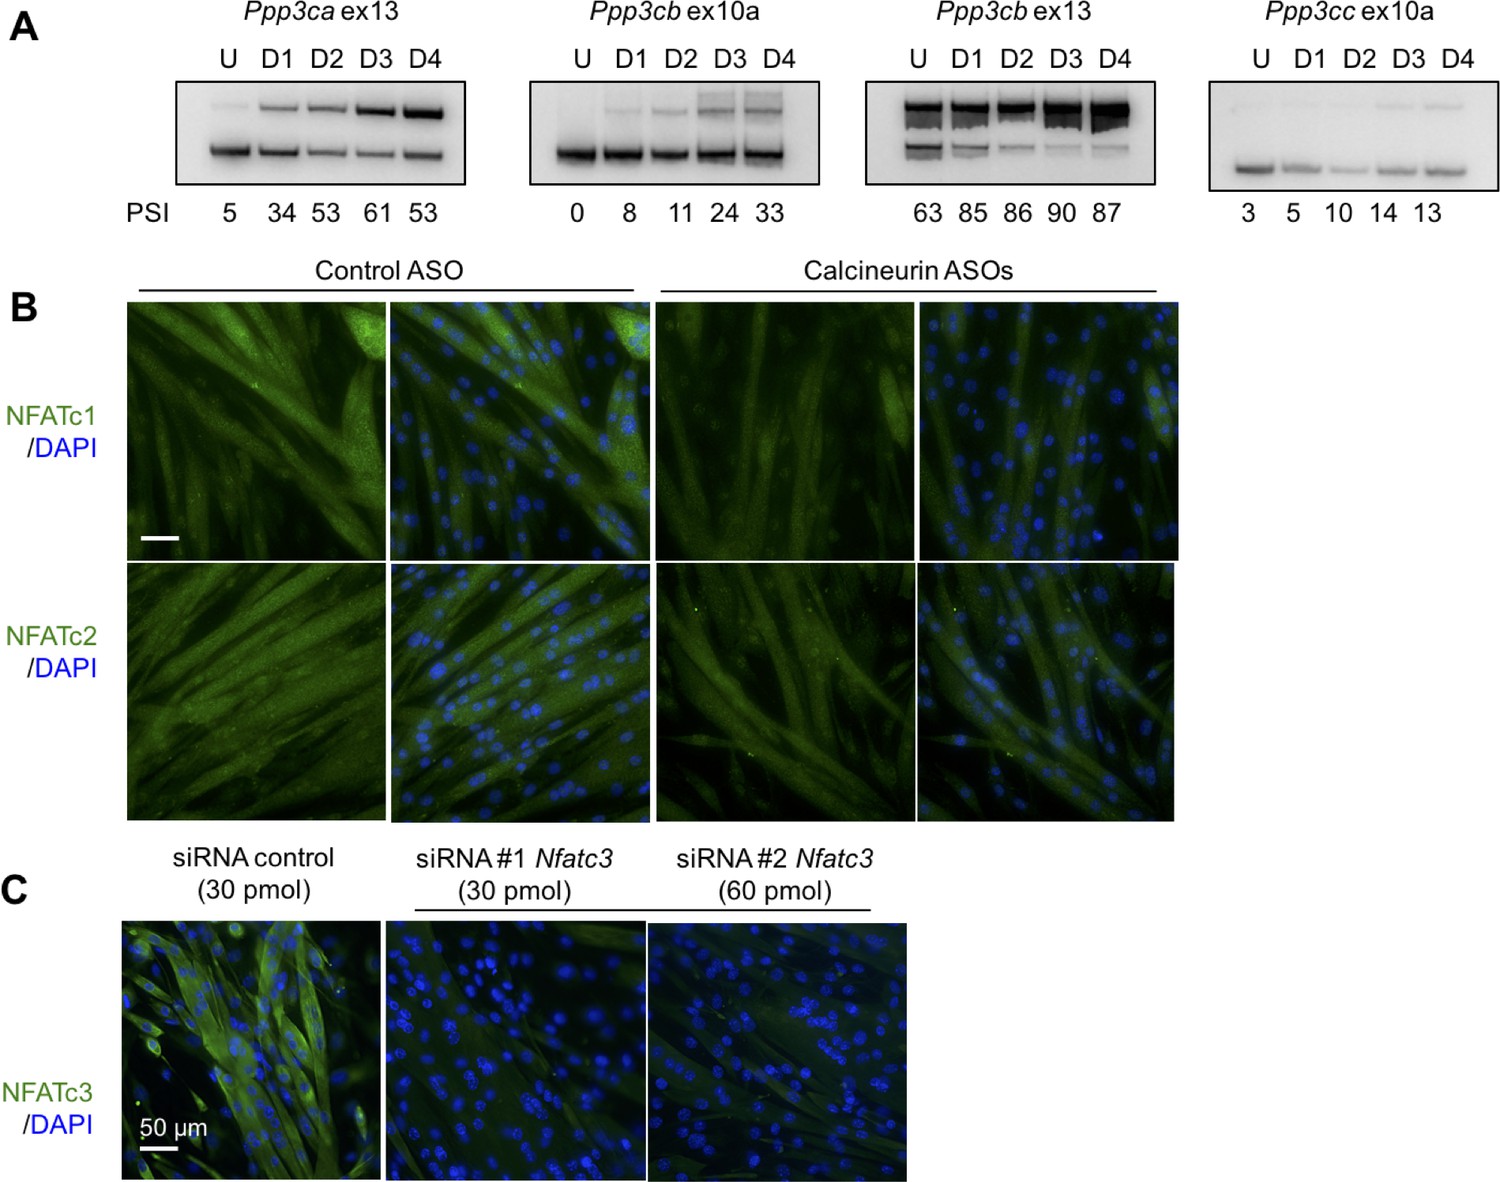
Analysis of calcineurin A splicing during C2C12 differentiaion, Nfatc1 and Nfatc2 protein localization in C2C12, and validation of Nfatc3 antibody.
(A) PSI for calcineurin A splicing events from undifferentiated (U) and days in after differentiation media was added days 1 through 4 (D1, D2, D3, D4). (B) Localization of Nfatc1 and Nfatc2 by immunofluorescence in differentiated C2C12 with ASOs. (C) Knockdown of Nfatc3 using silencer siRNAs to confirm signal of Nfatc3 antibody.
Figure 8—figure supplement 2
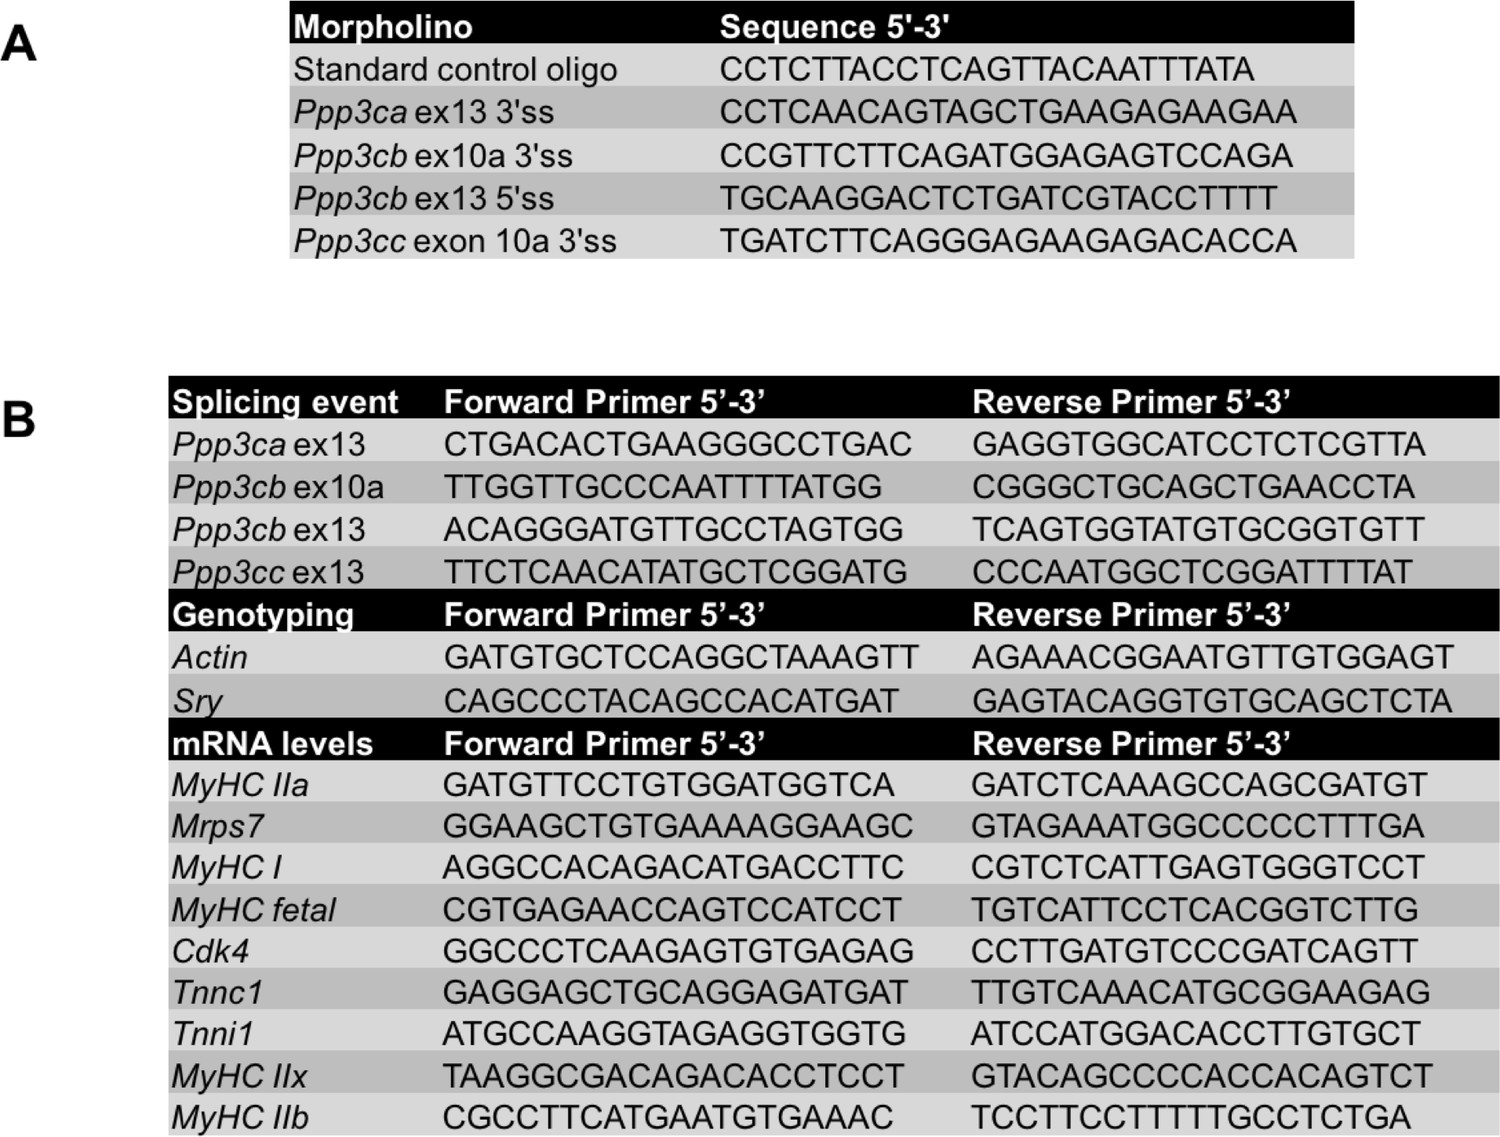
Sequences for antisense morpholinos and primers.
(A) Morpholino sequences used for redirected splicing. (B) Primers used for splicing, genotyping, and mRNA levels.
Figure 9 with 1 supplement
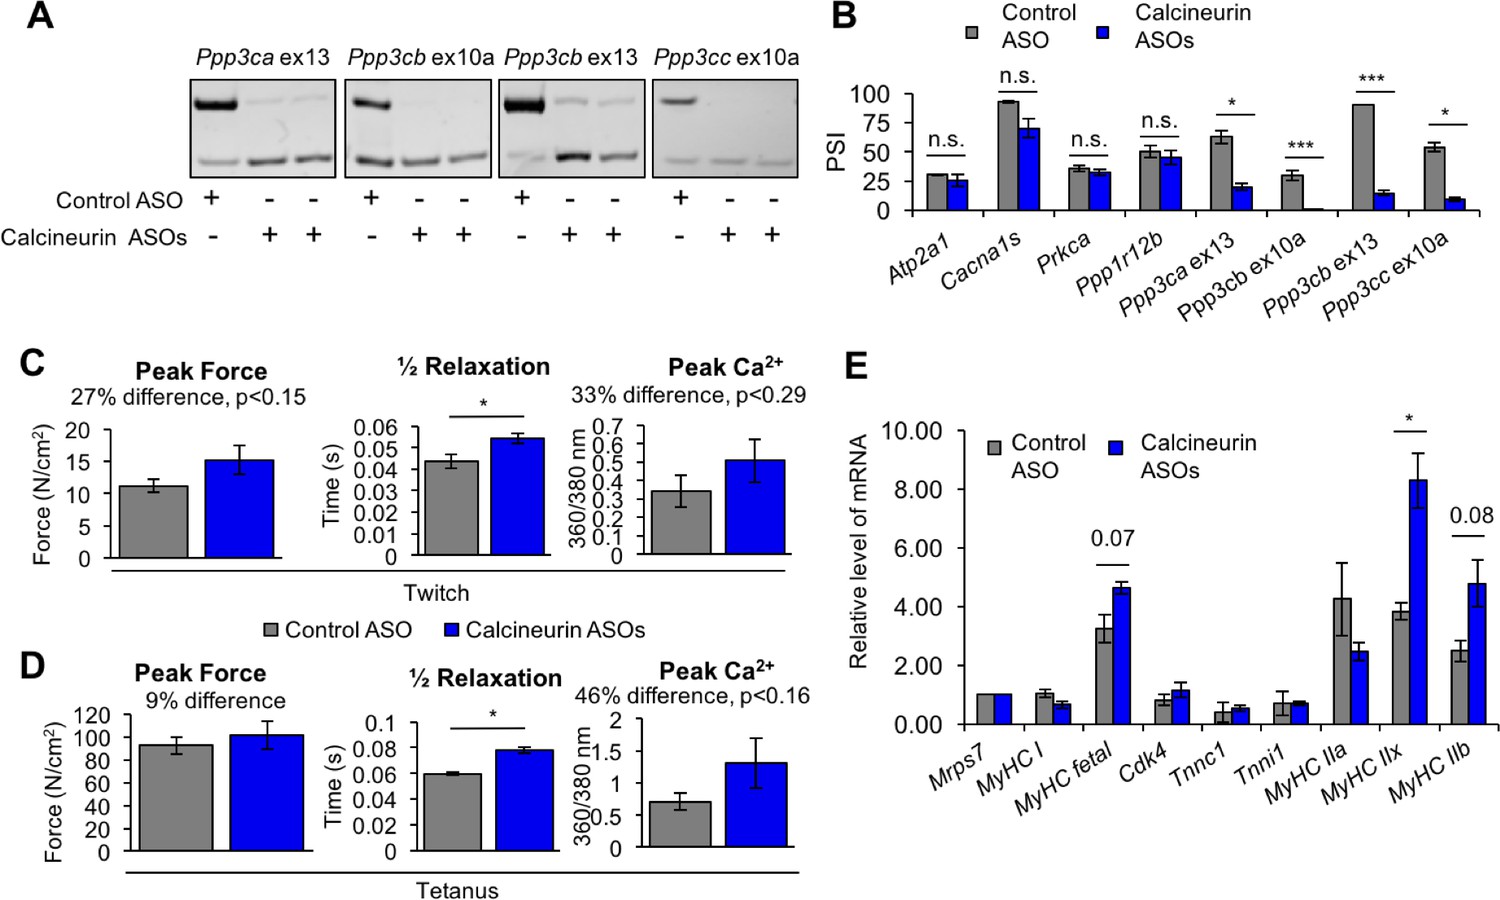
Redirected calcineurin A splicing in adult FDB muscle.
(A) Confirmation of redirected splicing in adult FDB muscle by RT-PCR. ASO morpholinos were administered to the FDB muscle (Figure 8—figure supplement 2). (B) RT-PCR of targeted (calcineurin A) and control (Atp2a1, Cacna1s, Prkca, and Ppp1r12b) splicing events. Single asterisk (*) denotes p<0.05, *** denotes p<0.001, and n.s. denotes no statistical difference by student T-test, n = 4 mice per group. Displayed are mean with SD bars. (C) Force and calcium analysis after twitch stimulus. Peak force and half relaxation time were measured for force and peak calcium for calcium. Single asterisk (*) denotes p<0.05 significance by student T-test, n = 3–4 mice per group. Displayed are mean with SD bars. (D) Force and calcium analysis after tetanus stimuli. Peak force and half relaxation time were measured for force and peak calcium for calcium. Single asterisk (*) denotes p<0.05 significance by student T-test, n = 3–4 mice per group. Displayed are mean with SD bars. (E) Relative mRNA levels of mRNAs from Nfatc target genes in FDB muscle by RT-PCR. Single asterisk (*) denotes p<0.05 and marked are transcriptional targets nearing significance by student T-test, n = 3 mice per group. Displayed are mean with SD bars.
Figure 9—figure supplement 1
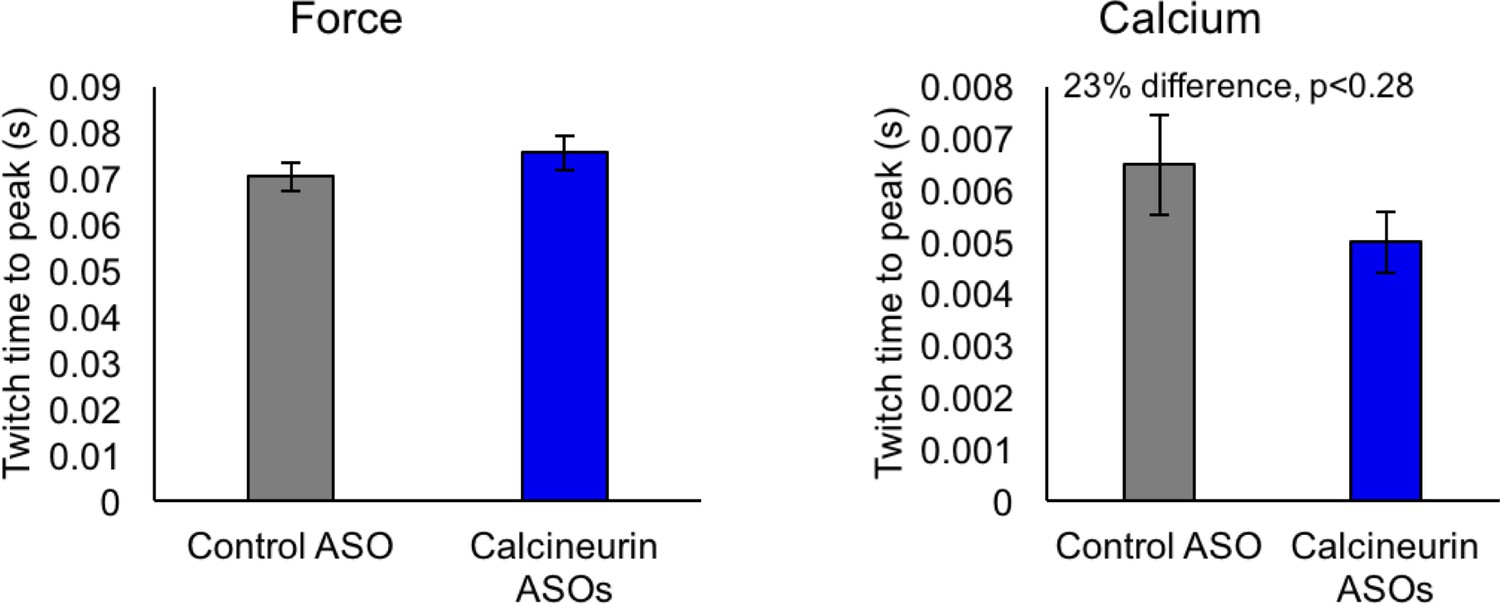
Not significant (by student T-test) time to peak of force and calcium for control ASO and calcineurin A ASOs, n = 3–4 mice per group.
Displayed are mean with SD bars.
Tables
Table 1
Mouse tissue samples used for RNA-seq.
Samples were pooled for E18.5 and PN2 to obtain sufficient quantities of RNA.
| Sample | Tissue | Age | Sex | # of mice | Mapped reads | % mapped |
|---|---|---|---|---|---|---|
| E18.5 | Gastrocnemius | E18.5 | M/F | 21 | 377,538,308 | 93.00% |
| PN2 | Gastrocnemius | PN2 | M | 6 | 381,045,805 | 92.20% |
| PN14 Replicate #1 | Gastrocnemius | PN14 | M | 1 | 321,001,586 | 92.60% |
| PN14 Replicate #2 | Gastrocnemius | PN14 | M | 1 | 379,096,597 | 93.20% |
| PN28 | Gastrocnemius | PN28 | M | 1 | 377,248,209 | 93.30% |
| Adult | Gastrocnemius | 22 weeks | M | 1 | 381,729,569 | 93.50% |
Table 2
Calcium handling genes with alternative splicing transitions during skeletal muscle development.
Listed are calcium-handling genes from the GO analysis (Figure 3). The ΔPSI from PN2 to PN28 are displayed along with the size of alternative exon, effect on the reading frame, the relative location of the exon, and predicted protein-coding consequence.
| Gene symbol | Gene | ΔPSI | Size of exon (bp) | In frame? | Alt. exon position | Effect on coding |
|---|---|---|---|---|---|---|
| Atp2a1 | ATPase, Ca ++ transporting, cardiac muscle, fast twitch | 97 | 42 | Y | 22 of 23 | C-term. |
| Atp2a3 | ATPase, Ca ++ transporting, ubiquitous | 20 | 73 | N | 21 of 22 | C-term. |
| Atp2b3 | ATPase, Ca ++ transporting, plasma membrane | −42 | 154 | N | 21 of 22 | C-term. |
| Cacna1s | Calcium channel, voltage-dependent, L type, alpha 1S subunit | 50 | 57 | Y | 29 of 44 | Insertion |
| Cacna2d1 | Calcium channel, voltage-dependent, alpha 2/delta subunit 1 | 53 | 57 | Y | 19 of 39 | Insertion |
| Calu | Calumenin | −27 | 194 | Y | three of 7 | Mutually exclusive |
| Camk2b | Calcium/calmodulin-dependent protein kinase II beta | 62 | 129 | Y | 13 of 17 | Insertion |
| Camk2d | Calcium/calmodulin-dependent protein kinase II delta | 34 | 89 | N | 19 of 20 | C-term. |
| Camsap1 | Calmodulin regulated spectrin-associated protein 1 | 25 | 33 | Y | five of 18 | Insertion |
| Cask | Calcium/calmodulin-dependent serine protein kinase | −44 | 69 | Y | 14 of 21 | Deletion |
| Chrne | Cholinergic receptor, nicotinic, epsilon (muscle) | −18 | 107 | N | 5 of 12 | Change of a.a. |
| Kcnn1 | Potassium intermediate/small conductance calcium-activated channel, subfamily N, member 1 | −35 | 111 | Y | 6 of 10 | Deletion |
| Mef2d | Myocyte enhancer factor 2D | −31 | 138 | Y | 4 of 12 | Mutually exclusive |
| Nfatc3 | Nuclear factor of activated T-cells, cytoplasmic, calcineruin-dependent 3 | 20 | 104 | N | 10 of 11 | C-term. |
| Ppp3ca | Protein phosphatase 3, catalytic subunit, alpha isozyme (calcineurin Aα) | 30 | 30 | Y | 13 of 14 | Insertion |
| Ppp3cb | Protein phosphatase 3, catalytic subunit, beta isozyme (calcineurin Aβ) | 25 | 27 | Y | 11 of 15 | Insertion |
| Ppp3cb | Protein phosphatase 3, catalytic subunit, beta isozyme (calcineurin Aβ) | 16 | 30 | Y | 14 of 15 | Insertion |
| Ppp3cc | Protein phosphatase 3, catalytic subunit, gamma isozyme (calcineurin Aγ) | 49 | 27 | Y | 11 of 15 | Insertion |
| Ryr1 | Ryanodine receptor 1 (skeletal) | 39 | 18 | Y | 83 of 106 | Insertion |
| Tnnt3 | Troponin T type 3 (skeletal, fast) | 22 | 41 | Y | 16 of 17 | Mutually exclusive |
| Trdn | Triadin | 18 | 60 | Y | 9 of 36 | Insertion |
Additional files
-
Transparent reporting form
- https://doi.org/10.7554/eLife.27192.020
Download links
A two-part list of links to download the article, or parts of the article, in various formats.
Downloads (link to download the article as PDF)
Open citations (links to open the citations from this article in various online reference manager services)
Cite this article (links to download the citations from this article in formats compatible with various reference manager tools)
Extensive alternative splicing transitions during postnatal skeletal muscle development are required for calcium handling functions
eLife 6:e27192.
https://doi.org/10.7554/eLife.27192


