Kinetochore inactivation by expression of a repressive mRNA
- University of California, Berkeley, United States
- The Francis Crick Institute, United Kingdom
Figures
Figure 1 with 2 supplements
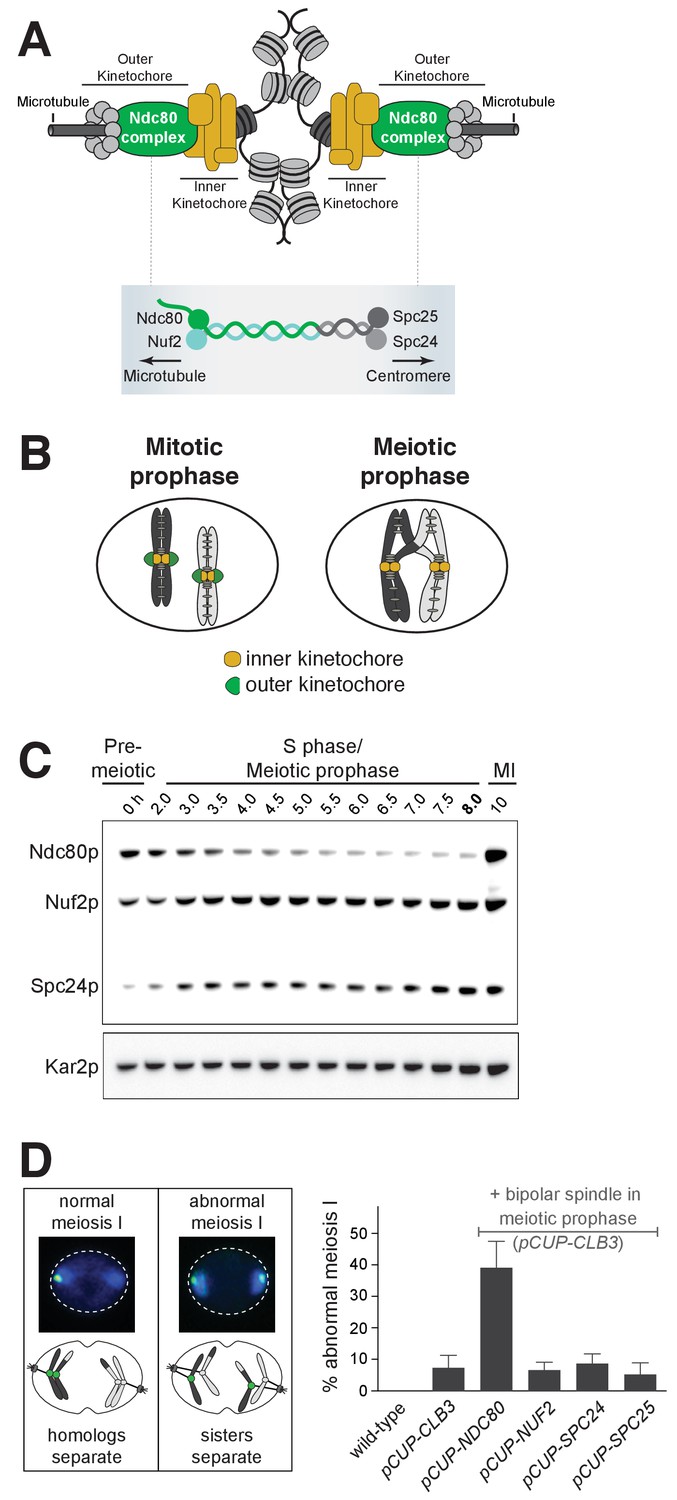
Kinetochore function is repressed during meiotic prophase due to limiting levels of Ndc80.
(A–B) Schematics of kinetochore structure and dynamic behavior. (A) Top: kinetochores assembled on the centromere and attached to microtubules. Bottom: the Ndc80 complex. (B) During mitosis, the outer kinetochores are fully assembled, while in meiotic prophase, the outer kinetochores disassemble. (C) Ndc80, Nuf2, and Spc24 protein abundance in meiosis. Anti-V5 immunoblotting was performed at the indicated time points for three epitope-tagged subunits of the Ndc80 complex (Ndc80-3V5, Nuf2-3V5, and Spc24-3V5) in a single strain (UB4361). Using the pGAL-NDT80 GAL4-ER synchronization method (Carlile and Amon, 2008), cells were arrested in pachytene and then released 8 hr after the cells were transferred to SPO to allow progression into the meiotic divisions. One of the two repeated experiments is shown. (D) Sister chromatid segregation in wild type (UB4432), pCUP-CLB3 (UB4434), pCUP-CLB3 pCUP-NDC80 (UB880), pCUP-CLB3 pCUP-NUF2 (UB4436), pCUP-CLB3 pCUP-SPC24 (UB980), and pCUP-CLB3 pCUP-SPC25 (UB885). A pair of sister chromatids of chromosome V was labeled with the centromeric TetO/TetR-GFP system (CENV-GFP). Left: A schematic depicting CENV-GFP dot localization in normal and abnormal meiosis I. In normal meiosis I, when homologous chromosomes segregate, a single GFP dot is present in one of the two nuclear masses of a binucleated cell. In abnormal meiosis I, when sister chromatids segregate, both nuclear masses of a binucleated cell contain a GFP dot. Right: The average fraction of binucleates that displayed sister chromatid segregation in meiosis I. Expression of Clb3 and each Ndc80 complex subunit (both regulated by the pCUP promoter) were co-induced by addition of CuSO46 hr after the cells were transferred to SPO. Concomitantly, cells were released from pachytene arrest by addition of β-estradiol. Cells were fixed 1 hr and 45 min after the release. The error bars represent the standard error of the mean from three independent experiments. 100 cells were counted per strain, per experiment.
Figure 1—figure supplement 1
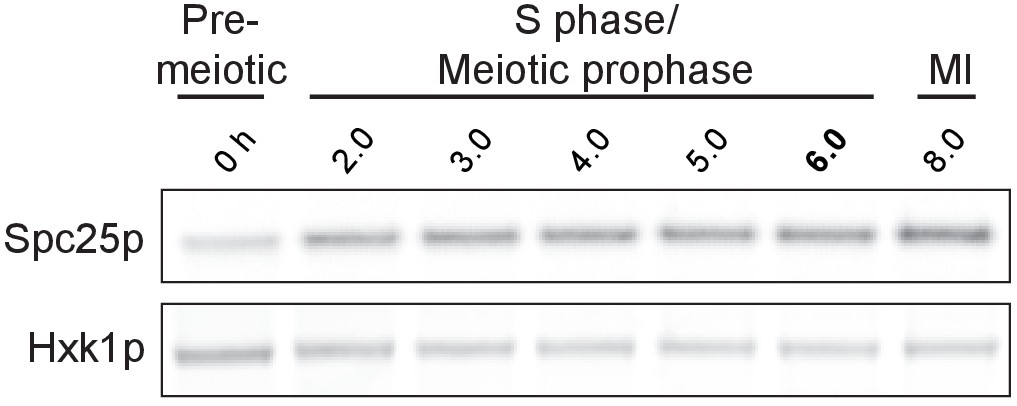
Spc25 protein is present throughout meiotic prophase.
Spc25-3V5 was detected by anti-V5 immunoblot. Hxk1, loading control. Cells (UB1051) were transferred to sporulation media (SPO) at 0 hr and arrested in pachytene using the reversible pGAL-NDT80 block. After 6 hr in SPO, NDT80 expression was induced with β-estradiol.
Figure 1—figure supplement 2
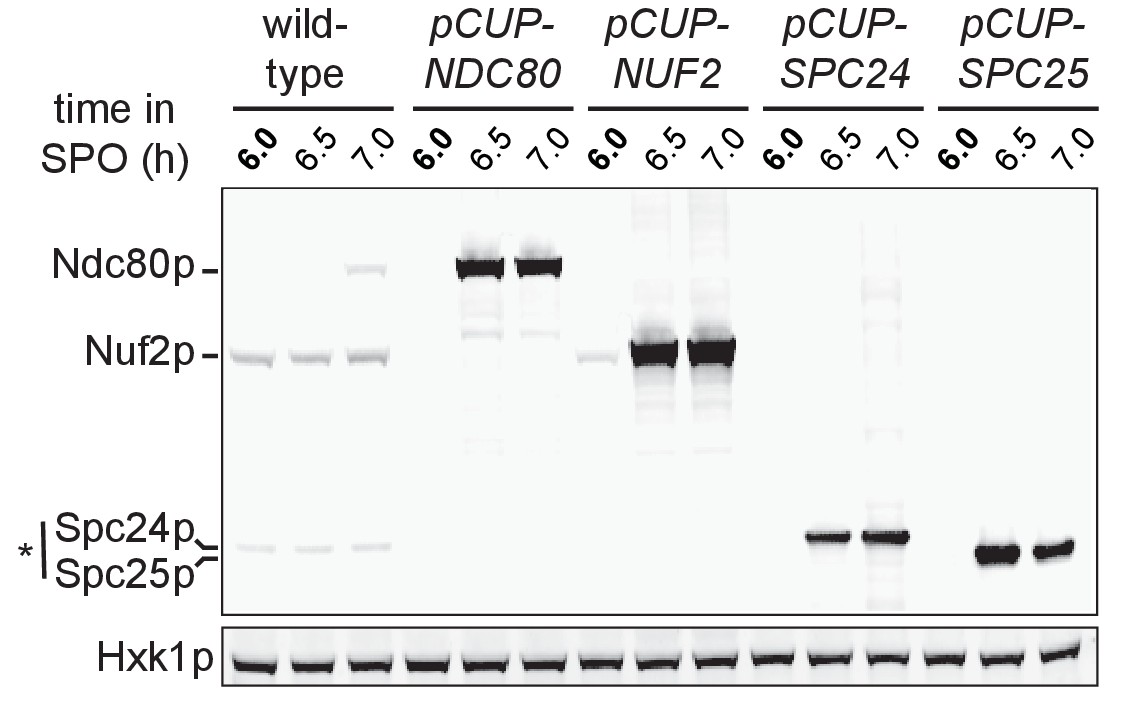
Over-expression of Ndc80, Nuf2, Spc24, and Spc25 during pro-metaphase I in pCUP-NDC80-3V5 (UB880), pCUP-NUF2-3V5 (UB12662), pCUP-SPC24-3V5 (UB12543) and pCUP-SPC25-3V5 (UB12547) strains, respectively.
The protein level of each Ndc80 complex subunit was detected by anti-V5 immunoblot. Hxk1, loading control. The wild type strain (UB4361) contains V5-tagged alleles for Ndc80, Nuf2, Spc24, but not Spc25. Cells were arrested in pachytene using the pGAL-NDT80 block. After 6 hr in SPO, cells were released by addition of β-estradiol. *Spc25 has higher molecular weight than Spc24, but it runs faster on a gel (Wigge et al., 1998).
Figure 2 with 6 supplements
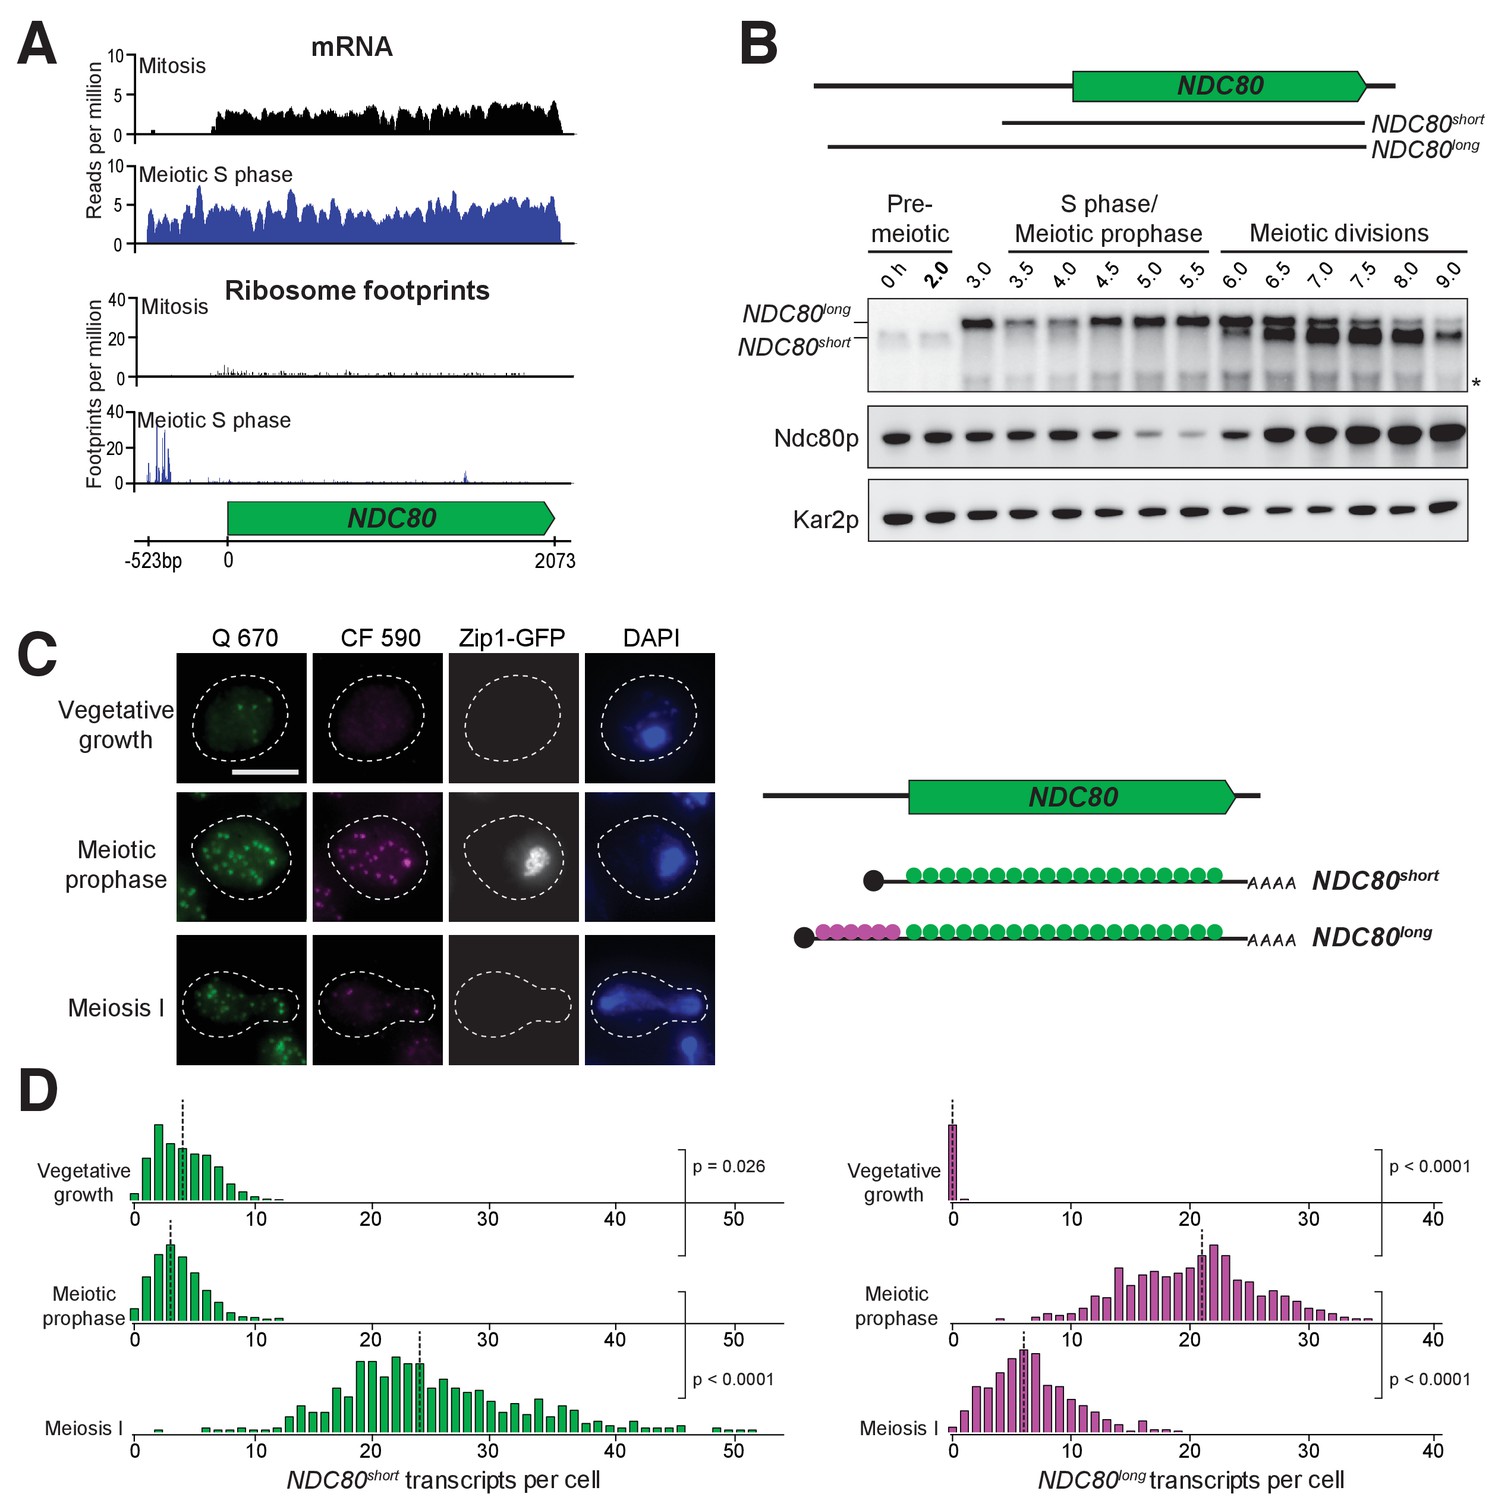
Two distinct NDC80 transcripts are expressed during meiosis.
(A) Ribosome profiling and mRNA-seq reads over the NDC80 locus during vegetative growth (top track) or meiotic S phase (bottom track). Data are derived from (Brar et al., 2012). (B) NDC80 mRNA isoforms and Ndc80 levels in meiosis. NDC80long and NDC80short levels were determined by northern blot, and Ndc80 level was determined by anti-V5 immunoblot at the indicated time points. To induce meiotic entry, IME1 and IME4 expression was induced in the strain UB1337 by addition of CuSO4 2 hr after cells were transferred to SPO. SCR1, loading control for northern blot. Kar2, loading control for immunoblot. One of the two repeated experiments is shown. * indicates a smaller RNA product, which likely represents a truncated form of NDC80long. (C) Representative smFISH images for NDC80long and NDC80short during vegetative growth and meiosis. Vegetative samples were taken when cells (UB8144) were growing exponentially in nutrient rich medium. Meiotic prophase samples were taken 6 hr after cells (UB8144) were transferred to SPO, a time when these cells were arrested in pachytene using the pGAL-NDT80 GAL4-ER system. Cells were then released by addition of β-estradiol, and meiosis I samples were taken 1.5 hr later. The Q 670 probes (shown in green) hybridize to the common region shared between NDC80long and NDC80short, whereas the CF 590 probes (shown in magenta) hybridize to the unique 5’ region of NDC80long (schematic is shown in the right panel). DNA was stained with DAPI (blue). Each cell was staged by its Zip1-GFP signal. Vegetative growth: Zip1-GFP negative. Meiotic prophase: Zip1-GFP positive. Meiosis I: Zip1-GFP negative and post NDT80 induction. Images here and throughout are shown as the maximum-intensity projections of z-stacks. Scale bar: 5 µm. (D) Quantification of smFISH data shown in (C), graphed as the relative frequency histograms of cells with a given number of NDC80long and NDC80short transcripts per cell, using data pooled from three independent experiments. The dashed line indicates the median number of NDC80long and NDC80short transcripts per cell. Each histogram here and throughout was normalized so that the maximum bin height is the same across all histograms. A total number of 637 cells were analyzed for vegetative growth, 437 for meiotic prophase, and 491 for meiosis I. Two-tailed Wilcoxon Rank Sum test was performed between each pair of conditions as indicated by the bracket. Refer to Supplementary file 1F for a summary of the median transcript levels for all the smFISH experiments.
Figure 2—figure supplement 1
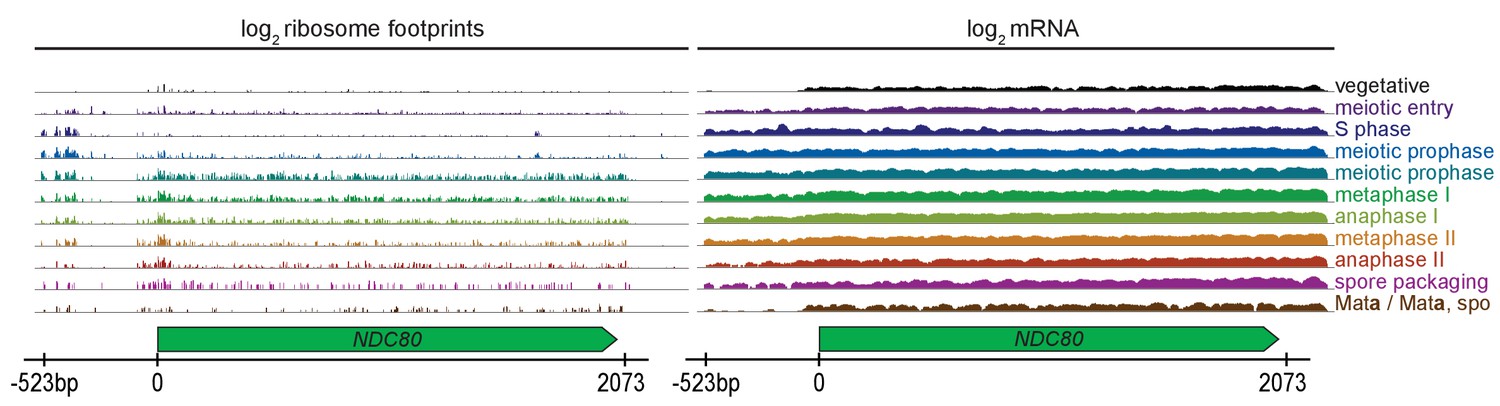
Ribosome profiling and mRNA-seq reads over the NDC80 locus, during vegetative growth, starvation (MATa/MATa), and throughout meiosis.
Data are derived from (Brar et al., 2012).
Figure 2—figure supplement 2
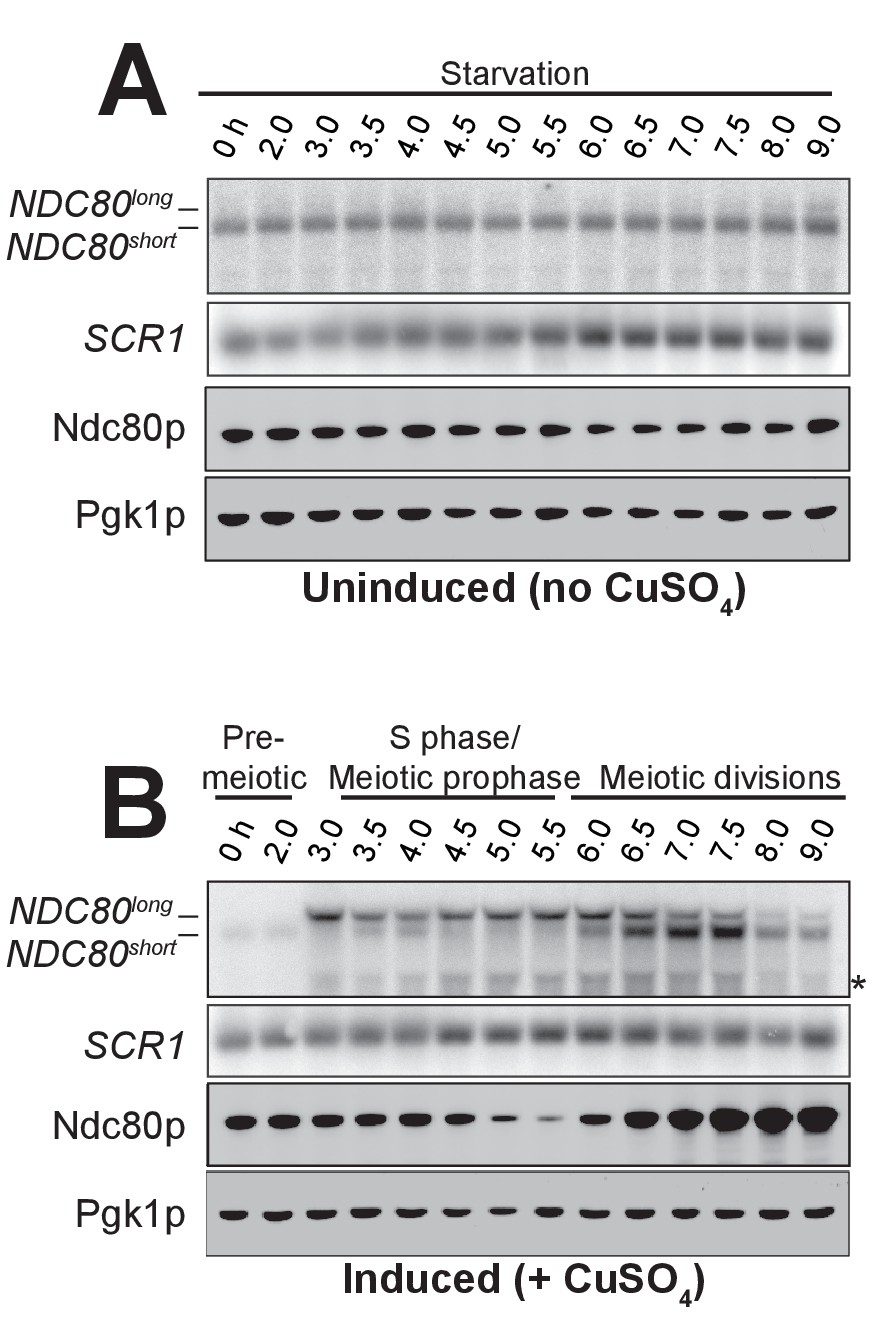
During starvation, NDC80short and Ndc80 protein levels remain high, while NDC80long is not expressed.
The abundance of NDC80 mRNA isoforms and Ndc80 protein level in starvation versus in meiosis. NDC80long and NDC80short were detected by northern blot, and Ndc80, by anti-V5 immunoblot. SCR1, loading control for northern blot. Pgk1, loading control for immunoblot. Cells harboring the pCUP-IME1 pCUP-IME4 system (UB1337) were transferred into SPO at 0 hr. After 2 hr, the culture was split into two: In one half, IME1 and IME4 expression was never induced, and thus cells stayed in starvation (A). In the other half, IME1 and IME4 expression was induced by addition of CuSO4 (B). * indicates a smaller RNA product, which likely represents a truncated form of NDC80long. Note: the samples in the induced conditions are the same as in Figure 2B, but the northern blot in this figure was a rerun of Figure 2B, and the immunoblot has a different loading control displayed.
Figure 2—figure supplement 3
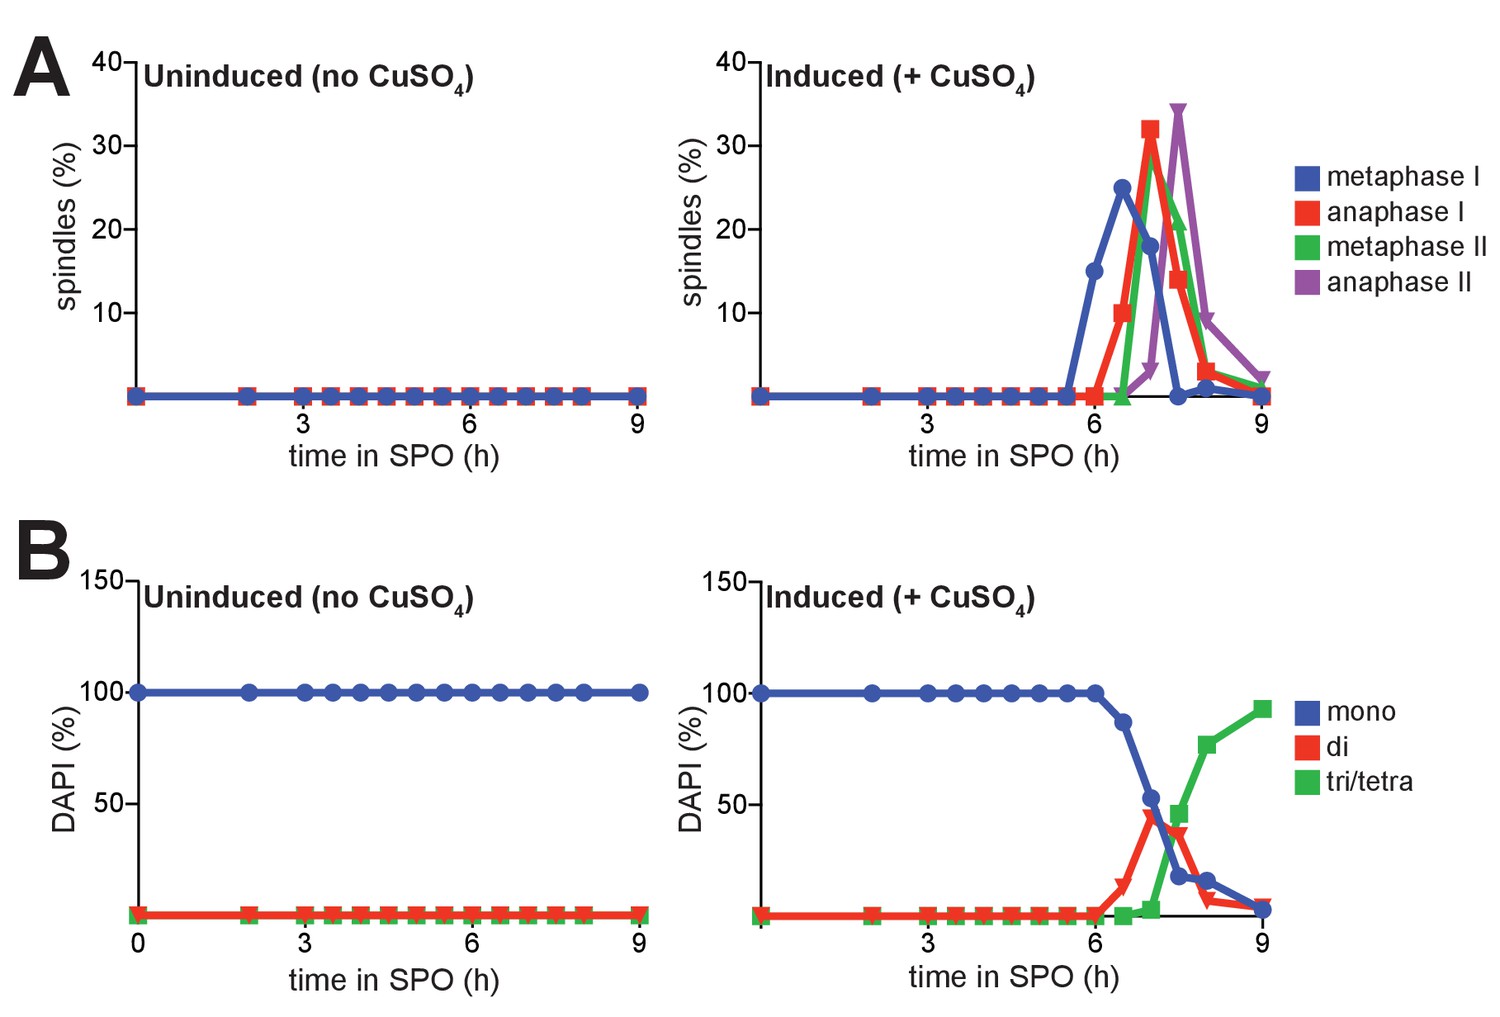
Progression of cells through meiosis as determined by spindle morphology and DAPI staining.
(A) Percentage of cells with metaphase I, anaphase I, metaphase II, or anaphase II spindles at each time point of the experiment in Figure 2—figure supplement 2. (B) Percentage of cells with 1 (mononucleates), 2 (binucleates), or 3/4 (triad/tetranucleates) nuclei at the end of meiosis for the experiment in Figure 2—figure supplement 2, determined by counting cells stained with DAPI. In all analyses, 100 cells were counted per time point, per condition. Results from one of the two repeated experiments are shown.
Figure 2—figure supplement 4
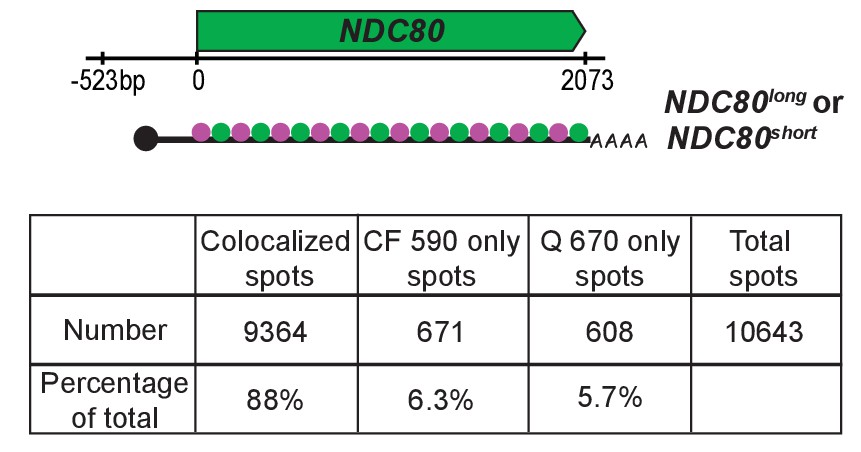
Percentage of the colocalized or non-colocalized smFISH spots obtained using the odd and even smFISH probe sets.
Top: Schematic for the odd and even probe sets. Fifty-four oligonucleotide probes tiling the common region of NDC80luti and NDC80ORF were designed. All the odd number probes were labeled with one fluorophore (CAL Fluor Red 590, shown in magenta), and the even number probes, with another fluorophore (Quasar 670, shown in green). Wild type cells (UB8144) were transferred to SPO to induce meiosis. 6 hr later, samples were fixed and hybridized with the odd and even probe sets. A total of 428 meiotic prophase cells were analyzed, pooling from two independent experiments.
Figure 2—figure supplement 5
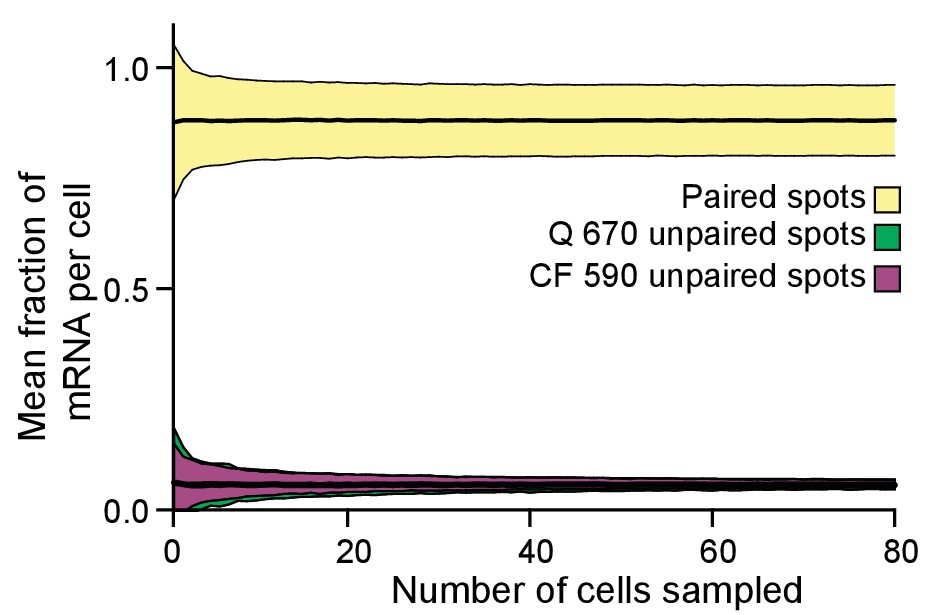
Bootstrapping analysis performed for the data obtained from the odd and even probe sets.
Quantified cells from all the acquired fields of view were pooled, and then a given number (n) of cells were randomly sampled 500 times. The mean and 95% credible interval were calculated for the fraction of paired and unpaired mRNA per cell, and these data plotted for each choice of the number n. The number of cells measured (428 cells) exceeded the number at which the error plateaued (60 cells), indicating that additional data would not improve the confidence in the measurements.
Figure 2—figure supplement 6
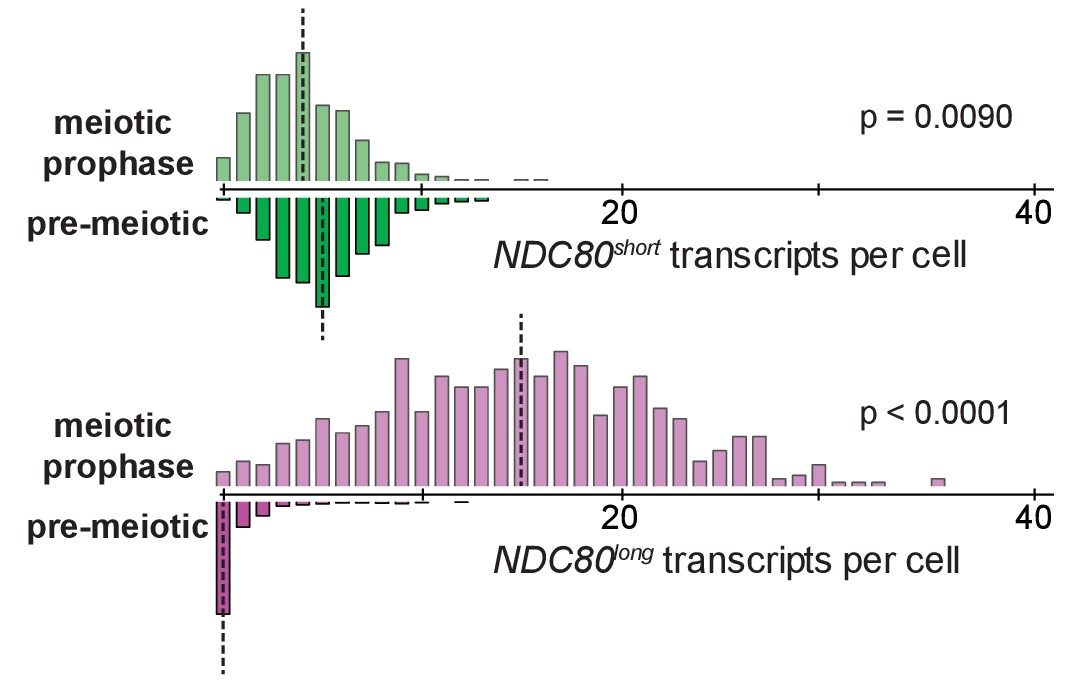
smFISH quantification for NDC80long and NDC80short in pre-meiotic starvation and meiotic prophase.
Cells harboring pCUP-IME1 pCUP-IME4 (UB6190) were transferred to sporulation medium (SPO), and after 2 hr in SPO, pre-meiotic samples were taken. CuSO4 was then added to induce expression of IME1 and IME4. 2 hr after copper induction, meiotic prophase samples were taken. The quantification was graphed as the relative frequency histograms of cells with a given number of NDC80long and NDC80short transcripts per cell, using data pooled from three independent experiments. The dashed line indicates the median number of NDC80long and NDC80short transcripts per cell. A total number of 594 cells were analyzed for the pre-meiotic stage and 611 for meiotic prophase. Two-tailed Wilcoxon Rank Sum test was performed for NDC80short and NDC80long, respectively, comparing meiotic prophase with pre-meiotic starvation. Note: the frequency histogram for meiotic prophase is the same as in Figure 4C, NDC80.
Figure 3 with 1 supplement
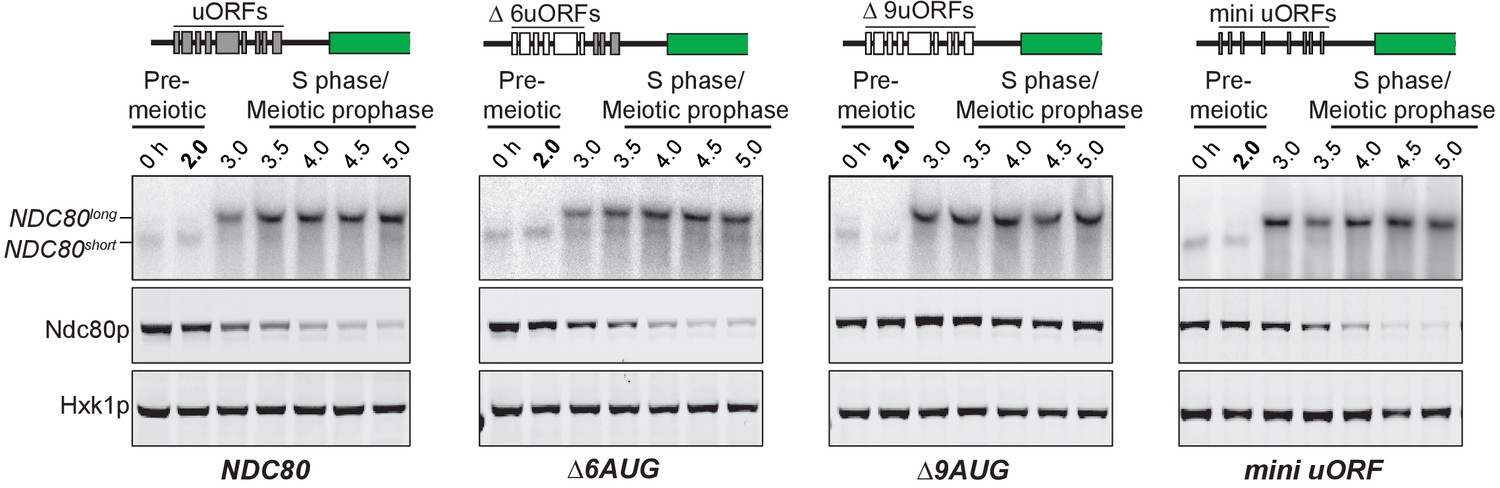
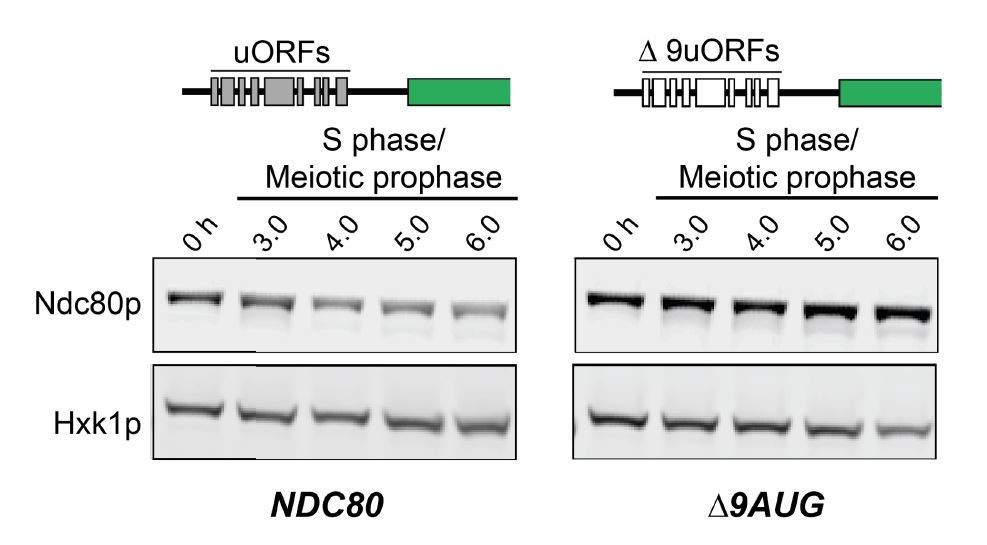
The longer NDC80 mRNA isoform is unable to synthesize Ndc80 protein due to translation of its AUG uORFs.
(A) NDC80short, NDC80long, and Ndc80 abundance during synchronous meiosis (as described in Figure 2B) in wild type (UB6190), Δ6AUG (UB6181), Δ9AUG (UB6183), and mini uORF (UB9243) strains. In the Δ6AUG and Δ9AUG strains, the first 6 or 9 uORF AUGs in the 5’ leader of NDC80long were converted to AUCs, respectively. The mini uORF construct contained all 9 uORF start sites in the NDC80long leader; however, the third codon of each of the 9 uORFs was mutated to a stop codon. One of the two repeated experiments is shown.
Figure 3—figure supplement 1
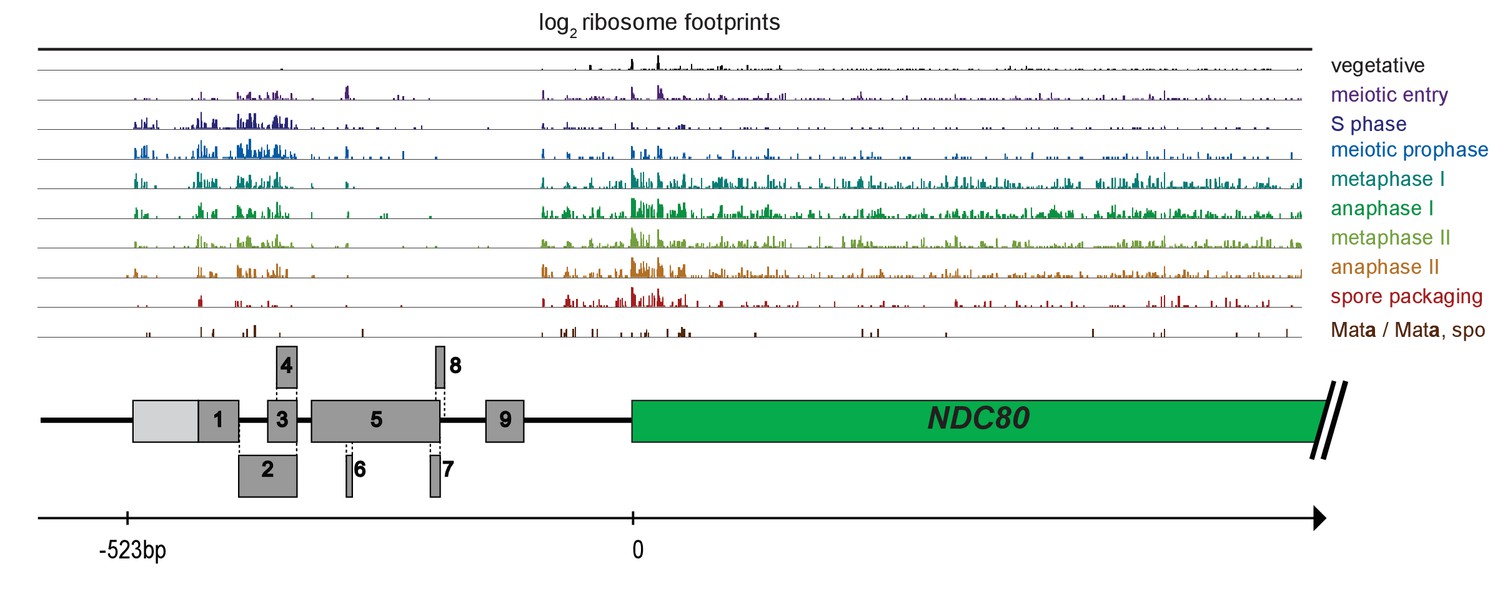
The first 6 AUG uORFs in the NDC80long mRNA have ribosome footprint signatures consistent with them being translated.
Ribosome profiling reads over the NDC80 locus throughout meiosis (Brar et al., 2012). The dark grey boxes indicate the locations of the nine AUG uORFs. The lighter grey box indicates the location of a uORF with a near cognate start site (AUU) and ribosome footprints characteristic of translated regions. The positions of these uORFs in relation to the NDC80 ORF are drawn proportional to the axis, with the start of NDC80 ORF marked as 0, and the approximate 5’ end of NDC80luti mRNA marked as −523 bp.
Figure 4 with 3 supplements
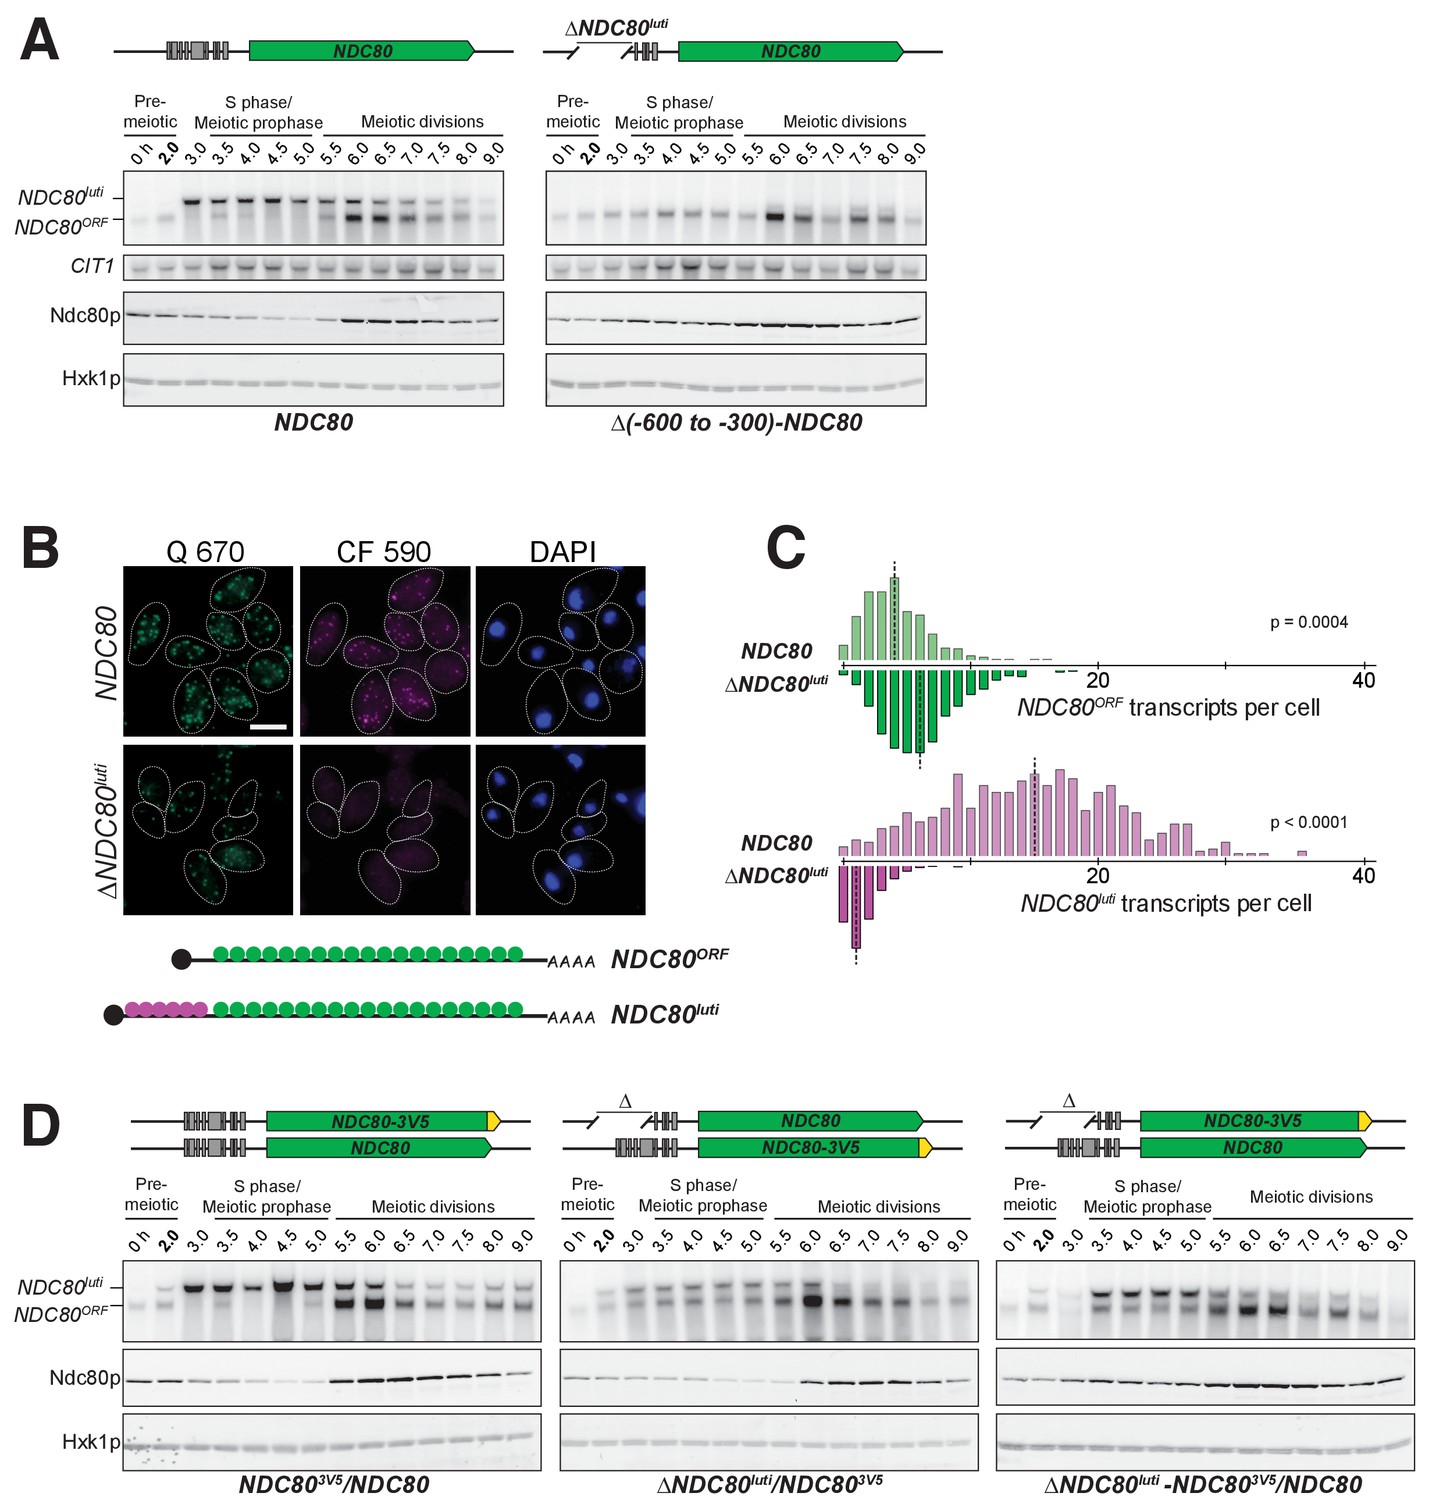
NDC80luti is necessary to downregulate NDC80ORF.
(A) NDC80ORF, NDC80luti, and Ndc80 abundance during synchronous meiosis (as described in Figure 2B) in wild type cells (FW1902) and in ΔNDC80luti cells (FW1871), in which 300–600 bp upstream of the Ndc80 translation start site were deleted. Ndc80 level was determined by anti-V5 immunoblot. CIT1, loading control for northern blot. Hxk1, loading control for immunoblot. One of the two repeated experiments is shown. (B) Representative smFISH images for NDC80luti and NDC80ORF during meiotic prophase in wild type cells (UB6190) and in ΔNDC80luti cells (UB6079), in which 479–600 bps upstream of the Ndc80 translation start site were deleted. This deletion construct was used, as opposed to the (−600 to −300) deletion, because this construct retains all the binding sites for the CF 590 probes (bind to the unique region of NDC80luti). Samples were taken 2 hr after IME1 and IME4 induction in a synchronous meiosis and hybridized with the Q 670 probes (bind to the common region of NDC80luti and NDC80ORF, shown in green) and the CF 590 probes (shown in magenta), as in Figure 2C. DNA was stained with DAPI (blue). Scale bar: 5 µm. (C) Quantification of smFISH data shown in (B), graphed as the relative frequency histograms of cells with a given number of NDC80luti and NDC80ORF transcripts per cell, using data pooled from three independent experiments. The dashed line indicates the median number of NDC80luti and NDC80ORF transcripts per cell. A total number of 611 cells were analyzed for wild type and 649 for ∆NDC80luti. Two-tailed Wilcoxon Rank Sum test was performed for NDC80ORF and NDC80luti, respectively, comparing wild type with ∆NDC80luti during meiotic prophase. (D) NDC80luti represses NDC80ORF expression in cis. Meiosis was induced and samples were collected and processed as in (A). Ndc80 level was determined by anti-V5 immunoblot. Hxk1, loading control. Three yeast strains were used in this experiment: 1) a strain (FW1900) with one NDC80-V5 allele and one wild type NDC80 allele (left), 2) a strain (FW1899) with one NDC80-3V5 allele and one ΔNDC80luti allele, in which 300–600 bp upstream of the Ndc80 translation start site were deleted (middle), and 3) a strain (FW1923) with one ΔNDC80luti-NDC80-3V5 allele, which has the aforementioned 300–600 bps deletion, and one wild type NDC80 allele (right). One of the two repeated experiments is shown.
Figure 4—figure supplement 1
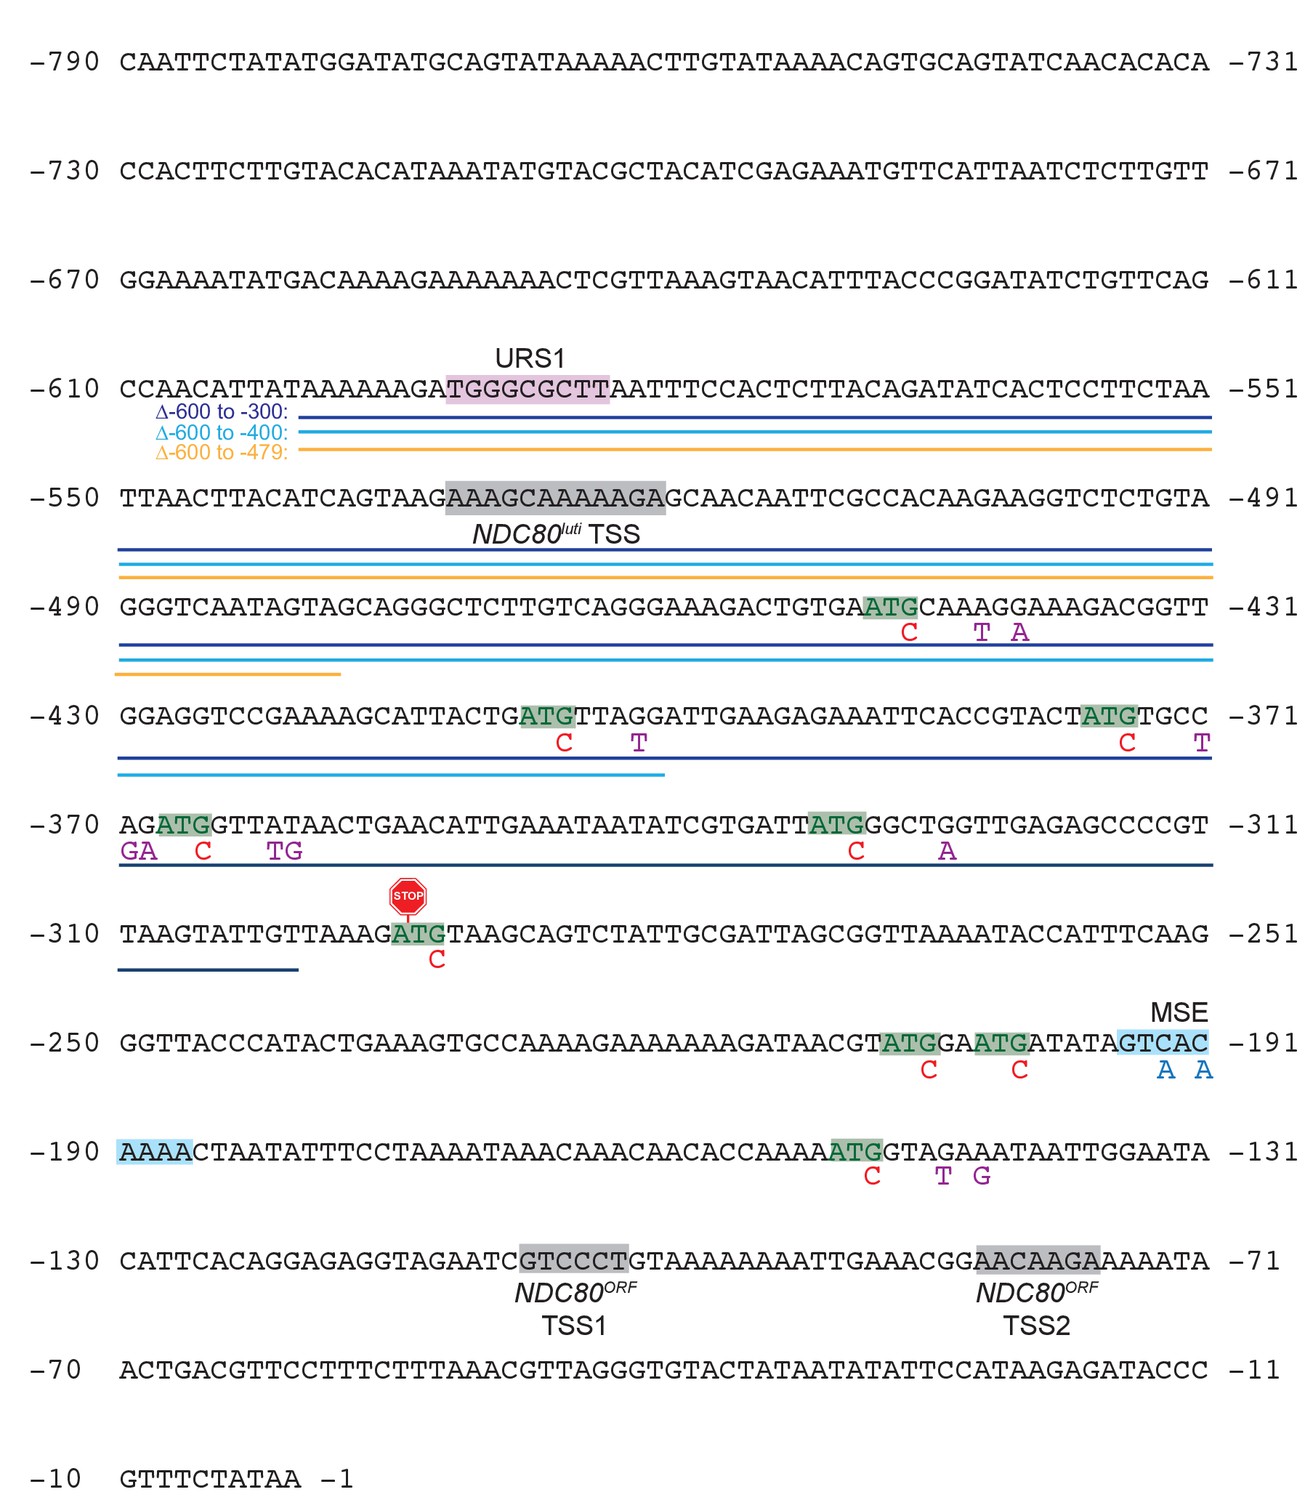
Annotated upstream intergenic region of the NDC80 locus and engineered mutations used in this study.
The numbers on both sides of the nucleotide sequence indicate the distance away from the NDC80 ORF start codon. Regions of the transcription start sites (TSS) for NDC80luti and NDC80ORF, as estimated from a published RNA-seq dataset (Brar et al., 2012), are highlighted in grey. NDC80ORF has two detectable regions of the transcription start sites (TSS1 and TSS2). The different ∆NDC80luti constructs used in this study are marked: dark blue for the −600 to −300 deletion (Figure 4A and D), light blue for the −600 to −400 deletion (Figure 7A), and orange for the −600 to −479 deletion (Figure 4B and C). Below each ATG of the 9 AUG uORFs (highlighted in green), the red letter ‘C’ represents the G to C mutations engineered to abolish uORF translation in the Δ6AUG and Δ9AUG strains (Figure 3). The purple letters represent the nucleotides mutated in the mini uORF strain to generate a stop codon (UGA) at the third codon position for every AUG uORF. The site at which the terminator sequence was inserted is indicated by a stop sign.
Figure 4—figure supplement 2
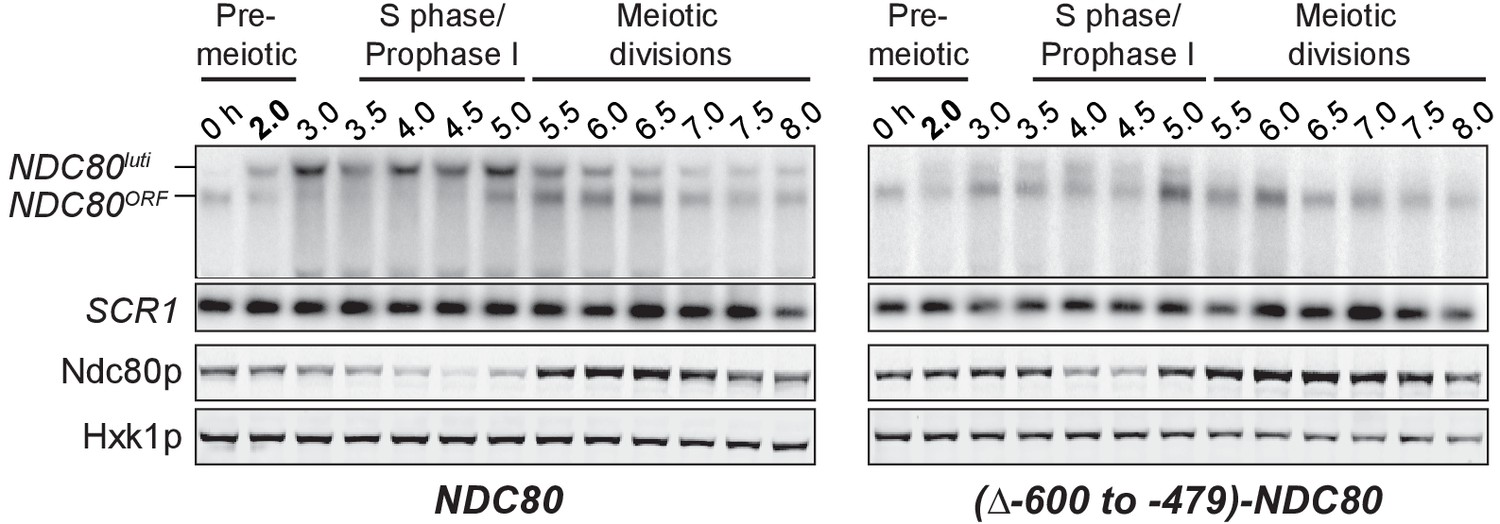
Expression of NDC80luti is necessary for NDC80ORF downregulation.
NDC80ORF, NDC80luti, and Ndc80 abundance during synchronous meiosis in wild type cells (UB6190) and in (∆−600 to −479)-NDC80 cells (UB6079), in which the 479–600 bps upstream of the Ndc80 translation start site were deleted. Ndc80 level was determined by anti-V5 immunoblot. SCR1, loading control for northern blot. Hxk1, loading control for immunoblot.
Figure 4—figure supplement 3
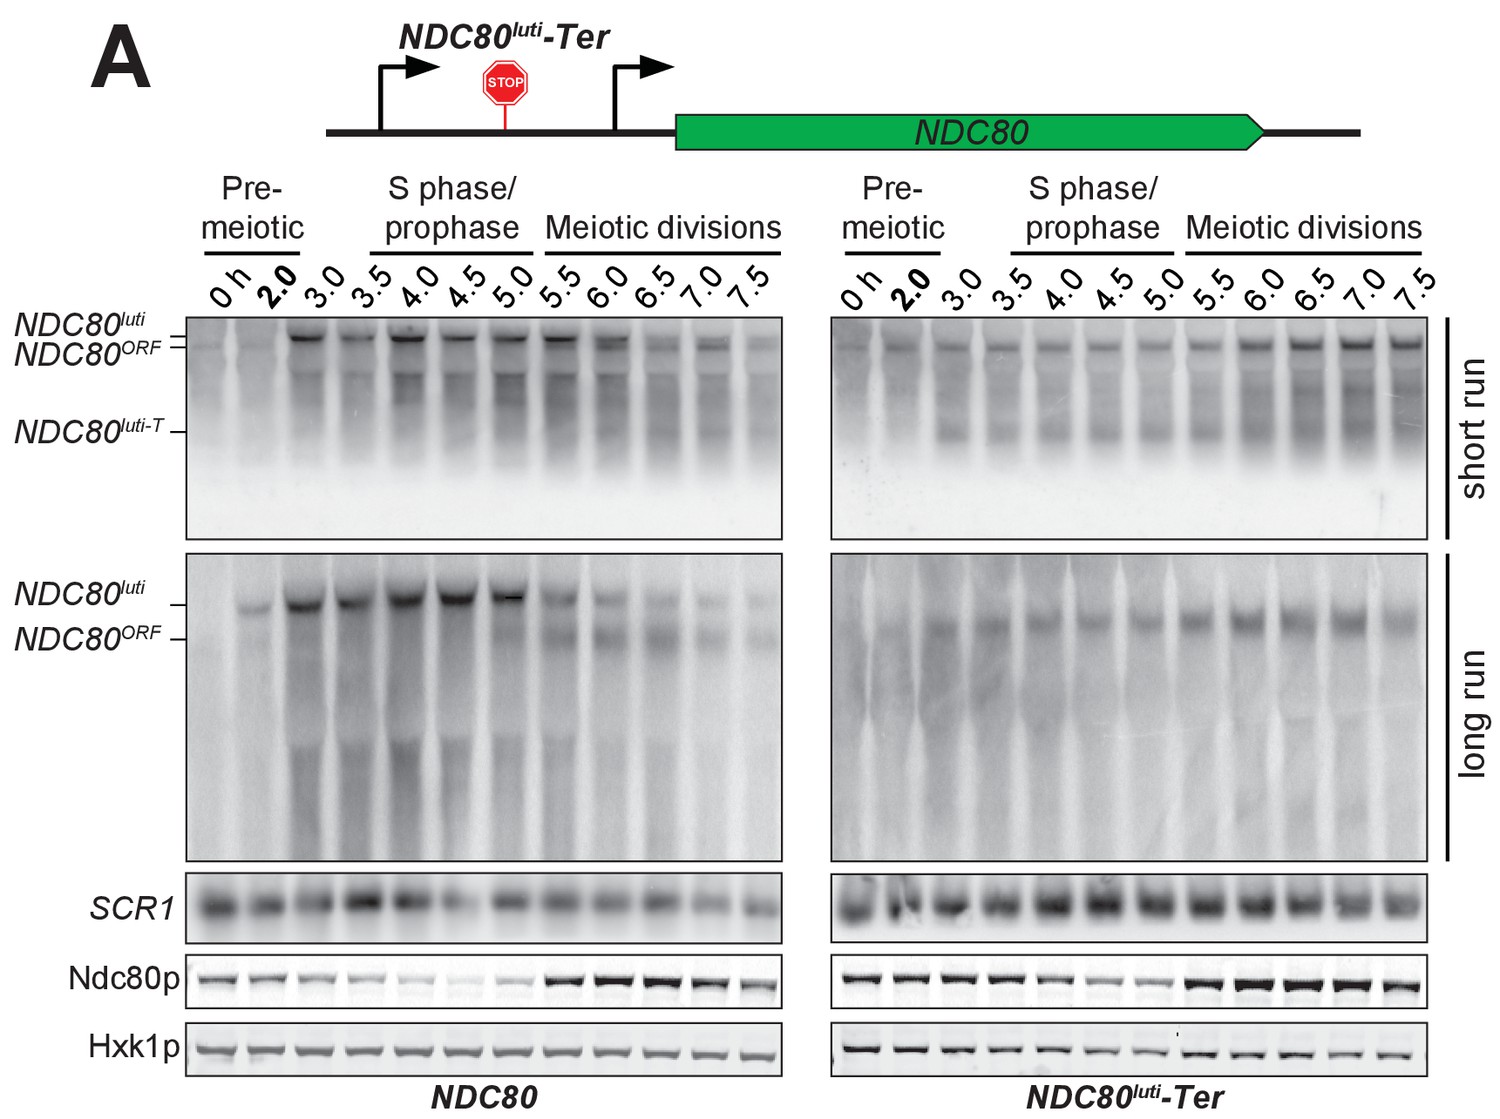
Premature termination of NDC80luti prevents NDC80ORF downregulation.
NDC80ORF, NDC80luti, and Ndc80 abundance during synchronous meiosis in wild type cells (UB6190) and in NDC80luti-Ter cells (UB6077), which harbor a terminator sequence inserted after the second uORF of NDC80luti. Ndc80 protein level was determined by anti-V5 immunoblot. SCR1, loading control for northern blot. Hxk1, loading control for immunoblot. Top (short run): the gel was run for 1.5 hr. Middle: (long run) the gel was run for 3 hr. Note that the NDC80luti and NDC80ORF isoforms could be sufficiently resolved only in the long run conditions, while the truncated NDC80luti transcript due to early termination (NDC80luti term) could only be detected in the short run conditions. One of the two repeated experiments is shown.
Figure 5 with 1 supplement
NDC80luti is sufficient to downregulate NDC80ORF.
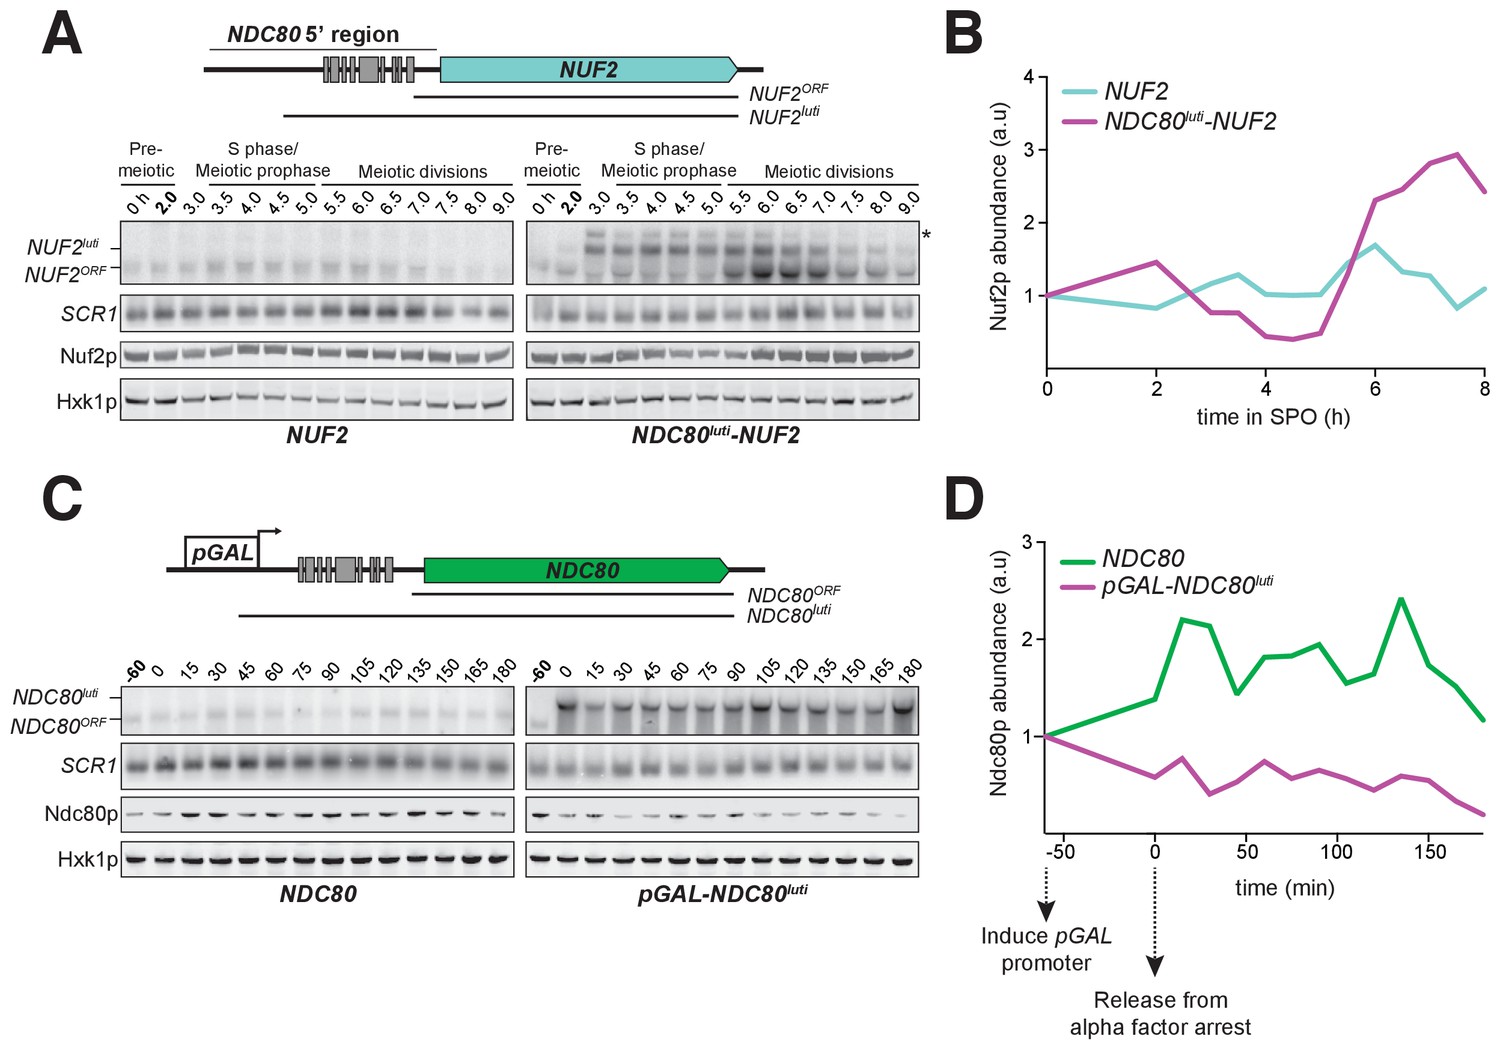
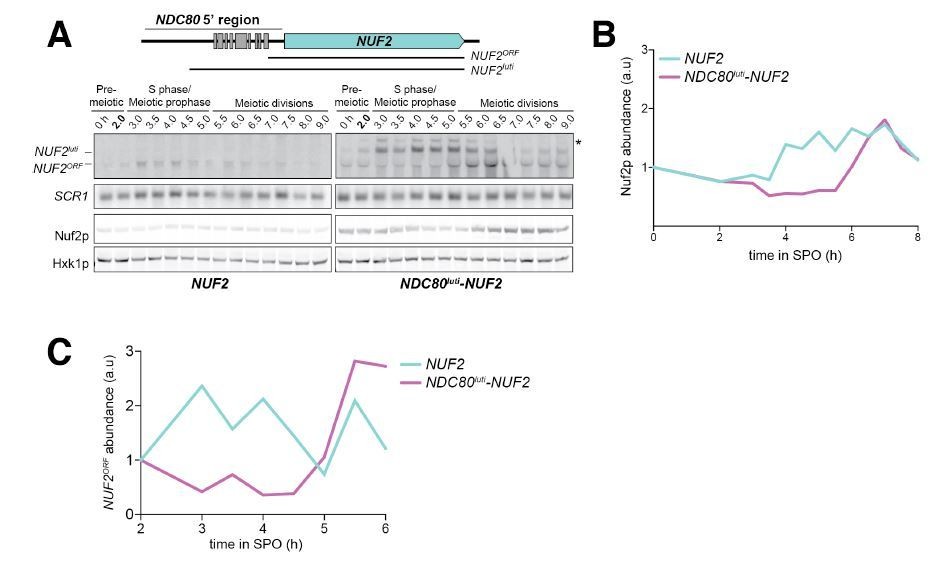
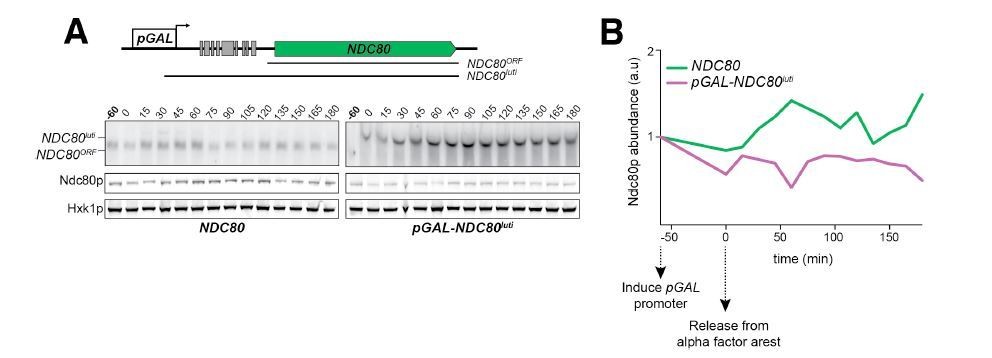
(A) A luti-mRNA is produced by the NDC80luti-NUF2 fusion construct (NUF2luti) in meiosis. To generate the NDC80luti-NUF2 construct, the promoter and leader sequence of NDC80luti (1000 bps directly upstream of the NDC80 ORF start site) was placed immediately upstream of the NUF2 coding region. NUF2luti and NUF2ORF expression was detected by northern blot, and Nuf2 was detected by anti-V5 immunoblot. SCR1, loading control for northern blot. Hxk1, loading control for immunoblot. Samples were taken when the wild type (UB5103) and NDC80luti-NUF2 (UB5101) cells were undergoing synchronous meiosis. * indicates a band of unknown origin. One of the two repeated experiments is shown. (B) Quantification of Nuf2 protein abundance from the experiment shown in (A). For each time point, Nuf2 signal was first normalized to Hxk1. This normalized value was set to 1 for the 0 hr time point (t0), and all the subsequent time points were calibrated relative to t0. (C) NDC80ORF, NDC80luti, and Ndc80 levels when NDC80luti is expressed in synchronous mitosis. MATa wild type control (UB2389) and pGAL-NDC80luti (UB2388) cells, both harboring the Gal4-ER fusion protein, were arrested in G1 with α-factor. pGAL expression was induced 2 hr later by addition of β-estradiol (−60 min). One hour after the β-estradiol addition (0 min), cells were released from G1 arrest. One of the two repeated experiments is shown. (D) Quantification of Ndc80 abundance from the experiment shown in (C). For each time point, Ndc80 signal was first normalized to Hxk1. This normalized value was set to one for the first time point at −60 min (t-60, the time of β-estradiol addition) and all the subsequent time points were then calibrated relative to t-60.
Figure 5—figure supplement 1
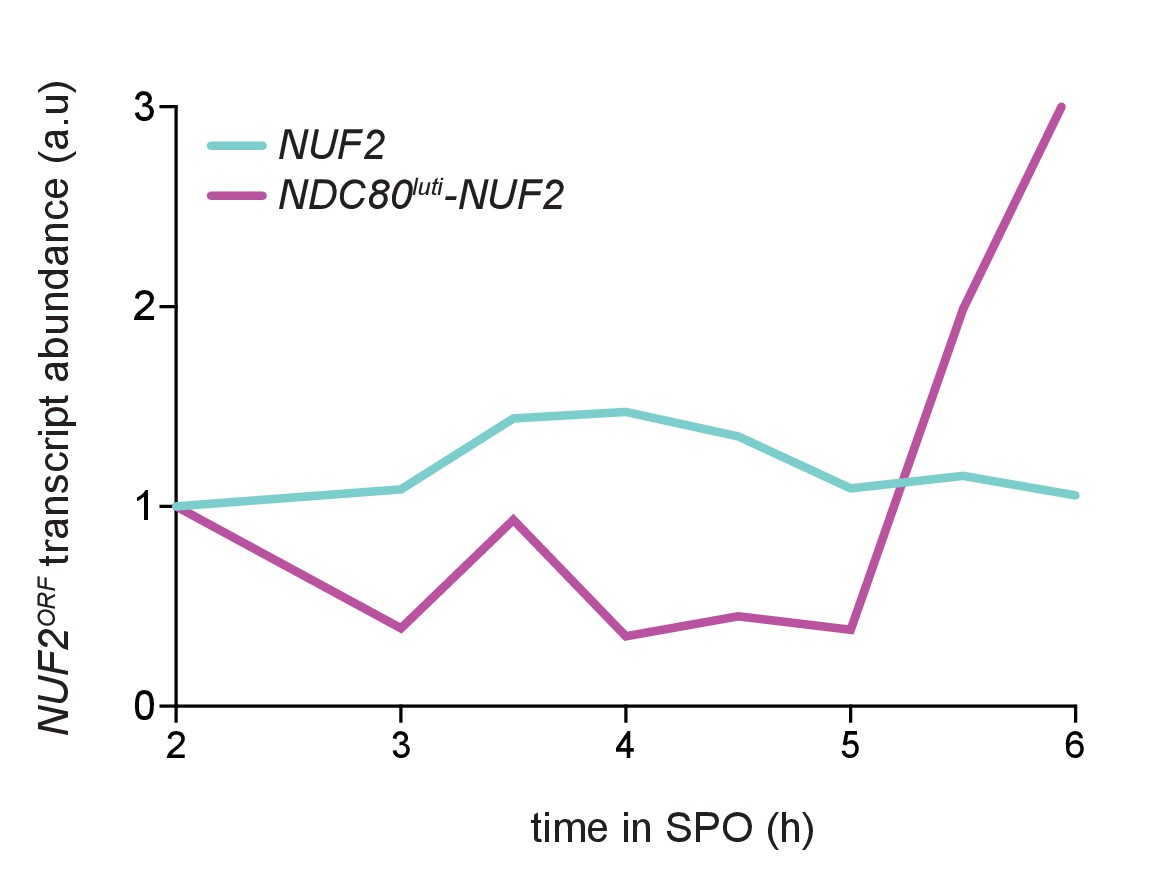
Quantification of NUF2 mRNA abundance from experiment shown in Figure 5A.
NUF2 signal was first normalized to SCR1. This normalized value was set to one for the time point collected 2 hr after entry into SPO (t2) and all the subsequent time points were then calibrated relative to t2. One of the two repeated experiments is shown.
Figure 6 with 4 supplements
The meiosis-specific transcription factors Ime1 and Ndt80 regulate NDC80luti and NDC80ORF, respectively.
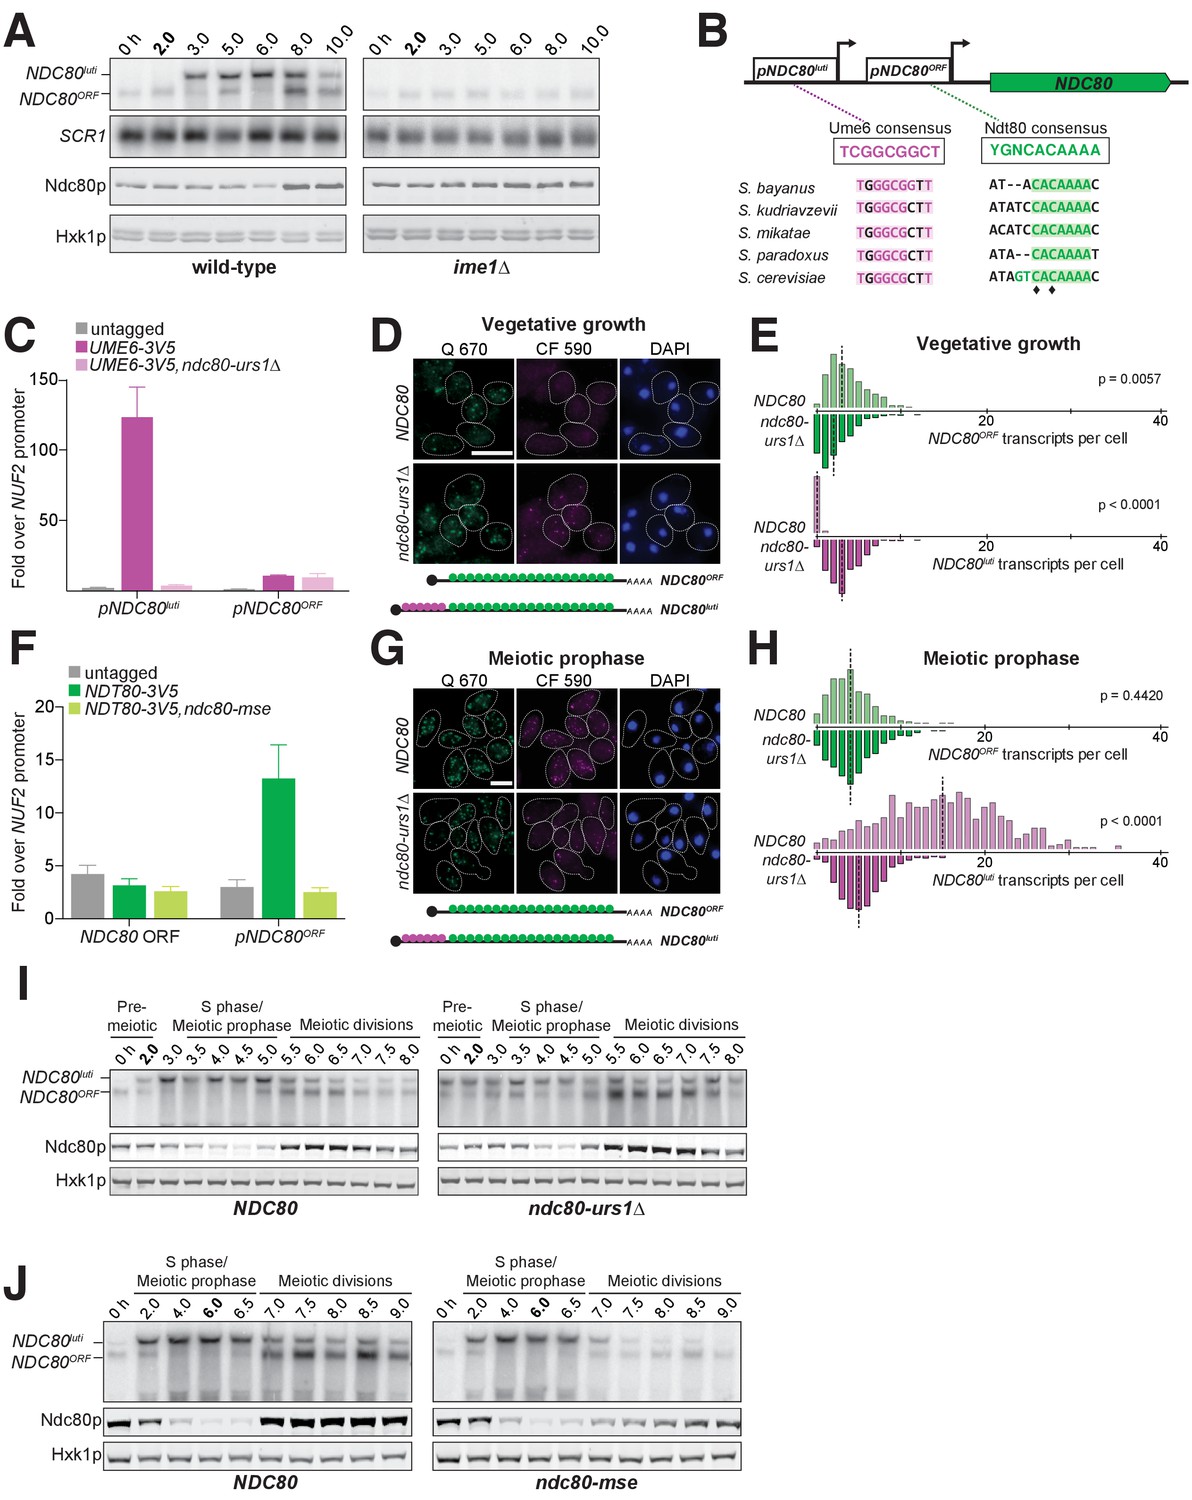
(A) NDC80ORF, NDC80luti, and Ndc80 abundance during meiosis in pCUP-IME1 pCUP-IME4 (FW1902) and pCUP-IME4 ime1∆ (FW3058) cells. Expression from the pCUP promoter was induced 2 hr after cells were transferred to SPO. One of the two repeated experiments is shown. (B) Putative Ume6 (URS1) and Ndt80 (MSE) binding sites are present in the intergenic region upstream of NDC80. Colored bases match the consensus binding sequences. Highlighted areas indicate the conserved regions across all five Saccharomyces species by Clustal analysis (RRID:SCR_001591). The black diamonds indicate the two sites mutated from C to A in the ndc80-mse strain. (C) Ume6-3V5 chromatin immunoprecipitation in untagged (UB2531), UME6-3V5 (UB3301), and UME6-3V5 ndc80-urs1∆ (UB6760) strains. Cells were harvested after overnight growth in BYTA. The DNA fragments recovered from the Ume6-3V5 ChIP were quantified by qPCR using two primer pairs: one specific for the NDC80luti promoter and one specific for the NDC80ORF promoter. Enrichment at these loci was normalized to the signal from the NUF2 promoter, to which Ume6 does not bind. The mean fold enrichment over the NUF2 promoter from three independent experiments, as well as the standard error of the mean, is displayed. (D) Representative smFISH images for NDC80luti and NDC80ORF during vegetative growth in wild type (UB5875) and ndc80-urs1∆ (UB5473) strains. Cells were grown in nutrient rich medium to exponential phase. Samples were fixed and hybridized with the Q 670 probes (bind to the common region of NDC80luti and NDC80ORF, shown in green) and the CF 590 probes (bind to the unique region of NDC80luti, shown in magenta) as in Figure 2C. DNA was stained with DAPI (blue). Scale bar: 5 µm. (E) Quantification of (D), graphed as the relative frequency histograms of cells with a given number of NDC80luti and NDC80ORF transcripts per cell, using data pooled from three independent experiments. The dashed line indicates the median number of NDC80luti and NDC80ORF transcripts per cell. A total number of 490 cells were analyzed for wild type and 427 for ndc80-urs1∆. Two-tailed Wilcoxon Rank Sum test was performed for NDC80ORF and NDC80luti, respectively, comparing wild type with ndc80-urs1∆ in vegetative growth. (F) Ndt80-3V5 chromatin immunoprecipitation in untagged (UB7997), NDT80-3V5 (UB7999), and NDT80-3V5 ndc80-mse strains (UB7496). After 5 hr in SPO, NDT80 expression was induced with β-estradiol. One hour after Ndt80 induction, cells were fixed with formaldehyde and chromatin extracts were prepared. The recovered DNA fragments were quantified by qPCR using two primer pairs: one specific for the NDC80ORF promoter (pNDC80ORF) and one specific to the NDC80 coding region (NDC80 ORF). Enrichment at these loci was normalized to the signal from the NUF2 promoter, to which Ndt80 does not bind. The mean fold enrichment over the NUF2 promoter from three independent experiments, as well as the standard error of the mean, is displayed. (G) Representative smFISH images for NDC80luti and NDC80ORF during meiotic prophase in wild type (UB6190) and ndc80-urs1∆ (UB6075) strains. Samples were taken 2 hr after IME1 and IME4 induction in a synchronous meiosis experiment and processed as in Figure 2C. Scale bar: 5 µm. Note: the image for wild type is the same as the one shown in Figure 4B. (H) Quantification of (G), graphed as relative frequency histograms as in (E). A total number of 611 cells were analyzed for wild type and 668 for ndc80-urs1∆. Two-tailed Wilcoxon Rank Sum test was performed for NDC80ORF and NDC80luti, respectively, comparing wild type with ndc80-urs1∆ during meiotic prophase. Note: the histograms for the wild type cells are the same as those shown in Figure 4C. (I) NDC80ORF, NDC80luti, and Ndc80 levels during synchronous meiosis (as described in Figure 2B) in wild type cells (UB6190) and ndc80-urs1∆ cells (UB6075). (J) NDC80ORF, NDC80luti, and Ndc80 level during meiosis in wild type (UB4074) and ndc80-mse (UB3392) strains. Both strains harbor the pGAL-NDT80 GAL4-ER system. Cells were transferred to SPO at 0 hr and released from pachytene arrest at 6 hr by addition of β-estradiol.
Figure 6—figure supplement 1
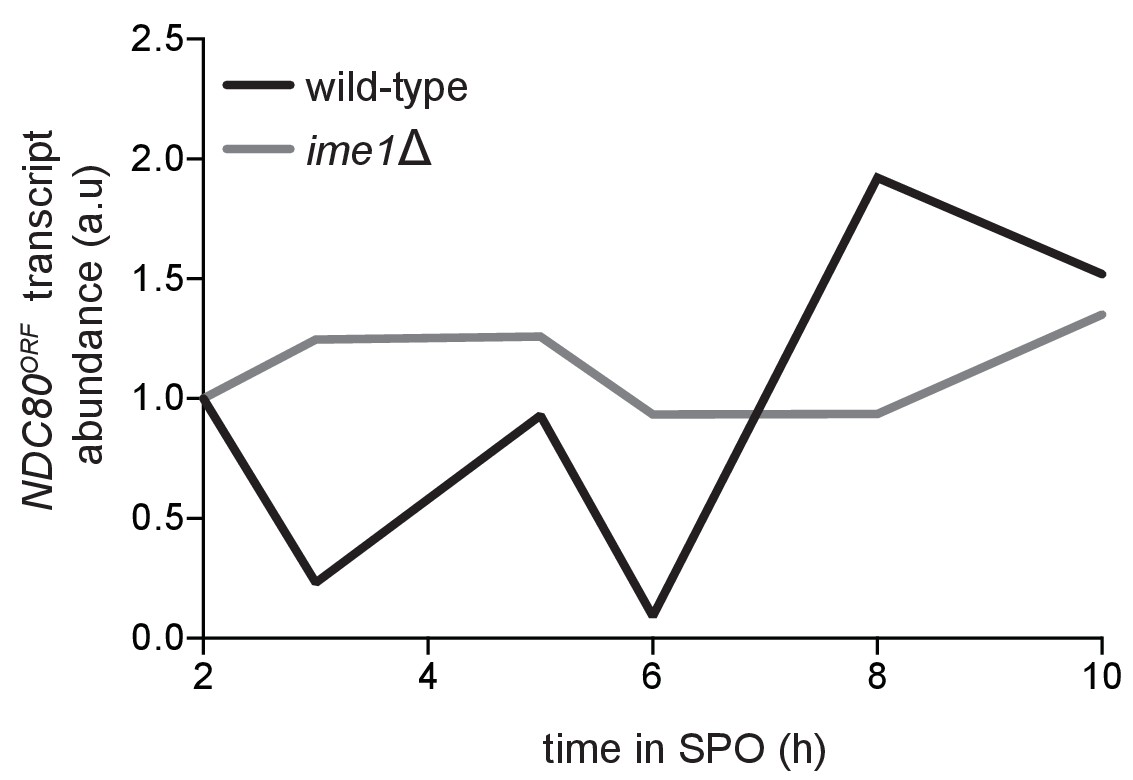
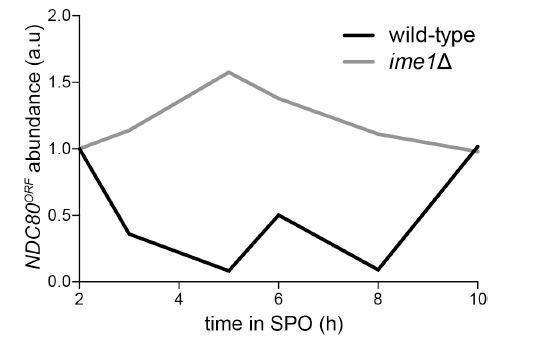
Quantification of the NDC80ORF transcript abundance shown in Figure 6A, a time course comparing the pCUP-IME1 pCUP-IME4 strain (FW1902) during meiosis with the pCUP-IME4 ime1∆ strain (FW3058).
NDC80ORF signal was first normalized to SCR1. The normalized value for the 2 hr time point (immediately prior to IME1 and IME4 induction) was set to 1, and all the subsequent time points were calibrated relative to this time point.
Figure 6—figure supplement 2
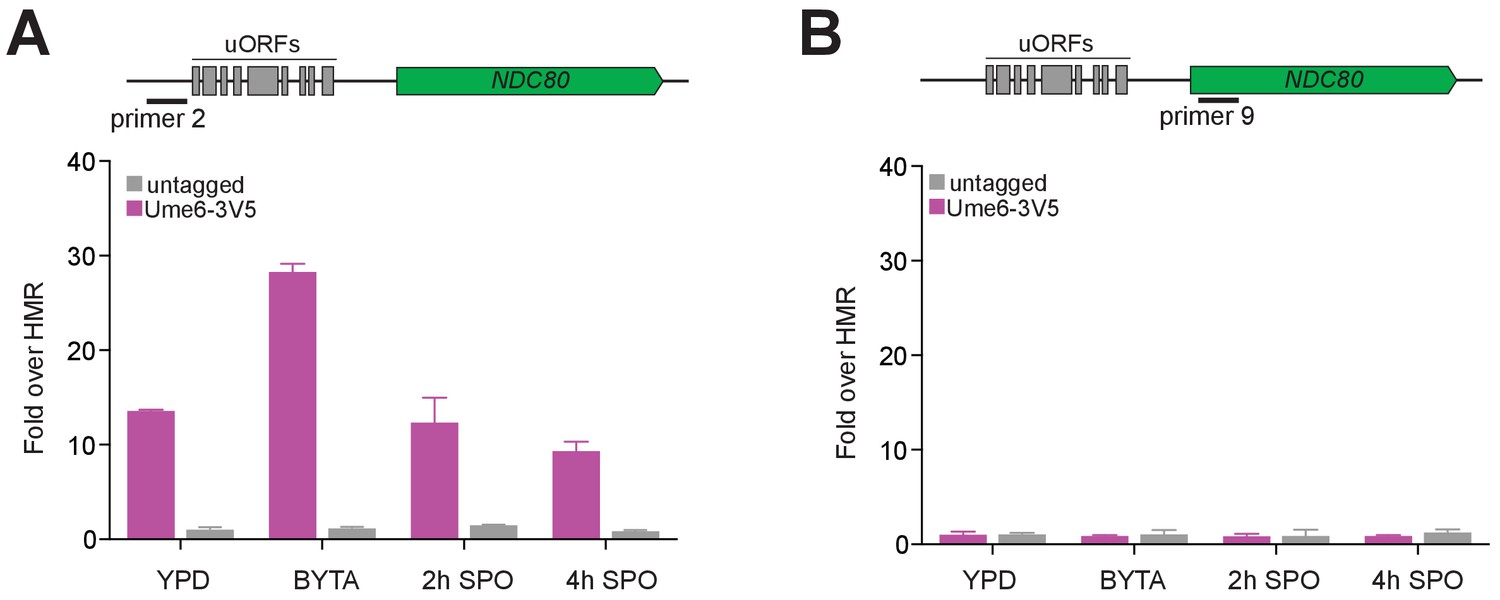
Ume6 is enriched at the NDC80luti promoter but not the NDC80 coding region before and during early meiosis.
Ume6-3V5 chromatin immunoprecipitation of untagged (FW1511) and Ume6-3V5 (FW1208) strains from samples collected during exponential growth in nutrient rich medium (YPD), during stationary phase in BYTA, and after transfer to SPO. The recovered DNA fragments from the Ume6-3V5 ChIP were quantified by qPCR using a primer set specific for the NDC80luti promoter (primer 2, shown in A) and the NDC80 coding region (primer 9, shown in B). Enrichment at these loci was normalized to signal from HMR, to which Ume6 does not bind. The mean fold enrichment over HMR from three independent experiments, as well as the standard error of the mean, is displayed.
Figure 6—figure supplement 3
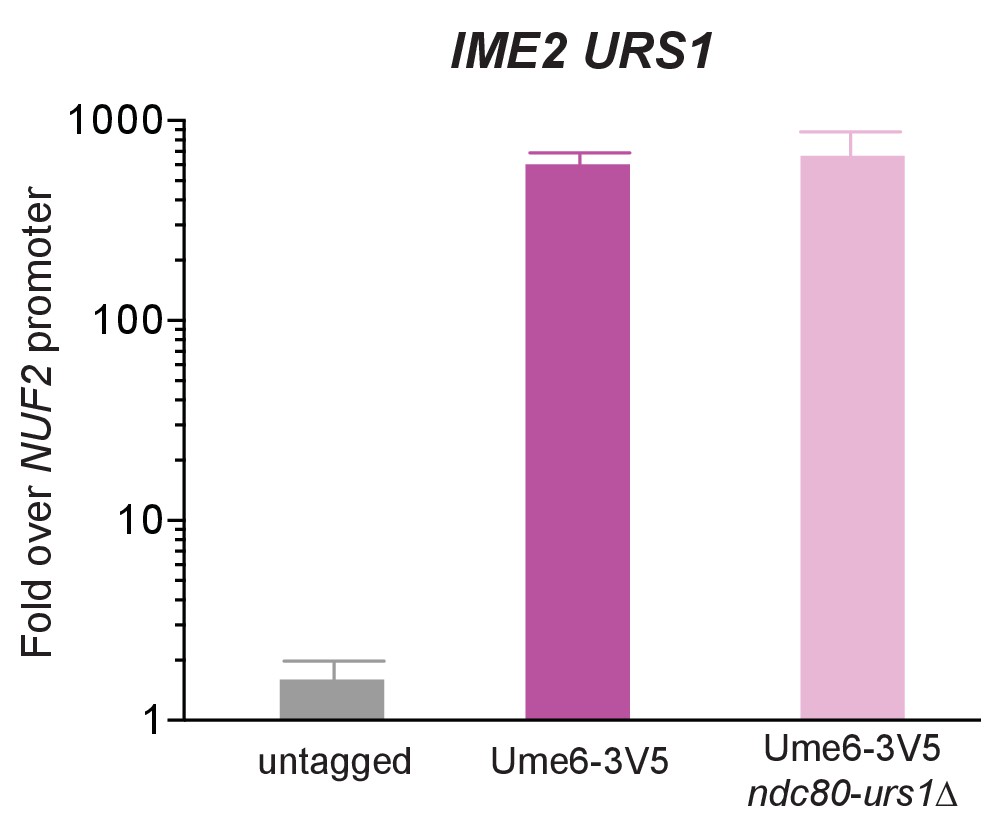
Deletion of the putative URS1 site upstream of NDC80 does not affect Ume6 enrichment on the IME2 promoter.
Ume6-3V5 chromatin immunoprecipitation of untagged (UB2531), Ume6-3V5 (UB3301), and Ume6-3V5 ndc80-urs1∆ (UB6760) strains. Cells were grown to saturation in BYTA and then harvested. The recovered DNA fragments from the Ume6-3V5 ChIP were quantified by qPCR using a primer pair specific for the IME2 URS1 site. Enrichment at these loci was normalized to signal from the NUF2 promoter, to which Ndt80 does not bind. The mean fold enrichment over the NUF2 promoter from three independent experiments, as well as the standard error of the mean, is displayed.
Figure 6—figure supplement 4
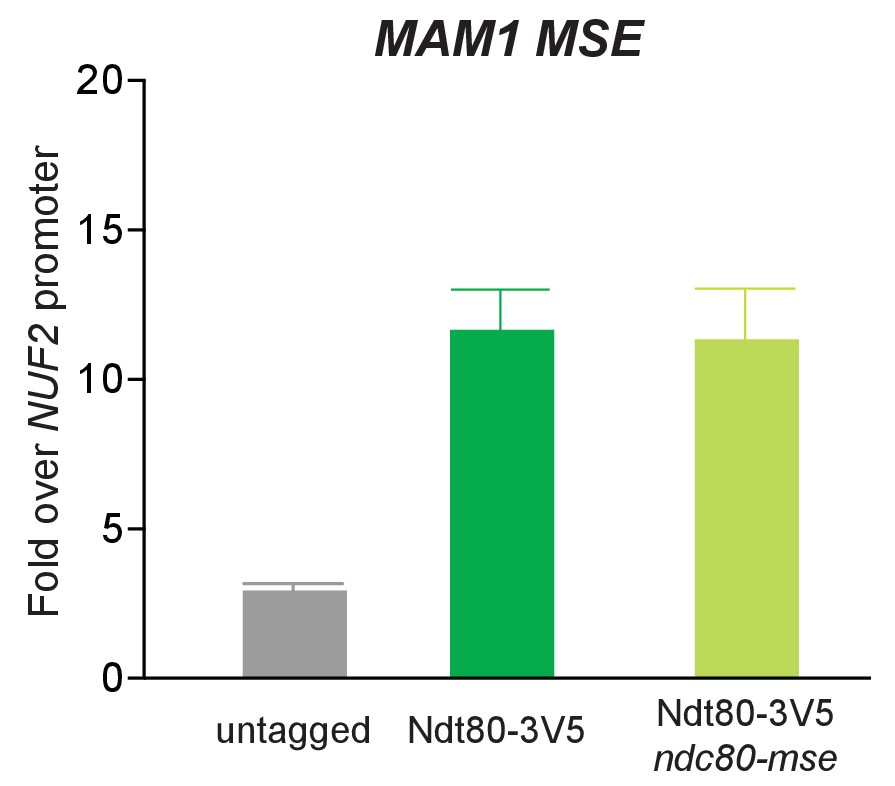
Deletion of the putative MSE site upstream of NDC80 does not affect Ndt80 enrichment on the MAM1 promoter.
Ndt80-3V5 chromatin immunoprecipitation of untagged (UB7997), Ndt80-3V5 (UB7999), and Ndt80-3V5 ndc80-mse strains (UB7496). 5 hr after the cells were transferred to SPO, NDT80 was induced by addition of β-estradiol, and 1 hr later, the cells were harvested. The recovered DNA fragments from the Ndt80-3V5 ChIP were quantified by qPCR using a primer pair specific for the MSE site of MAM1. Enrichment at these loci was normalized to signal from the NUF2 promoter, to which Ndt80 does not bind. The mean fold enrichment over the NUF2 promoter from three independent experiments, as well as the standard error of the mean, is displayed.
Figure 7 with 1 supplement
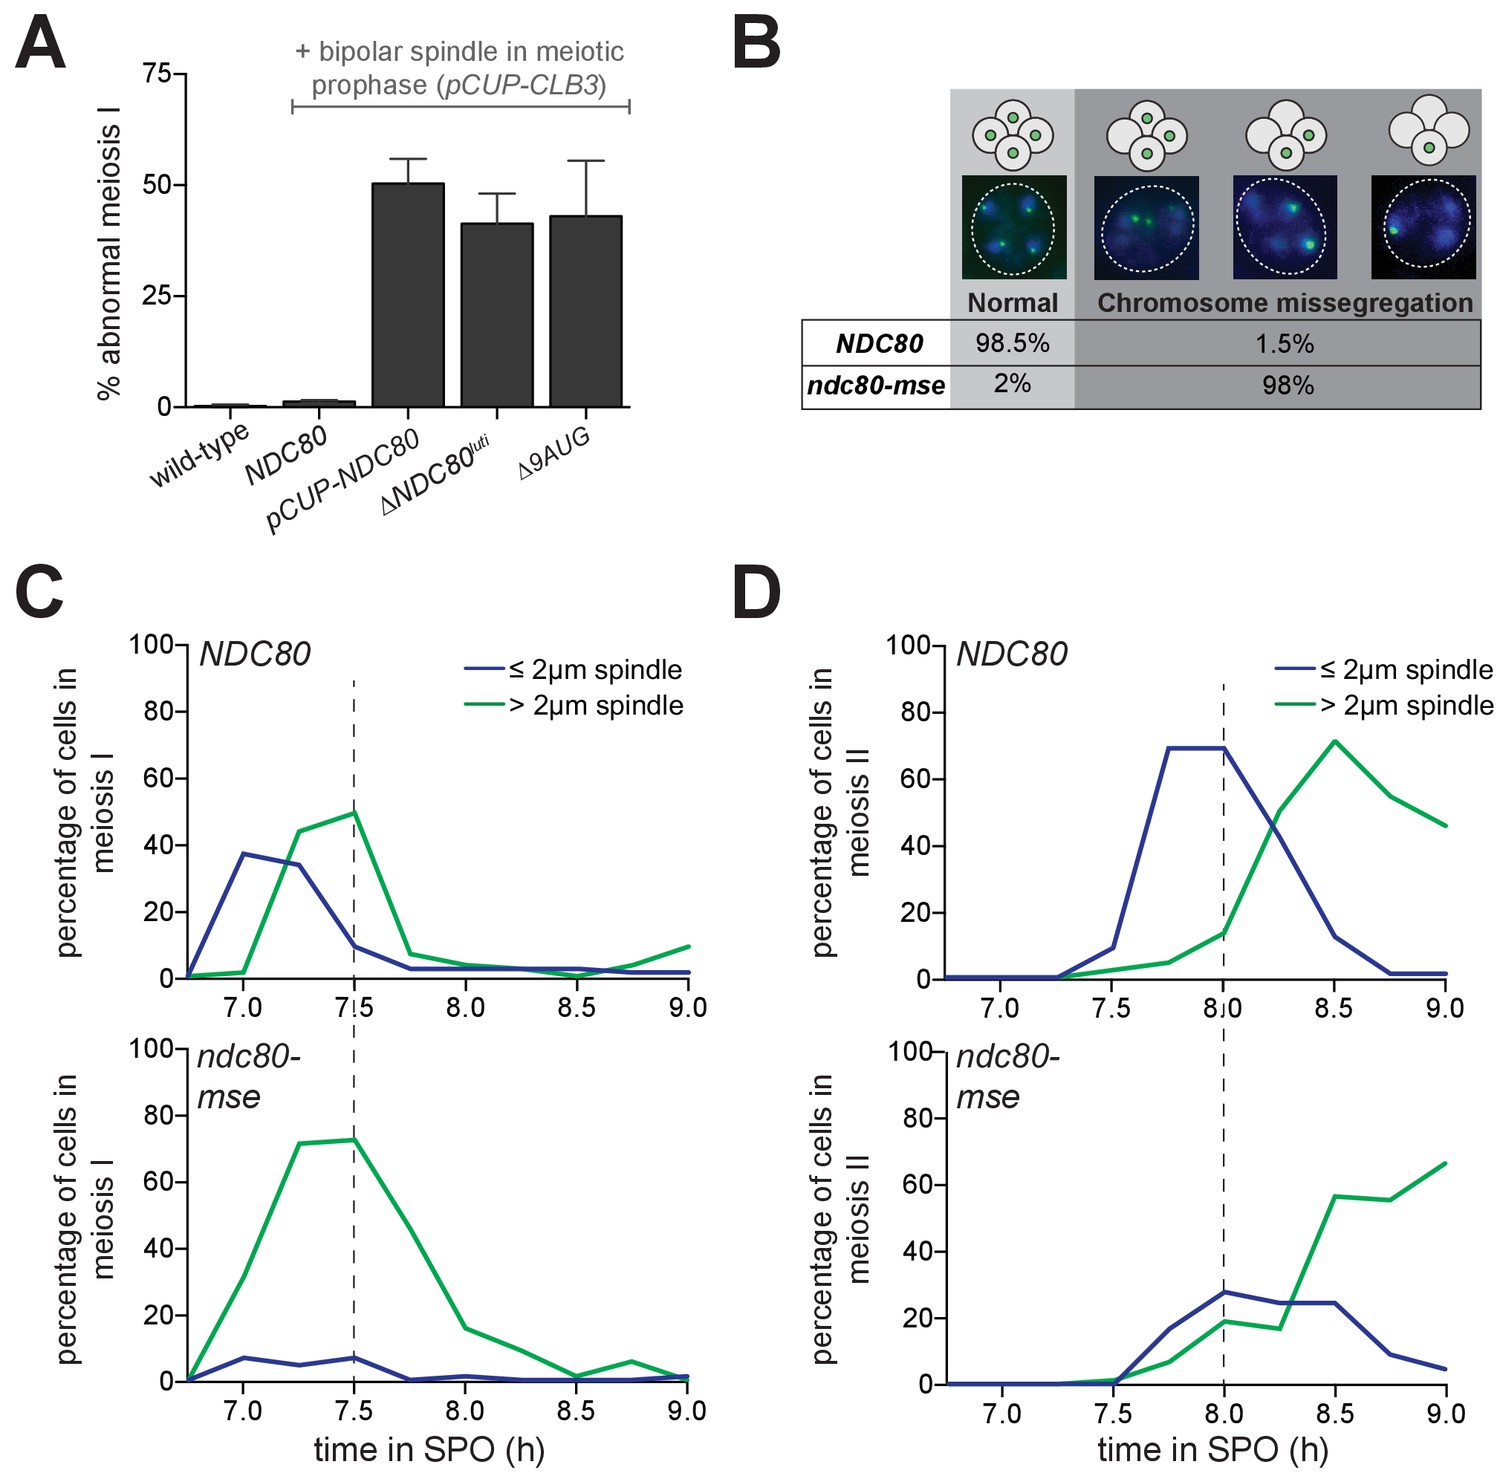
Temporal regulation of Ndc80 level by NDC80luti and NDC80ORF in meiosis is required for proper meiotic chromosome segregation.
(A) Sister chromatid segregation in wild type (UB2942), pCUP-CLB3 (UB877), pCUP-CLB3 pCUP-NDC80 (UB880), pCUP-CLB3 ∆NDC80luti (UB2940), and pCUP-CLB3 ∆9AUG (UB2936) cells. Cells were induced to sporulate by transferring to SPO, and 6 hr later, expression of the cyclin Clb3 was induced by addition of CuSO4. Immediately after induction, cells were released from pachytene by addition of β-estradiol. Samples were taken 1 hr 45 min after the release. Premature segregation of sister chromatids in meiosis I (abnormal meiosis I) was detected as two separated GFP dots in binucleates, one in each nucleus. The average fraction of binucleates that displayed sister segregation in meiosis I from three independent experiments, as well as the standard error of the mean, was graphed. 100 cells were counted per strain, per experiment. (B) Chromosome segregation accuracy in wild type (UB5876) and ndc80-mse (UB5437) strains was determined by counting homozygous CENV-GFP dots in tetranucleates. Samples were taken 7.5 hr after transfer to SPO when most cells had completed meiosis in an asynchronous system. The fraction of tetranucleates that displayed normal segregation (one GFP dot in each nucleus), or missegregation (multiple or zero GFP dots in any of the four nuclei) was quantified. The average fraction of normal segregation or missegregation from two independent experiments is shown. Over 100 cells were counted per strain, per experiment. (C–D) Percentage of wild type (UB4074) and ndc80-mse (UB3392) cells with meiosis I spindles (shown in C) or meiosis II spindles (shown in D) that were longer than 2 μm, as well as the percentage of cells with spindles that were shorter than 2 μm. Both strains harbor the pGAL-NDT80 GAL4-ER system. After 6 hr in SPO, the cells were released from pachytene by addition of β-estradiol, and samples were taken every 15 min after the release. Over 100 cells per time point were quantified, and the results of one representative repeat from two independent experiments are shown.
Figure 7—figure supplement 1
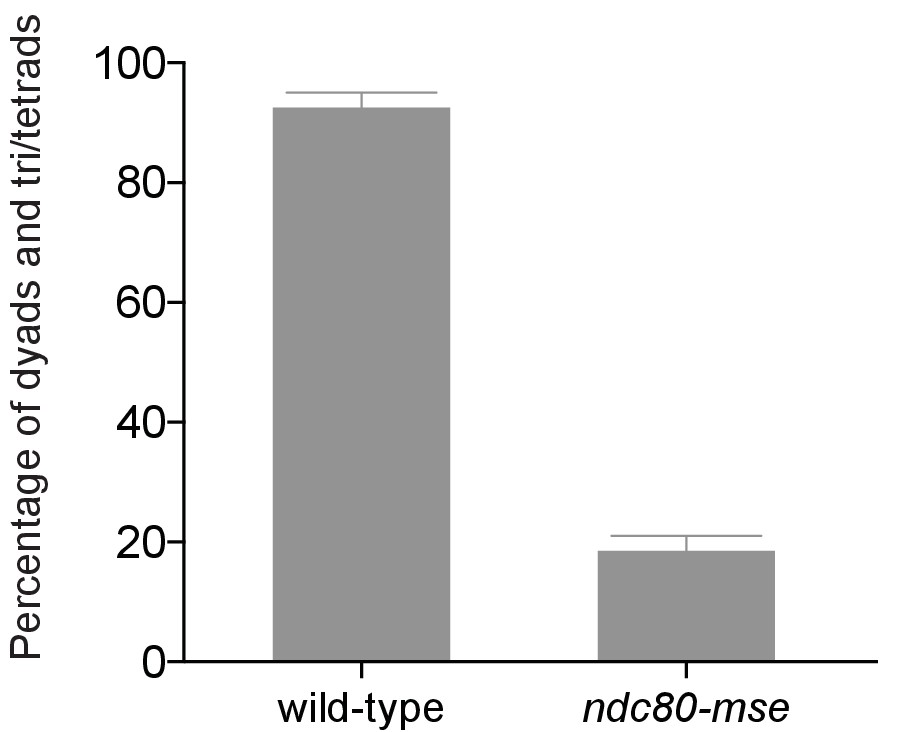
Mutation of the MSE site upstream of NDC80 prevents spore formation.
Spore formation (dyad, triads, and tetrads) in wild type (UB5876) and ndc80-mse (UB5437) strains after meiosis. The average fraction of spore formation in two independent experiments, as well as the range of the two repeats, is displayed.
Figure 8 with 1 supplement
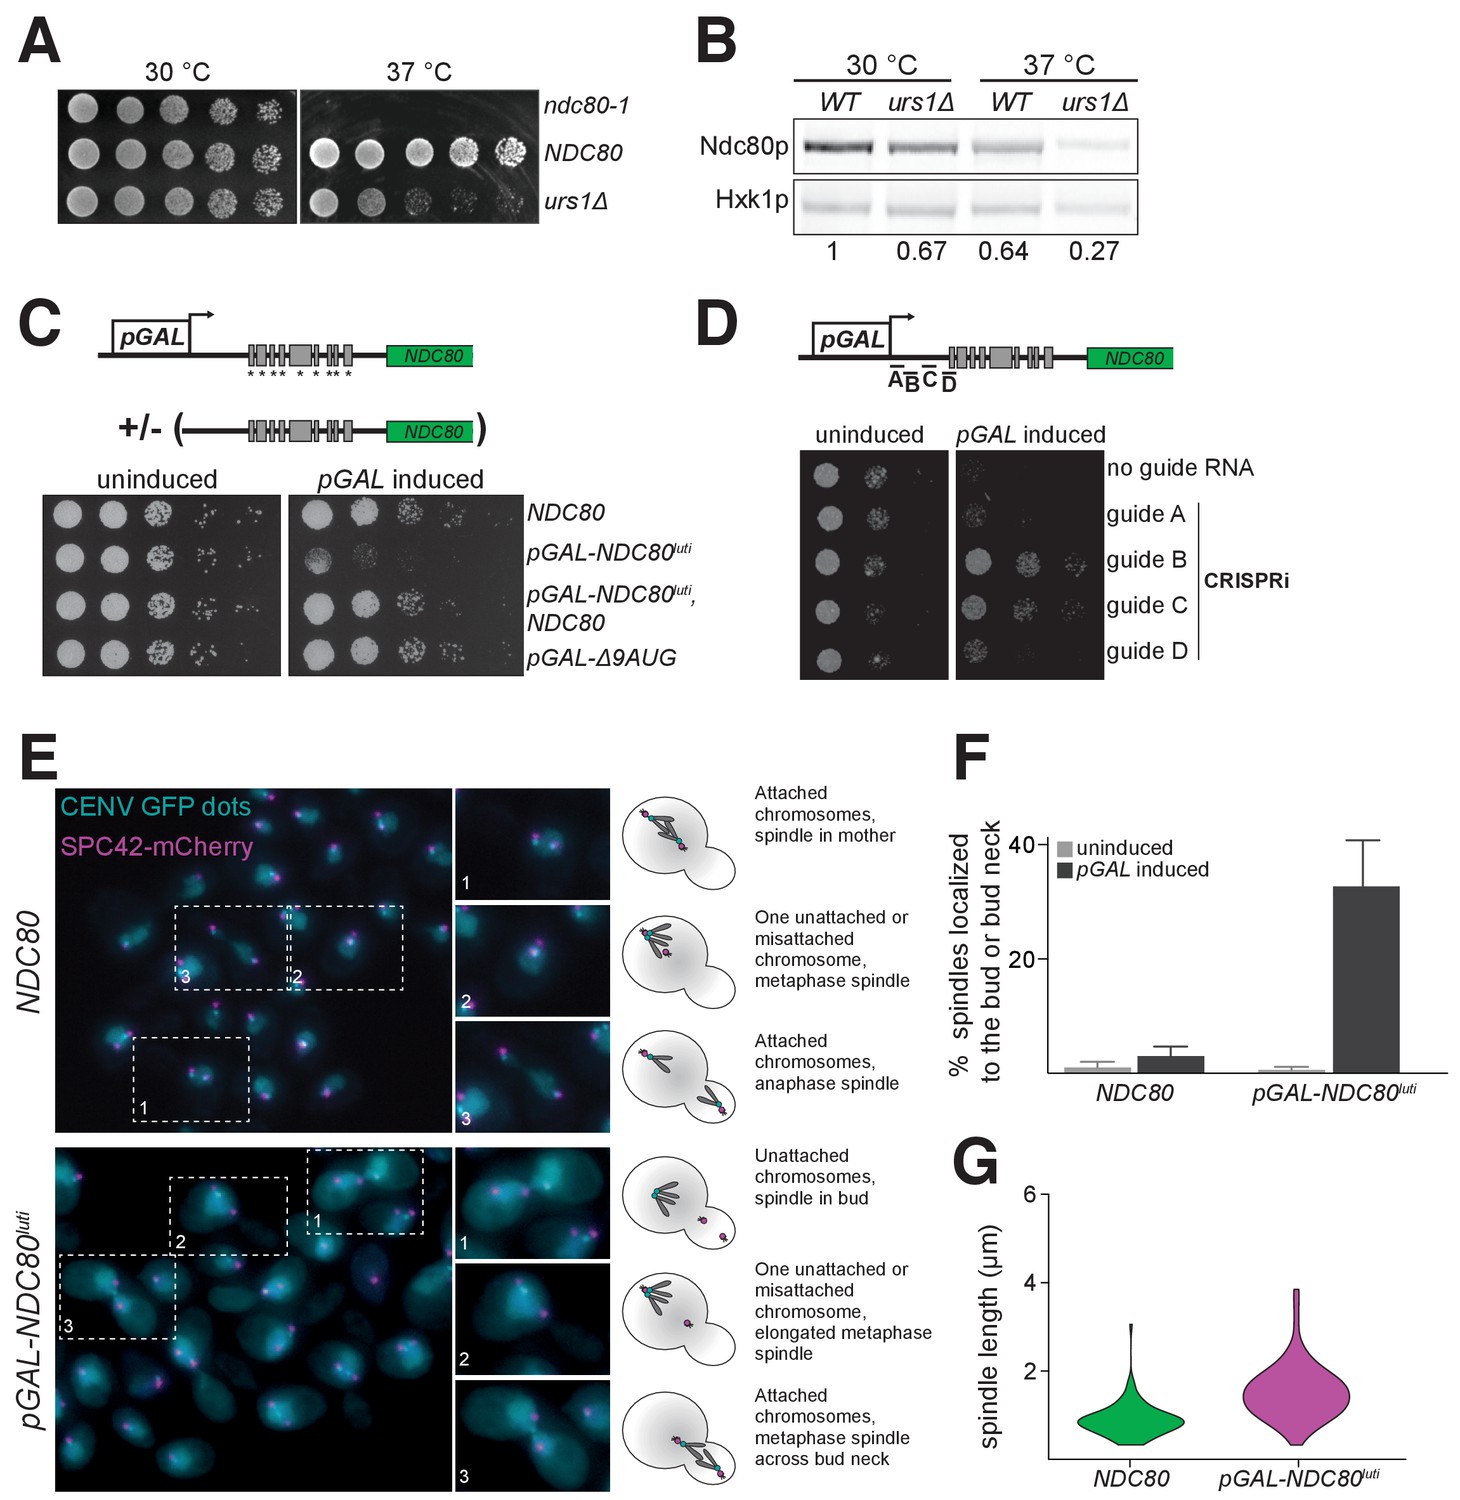
Misexpression of NDC80luti outside of meiosis causes severe growth defects due to kinetochore dysfunction.
(A) Growth phenotype of ndc80-urs1∆ cells at 30°C and 37°C. Temperature-sensitive ndc80-1 (UB494), wild type (UB3262), and urs1∆ (UB4212) cells were serially diluted and grown on nutrient rich medium (YPD) plates at 30°C or 37°C for 2 days. (B) Ndc80 level in wild type (UB3262) and urs1∆ (UB4212) cells grown at 30°C or 37°C. For each condition, equal OD600 of cells were taken, and Ndc80 was visualized by anti-V5 immunoblot. Hxk1, loading control. WT, wild type. The number under each lane is the ratio of the relative Ndc80 levels (normalized to Hxk1 levels) compared with that of wild type at 30°C. The results of one representative repeat from two independent experiments are shown. (C) Growth phenotype of haploid control (UB1240), pGAL-NDC80luti (UB1217), pGAL-NDC80luti with a second copy of NDC80 at the LEU2 locus (UB8001), and pGAL-∆9AUG (UB1323). Cells were serially diluted and grown on YEP-raffinose/galactose (YEP-RG) plates (uninduced) or YEP-RG plates supplemented with β-estradiol (pGAL induced) at 30°C for 2 days. (D) Growth phenotype of the pGAL-NDC80luti cells carrying a pGAL-inducible dCas9-Mxi1 and a vector for one of the following guide RNAs: gRNA A (UB6297), gRNA B (UB6299), gRNA C (UB6301), or gRNA D (UB6302). The control strain (UB6295) carries an empty vector. Cells were serially diluted and grown on SC –leu raffinose + galactose plates (uninduced) or SC –leu raffinose + galactose plates supplemented with β-estradiol (pGAL induced) at 30°C for 2 days. (E), (F), and (G) Phenotypic characterization of cells expressing pGAL-NDC80luti. Both the control (UB8682) and pGAL-NDC80luti (UB8684) cells harbor homozygous CENV-GFP dots and Spc42-mCherry (spindle pole body marker). The strains were grown overnight in YEP-RG, and samples were collected at 0 hr and 6 hr after pGAL induction by β-estradiol. (E) Representative images of wild type cells and the cells expressing NDC80luti after 6 hr of pGAL induction. Enlarged images of the boxed regions are shown in the middle. To the right are schematics of the microtubule-kinetochore attachment status in each class of phenotype observed. (F) Quantification of the spindle localization data shown in (E). Among the cells with separated spindle poles, the percentage of cells that had a spindle shorter than 2 µm and were abnormally localized (i.e. across the bud neck or entirely within the bud) is displayed. 100 cells were counted per strain, for each condition. The average percentage and the standard deviation from three independent experiments are shown. (G) Quantification of the spindle length in cells with at least one chromosome V not attached to a spindle pole body. Data from (E), specifically in cells with either both CENV-GFP dots associated with a single spindle pole or both CENV-GFP dots completely dissociated from either spindle pole. This allows analysis of populations of cells that are either in Sphase/early mitosis (after SPB duplication, but before chromosome alignment) or are unable to properly attach their chromosomes. A representative replicate out of three independent experiments was graphed as a violin plot. 100 cells were analyzed per strain, per replicate.
Figure 8—figure supplement 1
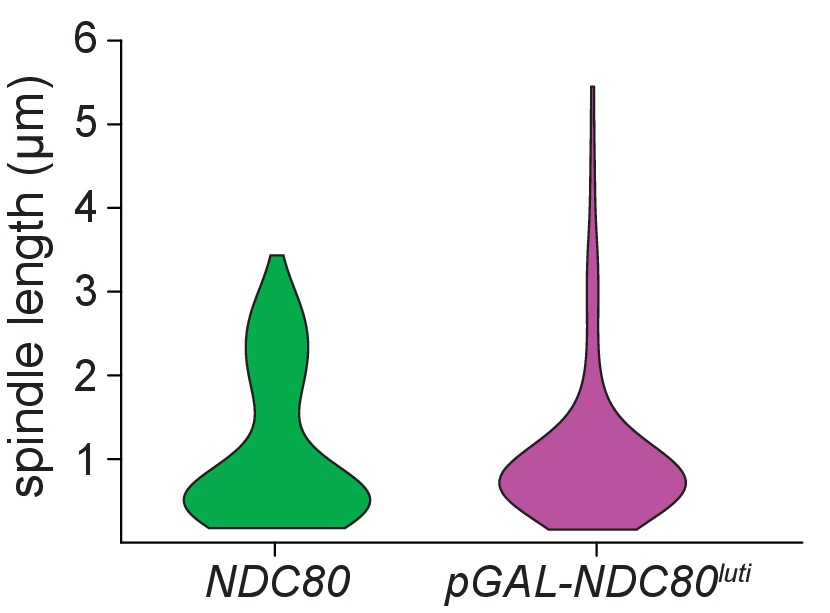
The distribution of spindle lengths in mitotic cells expressing NDC80luti indicates that cells arrest in metaphase.
Quantification of spindle length in control (UB8682) and pGAL-NDC80luti (UB8684) cells harboring Spc42-mCherry (spindle pole body marker). Cells were grown overnight in YEP-raffinose/galactose (YEP-RG). pGAL was induced with β-estradiol at time 0 hr. Spindle lengths were measured in all the cells with separated spindle poles. A representative replicate out of three independent experiments was graphed as a violin plot. 100 cells were analyzed per strain, per experimental replicative.
Figure 9 with 2 supplements

Model of NDC80 gene regulation in budding yeast.
During vegetative growth, a stage in which kinetochores are active, a short NDC80 mRNA isoform NDC80ORF is expressed, and the 5’ extended isoform NDC80luti is repressed by Ume6. Translation of NDC80ORF results in Ndc80 protein synthesis (top panel). At meiotic entry, the master transcription factor Ime1 induces expression of NDC80luti. Transcription from this distal NDC80luti promoter silences the proximal NDC80ORF promoter through a mechanism that increases H3K4me2 and H3K36me3 marks over the NDC80ORF promoter (See the accompanying paper Chia et al., for details). NDC80luti does not support Ndc80 synthesis due to translation of the uORFs. The overall synthesis of Ndc80 is repressed in meiotic prophase, and the kinetochores are inactive (middle panel). As cells enter the meiotic divisions, the transcription factor Ndt80 induces NDC80ORF re-expression, allowing for Ndc80 re-synthesis and formation of active kinetochores (bottom panel).
Figure 9—figure supplement 1
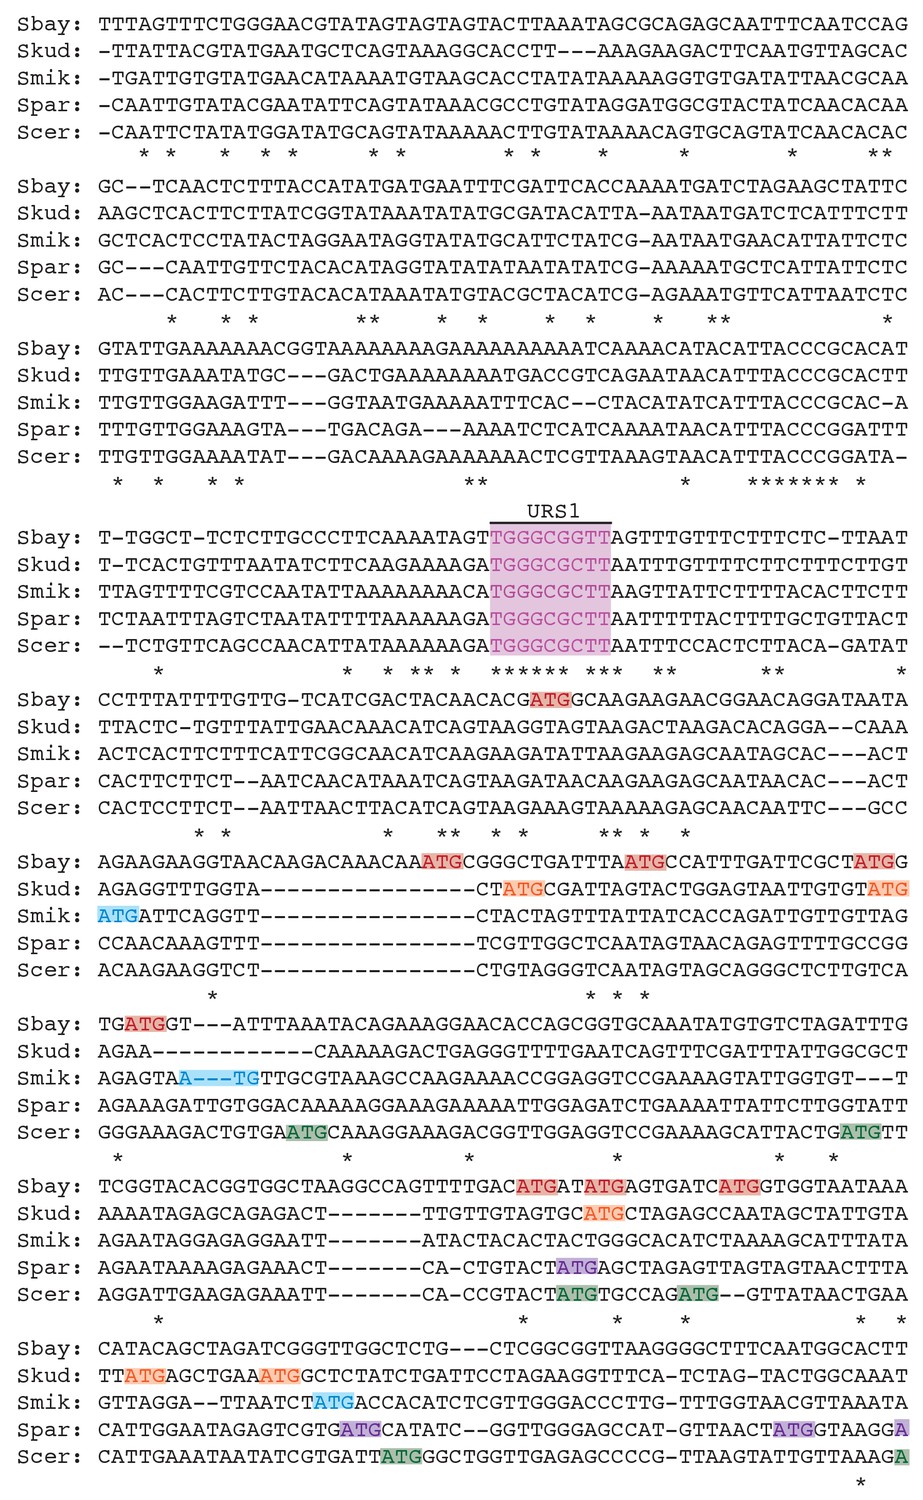
Clustal analysis for the upstream intergenic region of the NDC80 locus across five Saccharomyces species.
* indicates sequence identity; - indicates a skipped base pair. The displayed sequences are on the same strand as the NDC80 ORF sense strand, in 5’ to 3’ direction (from left to right). Figure 9—figure supplement 2 is a continuation of supplement 1. Putative Ume6 (URS1) and Ndt80 (MSE) binding sites are marked as pink and blue regions, respectively. Colored boxes (one color for each species) denote the putative upstream ATGs that locate at least 50 bp downstream of the URS1 site and up to the start of the NDC80 ORF. The number of putative AUG uORFs for each species is summarized in the table in Figure 9—figure supplement 2.
Figure 9—figure supplement 2
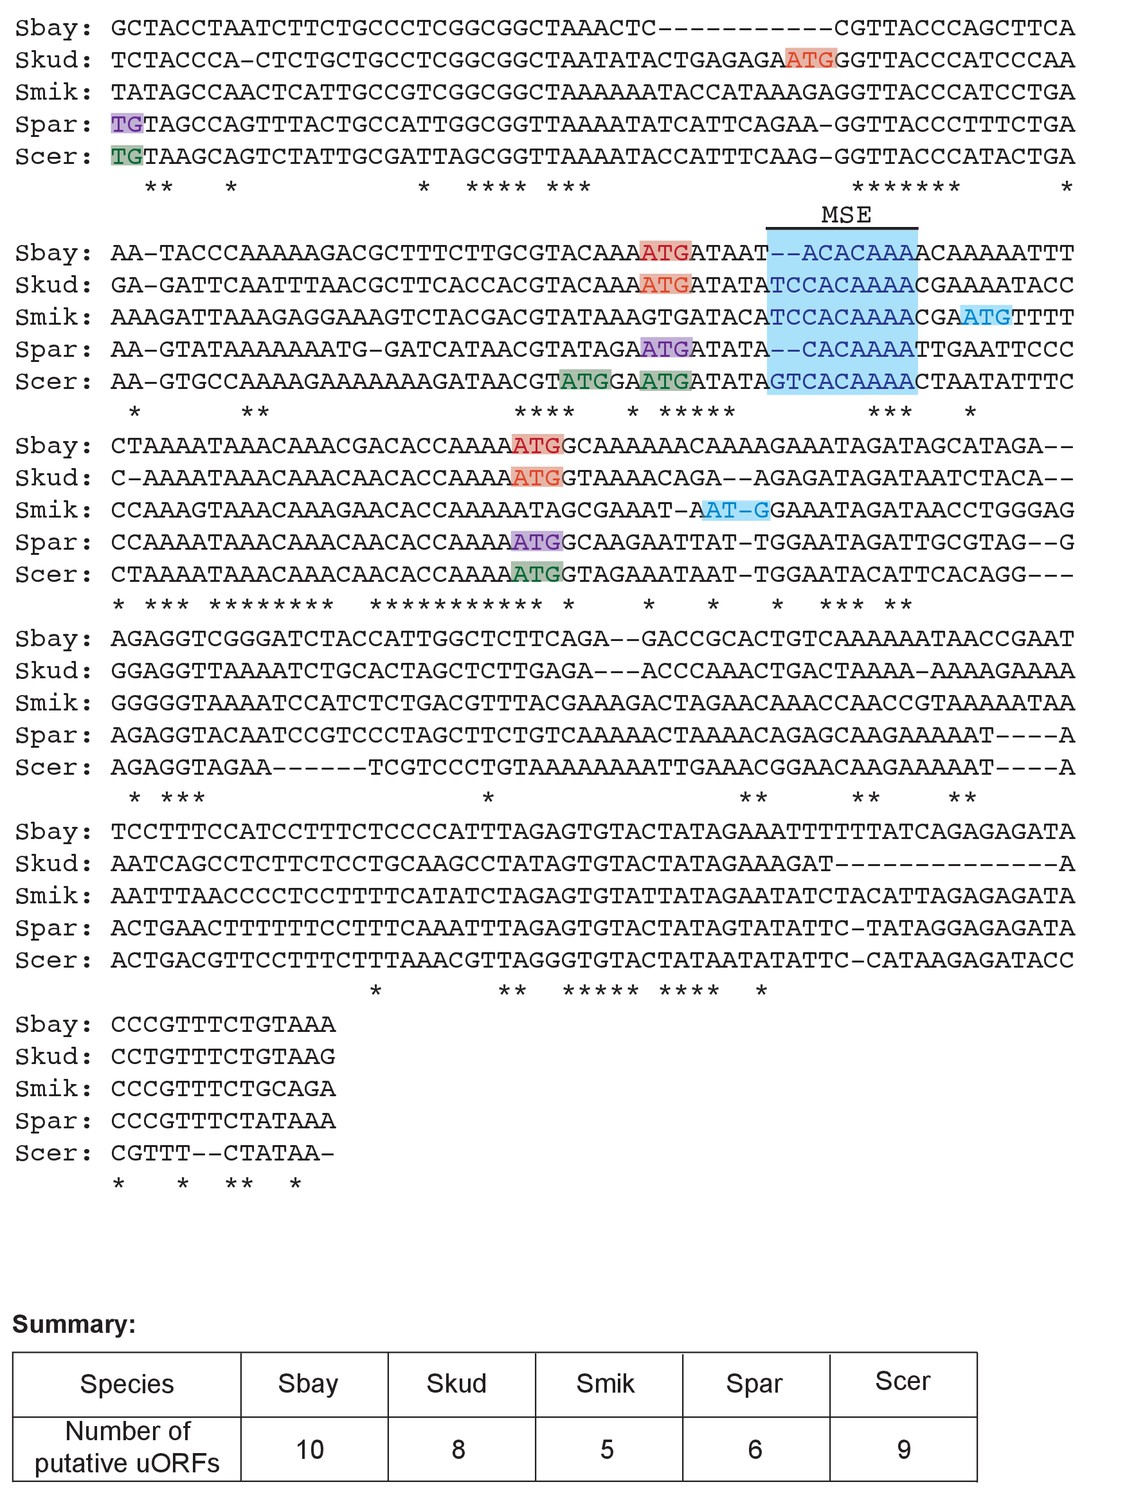
Clustal analysis for the upstream intergenic region of the NDC80 locus across five Saccharomyces species.
* indicates sequence identity; - indicates a skipped base pair. The displayed sequences are on the same strand as the NDC80 ORF sense strand, in 5’ to 3’ direction (from left to right). Figure 9—figure supplement 2 is a continuation of Figure 9—figure supplement 1. Putative Ndt80 (MSE) binding site is marked as a blue region. Colored boxes (one color for each species) denote the putative upstream ATGs that locate at least 50bp downstream of the URS1 site (pink region highlighted in Figure 9—figure supplement 1) and up to the start of the NDC80 ORF (end of the alignment). The number of putative AUG uORFs for each species is summarized in the table.
Author response image 1

Author response image 2
Author response image 3
Author response image 4
Author response image 5
Author response image 6

Author response image 7
Wild-type (UB3380) versus ∆9AUG (UB3683) cells were arrested in pachytene using the pGAL-NDT80GAL4-ER system.
Cells were transferred to SPO at 0 hour. High level of Ndc80 protein was observed even in the absence of GAL induction.
Additional files
-
Supplementary file 1
(A) Detailed genotypes for the strains used in this study. (B) Primers used for strain construction in this study. (C) Plasmids used for strain construction in this study. (D) Primers used for quantitative PCR and northern blotting in this study. (E) smFISH oligonucleotide probes used in this study. The NDC80ORF (Q 670) probe set consists of a mixture of thirty 20-mer oligonucleotide probes that tile the common region shared between NDC80luti and NDC80ORF. Each individual probe is labeled with the Quasar 670 dye. The NDC80Long (CF 590) probe set consists of a mixture of twenty 20-mer oligonucleotide probes that tile the unique 5’ region of NDC80luti. Each individual probe is labeled with the CAL Fluor Red 590 dye. smFISH oligonucleotide probes used in this study. The NDC80Odd (CF 590) probe set consists of a mixture of twenty-seven 20-mer oligonucleotide probes that tile NDC80ORF. Each individual probe is labeled with the CAL Fluor Red 590 dye. The NDC80Even (Q 670) probe set consists of a mixture of twenty-seven 20-mer oligonucleotide probes that tile NDC80ORF. Each individual probe is labeled with the Quasar 670 dye. (F) Summarized smFISH results for this study. (G) Predicted peptide sequences for the putative AUG uORFs.
- https://doi.org/10.7554/eLife.27417.033
-
Transparent reporting form
- https://doi.org/10.7554/eLife.27417.034
Download links
A two-part list of links to download the article, or parts of the article, in various formats.
Downloads (link to download the article as PDF)
Open citations (links to open the citations from this article in various online reference manager services)
Cite this article (links to download the citations from this article in formats compatible with various reference manager tools)
Kinetochore inactivation by expression of a repressive mRNA
eLife 6:e27417.
https://doi.org/10.7554/eLife.27417


