Structure and in situ organisation of the Pyrococcus furiosus archaellum machinery
- Max Planck Institute of Biophysics, Germany
- University of Exeter, United Kingdom
- University of Regensburg, Germany
- University of Freiburg, Germany
Figures
Figure 1 with 3 supplements
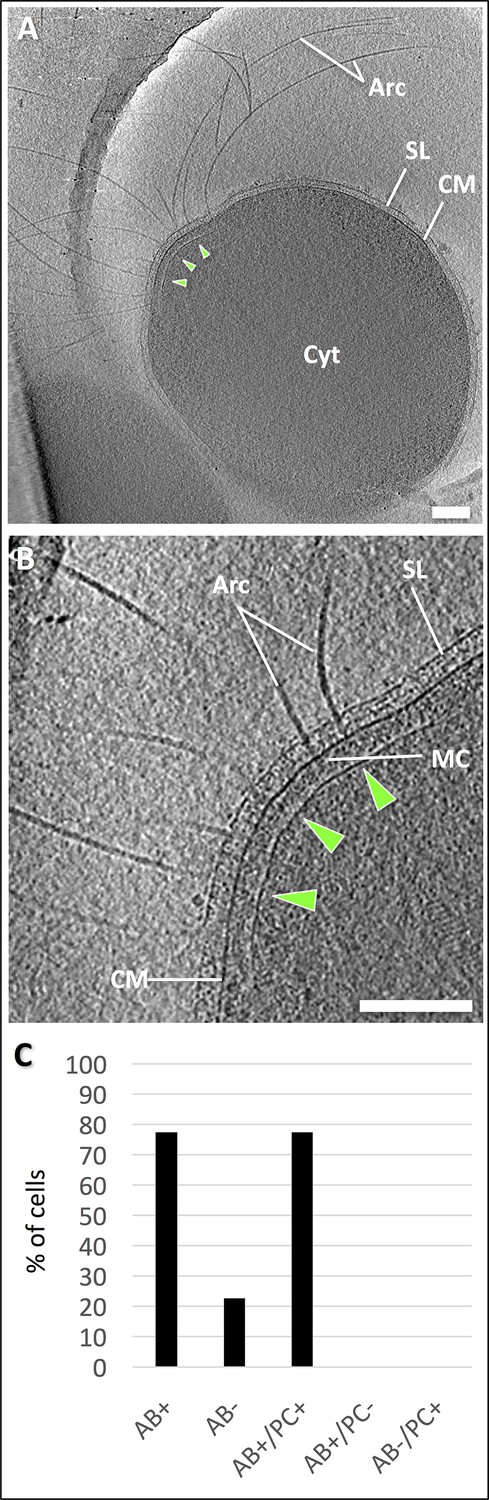
Electron cryo-tomography of P. furiosus.
(A) tomographic slice through a frozen-hydrated P. furiosus cell. Arc, archaella; SL, S-layer; CM, cell membrane; Cyt, cytosol; green arrowheads, polar cap. (B) close-up of the tomogram in A, showing archaella on the cell pole. MC, motor complex. Scale bars, 200 nm. (C) percentage of total archaellar bundles observed as well as archaellar bundles observed with and without a polar cap.
Figure 1—figure supplement 1
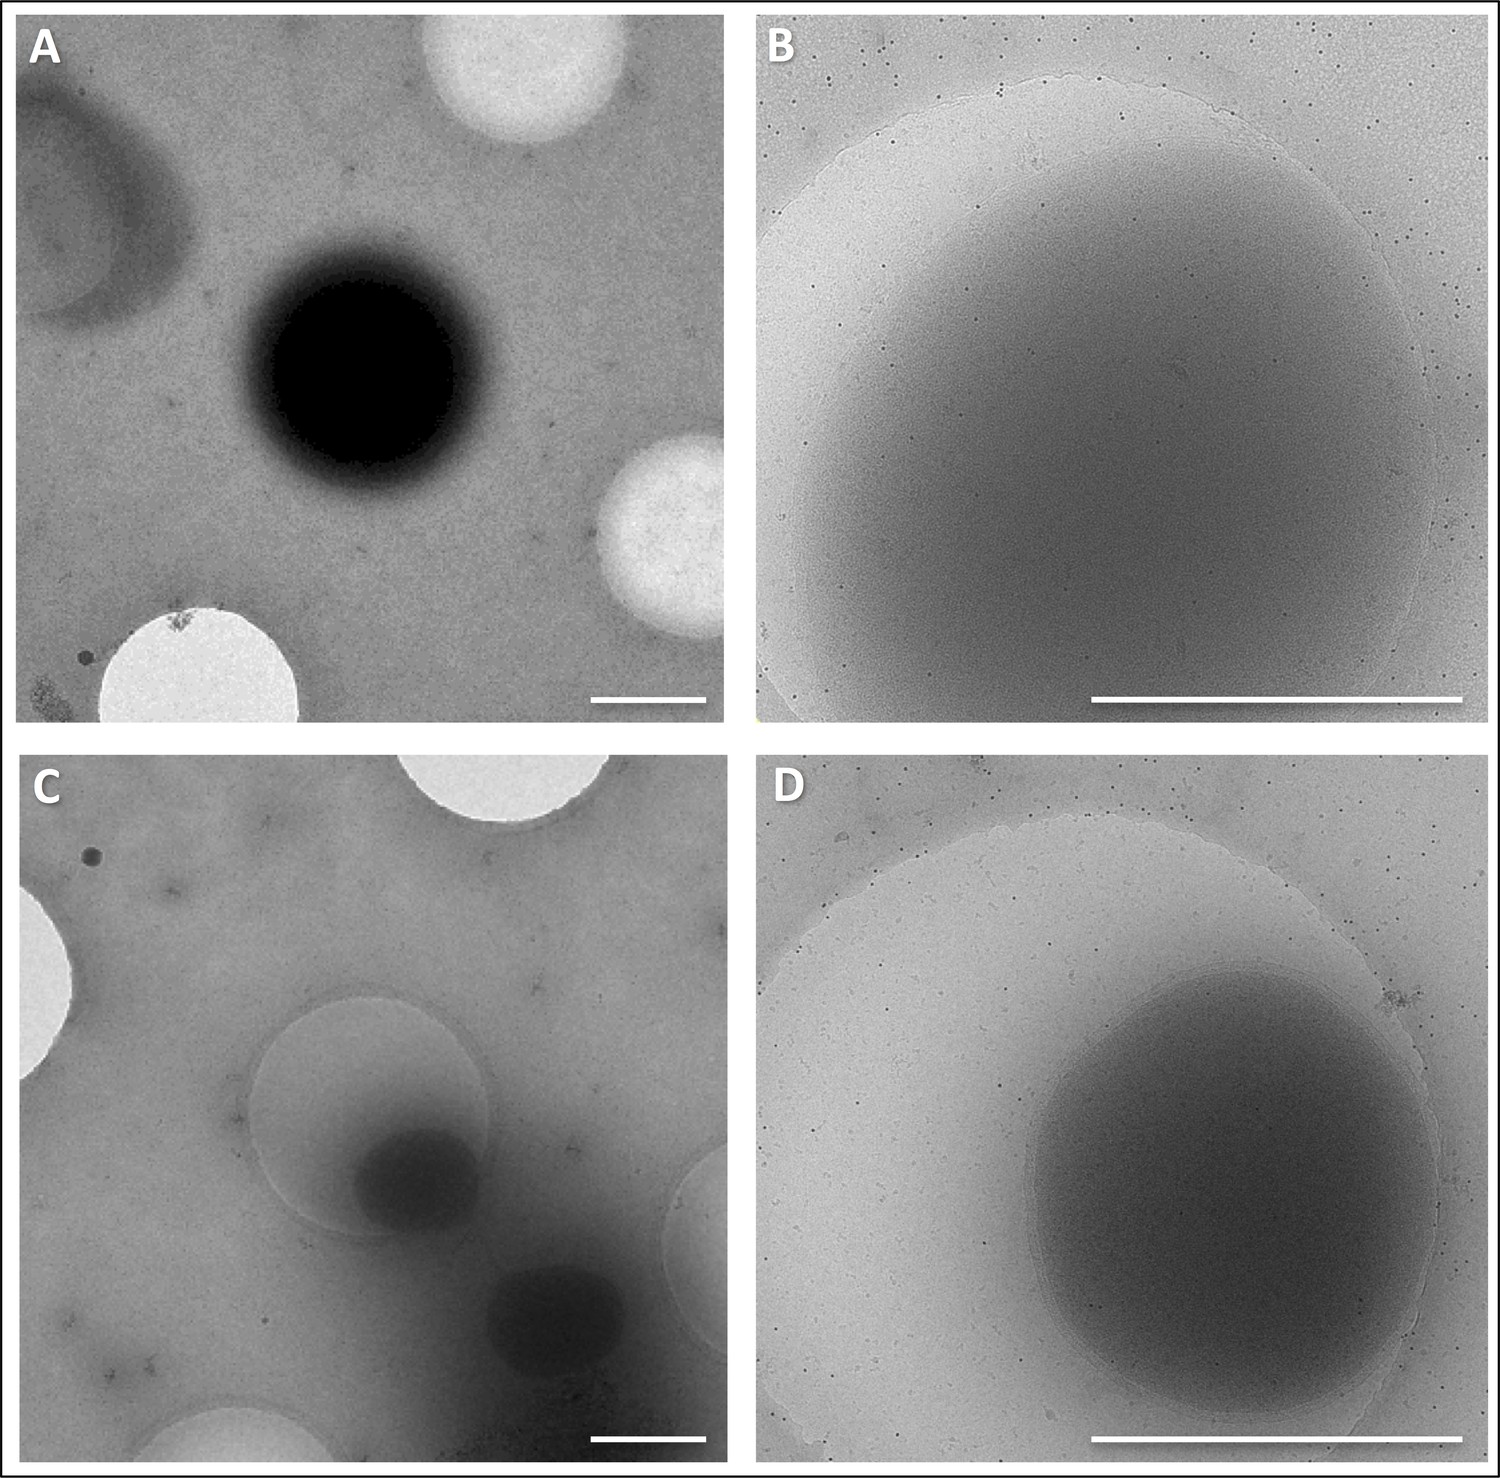
CryoEM of P. furiosus grown in full medium vs. pyruvate minimal medium.
(A and B) cells grown in full medium at 5,600 x (A) and 41,000 x magnification (B). (C and D), cells grown in pyruvate minimal medium at 5,600 x (C) and 41,000 x magnification (D). Scale bars, 1 μm.
Figure 1—figure supplement 2
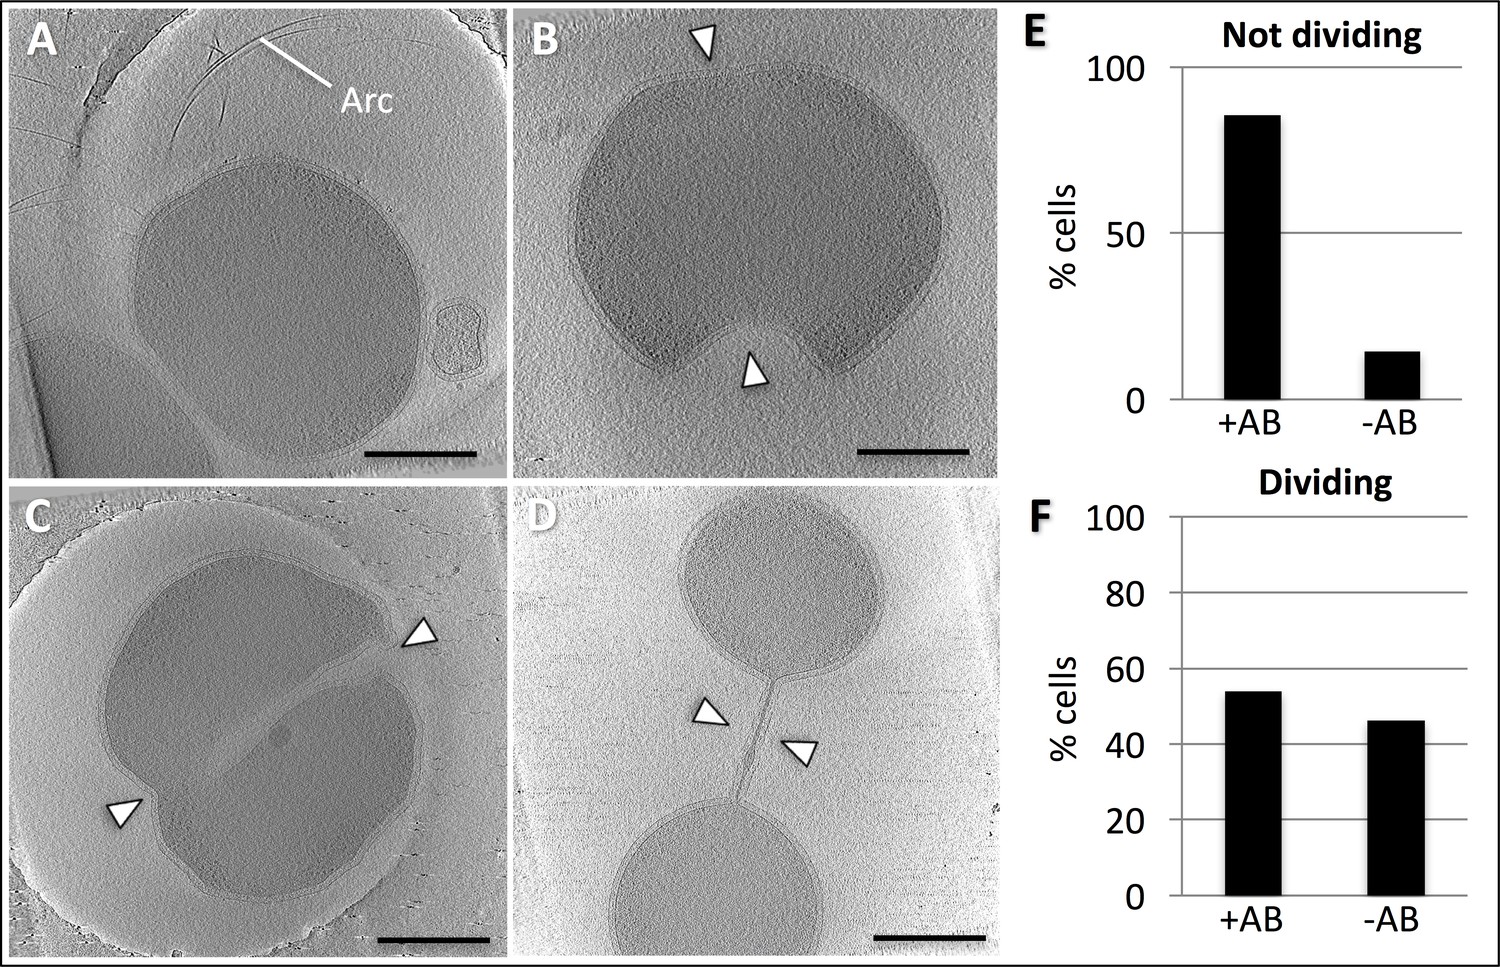
Tomographic slices of P. furiosus in different putative division states.
(A) non-dividing (i.e. just divided); (B), early division; (C), intermediate division state; (D), late division state. Arc, archaella. Arrowheads indicate invagination. (E,F), frequency of observed archaella in dividing (E) and non-dividing (F) cells. Scale bars, 500 nm.
Figure 1—figure supplement 3
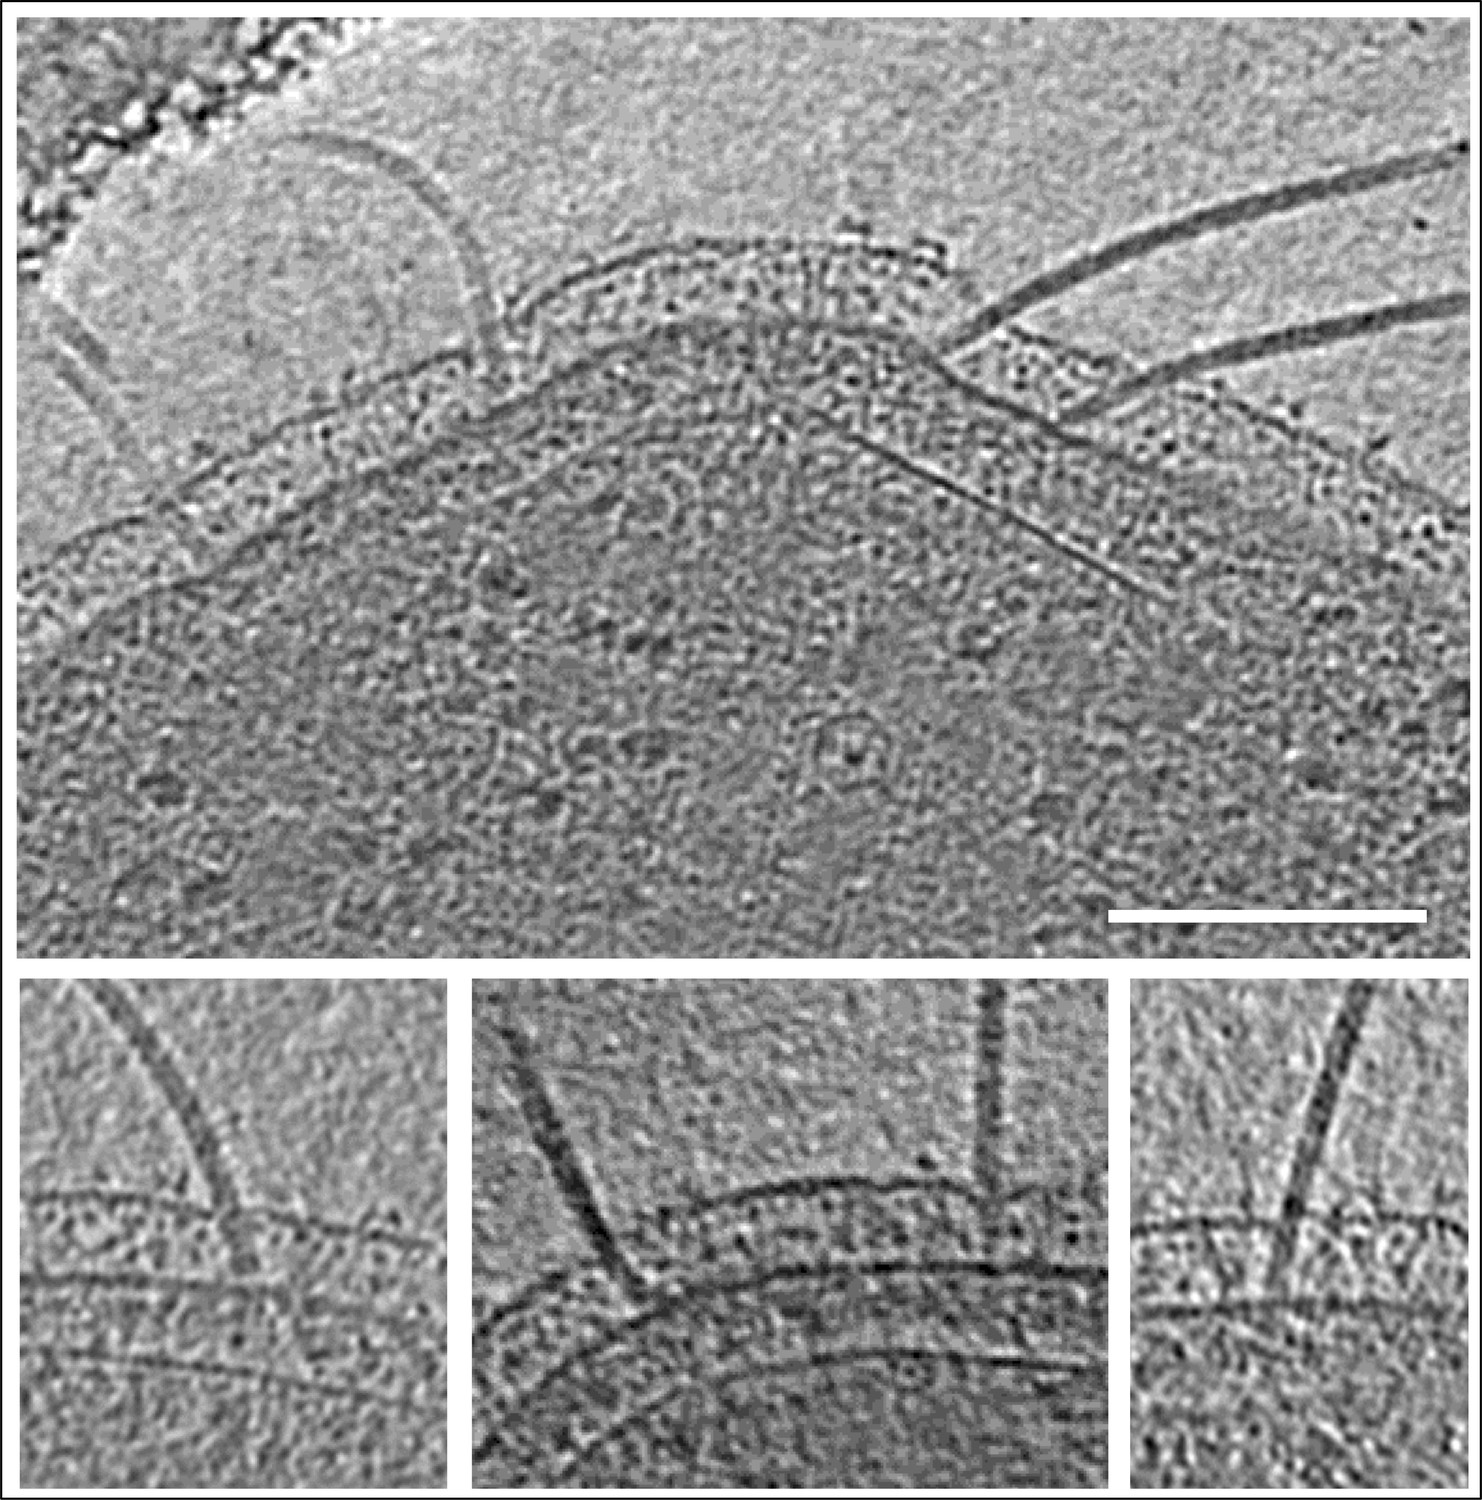
Angular freedom of archaella in the periplasm.
Panels show different close-ups of slices though tomograms of frozen-hydrated P. furiosus cells. Scale bar, 100 nm.
Figure 2 with 2 supplements
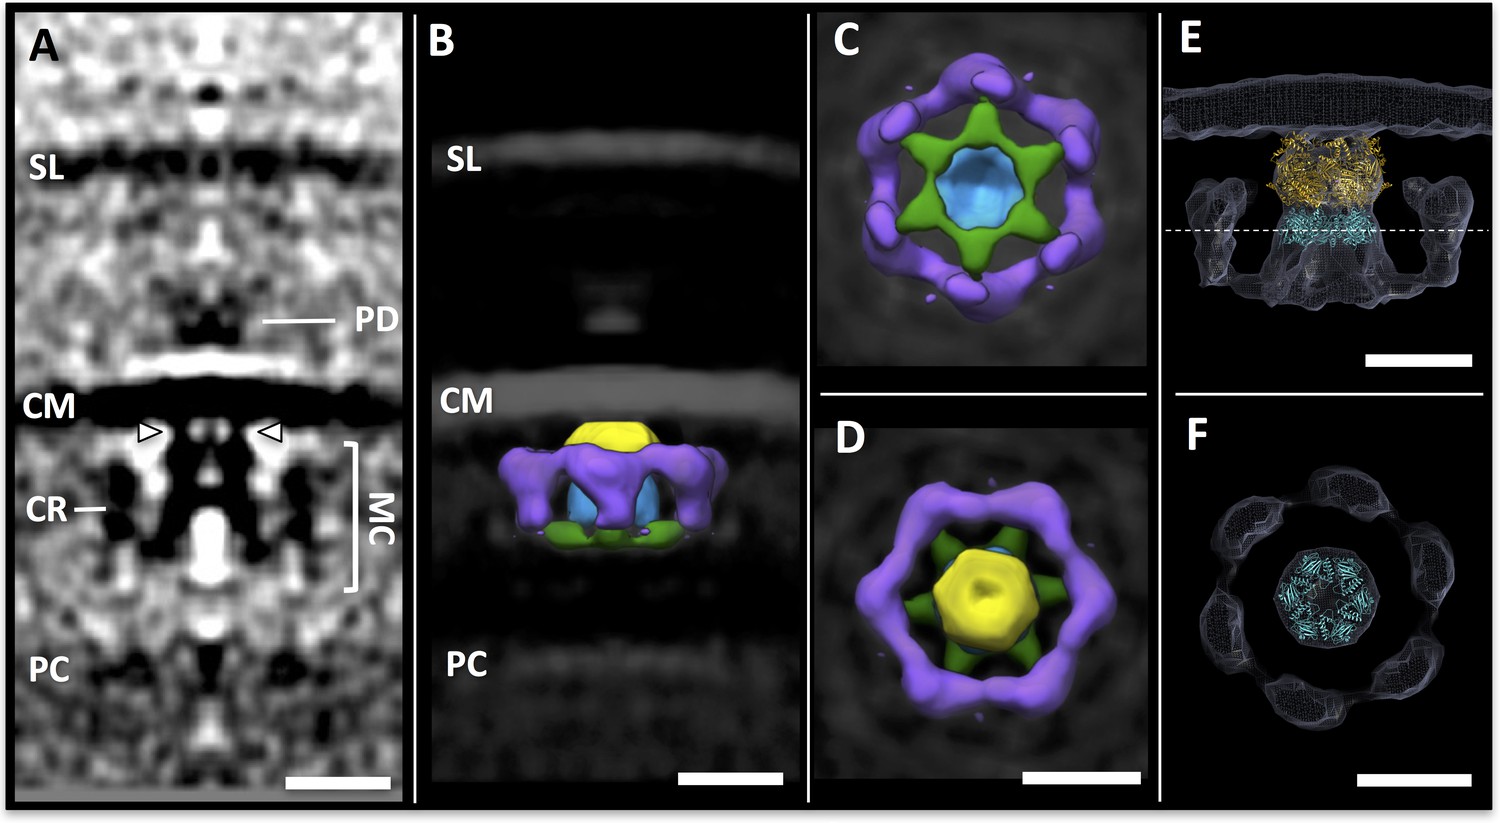
Sub-tomogram averaging of the archaellar motor complex.
(A) tomographic slice through the sub-tomogram average of the motor complex. SL, S-layer; PD; periplasmic densities; CM, cell membrane; MC, motor complex; CR, cytosolic ring; PC, polar cap. Arrowheads indicate two of six narrow connections between MC and CM. (B–D) segmented 3D surface representation of the sub-tomogram average of the MC (multiple colours) as seen from the side (B), the cytosol (C) and the cell membrane (D). Yellow, blue, green, central complex; purple, cytosolic ring. (E,F) S. acidocaldarius FlaI (PDB-4IHQ, gold) and Symmdoc model of S. acidocaldarius FlaH (PDB-4YDS, cyan) fitted into the MAC density in side view (E) and in cross-section through FlaH (F); position of cross-section shown as dotted line in E. Scale bars, 20 nm.
Figure 2—figure supplement 1
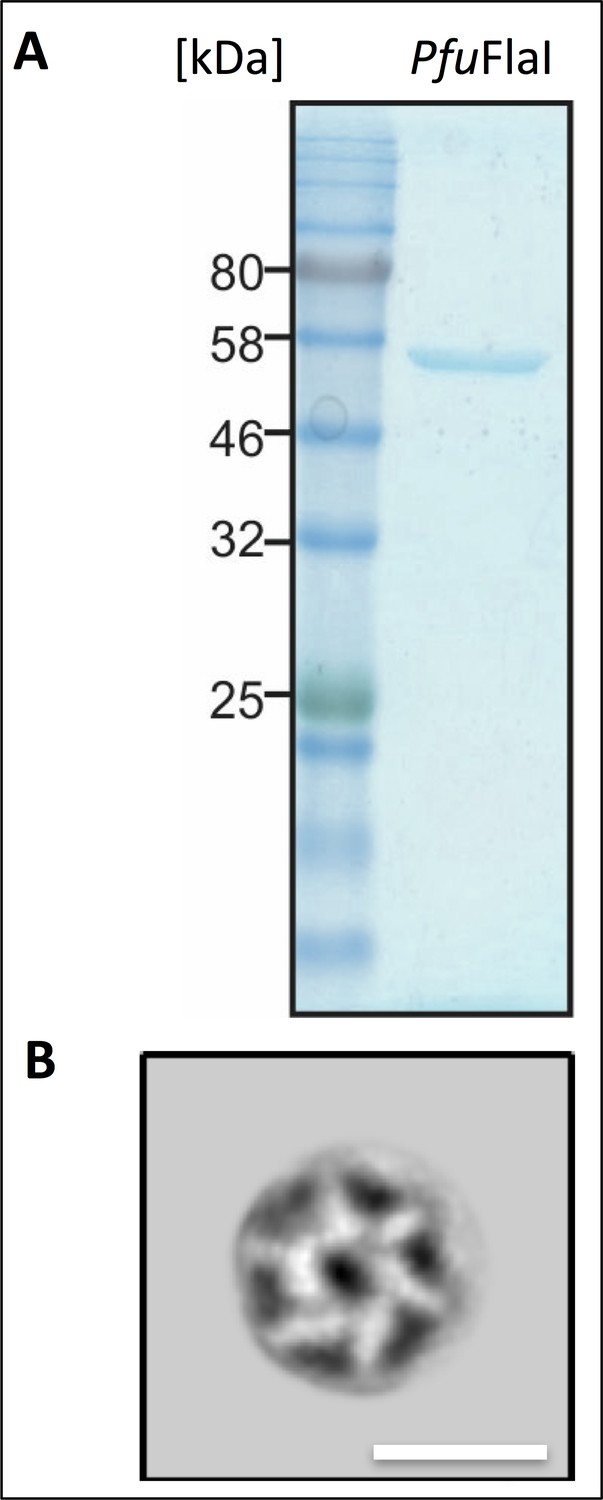
Purification and negative stain EM of P. furiosus FlaI.
(A) SDS gel of FlaI peak fraction after gel filtration chromatography. Stained with Coomassie Brilliant Blue. Marker: Thyroglobulin (669 kDa), γ globulin (158 kDa), ovalbumin (44 kDa), myoglobin (17 kDa) and vitamin B12 (1.35 kDa). (B) projection map obtained from 2D classification of negatively stained FlaI. Note that protein density is white. Scale bar, 15 nm.
Figure 2—figure supplement 2
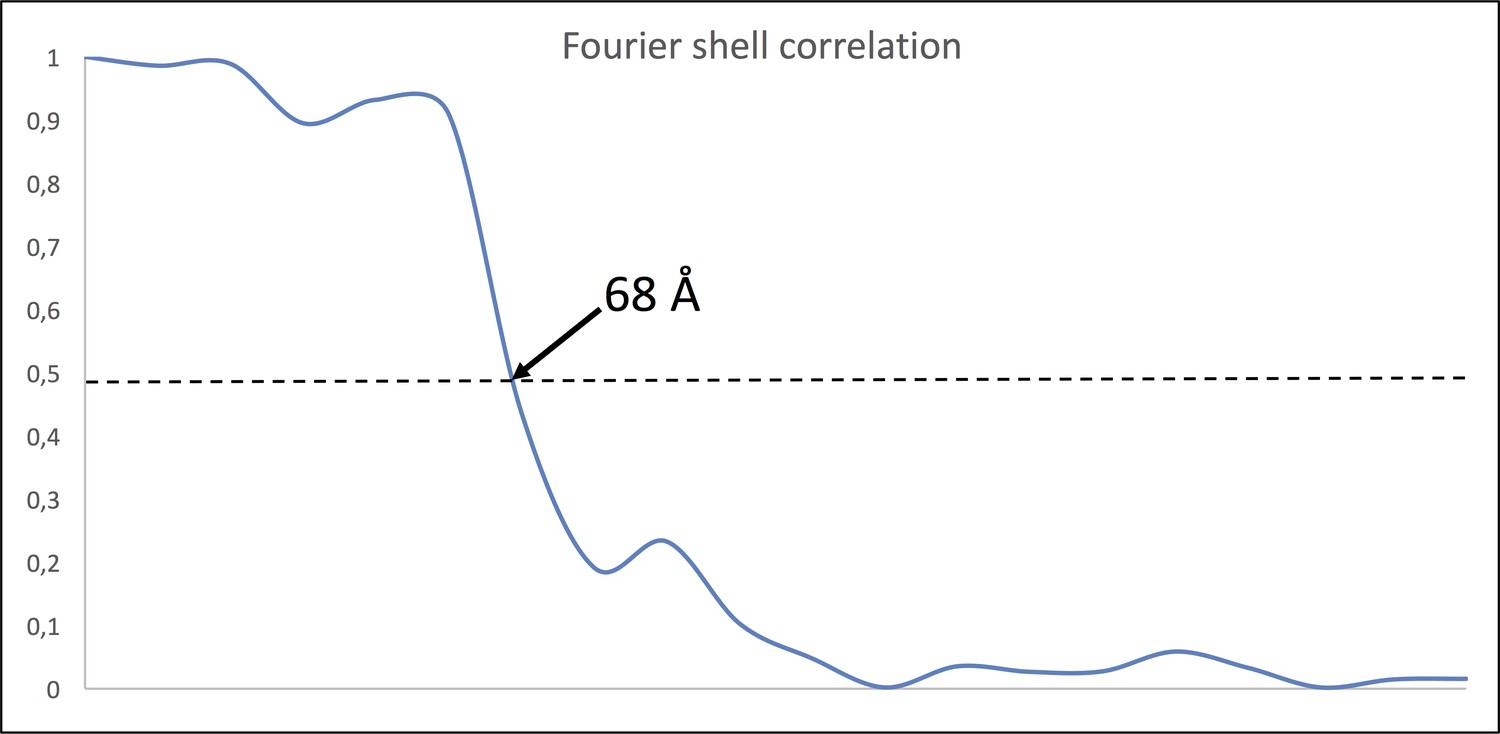
Fourier Shell Correlation (FSC) of MC sub-tomogram average.
FSC of two half maps of 2,274 (379 × 6) particles indicates a resolution of ~68 Å using the 0.5 criterion.
Figure 3 with 1 supplement
The P. furiosus S-layer.
(A–C) sub-tomogram averaging of the P. furiosus S-layer as tomographic slice (A), segmented 3D surface representation with asymmetric units in different colours (B) and one subunit replaced by a 3D surface-rendered sub-tomogram of a P. furiosus archaellum (C; purple, S-layer; light blue, archaellum). Scale bars, 20 nm.
Figure 3—figure supplement 1
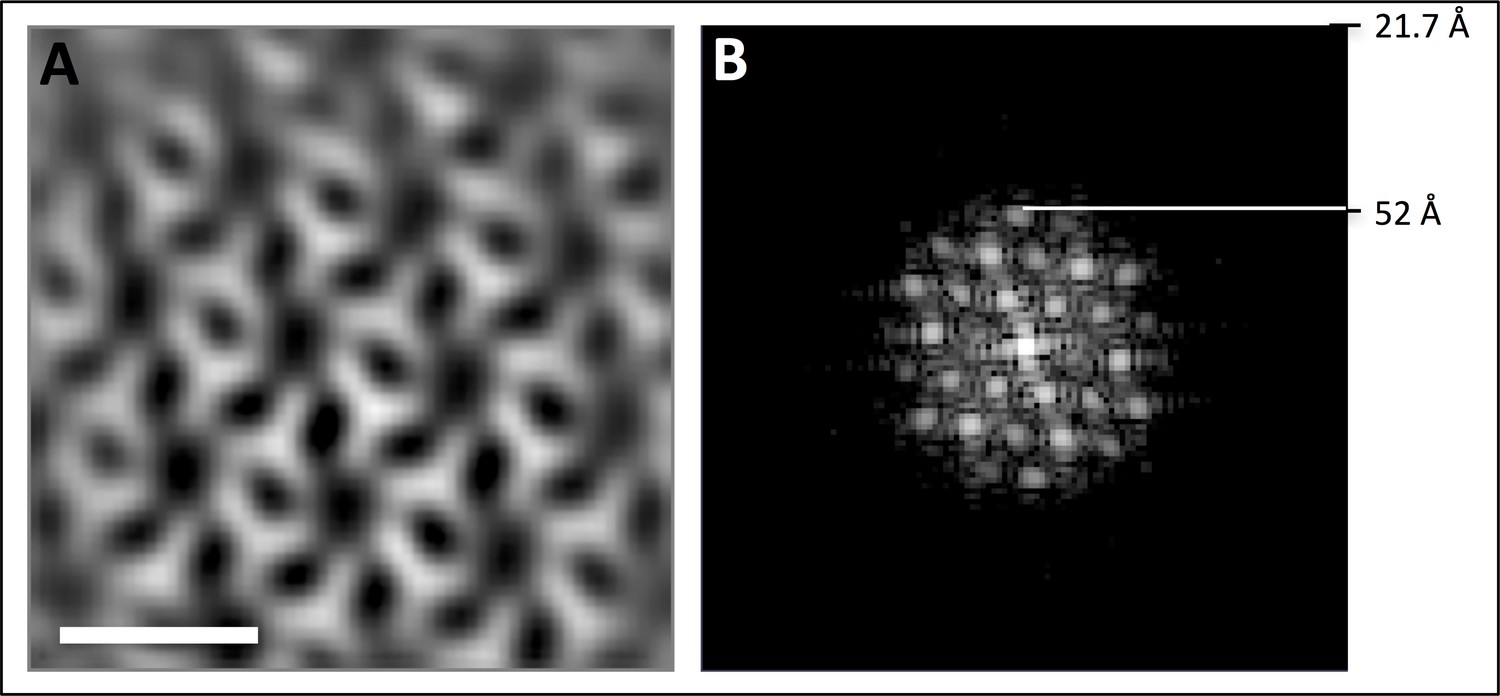
- Resolution estimate of P. furiosus S-layer sub-tomogram average.
(A) tomographic slice through S-layer average. (B) power spectrum of A showing diffraction up to 52 Å. Nyquist at 21.7 Å. Scale bar, 20 nm.
Figure 4 with 1 supplement
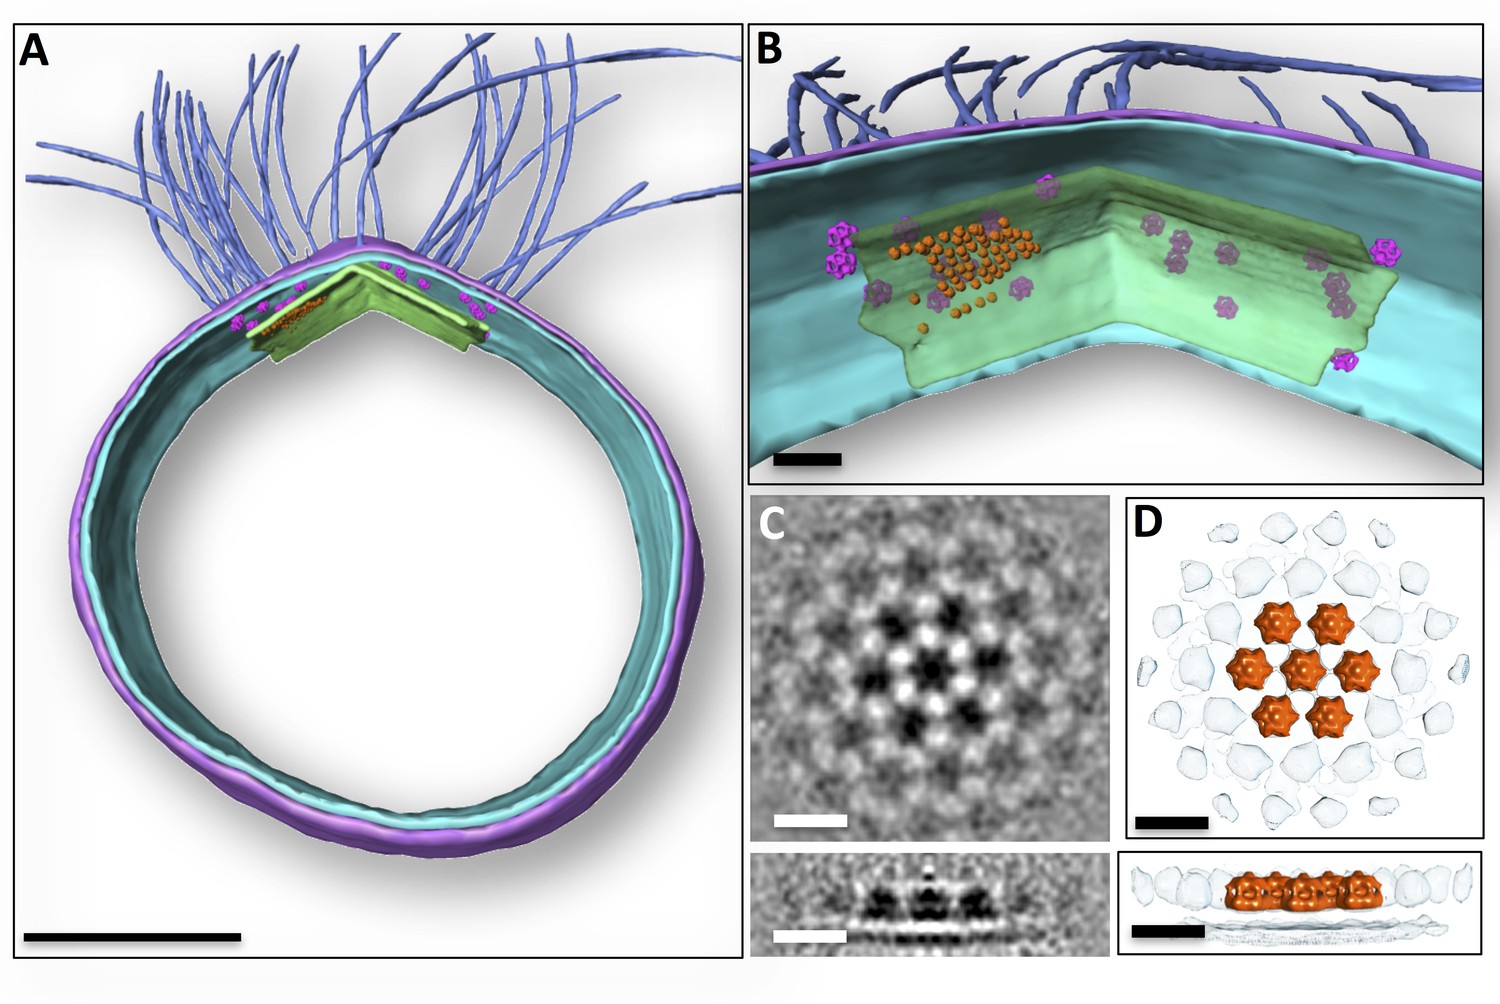
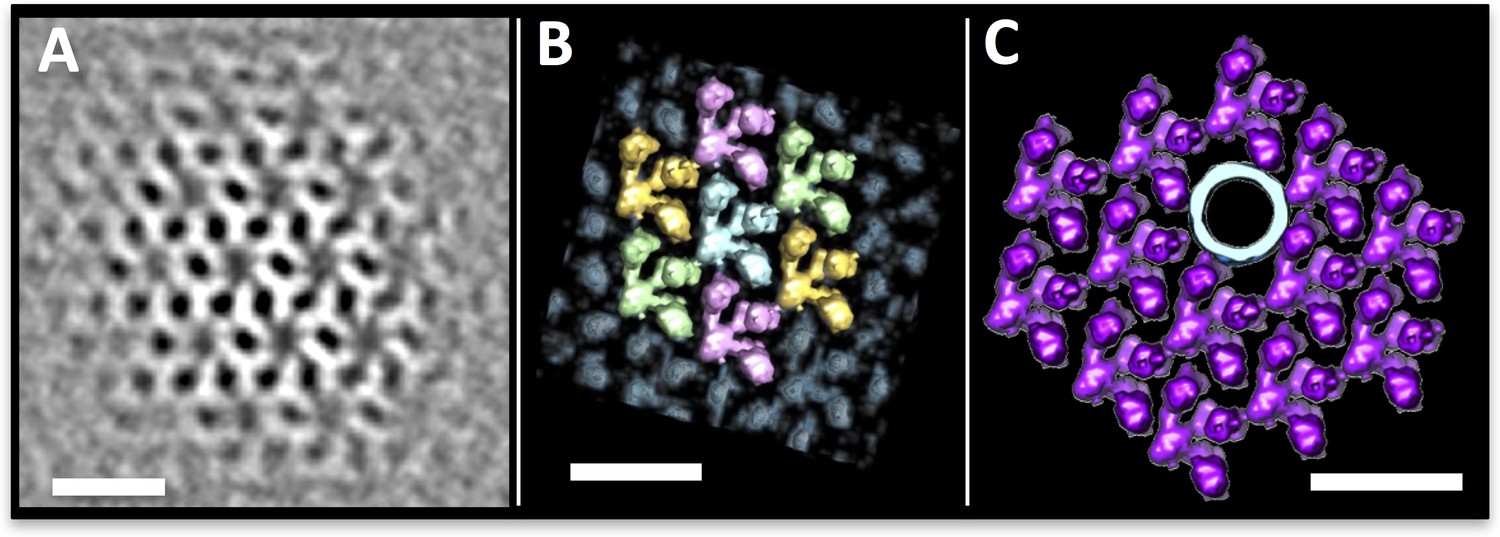
Subcellular organisation of motor complexes and polar cap.
(A) Segmented 3D representation of a tomogram of a P. furiosus cell. Motor complexes (magenta) have been repositioned into the original tomogram using coordinates from sub-tomogram averaging. Medium blue, archaella; purple, S-layer; cyan, cell membrane; green, polar cap. (B) close-ups of the polar region showing layer-like superimposition of motor complexes, polar cap and hexagonal protein array (orange). Note that due to limitations of manual particle picking only subsets of the motor complexes and hexagonal protein arrays are displayed. (C and D) sub-tomogram average of hexameric protein array associated with polar cap as slices through the average (C), as well as segmented surface representation (D) in top (top panel) and side view (bottom panel). Scale bars, 200 nm (A); 50 nm (B); 15 nm (C, D).
Figure 4—figure supplement 1
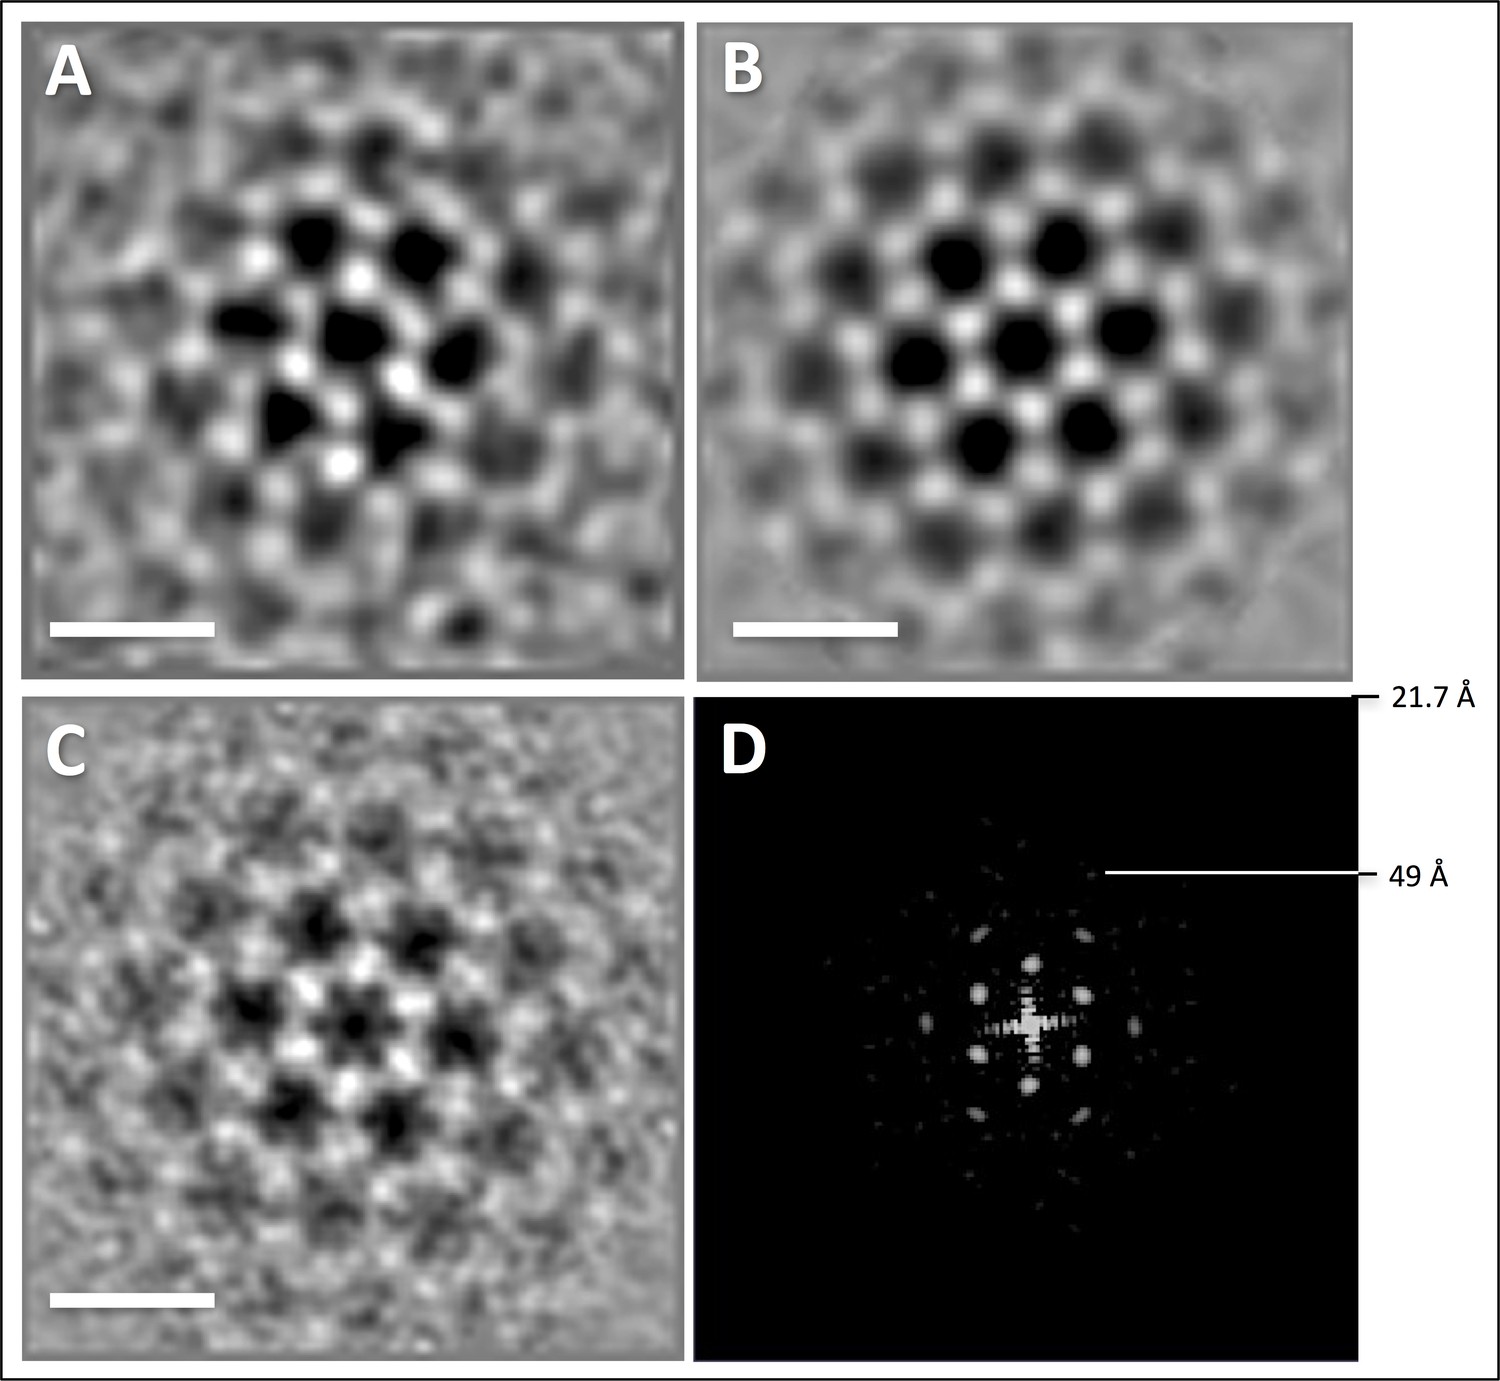
Sub-tomogram averaging and resolution of hexagonal protein array.
(A) average filtered with nonlinear anisotropic diffusion indicating hexagonal symmetry of the array. (B) average from A with 6-fold symmetry applied. (C), average of unfiltered sub-volumes with 6-fold symmetry applied. (D) power spectrum of C showing diffraction up to 49 Å. Nyquist at 21.7 Å. Scale bars, 20 nm.
Figure 5 with 6 supplements
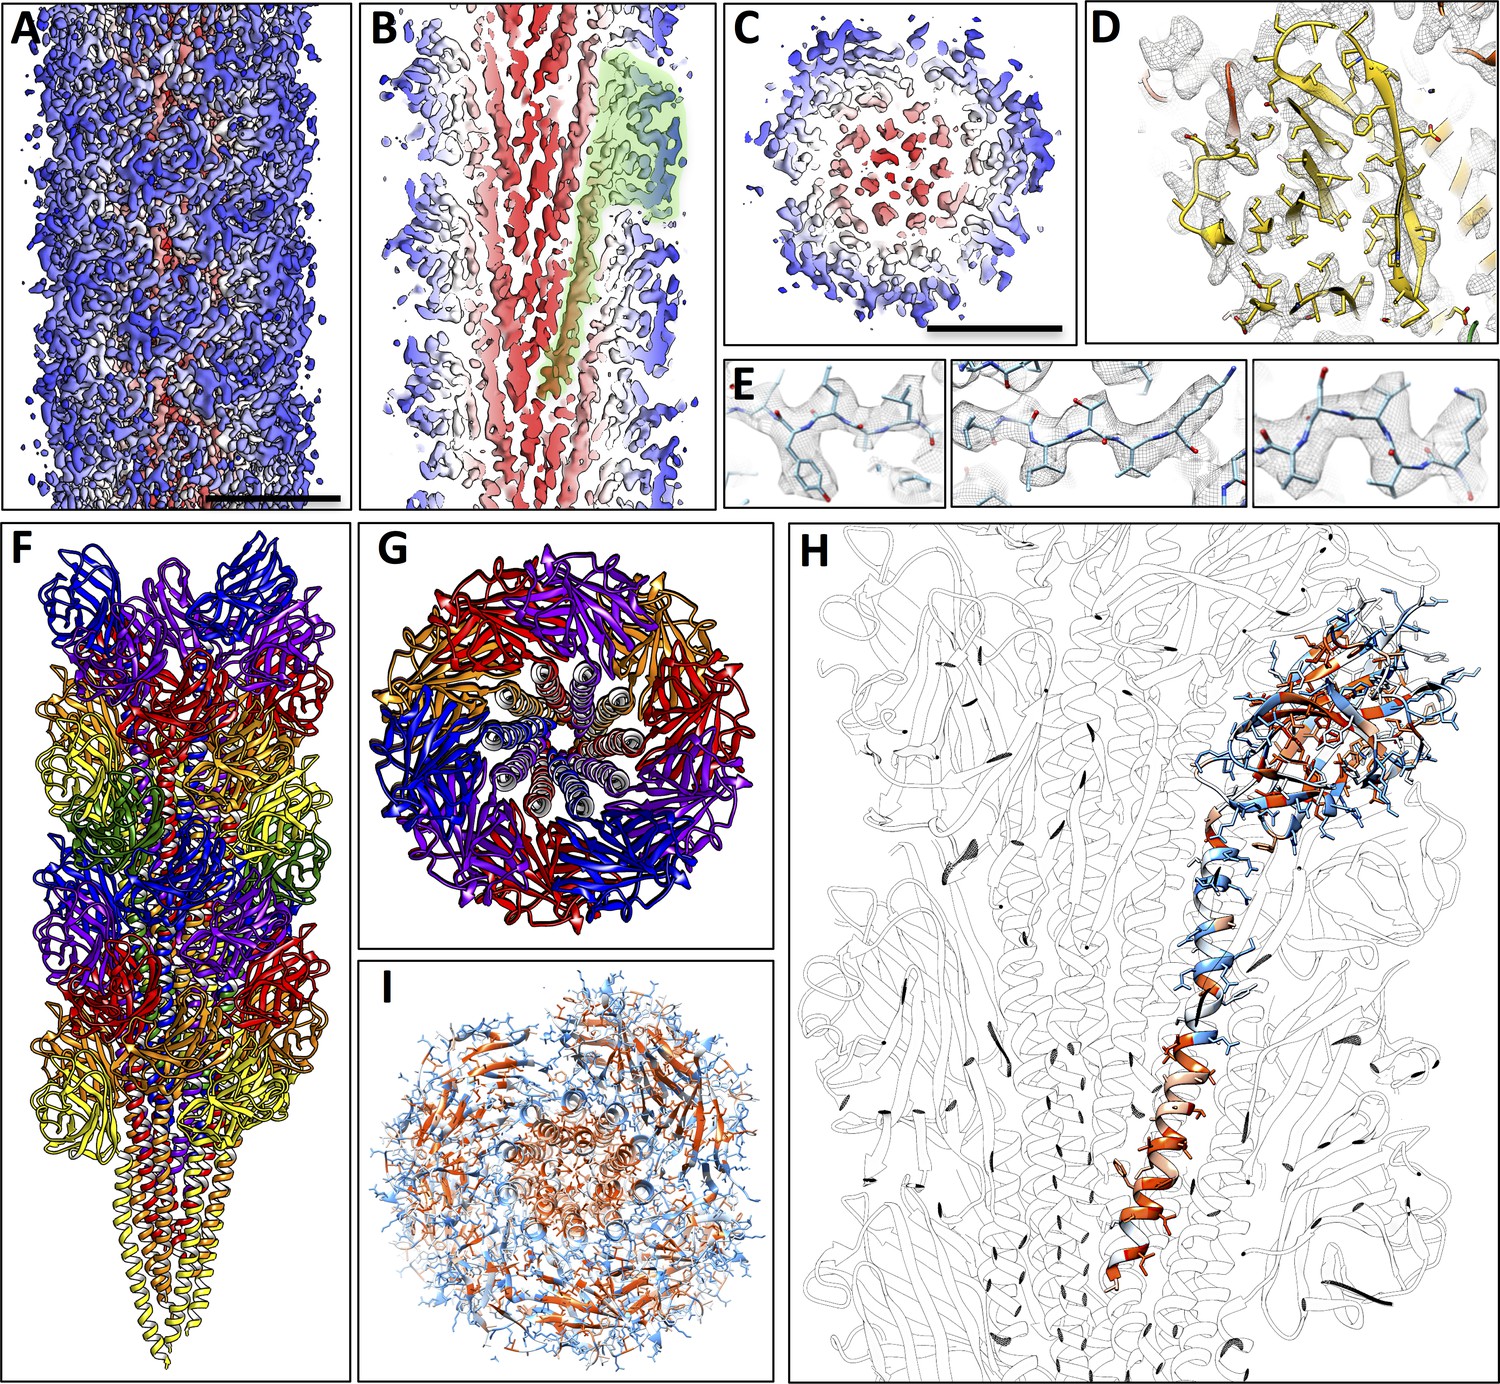
Structure of the P. furiosus archaellum.
(A–C) 3D representation of the 4.2 Å map of the P. furiosus archaellum as seen from the surface (A), and cross-sections parallel (B) and perpendicular (C) to the long axis of the filament. Different colours represent different regions of the archaellum; red, inner helix bundle; white – blue, outer beta-strand-rich sheath; transparent green, outline of one archaellin monomer. Scale bars A, C, 50 Å. (D) Slice through the outer sheath of the filament showing the β-strand rich region of the FlaB0 monomer (yellow) fitted into the map density (transparent grey). Note hydrophobic amino acid side chains pack in the interior of the β-barrel. (E) Close-ups of beta strands of FlaB0 (backbone in blue) fitted into the map density (transparent grey). (F, G) Side view (F) and cross-section (G) of the atomic model of the P. furiosus archaellum with individual FlaB0 subunits in different colours. (H) structure of the FlaB0 monomer coloured by hydrophobicity (red, hydrophobic; blue, hydrophilic). Neighbouring subunits within the filament are shown in transparent grey. (I) structure of the P. furiosus archaellum coloured by hydrophobicity in top view.
Figure 5—figure supplement 1
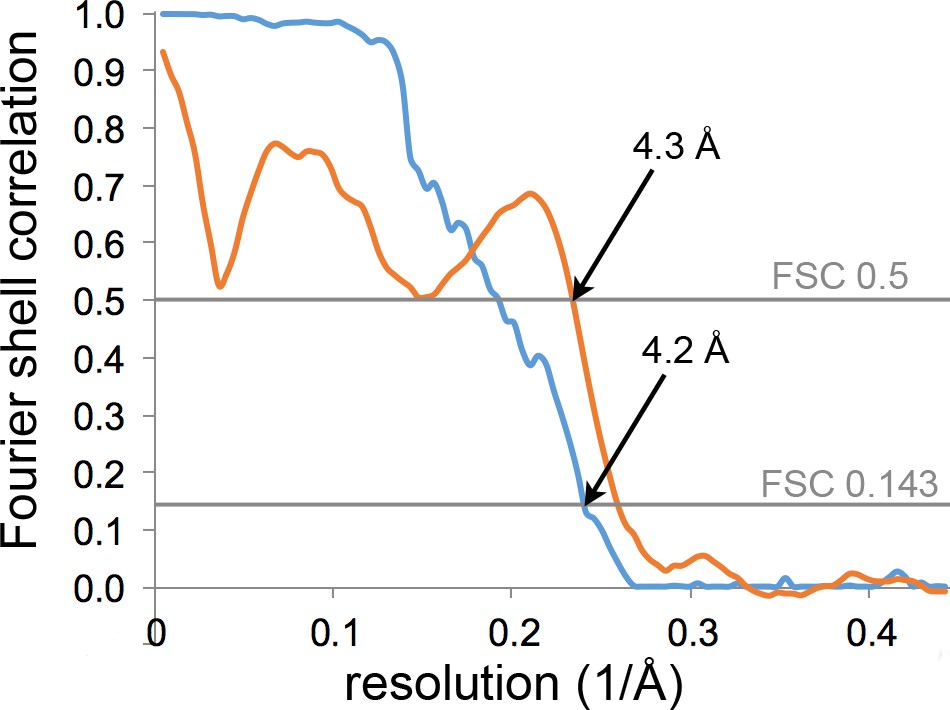
Resolution estimation and model validation of the P. furiosus archaellum.
Gold-standard Fourier shell correlation (FSC) of the map after masking as determined by the post-processing procedure in RELION (blue) and FSC between the map and the final model (orange).
Figure 5—figure supplement 2
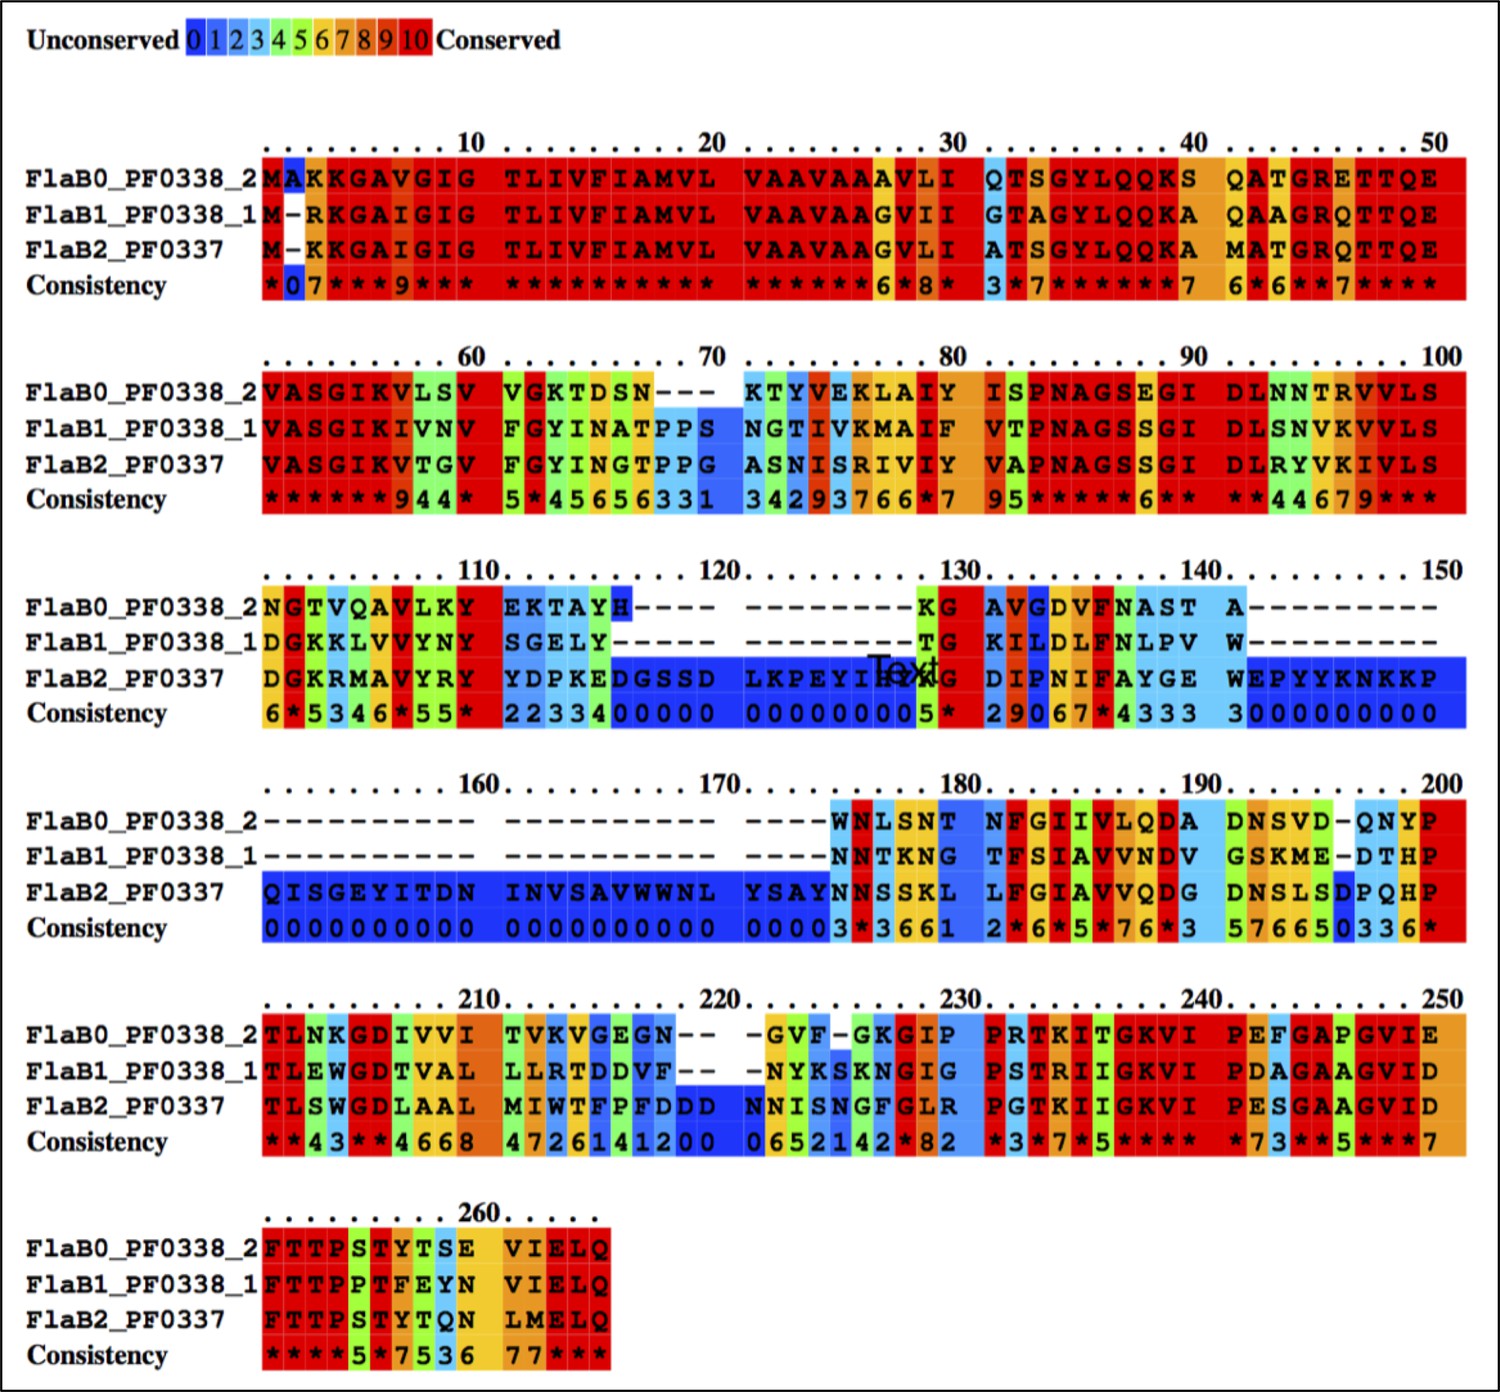
Multiple sequence alignment between P. furiosus FlaB0, FlaB1 and FlaB2 using the Praline server (http://www.ibi.vu.nl/programs/pralinewww/), showing sequence conservation.
https://doi.org/10.7554/eLife.27470.015
Figure 5—figure supplement 3
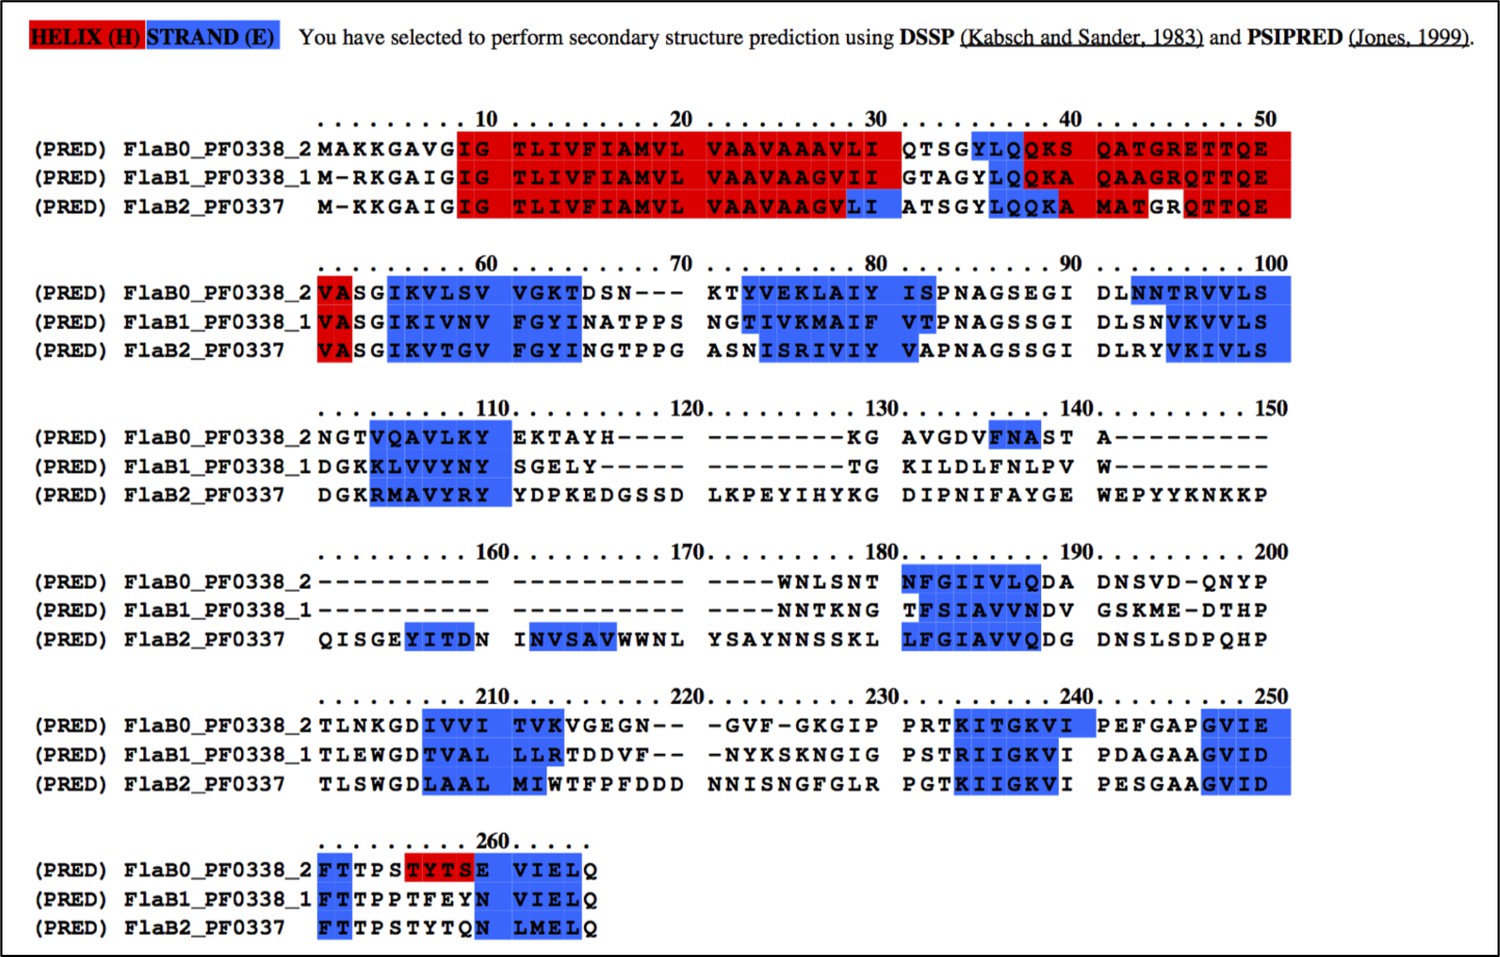
Multiple sequence alignment of P. furiosus FlaB0, FlaB1 and FlaB2 using the Praline server (http://www.ibi.vu.nl/programs/pralinewww/), showing secondary structure prediction (helices, red; beta strands, blue).
https://doi.org/10.7554/eLife.27470.016
Figure 5—figure supplement 4
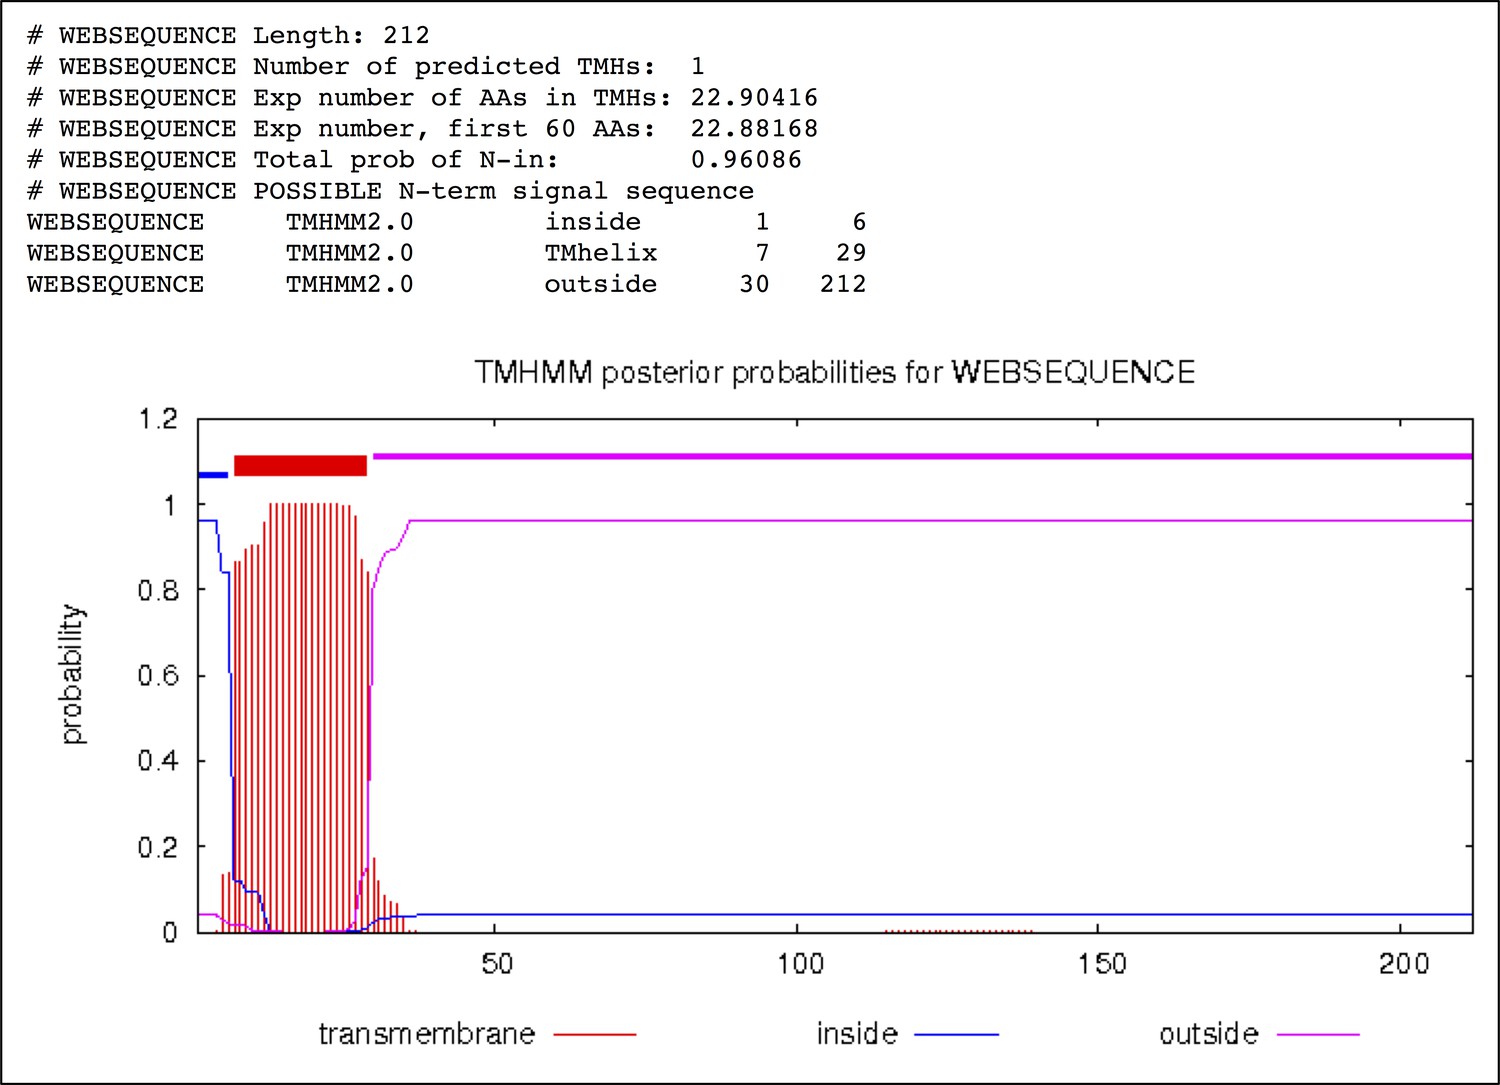
Transmembrane helix prediction of P. furiosus FlaB0 using the TMHMM server (http://www.cbs.dtu.dk/services/TMHMM/) predicting residues 1–6 inside, 7–29 as transmembrane helix and 30–212 outside (periplasm).
https://doi.org/10.7554/eLife.27470.017
Figure 5—figure supplement 5
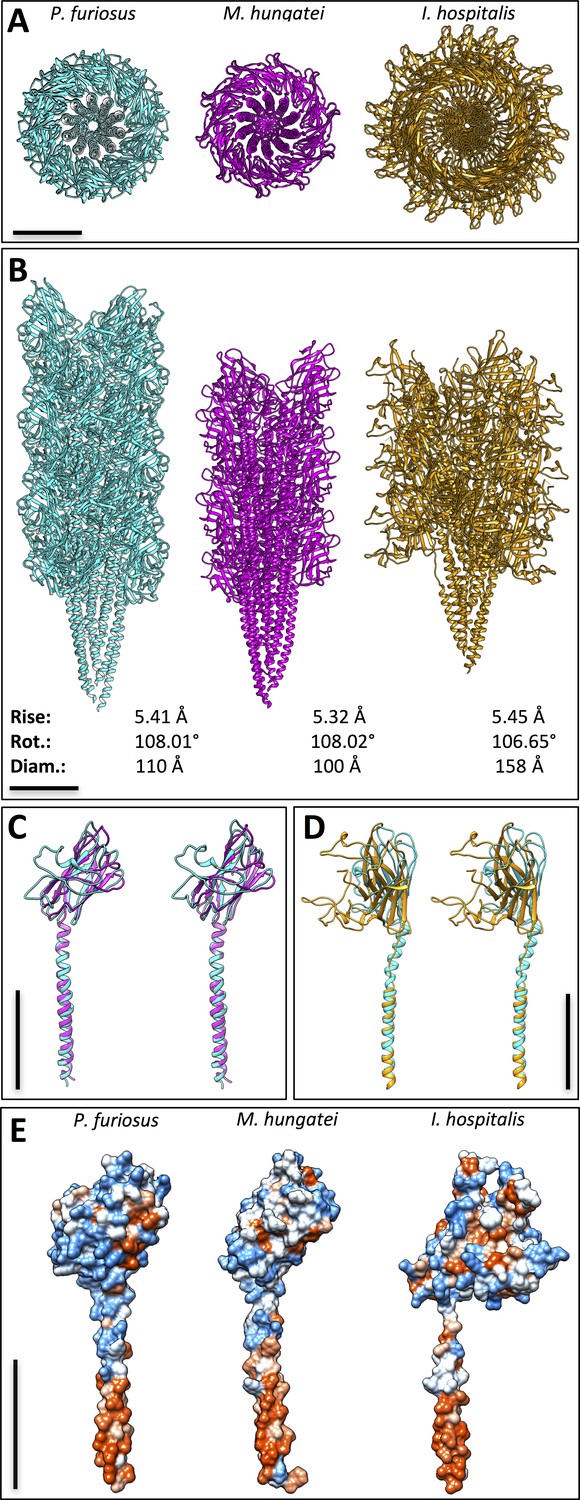
Comparison between three archaeal filaments.
Structures of archaella from Pyrococcus furiosus (cyan) and Methanospirillum hungatei (magenta), as well as Iho670 fiber from Ignicoccus hospitalis (gold) in top (A) and side (B) views. Helical parameters rise and rotation (rot.), as well as diameters (diam.) are indicated. (C) overlay of PfuFlaB0 (cyan) and MhuFlaB3 (magenta) in stereo view. (D) overlay of PfuFlaB0 (cyan) and Iho670 (gold) in stereo view. (E) hydrophobicity surfaces of PfuFlaB0, MhuFlaB3 and Iho670; red, hydrophobic; blue, hydrophilic. Scale bars, 50 Å.
Figure 5—figure supplement 6
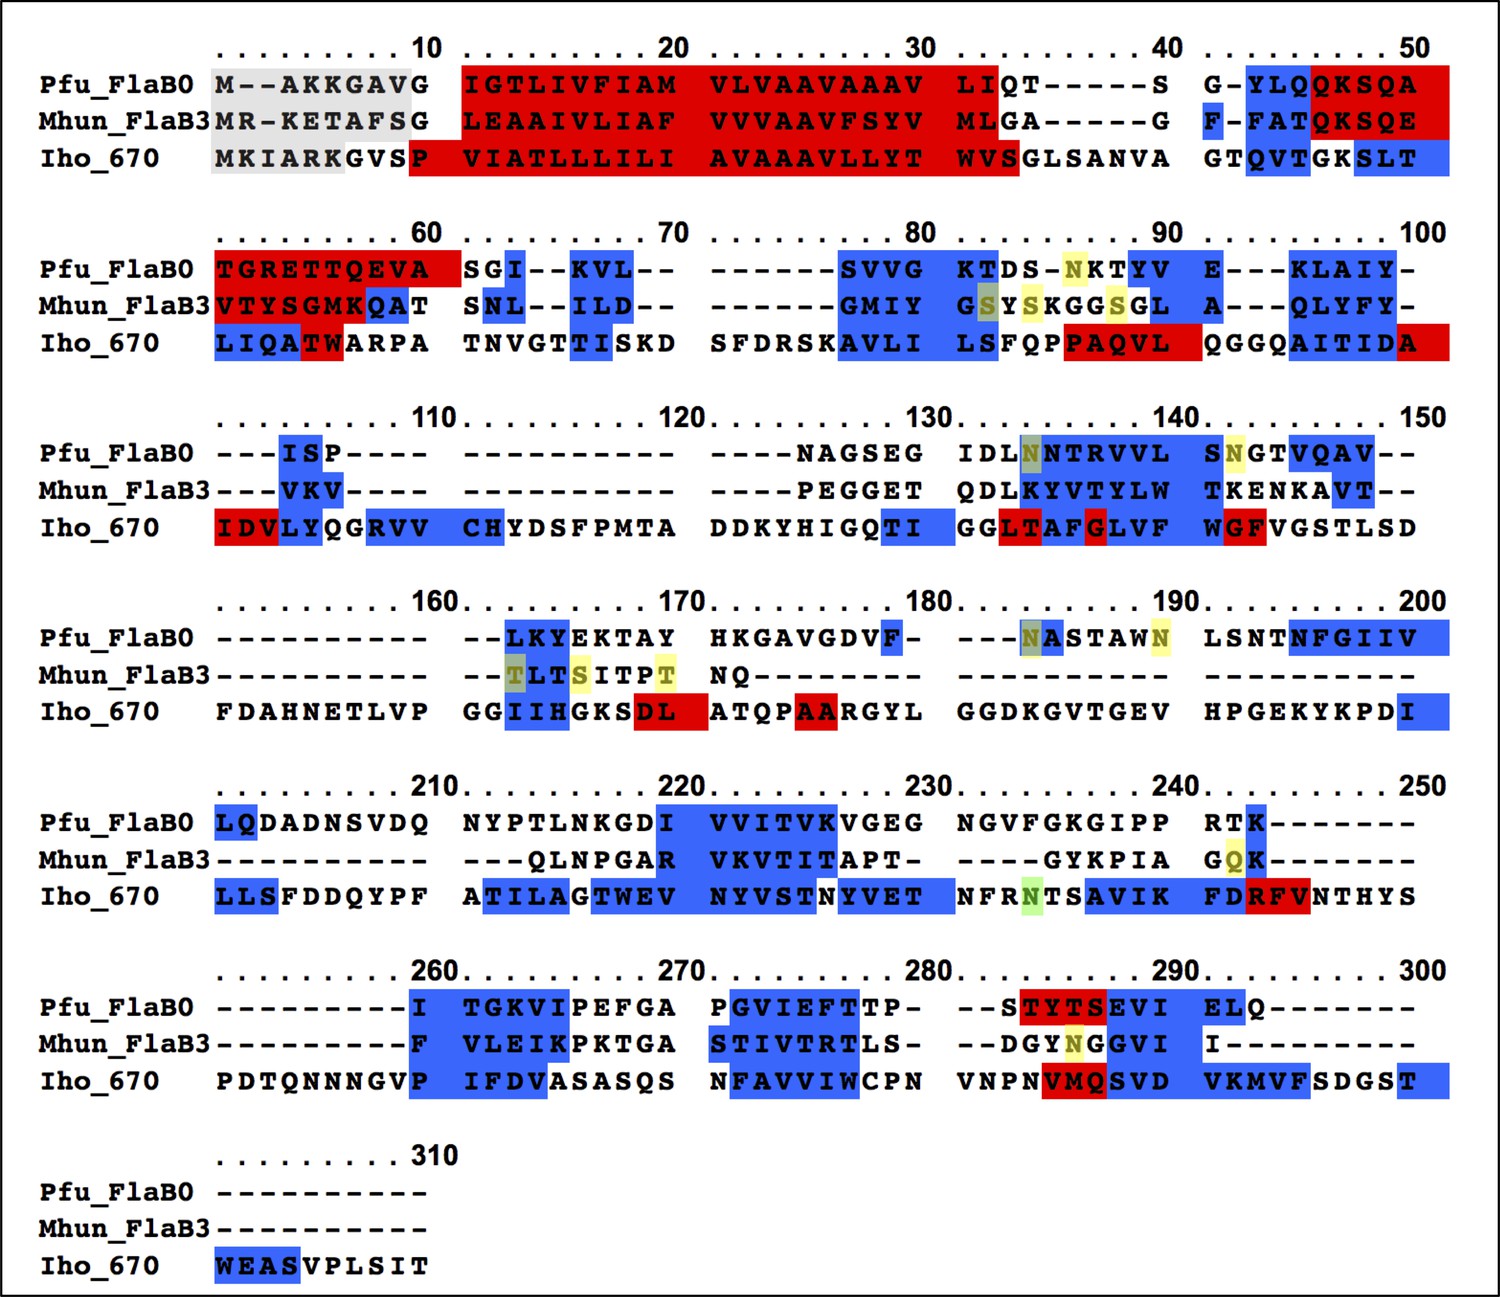
Sequence alignment of P. furiosus FlaB0, M. hungatei FlaB3 and the I. hospitalis 670 polypeptides.
Transparent grey, clipped signal peptide; red, predicted α-helix; blue, predicted beta-strand; yellow, experimentally determined N-and O-glycosylation sites in P. furiosus and M. hungatei; green, singular putative N-glycosylation site in I. hospitalis.
Figure 6
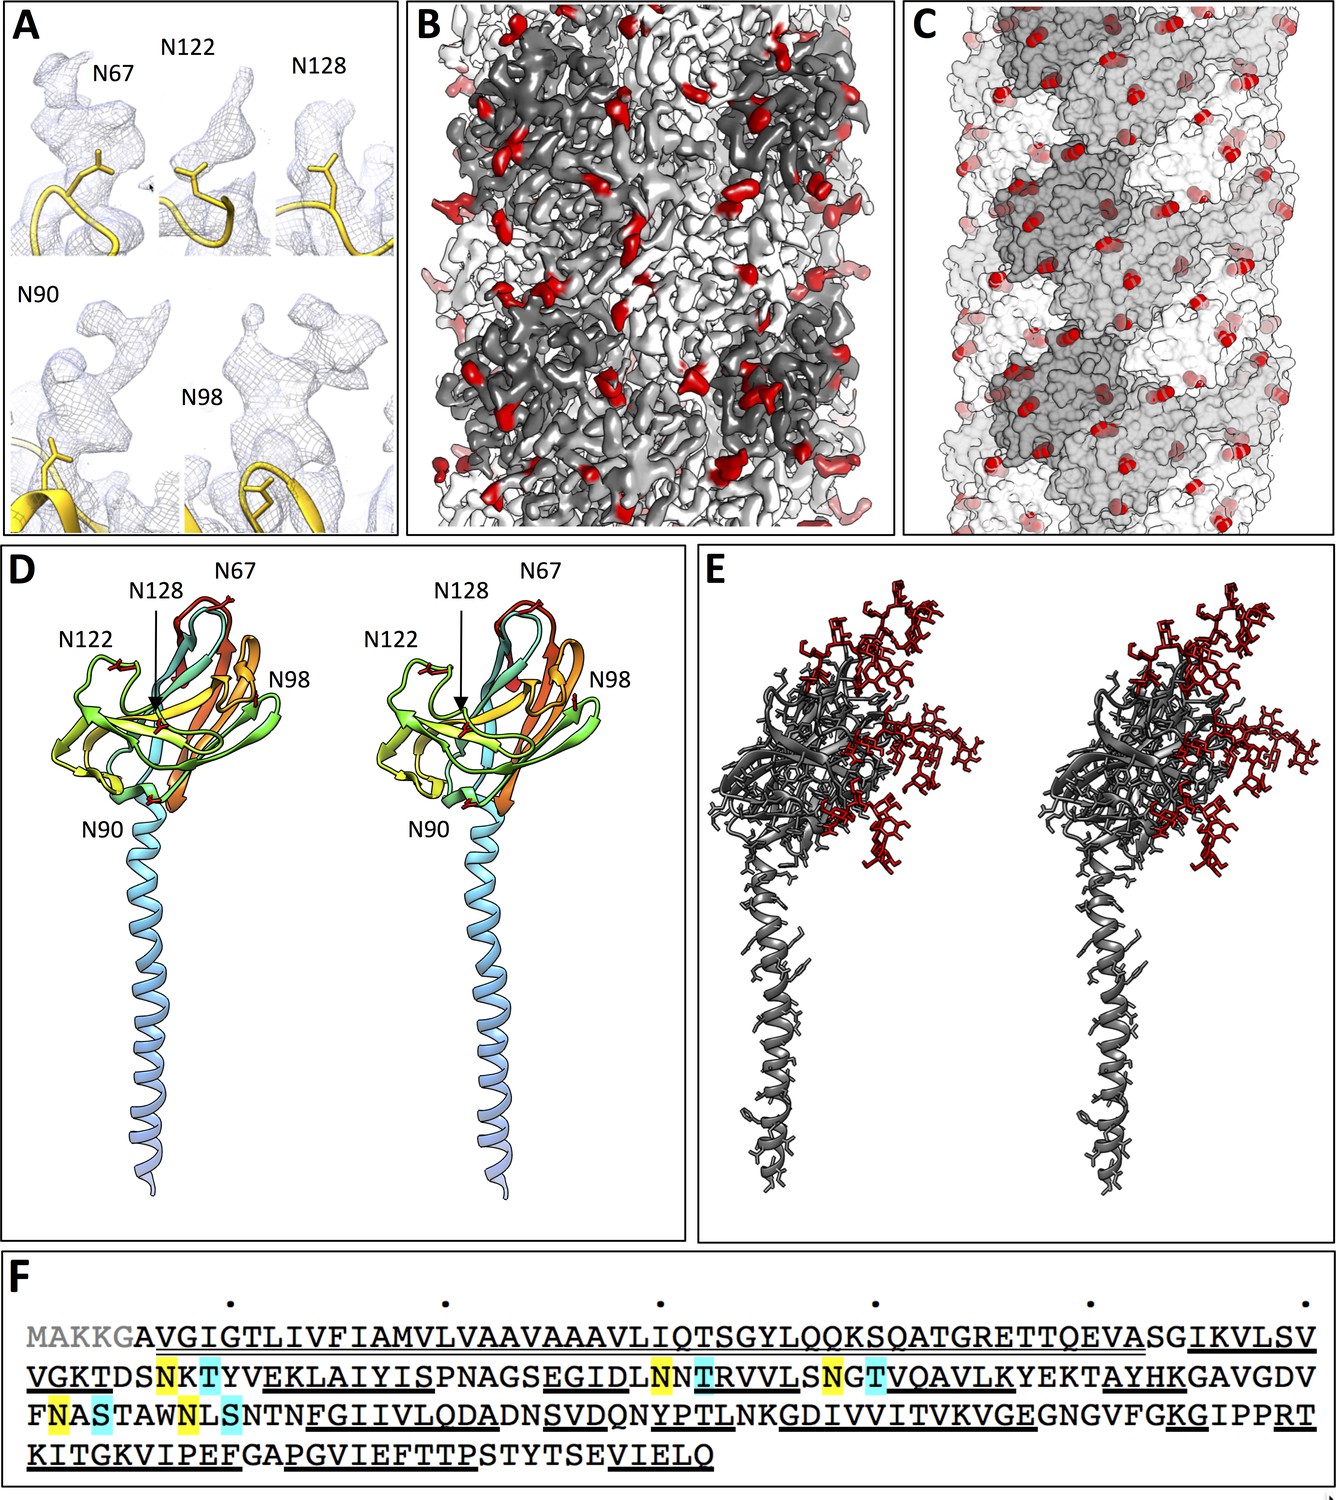
Glycosylation of the P. furiosus archaellum.
(A) Close-ups of glycan densities near Asn residues. (B) surface representation of EM map showing glycan densities (red) protruding from the filament (shades of grey). (C) Surface representation of the atomic model of the archaellum (shades of grey, individual FlaB0 subunits; red, asparagine residues within glycosylation sequon). (D) stereo view of the P. furiosus FlaB0 monomer in rainbow representation (blue, N-terminus; red, C-terminus) with glycosylated asparagines labelled in red. (E) stereo view of the P. furiosus FlaB0 monomer (dark grey) and glycan structures (red) modelled near glycosylated Asn residues. (F) sequence of P. furiosus FlaB0. Grey, clipped signal peptide; double line, α-helix; single line, β strand; yellow, glycosylated asparagine; blue, T/S residue in conserved glycosylation sequon; every 10th residue of the P. furiosus sequence labelled by a dot.
Figure 7
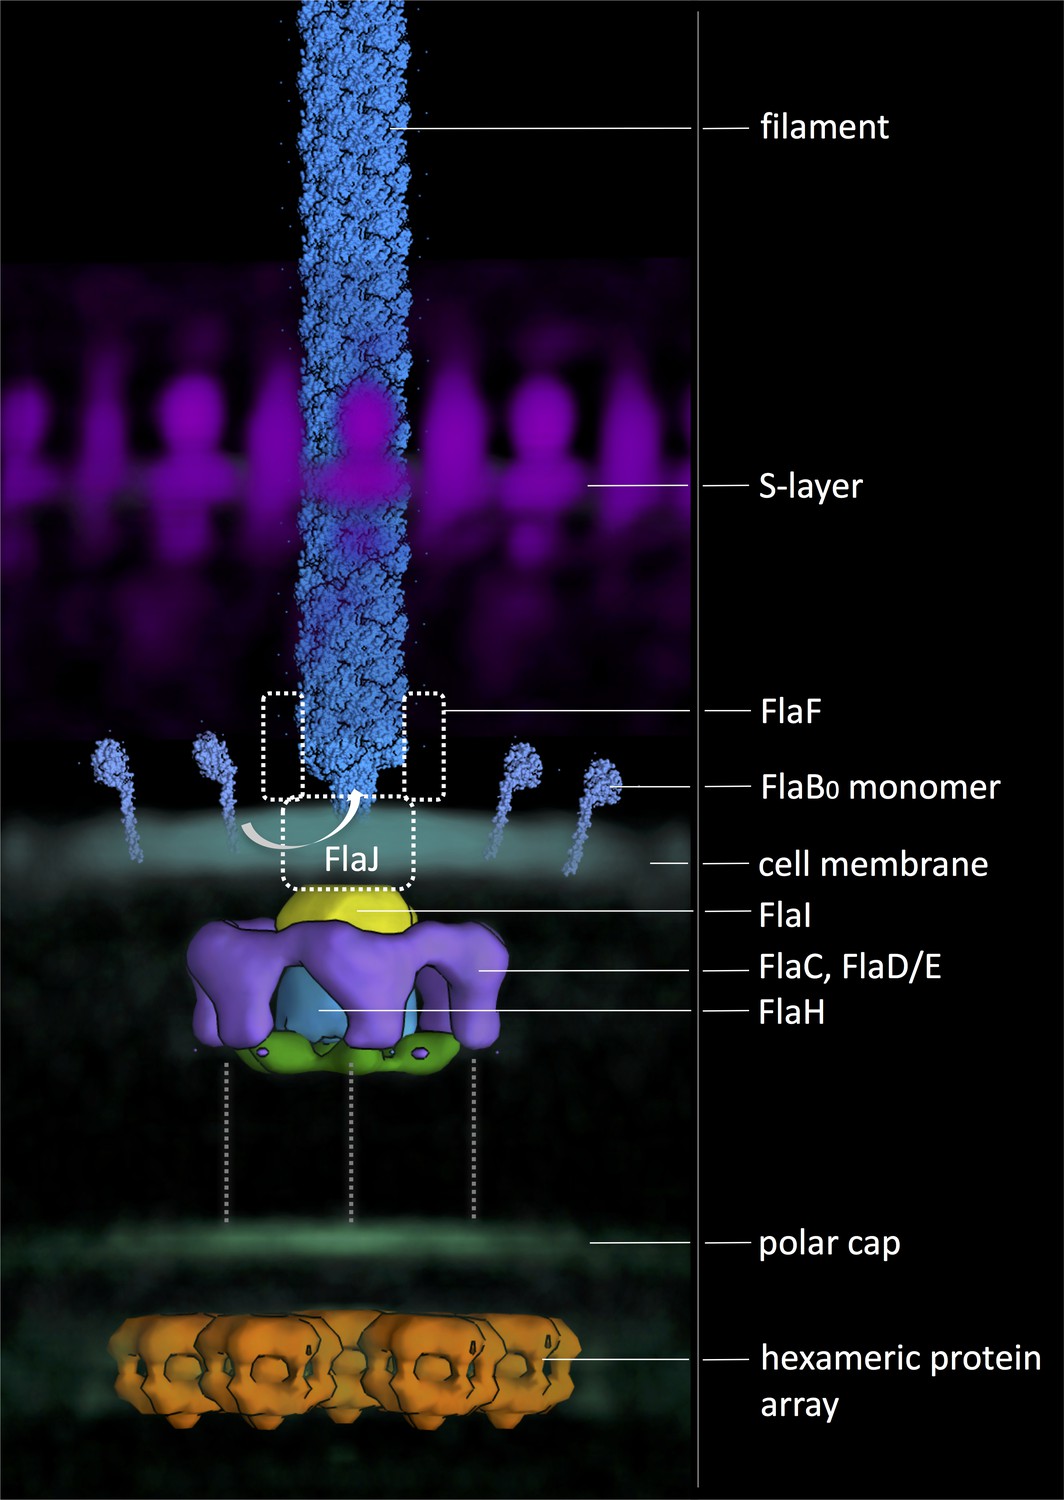
Composite model of the archaellum machinery of P. furiosus.
Light blue, FlaB0 monomers and filament (from helical reconstruction); hazy magenta, S-layer; solid yellow, blue, green and purple, motor complex; hazy blue, cell membrane; hazy green, polar cap; solid orange, hexagonal protein array (from different sub-tomogram averages). Putative positions of protein subunits are indicated. Dashed grey lines, putative interaction with polar cap.
Tables
Table 1
Statistics of 3D reconstruction and model refinement.
| Data collection | |
|---|---|
| Electron microscope | JEOL JEM 3200 FSC |
| Electron detector | K2 in counting mode |
| Voltage | 300 kV |
| Defocus range | 1–3 µm |
| Pixel size | 1.12 Å |
| Electron dose | 60 e-/Å2 |
| Images | 297 |
| 3D reconstruction | |
| Final particles | 13,965 helical segments |
| Resolution | 4.2 Å |
| B factor | −200 Å2 |
| Ramachandran plot | |
| Favored | 82.50% |
| Outliers | 0% |
| Validation | |
| EMringer score | 2.06 (Barad et al., 2015) |
| MolProbity score | 2.54 |
| Rotamer favored | 92.26% |
| Rotamer outliers | 1.64% |
Table 2
Plasmid used in this study.
| Plasmid | Relevant characteristics | Source |
|---|---|---|
| pSVA 3116 | pETDuet-1 carrying N-terminal His6 tagged PfFlaI, AmpR. | (Chaudhury et al., 2016) |
| pSVA 3140 | pETDuet-1 containing N-terminal StrepII-tagged PfFlaI. The PCR product obtained using the 5118 and 5110 primers (see Table 3) on pSVA3116 was cloned using the NcoI and PstI sites. AmpR | This study |
Table 3
Primers used in this study. Relevant restriction sites are underlined.
| Primers | Sequence and characteristics | Source |
|---|---|---|
| 5110 | 5’-GGGCTGCAGTCAGATTCTGAAGCTTAGTC-3’ | (Chaudhury et al., 2016) |
| 5118 | 5’GGGCCATGGGCTGGAGTCATCCACAATTTGAGAAGATGGCGGAAGTTATGTCAC-3’ | This study |
Download links
A two-part list of links to download the article, or parts of the article, in various formats.
Downloads (link to download the article as PDF)
Open citations (links to open the citations from this article in various online reference manager services)
Cite this article (links to download the citations from this article in formats compatible with various reference manager tools)
Structure and in situ organisation of the Pyrococcus furiosus archaellum machinery
eLife 6:e27470.
https://doi.org/10.7554/eLife.27470


