Single methyl groups can act as toggle switches to specify transmembrane Protein-protein interactions
- Yale School of Medicine, United States
- University of Copenhagen, Denmark
- Dartmouth College, United States
- Yale Cancer Center, United States
Figures
Figure 1

Isolation of traptamers that activate EPOR.
(A) Scheme to isolate traptamers that activate the hEPOR. BaF3/hEPOR cells were infected with a retrovirus library expressing LIL traptamers and selected in medium containing a reduced level of IL-3. Genes encoding traptamers were recovered from genomic DNA isolated from live cells, cloned, re-introduced into naïve BaF3/hEPOR cells and subjected to an additional round of selection in the absence of IL-3. (Red bars, traptamers that activate hEPOR; grey bars, traptamers that do not activate hEPOR.) (B) Sequences of traptamers that confer IL-3 independence in BaF3/hEPOR cells but not in parental BaF3 cells. M, methionine; L, leucine; I, isoleucine (colored red). Residues in boxes are distinctive for LH5. Numbers at bottom indicate the position in the traptamer sequence.
Figure 2
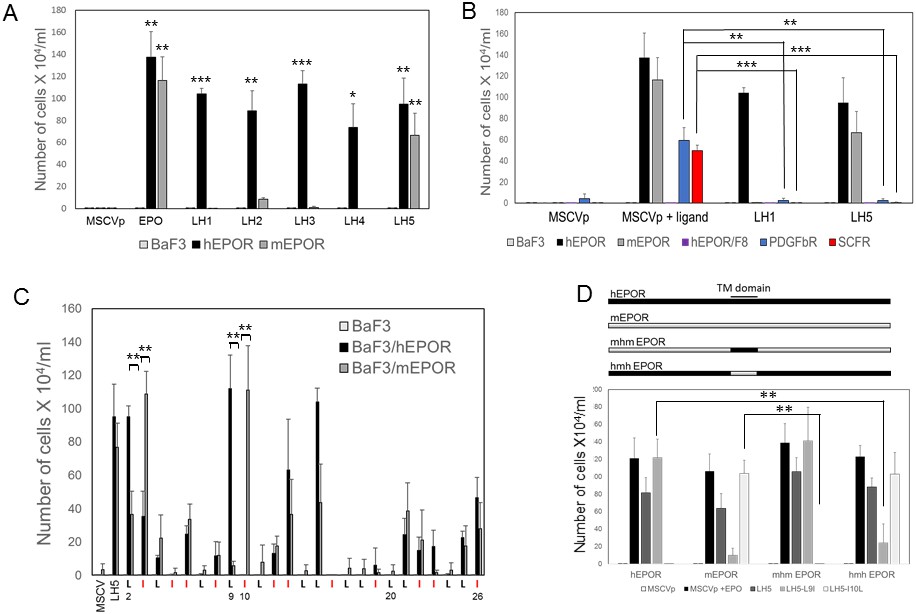
Specificity of traptamer action.
(A) BaF3, BaF3/hEPOR and BaF3/mEPOR cells stably expressing empty MSCVp vector or the indicated traptamer were incubated in medium lacking IL-3. MSCVp cells were also incubated in the presence of EPO, as indicated. The number of live cells was counted six days after IL-3 removal. The bars show mean ± SEM for three independent experiments. For clarity, in all graphs, values for samples with no growth were arbitrarily set at 0.5 × 10⁴ cells/ml. Statistical significance of differences between cells expressing MSCVp and cells expressing a traptamer were evaluated by two-tailed Student’s t-test with unequal variance (*p≤0.05; **p≤0.02; ***p≤0.005). (B) BaF3 cells and BaF3 cells expressing wild-type hEPOR, F8 (a phosphorylation-defective mutant of the hEPOR), mEPOR, PDGFβR or SCFR were infected with MSCVp or MSCVp expressing LH1 or LH5. After puromycin selection, cells were incubated in medium lacking IL-3. Cells expressing MSCVp were also treated with the cognate ligand, as indicated: EPO for EPOR and F8, PDGF for PDGFβR, and stem cell factor for SCFR. The number of live cells was counted six days after IL-3 removal. The bars shown mean ± SEM for three independent experiments. Statistical significance of differences between cells treated with ligand and cells expressing a traptamer were evaluated by two-tailed Student’s t-test with unequal variance (**p≤0.02; ***p≤0.005). (C) Sequence of LH5 starting at position two is shown at the bottom, with isoleucines colored red. Each leucine was mutated individually to isoleucine and each isoleucine was mutated to leucine. BaF3, BaF3/hEPOR and BaF3/mEPOR cells were infected with MSCVp or MSCVp expressing LH5 or one of the LH5 mutants. After puromycin selection, cells were incubated in medium lacking IL-3. In cells expressing a traptamer with a mutation at the indicated position, the number of live cells was counted six days after IL-3 removal. The bars show mean ± SEM for three independent experiments. For each mutant, statistical significance of differences between cells expressing hEPOR and cells expressing mEPOR were evaluated by two-tailed Student’s t-test with unequal variance (**p≤0.02). (D) Top panel. Schematic diagram of mhm and hmh chimeric receptors with hEPOR and mEPOR segments shown in black and gray, respectively. Bottom panel. BaF3 cells expressing the hEPOR, the mEPOR, or a chimeric EPOR were infected with MSCVp or MSCVp expressing the indicated traptamer. After selection with puromycin, cells were tested for IL-3 independence. The number of live cells was counted six days after IL-3 removal. The bars show mean ± SEM for three independent experiments. Statistical significance of differences between cells expressing wild-type hEPOR or mEPOR compared to cells expressing a chimeric EPOR were evaluated by two-tailed Student’s t-test with unequal variance (**p≤0.02).
Figure 3 with 4 supplements

Biochemical analysis of EPOR activation.
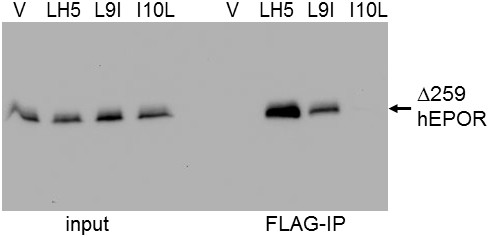
(A) Extracts were prepared from BaF3/hEPOR cells (left panels) or BaF3/mEPOR cells (right panels) expressing MSCVp (V), LH5, LH5-L9I (L9I), or LH5-I10L (I10L). MSCVp-expressing cells were also acutely treated with EPO, as indicated. Extracts were immunoprecipitated with anti-HA antibody and immunoblotted with anti-phosphotyrosine antibody PY100 (phospho-EPOR). The multiple species represent minor phosphorylated forms of the EPOR. The same blot was stripped and reprobed for total EPOR by using anti-HA antibody. (B) Cell extracts described in panel A were immunoblotted with anti-phospho-JAK2 antibody (phospho-JAK2). The same blot was stripped and reprobed for total JAK2 using anti-JAK2 antibody. Size of protein markers (in kDa) is shown in A and B. (C) Extracts were prepared from BaF3/hEPOR cells (top panel) or BaF3/mEPOR cells (bottom panel) expressing MSCVp vector (V), FLAG-tagged LI-5 (a traptamer that specifically activates PDGFβR [Heim et al., 2015]), or FLAG-tagged (+) or untagged (-) LH5, LH5-L9I, or LH5-I10L. Extracts were immunoprecipitated with anti-FLAG antibody and immunoblotted with anti-HA antibody. (D) Extracts of BaF3 cells expressing the full-length hEPOR (fl) and/or the Δ259 truncated hEPOR (t) and the indicated traptamer or MSCVp (V) were immunoprecipitated with anti-C-20 antibody, which recognizes only full-length EPOR, and immunoblotted with anti-HA antibody (C-20 IP) (top panel); or were directly immunoblotted with anti-HA antibody (input EPOR) (bottom panel). – indicates no traptamer. The full-length and truncated EPORs are indicated by the bold and thin arrows, respectively.
Figure 3—figure supplement 1
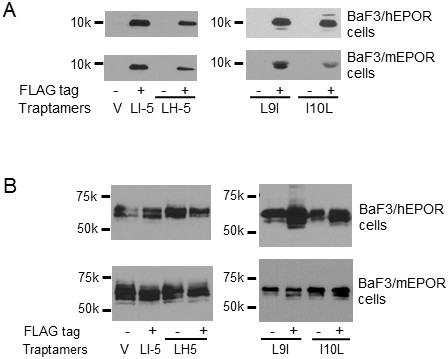
Expression of FLAG-tagged traptamers and HA-tagged EPOR.
(A) Similar to Figure 3C, extracts prepared from BaF3/hEPOR (top panels) or BaF3/mEPOR (bottom panels) cells expressing MSCVp vector (V), LI-5, or FLAG-tagged or untagged LH5, LH5-L9I, or LH5-I10L were immunoprecipitated and immunoblotted with anti-FLAG antibody to detect traptamer. (B) Cells as in panel A were directly immunoblotted with anti-HA antibody to detect the total EPOR.
Figure 3—figure supplement 2
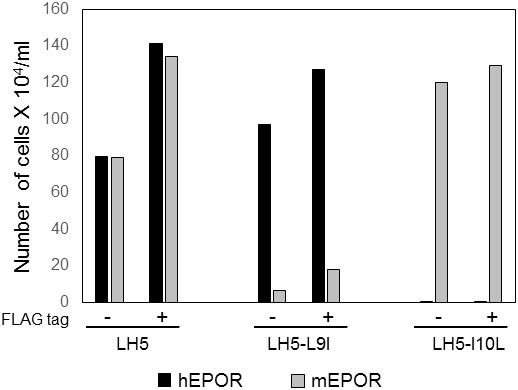
Addition of a FLAG-tag does not change the specificity of traptamers.
BaF3 cells expressing hEPOR or mEPOR were infected with MSCVp vectors expressing the indicated traptamer with (+) or without (-) FLAG epitope tag, as indicated. After puromycin selection, the cells were tested for IL-3 independence. The number of live cells six days after IL-3 removal is shown (n = 2).
Figure 3—figure supplement 3
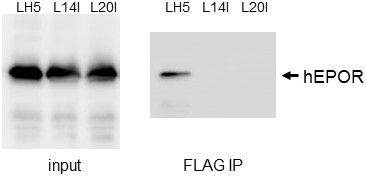
Defective LH5 mutants do not bind hEPOR.
Extracts were prepared from BaF3/hEPOR cells expressing FLAG-tagged LH5, LH5-L14I or LH5-L20I. Samples were subjected to SDS-polyacrylamide gel electrophoresis directly (left panel) or after immunoprecipitation with anti-FLAG antibody, and then immunoblotted with anti-HA antibody, which recognizes HA-tagged hEPOR.
Figure 3—figure supplement 4
Active traptamers bind truncated hEPOR.
Extracts were prepared from BaF3/Δ259 cells expressing MSCVp (V) or the indicated FLAG-tagged traptamer. Samples were subjected to SDS-polyacrylamide gel electrophoresis directly (left lanes) or after immunoprecipitation with anti-FLAG antibody, and then immunoblotted with anti-HA antibody, which recognizes HA-tagged Δ259 (right lanes).
Figure 4 with 3 supplements
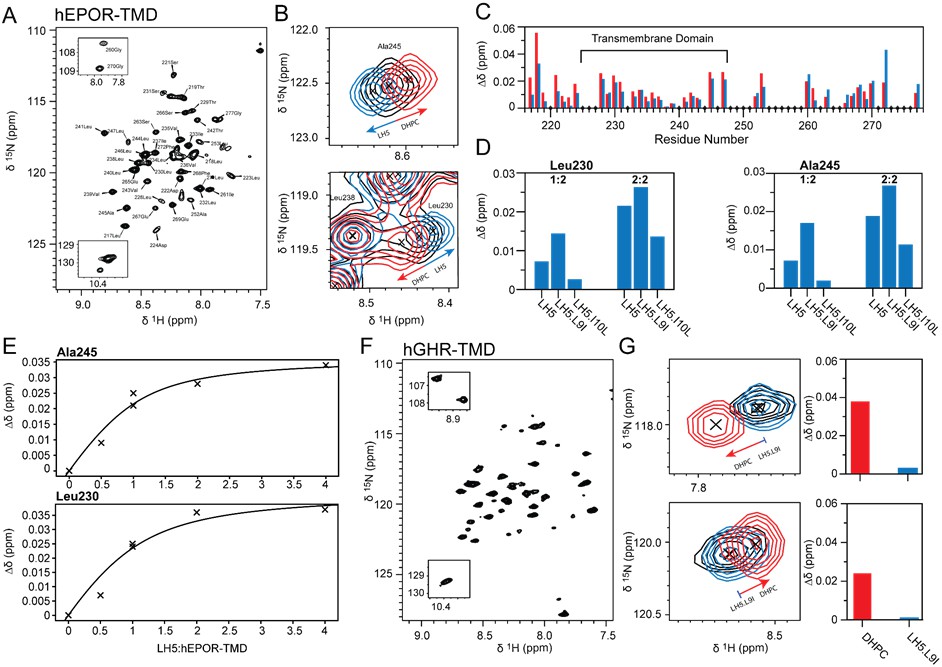
LH5 drives EPOR TMD peptides into dimers in detergent micelles.
(A) 1H,15N- HSQC spectrum of 15N-labelled hEPOR217-277 in DHPC micelles with assignments indicated. (B) Zoomed-in contour plots of hEPOR Ala245 and Leu230 from 1H,15N- HSQC spectra. Peaks from hEPOR217-277 at 30-times molar excess of DHPC are depicted in black, peaks at 60-times molar excess of DHPC in red, and peaks with LH5 in a ratio of LH5:hEPOR:DHPC of 1:1:30 in blue. Increasing the amounts of DHPC or adding LH5 induced opposite effects as indicated by arrows. (C) Weighted chemical shift changes of 15N-hEPOR217-277 backbone amides per residue upon increasing the molar excess of DHPC from 30 to 60 times (red bars) or addition of LH5 in a molar ratio of 1:1 (blue bars). The same residues were affected by LH5 and DHPC, but the peaks move in opposite directions. The hEPOR TMD is indicated by a black horizontal line. Diamonds on the x-axis indicate proline residues, overlapping peaks, and missing assignments. (D) Weighted chemical shift changes of Leu230 and Ala245 backbone amides induced by addition of LH5, LH5-L9I or LH5-I10L at molar ratios of one traptamer molecule to two hEPOR TMDs (1:2) and two traptamer molecules to two hEPOR TMDs (2:2). (E) Weighted chemical shift changes of 15N-hEPOR217-277 Ala245 and Leu230 backbone amides induced by addition of LH5 at different molar ratios of LH5 to hEPOR217-277 in DHPC micelles. Two individual titrations were performed, one from 0:1 to 1:1 (corresponding to the 2:2 traptamer:EPOR TMD ratio) and the other from 0:1 to 4:1 (corresponding to the 8:2 traptamer:EPOR TMD ratio) molar ratio of LH5 to hEPOR217-277. The titration point at 1:1 was recorded in each series. A hyperbola is indicated to guide the eye. (F) 1H,15N- HSQC spectrum of 15N-labelled hGHR238-274 in DHPC micelles. (G) Zoomed-in contour plots of two selected peaks of hGHR from 1H,15N- HSQC spectra. Peaks from hGHR238-274 at 60-times molar excess of DHPC are depicted in black, peaks at 120-times molar excess of DHPC in red, and peaks with LH5-L9I in a ratio of LH5-L9I:hEPOR:DHPC of 2:1:60 in blue. Addition of LH5-L9I did not induce a change in chemical shifts as indicated by the near-complete overlap of the black and blue peaks (Figure 4—figure supplement 3). The extent of the chemical shift changes in the hGHR238-274 spectra is illustrated in the bar graphs showing the changes induced by the DHPC in red and by LH5-L9I in blue for the peaks shown on the left.
Figure 4—figure supplement 1

hEPOR TMD side chain chemical shift.
(A)1H,13C-HSQC spectrum of 13C,15N-EPOR217-277 in DHPC micelles. The spectrum of 13C,15N-EPOR217-277 at 30-times molar excess of DHPC is depicted in black, and the spectrum of 13C,15N-EPOR217-277 with LH5 in a ratio of 1:1 (corresponding to 2:2) and a total protein to detergent ratio of 1:30 [(1:1):30 molar ratio of (LH5:hEPOR):DHPC] in red. Regions of the spectra with changes in response to LH5 are highlighted in red squares. (B) Zoomed-in contour plots of hEPOR217-277 from 1H,13C- HSQC spectra. Regions corresponding to methyl chemical shifts of leucine, isoleucine and valine are enlarged in zooms. The two zooms at the bottom show the novel peaks. (C) Primary structure of hEPOR217-277 with the TMD sequence highlighted in bold.
Figure 4—figure supplement 2
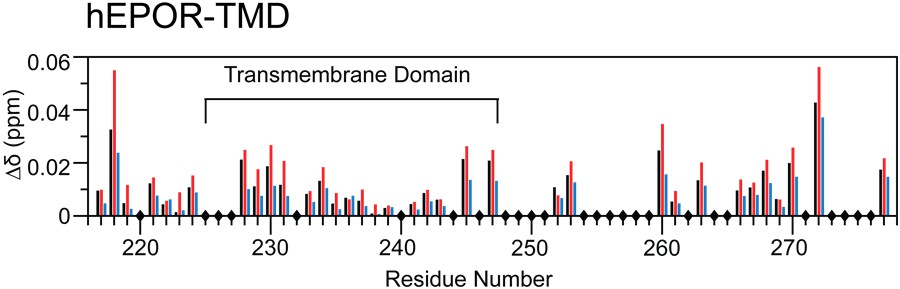
LH5 mutants drive hEPOR TMD peptides into dimers.
Weighted chemical shift changes of 15N-hEPOR217-277 backbone amides induced by addition of LH5 (black bars), LH5-L9I (red bars) and LH5-I10L (blue bars) at molar ratios of two traptamer molecules for two hEPOR TMDs (2:2). Sample conditions were 0.5 mM traptamer peptide and 0.5 mM 15N-hEPOR217-277 in 40 mM DHPC at (2:2):30 ratios. The EPOR TMD is indicated. Diamonds on the x-axis indicate proline residues, overlapping peaks, and missing assignments.
Figure 4—figure supplement 3
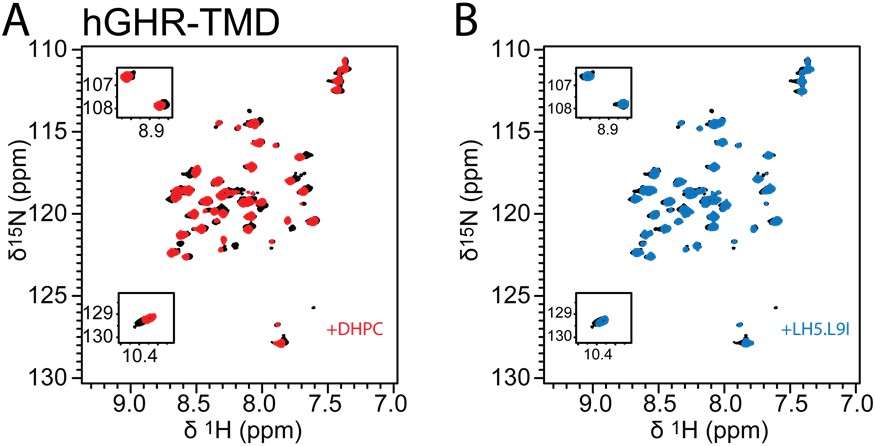
LH5-9LI does not change the growth hormone receptor monomer-dimer equilibrium.
(A) 1H,15N- HSQC spectra of hGHR238-274 at 60-times and 120-times molar excess of DHPC are depicted in black and red, respectively. (B) 1H,15N- HSQC spectrum of hGHR238-274 at 60-times molar excess of DHPC is depicted in black and the 1H,15N- HSQC spectrum of hGHR238-274 with LH5-L9I in a ratio of LH5-L9I:hGHR:DHPC of 2:1:60 in blue.
Figure 5
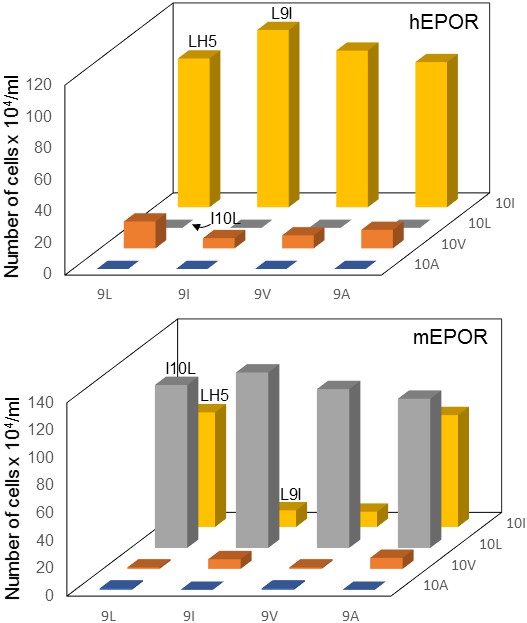
Mutational analysis of traptamer at positions 9 and 10.
BaF3 cells expressing the hEPOR (upper panel) or the mEPOR (lower panel) were infected with MSCVp expressing wild-type LH5 or mutants containing all combinations of isoleucine, leucine, valine, and alanine at positions 9 and 10. After puromycin selection, cells were tested for IL-3 independence. The right axis indicates the residue at position 10. The horizontal axis indicates the residue at position 9. The vertical axis shows the number of live cells six days after IL-3 removal. The bars representing cells expressing LH5, LH5-L9I, and LH5-I10L are labeled. The bars show mean ± SEM for three independent experiments. The results for the LH5 sample were significantly different (p≤0.005, as assessed by two-tailed Student’s t-test) compared to cells expressing each mutant, except for the mutants with isoleucine at position 10 (top panel) or leucine at position 10 and LH5-L9A (bottom panel).
Figure 6
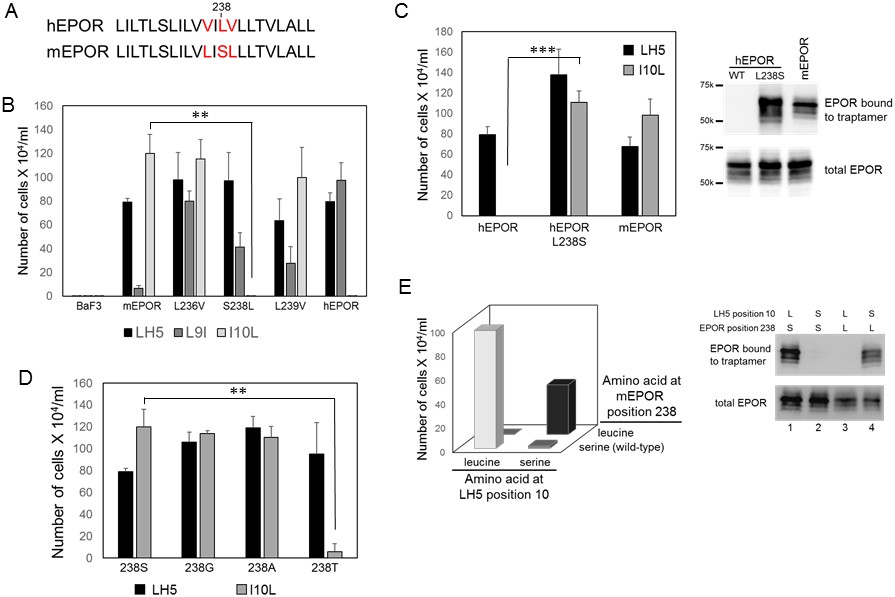
Identification of amino acids that mediate complex formation between the traptamers and the EPOR.
(A) Sequence comparison of hEPOR and mEPOR TMD (residue 226–247). Sequence differences between mEPOR and hEPOR are shown in red. (B) BaF3 cells or BaF3 cells expressing the wild-type mEPOR, the wild-type hEPOR, or the mEPOR containing the indicated mutation were infected with retroviruses expressing the indicated traptamer. After puromycin selection, the cells were tested for IL-3 independence. The number of live cells was counted six days after IL-3 removal. The bars show mean ± SEM for three independent experiments. Statistical significance of differences between cells expressing wild-type mEPOR and cells expressing a mutant mEPOR were evaluated by two-tailed Student’s t-test with unequal variance (**p≤0.02). (C) Left panel. BaF3 cells expressing wild-type hEPOR, L238S hEPOR mutant, or mEPOR were infected with retrovirus expressing FLAG-tagged LH5 or LH5-I10L. After puromycin selection, cells were tested for IL-3 independence. The number of live cells was counted six days after IL-3 removal is shown. The bars show mean ± SEM for three independent experiments. Statistical significance of differences between cells expressing wild-type hEPOR and cells expressing hEPOR/L238S were evaluated by two-tailed Student’s t-test with unequal variance (***p≤0.005). Right panel. Extracts prepared from cells in left panel were immunoprecipitated with anti-FLAG antibody and immunoblotted with anti-HA antibody to detect EPOR associated with traptamer (top panel), or directly immunoblotted with anti-HA antibody to detect total EPOR (bottom panel). (D) BaF3 cells expressing wild-type mEPOR (238S) or the indicated mEPOR mutant were infected with retrovirus expressing LH5 or LH5-I10L. After puromycin selection, IL-3 independence was tested. The number of live cells was counted six days after IL-3 removal. The bars show mean ± SEM for three independent experiments. Statistical significance of differences between cells expressing wild-type mEPOR and cells expressing an mEPOR mutant were evaluated by two-tailed Student’s t-test with unequal variance (**p≤0.02). (E) Left panel. BaF3 cells co-expressing FLAG-tagged LH5-I10L or LH5-I10S (horizontal axis) and the wild-type mEPOR or S238L mEPOR mutant (right axis) were tested for IL-3-independence. The vertical axis shows the number of live cells six days after IL-3 removal. The parental combination (mEPOR/LH5-I10L) is shown in light grey bar; the compensating combination (mEPOR S238L/LH5-I10S) is shown in black bar. The bars show mean ± SEM for three independent experiments. Statistical significance of differences between cells co-expressing both mutants and cells expressing either single mutant was p≤0.05 as evaluated by two-tailed Student’s t-test with unequal variance. Right panel. Extracts prepared from cells in left panel were immunoprecipitated with anti-FLAG antibody and immunoblotted with anti-HA antibody to detect EPOR associated with traptamer (top panel), or directly immunoblotted with anti-HA antibody to detect total EPOR (bottom panel).
Figure 7 with 2 supplements

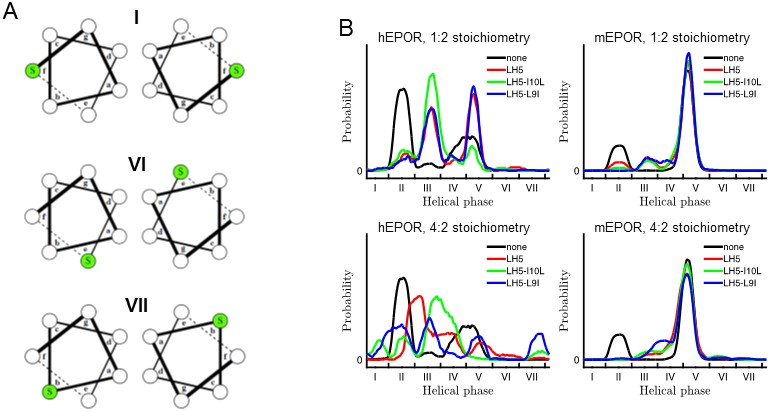
Molecular modeling of the effect of the traptamers on the EPOR TMD.
(A) Helical phase distributions of hEPOR (left) and mEPOR (right) TMD dimers in the absence of traptamer (black lines) or in 2:2 stoichiometry with LH5 (red lines), LH5-L9I (blue lines) or LH5-I10L (green lines). The range of the x-axis is from −180° to 180°, with labeled ticks denoting phase boundaries corresponding to canonical coiled-coil heptad registers, labeled I through VII. (B) Helical wheel diagrams of mEPOR TMD dimers corresponding to the basal states II, IV, and V, as well as state III, which is appreciably populated only in the presence of traptamers. Ser238 is colored green. (C) A diagram of state III (gray and blue circles represent EPOR TMDs and traptamers, respectively), showing the helical phase distributions from simulations of hEPOR (left panel) and mEPOR (right panel) TMD dimers in complex with LH5. Phase distributions are plotted in polar coordinates (rosette plots): each dot representing a bin in the histogram, with its location around the circle indicating the phase value and its distance from the helix center denoting the frequency of the bin (points farther from the center are more frequent).
Figure 7—figure supplement 1
Helical wheel diagrams and helical phase distributions of mEPOR TMD dimers.
(A) Helical wheel diagrams of mEPOR TMD dimers corresponding to states I, VI, and VII. Ser238 is colored green. (B) Helical phase distributions of hEPOR (left) and mEPOR (right) TMD dimers in the absence of traptamer (black lines) or with LH5 (red lines), LH5-L9I (blue lines) or LH5-I10L (green lines). Top and bottom panels correspond to 1:2 and 4:2 traptamer:EPOR TMD stoichiometries, respectively. The format of the plots and helical register definitions are the same as in the main-text Figure 7.
Figure 7—figure supplement 2

Time to approach symmetry.
The figure shows plots of as a function of (expressed in units of time). In all cases, the relationship fits very well to a sum of two decaying exponentials. The time constants of the slow and fast exponentials varied relatively little from system to system, indicating that very fast averaging (time constant on the order of 1 ns) is followed by a relatively slower symmetrization process (time constant on the order of 100 ns). Although the length of each independent simulation is too short to observe complete arrival to symmetry (i.e., the plots never reach the value ), all of the simulation data are entirely consistent with full symmetry arising on time scales that are inaccessible to NMR experiments.
Figure 8
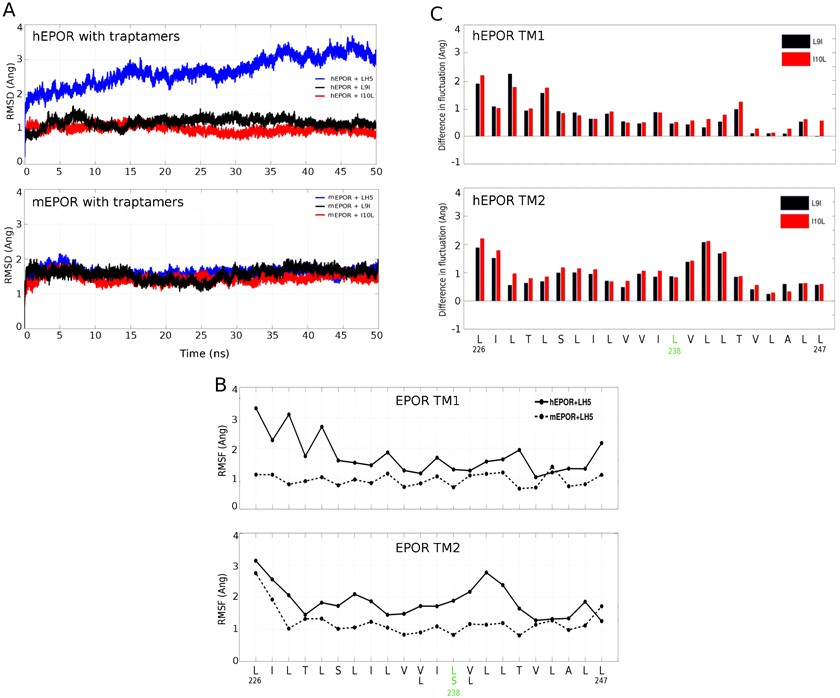
All-atom simulations of the EPOR/traptamer complexes.
(A) RMSD profiles for the EPOR TMDs for the various receptor and traptamer systems. RMSD values for hEPOR (top panel) and mEPOR (bottom panel) over time in the presence of LH5 (blue line), LH5-L9I (black), and LH5-I10L (red) were computed for the backbone atoms within the EPOR TMD with respect to their starting structures. (B) Per-residue RMSF profiles of the hEPOR (solid line) and mEPOR (dashed line) TMDs in the presence of LH5 over 50 ns of production run. Comparisons for each TMD in the dimer are depicted in separate panels. The membrane-spanning sequence of hEPOR (L226-L247) is shown below the bottom panel, with the residues differing in the mEPOR shown below it. Leu238 and Ser238 in hEPOR and mEPOR, respectively, are highlighted in green. (C) Difference in per-residue RMSF for the TMDs of the hEPOR in presence of the mutant traptamers relative to the hEPOR-LH5 traptamer complex (computed over 50 ns of production run). Differences between LH5 and LH5-L9I and between LH5 and LH5-I10L are plotted as black and red bars, respectively, and depicted in separate panels for each hEPOR TMD. The membrane-spanning sequence of the hEPOR (L226-L247) is shown below the bottom panel with Leu238 highlighted in green.
Additional files
-
Transparent reporting form
- https://doi.org/10.7554/eLife.27701.019
Download links
A two-part list of links to download the article, or parts of the article, in various formats.
Downloads (link to download the article as PDF)
Open citations (links to open the citations from this article in various online reference manager services)
Cite this article (links to download the citations from this article in formats compatible with various reference manager tools)
Single methyl groups can act as toggle switches to specify transmembrane Protein-protein interactions
eLife 6:e27701.
https://doi.org/10.7554/eLife.27701


