Loss of foxo rescues stem cell aging in Drosophila germ line
- University of Washington, United States
- University of Washington, School of Medicine, United States
- Universidade Federal do Rio de Janeiro, Brazil
Figures
Figure 1 with 1 supplement
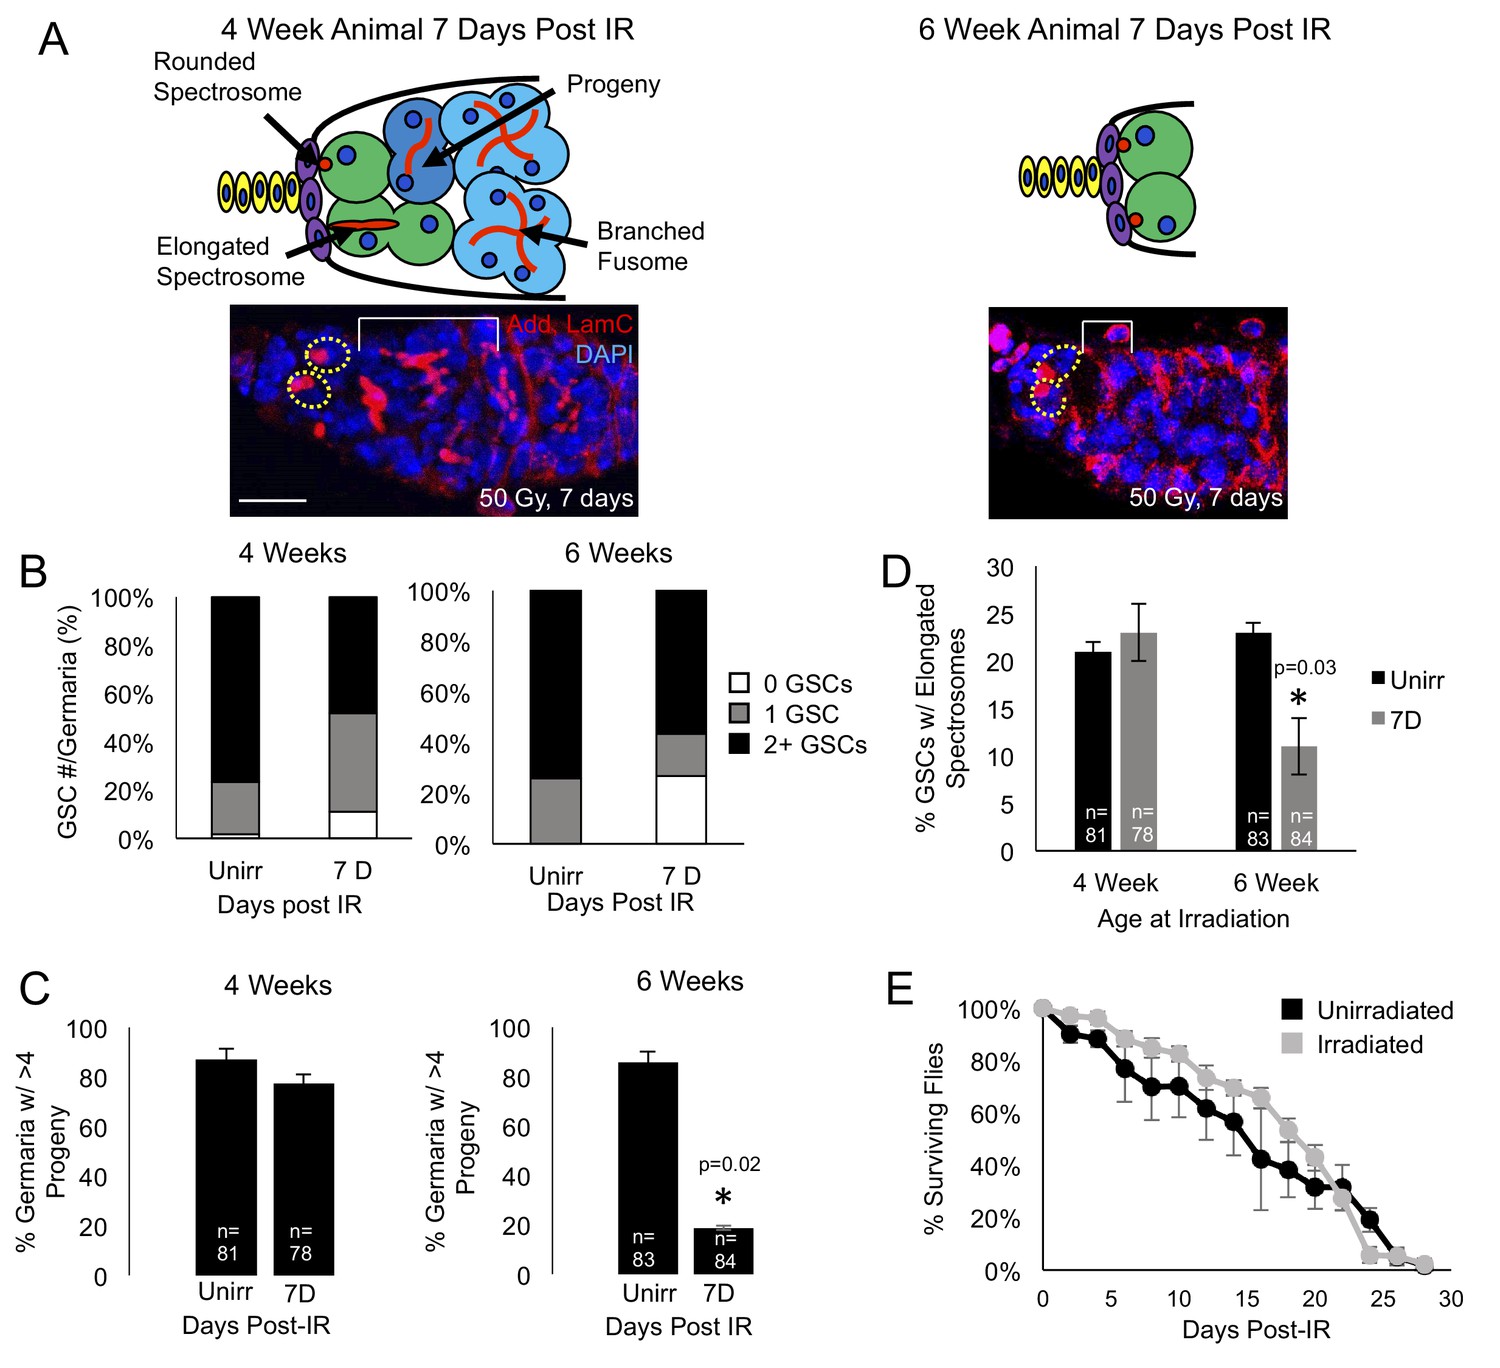
Aging GSCs survive exposure to IR, but do not regenerate the germarium.
(A) Top: Schematic diagrams of 4 week old vs. 6 week old germaria one week following IR. Terminal filament cells, yellow; cap cells, purple; germline stem cells, green, cystoblasts, dark blue; cysts, light blue. Bottom: representative images of 4 week old (left) and 6 week old (right) germaria stained for adducin and laminC (red) and DAPI. Germline stem cells (dotted yellow line) are visible in both 4 week old and 6 week old germaria, however, branched fusomes are only seen in the 4 week old germaria (white bracket). Scale bar = 10 μm. (B) Quantification of the number of GSCs/germaria in 4 week old (left) and 6 week old (right) germaria, before and one week following IR. White, 0 GSCs, grey, 1 GSC, black, 2 + GSCs. (C) Quantification of the percent of germaria with 4 or more progeny in 4 week old (left) and 6 week old (right) flies before and after IR. In 4 week old animals, there is no significant difference in the percent of germaria with 4 or more progeny, while in 6 week old animals, there is a decline in the percentage of germaria with 4 or more progeny after IR. (D) Quantification of the percentage of GSCs with elongated spectrosomes in 4 week old (left) and 6 week old (right) animals. While there is not a significant difference in the percentage of elongated spectrosomes before and one week following IR in 4 week old animals, there is a decrease in the percentage of GSCs with elongated spectrosomes one week following IR in 6 week old animals. (E) Survival curve of animals after 6 weeks, comparing unirradiated (black) and irradiated (grey) flies. There was no significant difference in the survival time of animals between irradiated and unirradiated flies.
Figure 1—figure supplement 1

Decreased fertility following irradiation in old flies.
(A) Age matched vials show that young females produce pupae after recovery from irradiation (left), while old females do not produce pupae following irradiation (right.) (B) Bar plot of the average number of progeny per female per vial, reflecting a week’s worth of hatching.
Figure 2
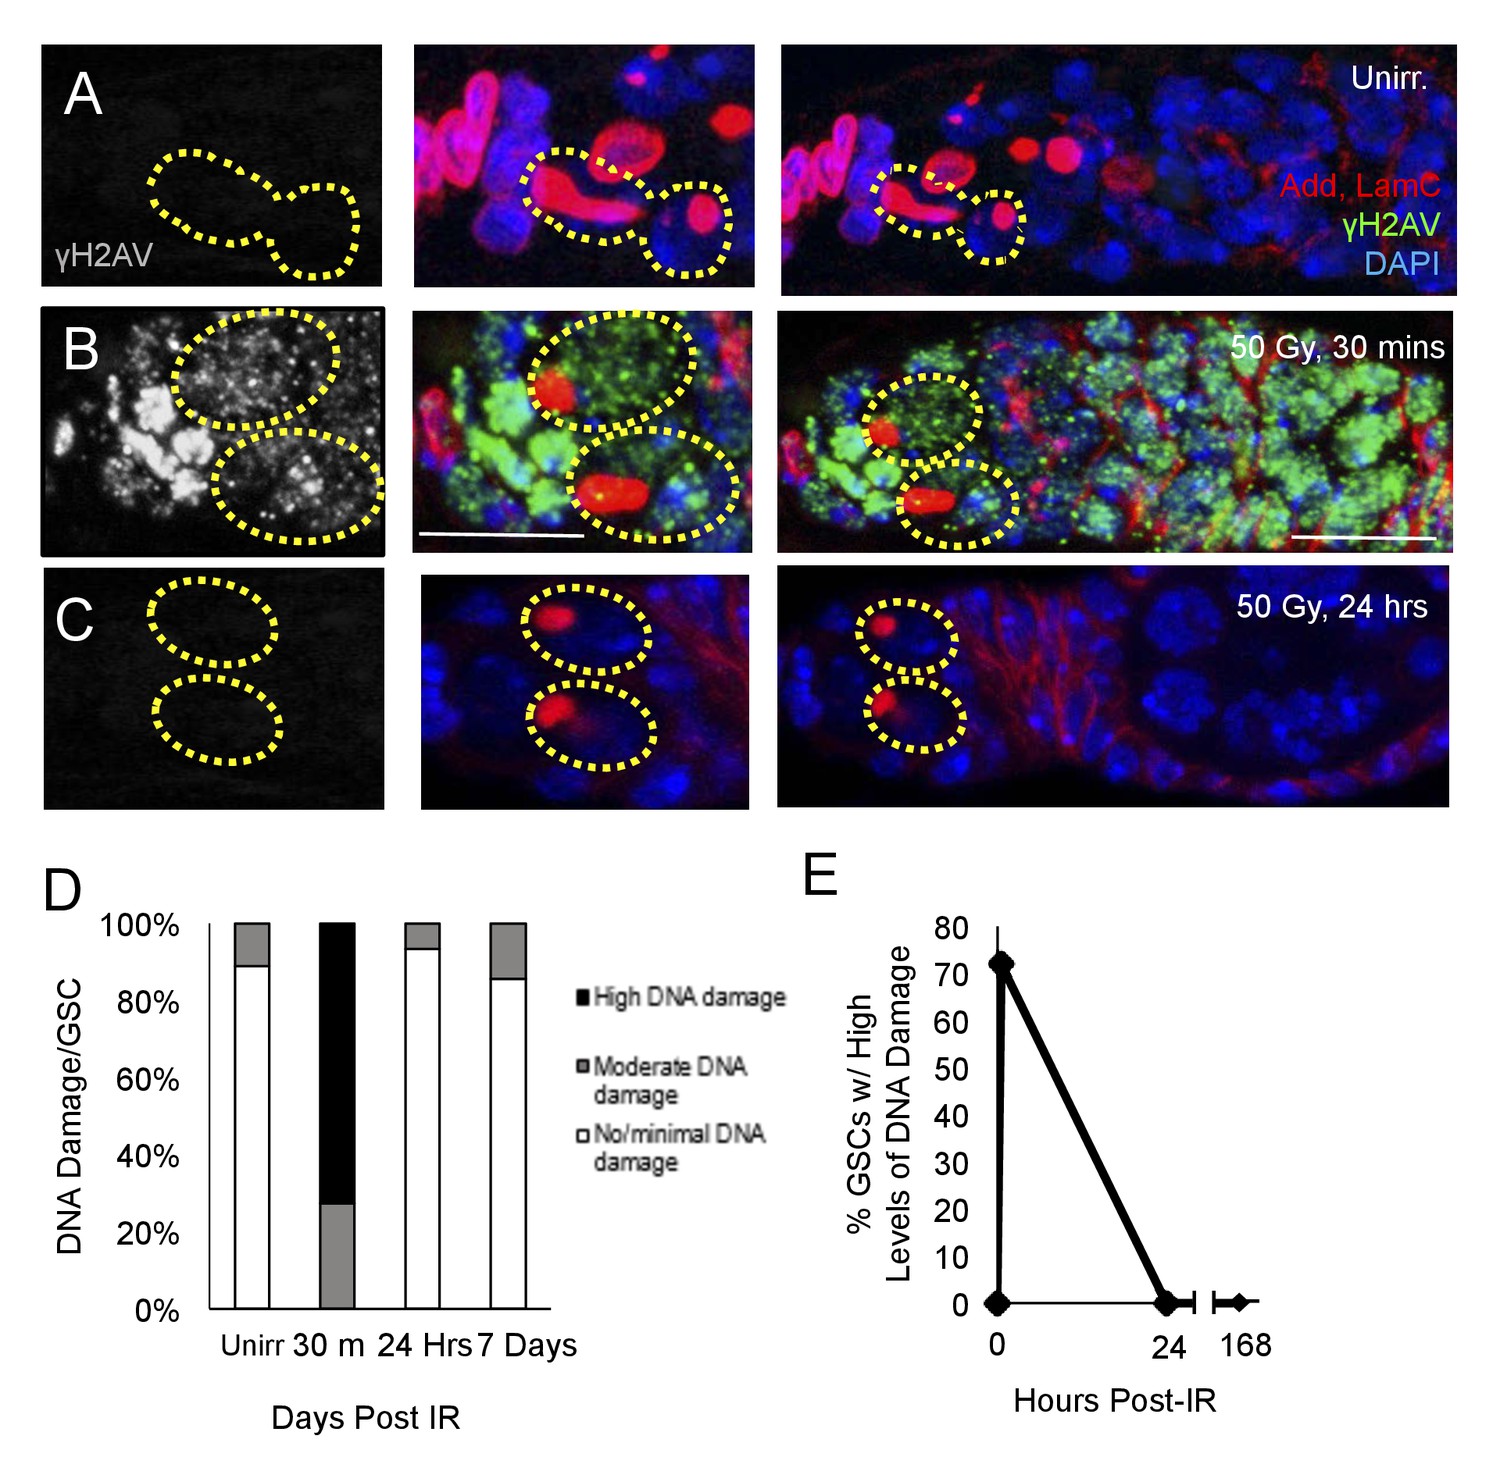
DNA damage repair concludes within 24 hr in aging animals.
(A-C) Representative images of a 6 week old germaria stained for adducin and lamC (red), γH2AV (green), and DAPI. (A) Unirradiated 6 week old germaria showing examples of GSCs with no γH2AV staining. (B) 6 week old germaria, 30 min post-IR. Scale bar = 10 μm. (C) 6 week old germaria, 24 hr post- IR. (D) Stacked bar plot showing percentage of GSCs with low (white), medium (grey), or high (black) levels of γH2AV staining following IR. High levels of DNA damage peak 30 min following IR and return to baseline by 24 hr. (E) Line graph showing percentage of GSCs with high levels of γH2AV staining over time.
Figure 3 with 1 supplement
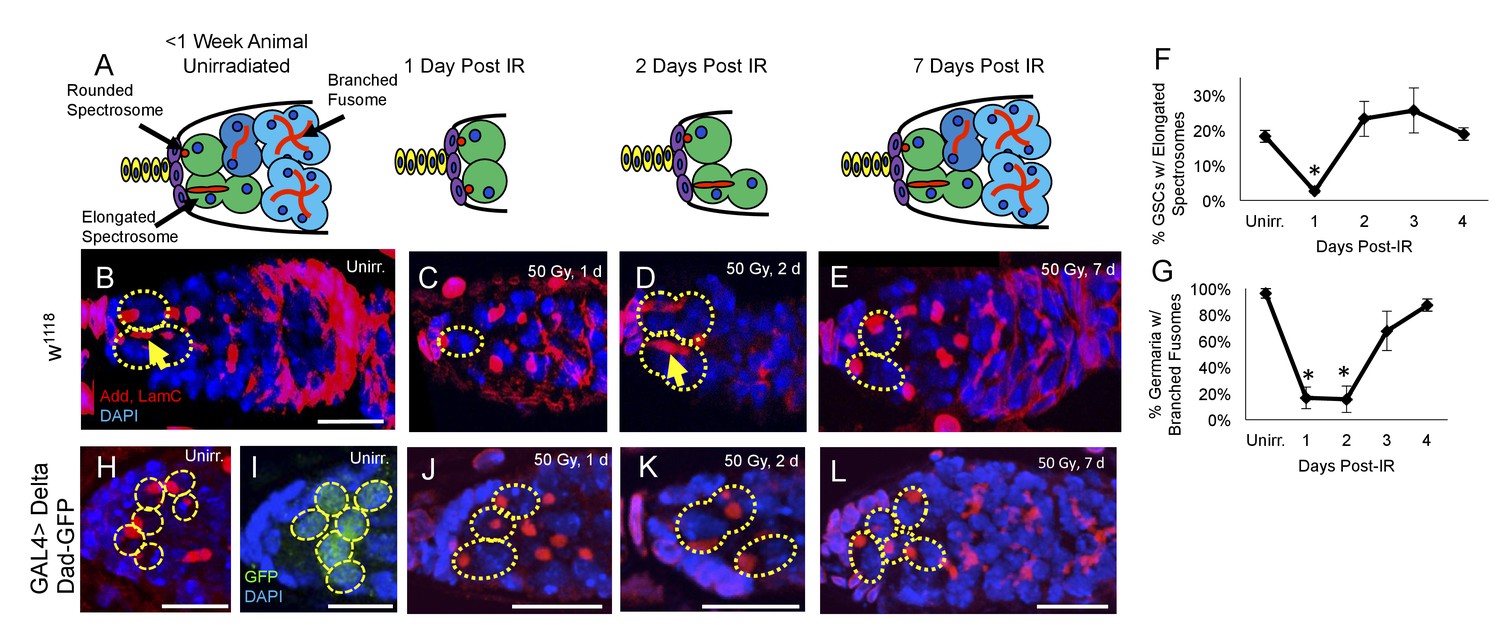
Young GSCs enter a brief period of IR-induced quiescence before returning to the cell cycle.
(A) Schematic of the progression of cell loss and recovery following exposure to IR in young animals. Terminal filament cells, yellow; cap cells, purple; germline stem cells, green, cystoblasts, dark blue; cysts, light blue. (B-E) Representative images of young w1118 germaria stained for adducin and lamC (red) and DAPI (blue). GSCs are indicated by the presence of a spectrosome and DAPI staining (dotted yellow line); elongated spectrosomes indicated with yellow arrow. Scale bar = 10 µm. B. Unirradiated germarium. (C) Germarium 1 day post-IR (50 Gγs). (D) Germarium 2 days post-IR. (E) Germarium 7 days post-IR. (F) Line graph of percentage of GSCs with elongated spectrosomes for days 1–4 post-IR. There is a significant decrease of percentage of GSCs with elongated spectrosomes at 1 day post-IR (3 biological experiments, mean ± s.e.m., *p<0.05, ANOVA). (G) Line graph of the percentage of germaria with branched fusome for days 1-4 post IR. (H) Representative unirradiated germaria of nos-Gal4 > Delta flies, showing increased niche size and supernumerary GSCs. (I) Unirradiated nos-Gal4 > Delta; Dad-GFP germaria. (J) nos-Gal4 > Delta germaria 1 day post-IR. (K) nos-Gal4 > Delta germaria 2 days post-IR. (L) nos-Gal4 > Delta germaria one week post-IR showing a fully regenerated germarium.
Figure 3—figure supplement 1
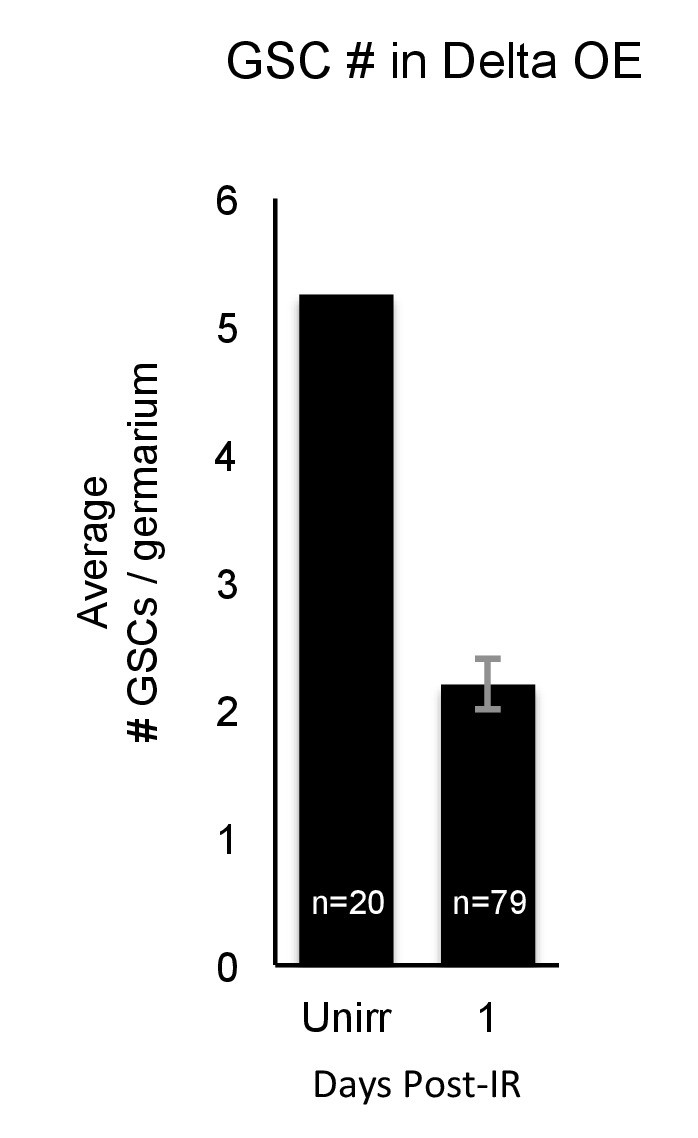
Extranumerary GSCs in Delta overexpression are reduced after IR.
Bar plot of the average number of GSCs before and one day after IR in nos-Gal4 > Delta flies, reflecting GSC loss one day after IR.
Figure 4

DNA damage repair concludes by 24 hr in young flies A-H.
Representative images of young germaria stained for γH2AV alone (grey) or adducin/lamC (red), γH2AV (green), and DAPI. (A) Unirradiated GSCs. γH2AV channel alone (left), color merge (right). Scale bar = 5 µm (B) Unirradiated germarium. Scale bar = 10 µm (C) GSCs 30 min post-IR. γH2AV channel alone (left); color merge (right) (D) Germarium 30 min post-IR. (E) GSCs 12 hr post-IR. γH2AV channel alone (left); color merge (right). (F) Germarium 12 hr post-IR. (G). GSCs 24 hr post-IR. γH2AV channel alone (left); color merge (right). (H) Germarium 24 hr post-IR. (I) Stacked bar plot showing percentage of GSCs with low (white), medium (grey), or high (black) levels of γH2AV staining following IR. High levels of DNA damage peak 30 min following IR and return to baseline by 24 hr. (J) Line graph showing percentage of GSCs with high levels of γH2AV staining over time.
Figure 5 with 2 supplements
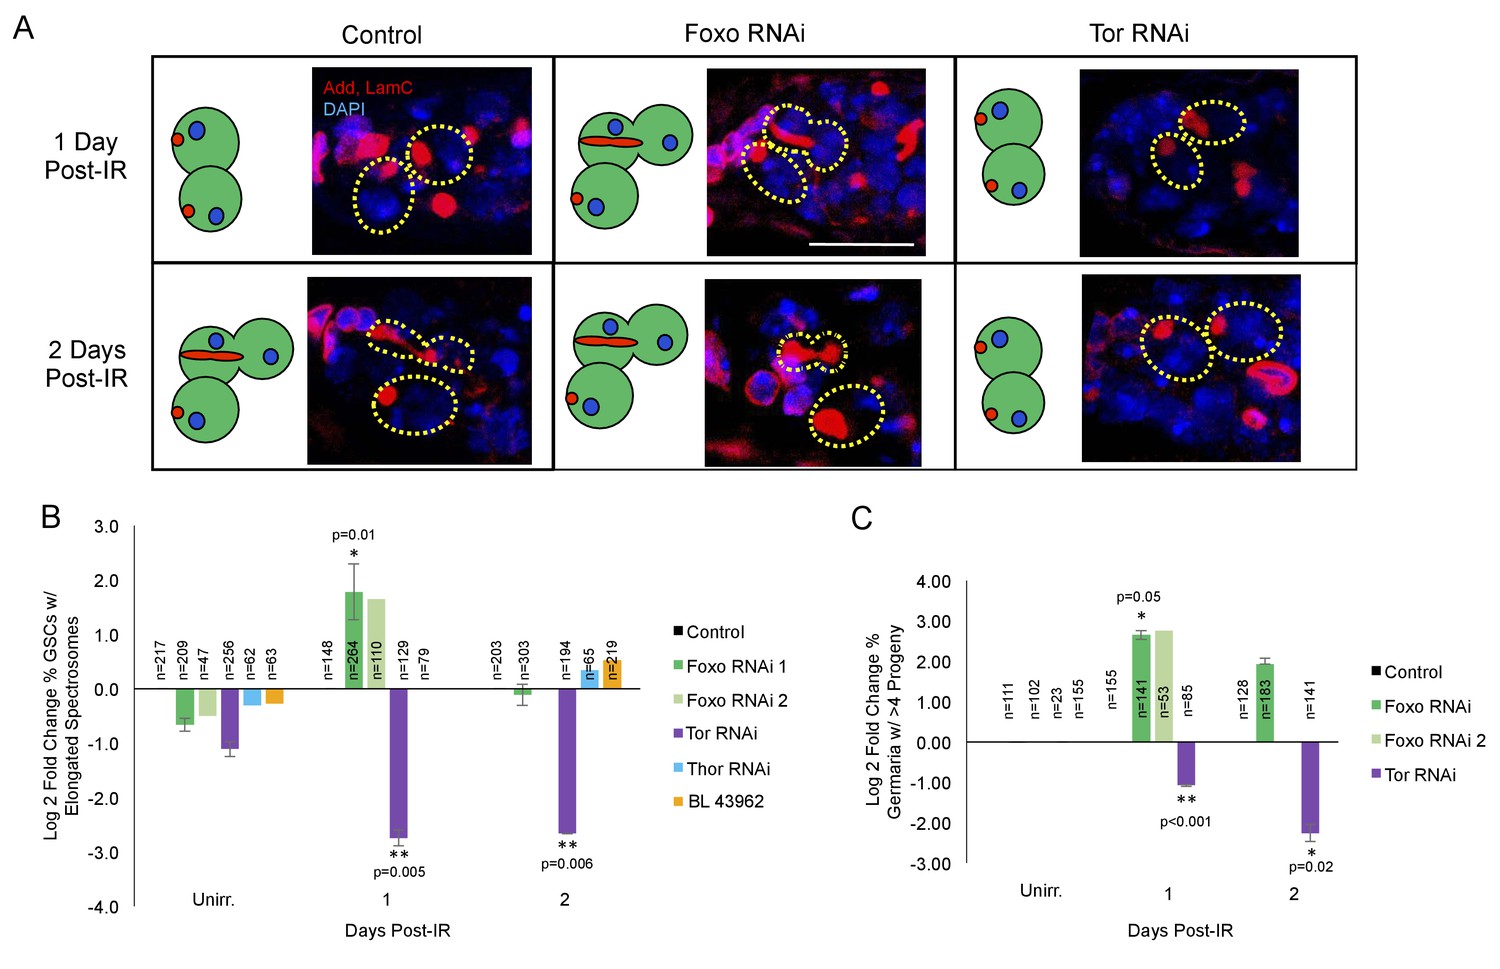
foxo and Tor regulate GSCs’ cell cycle exit and reentry.
(A) Representative images of germaria stained for adducin and lamC (red) and DAPI (blue). Left top: Control germaria, 1 day post-IR. Left bottom: Control germaria, 2 days post-IR. Middle top: foxo RNAi germaria, 1 day post-IR. Scale bar = 10 µm Middle bottom: foxo RNAi germaria, 2 days post-IR. Right top: Tor RNAi germaria, 1 day post-IR. Right bottom: Tor RNAi germaria, 2 days post-IR. (B) Bar plot of the percentage of GSCs with elongated spectrosomes up to two days post-IR for foxo, Tor, Thor and control RNAi lines, plotted as log2 fold change compared to control. foxo RNAi inhibits the ability of GSCs to exit the cell cycle. Tor RNAi inhibits the ability of GSCs to reenter the cell cycle. (C) Bar plot of the percentage of germaria with more than four progeny up to two days post IR for foxo, Tor, Thor and control RNAi lines, plotted as log2 fold change compared to control.
Figure 5—figure supplement 1
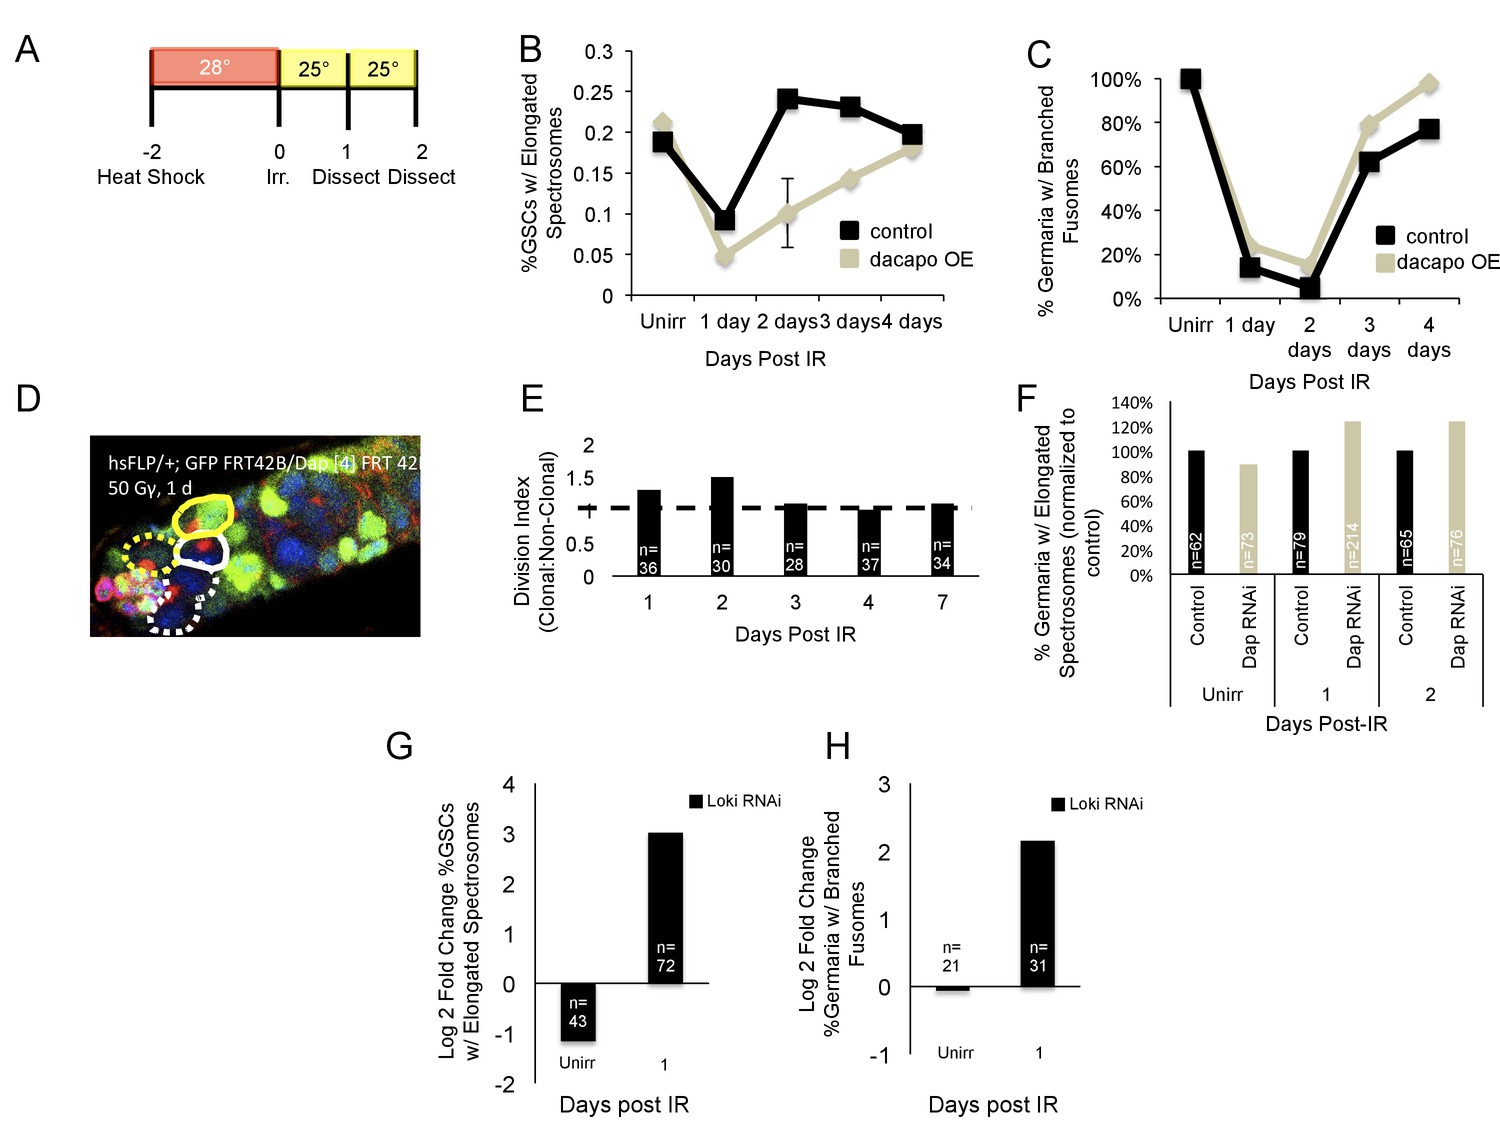
IR-induced quiescence occurs at the G2 checkpoint.
(A) Timeline of heat shock experiments. Flies were heat shocked 2 days pre-IR (Day −2) and incubated at 28°. Post-IR, flies were kept at 25° until the time of dissection. (B) Line graph of the percentage of GSCs with elongated spectrosomes in control (black) and dacapo overexpression hs-Dap-7-7 (grey) flies from 1 to 4 days post-IR. Dacapo overexpression significantly reduced the percentage of GSCs with elongated spectrosomes at 2 days post-IR. (C) Line graph of the percent of germaria with branched fusomes from 1 to 4 days post-IR. There was no significant difference between control (black) and dacapo overexpression (grey) animals. (D) Representative image of a clonal GSC (yellow dashed line) and clonal progeny (yellow line) and a non-clonal GSC (white dashed line) and non-clonal progeny (white line.). (E) Barplot of the division indices of clonal dacapo mutant GSCs. (F) Bar plot of the percentage of GSCs with elongated spectrosomes in control (black) and dacapo RNAi (grey) post-IR, normalized to control. (G) Bar plot of the log2 fold change in percentage of GSCs with elongated spectrosomes of loki RNAi normalized to control. (H) Bar plot of the log2 fold change in percentage of germaria with branched fusomes of loki RNAi normalized to control.
Figure 5—figure supplement 2
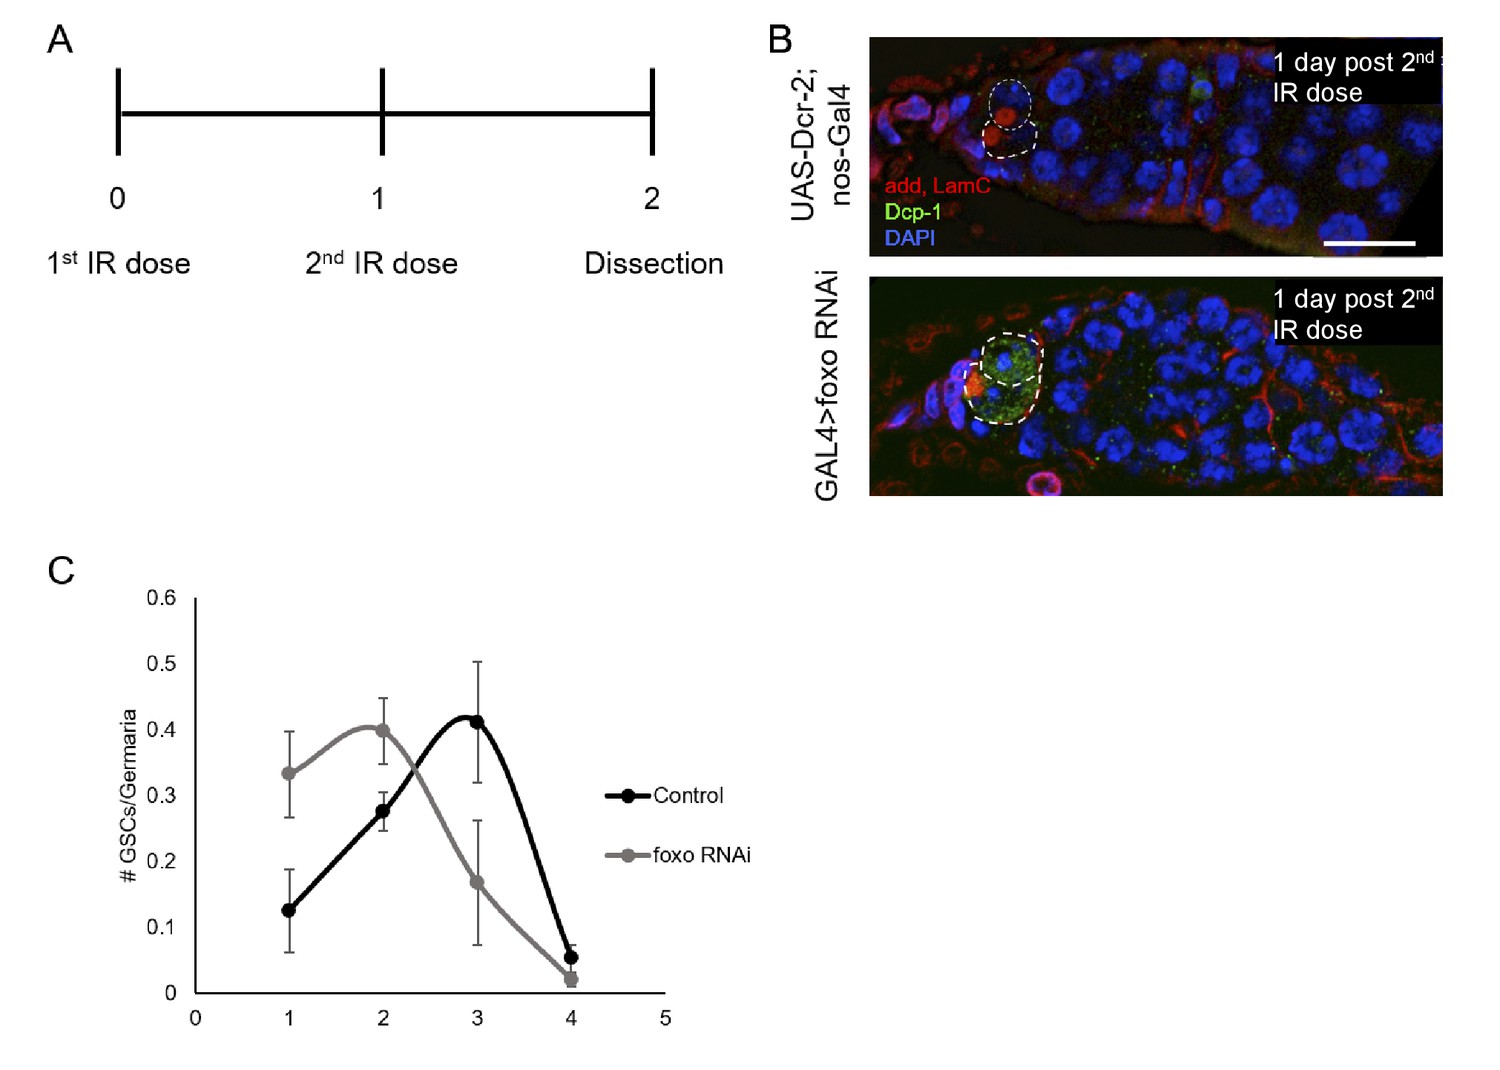
Loss of foxo radiosensitizes GSCs.
(A) Schematic representation of double IR experimental paradigm. Flies were given a first dose (50Gys) of ionizing radiation (Day 0) followed by a second dose one day later (Day 1). Flies were dissected one day following the second IR dose (Day 2). (B) Top: Control germaria 1 day post second IR dose. Scale bar = 10 µm Bottom: nos-Gal4 > foxo RNAi germaria 1 day post second IR dose. nos-Gal4 > foxo RNAi GSCs are positive for Death caspase 1 (Dcp-1) following second IR dose. (C) Number of GSCs per germarium one day following second IR dose in control (black) and nos-Gal4 > foxo RNAi (grey) germaria.
Figure 6
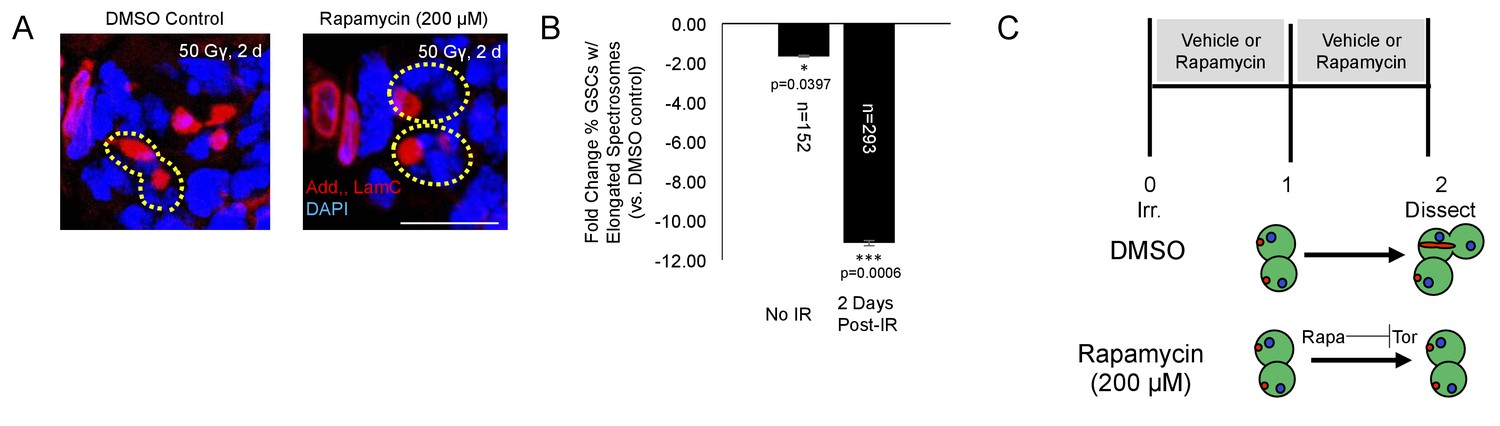
Tor activity is required for cell cycle reentry following IR.
(A) Representative images of GSCs from a fly fed vehicle control (left) or rapamycin (200 μM, right) stained for adducin/lamC (red) and DAPI (blue) two days post-IR. Scale bar = 10 µm (B) Bar plot showing percentage of GSCs with elongated spectrosomes two days post IR. Flies fed rapamycin had decreased rates of GSC division compared to flies fed vehicle control. The effect of rapamycin on GSC division was much more pronounced two days post IR. (C) Top:Experimental paradigm. Flies were irradiated at Day 0 and fed either vehicle control or Rapamycin for 48 hr post-IR. Ovaries were dissected 2 days post-IR and analyzed. Bottom: When rapamycin represses Tor activity, there is a decrease in the ability of GSCs to exit quiescence.
Figure 7
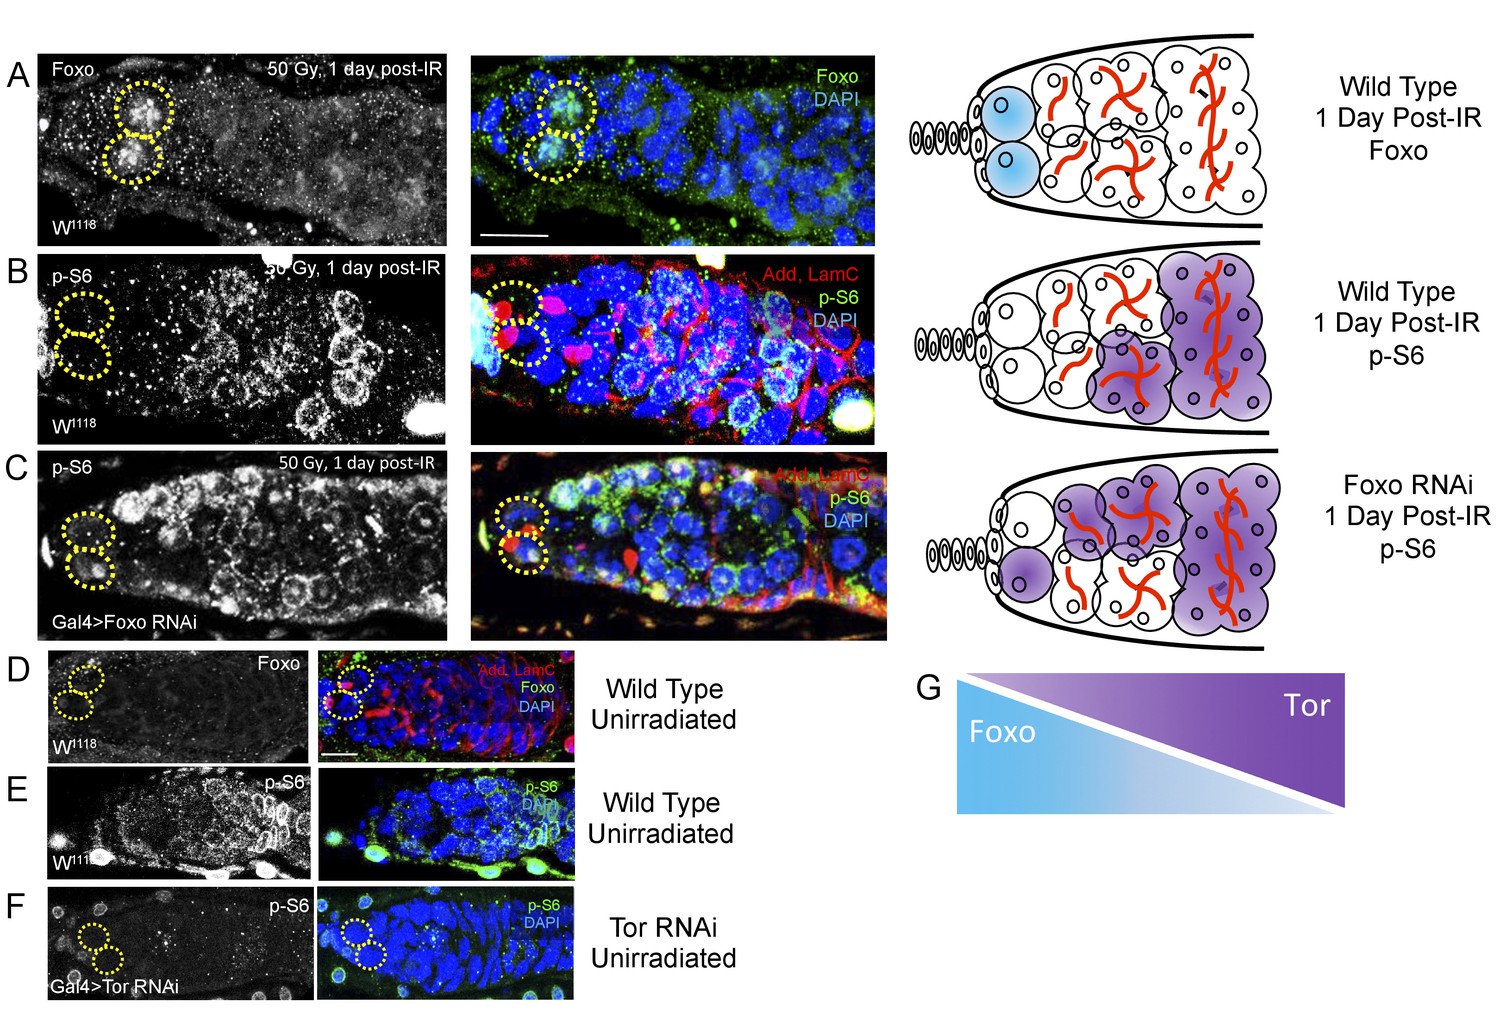
Foxo and Tor activity are spatially segregated.
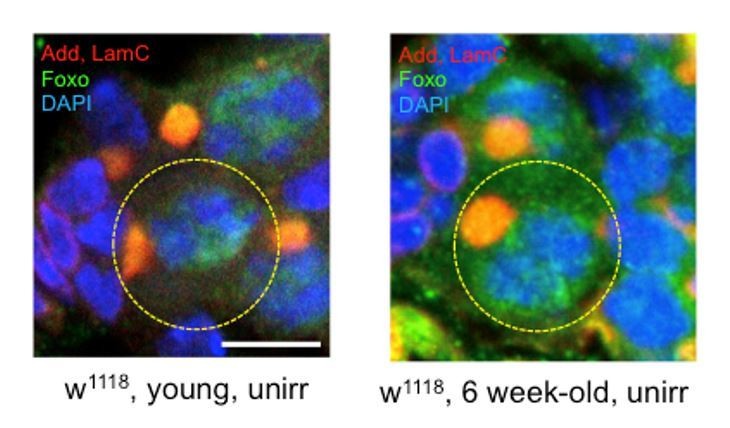
(A) Foxo levels increase in GSCs one day post-IR. Scale bar = 10 µm (B) Phosphorylated S6 (p–S6) and Foxo signals have opposite gradients throughout the germarium. Levels of p-S6 increase in the anterior region of the germarium 1 day post-IR, and signaling returns to baseline at 2 days post-IR. (C) P-S6 staining moves closer to the anterior tip of the germaria in Foxo deficient flies 1 day post-IR. (D) Levels of Foxo are low in wild type, unirradiated flies. Scale bar = 10 µm (E) p-S6 staining is localized to the posterior end of the germarium in wild type, unirradiated flies. (F) In Tor RNAi flies, there was no detectable germline p-S6 staining. (G) Diagrammatic representation of Foxo and Tor gradients throughout the germarium. Foxo and Tor levels are elevated, respectively, in the anterior and posterior region of the germarium.
Figure 8 with 1 supplement
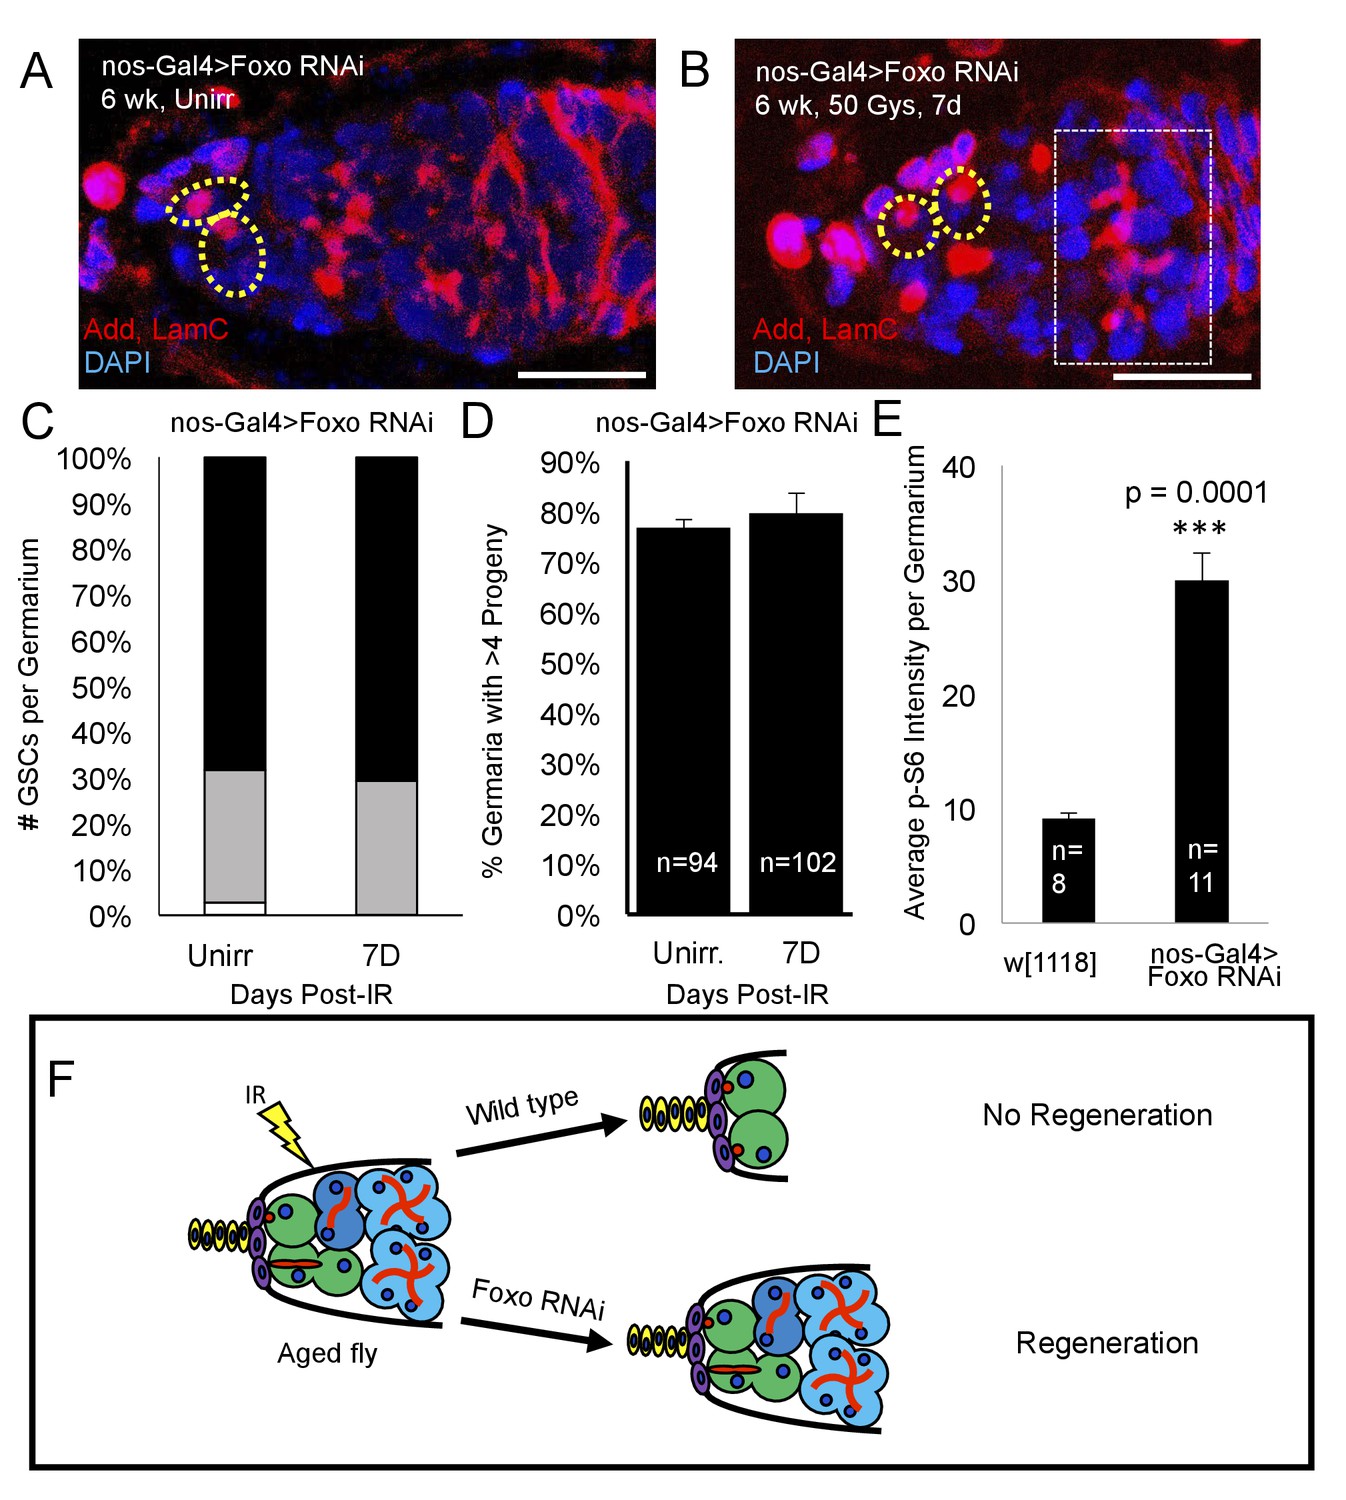
Loss of foxo rescues age-related regeneration defect.
(A) Representative image of a 6 week old nos-Gal4 > foxo RNAi germarium. (B) Representative image of a 6 week old nos-Gal4 > foxo RNAi germarium one week post-IR, showing a fully regenerated germline with a large 8 cell cyst (dotted white rectangle). (C) Bar graph quantifying the number of GSCs per germaria before and one week following irradiation, showing there is no difference in the number of GSCs per germaria. (D) Bar graph quantifying the percentage of germaria with four or more progeny, indicating a fully regenerated germline. (E) Bar plot showing average p-S6 intensity values for the germaria of 6 week-old w1118 and nos-Gal4 > foxo RNAi flies, showing an increase of p-S6 levels in foxo RNAi flies. (F) Schematic demonstrating the difference between a wild type aging fly one week following IR and a foxo RNAi fly one week following IR. While the wild type fly in incapable of regenerating the germaria, knockdown of foxo rescues this defect.
Figure 8—figure supplement 1
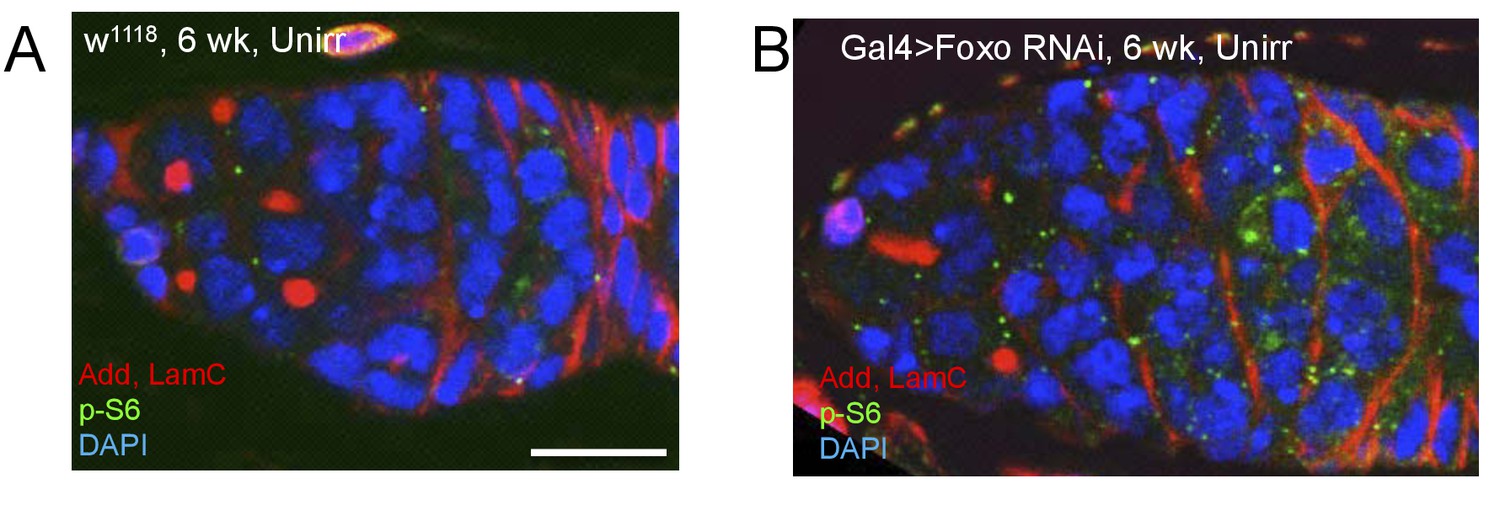
Foxo represses Tor activity during aging.
(A) Representative image of p-S6 staining in w1118, 6 week-old unirradiated germaria. Scale = 10 μm (B) Representative image of p-S6 staining in Gal4 > Foxo RNAi, 6 week-old unirradiated germaria showing an increase in p-S6 levels. Scale = 10 μm. Three biological repeats were performed; the quantification showed in (Figure 8E) was performed using one repeat.
Figure 9

Proposed Mechanism.
In young flies, injury, such as exposure to ionizing radiation, leads to Foxo activation, which represses Tor activity, pushing the GSCs into a state of protective quiescence. Following deactivation of Foxo post-IR, Tor activity allows GSCs to reenter the cell cycle and regenerate the germline. In aging flies, increased Foxo activity prevents Tor activation and GSCs reentry in the cell cycle.
Author response image 1
Additional files
-
Source data 1
Excel file compiling source data for the most relevant experiments.
Data are arranged by type of experiment and then further organized by genotypes, time points and replicate number.
- https://doi.org/10.7554/eLife.27842.017
-
Supplementary file 1
(A) Table showing the number of GSCs with elongated spectrosomes expressed as mean percent values (±SE). (B) Table showing the number of germaria with branched fusomes expressed as mean percent values (±SE).
- https://doi.org/10.7554/eLife.27842.018
-
Transparent reporting form
- https://doi.org/10.7554/eLife.27842.019
Download links
A two-part list of links to download the article, or parts of the article, in various formats.
Downloads (link to download the article as PDF)
Open citations (links to open the citations from this article in various online reference manager services)
Cite this article (links to download the citations from this article in formats compatible with various reference manager tools)
Loss of foxo rescues stem cell aging in Drosophila germ line
eLife 6:e27842.
https://doi.org/10.7554/eLife.27842


