Signalling through AMPA receptors on oligodendrocyte precursors promotes myelination by enhancing oligodendrocyte survival
- University College London, United Kingdom
- Iwate Medical University, Japan
- University of Heidelberg, Germany
- Deutches Krebforschungzentrum, University of Heidelberg, Germany
Figures
Figure 1
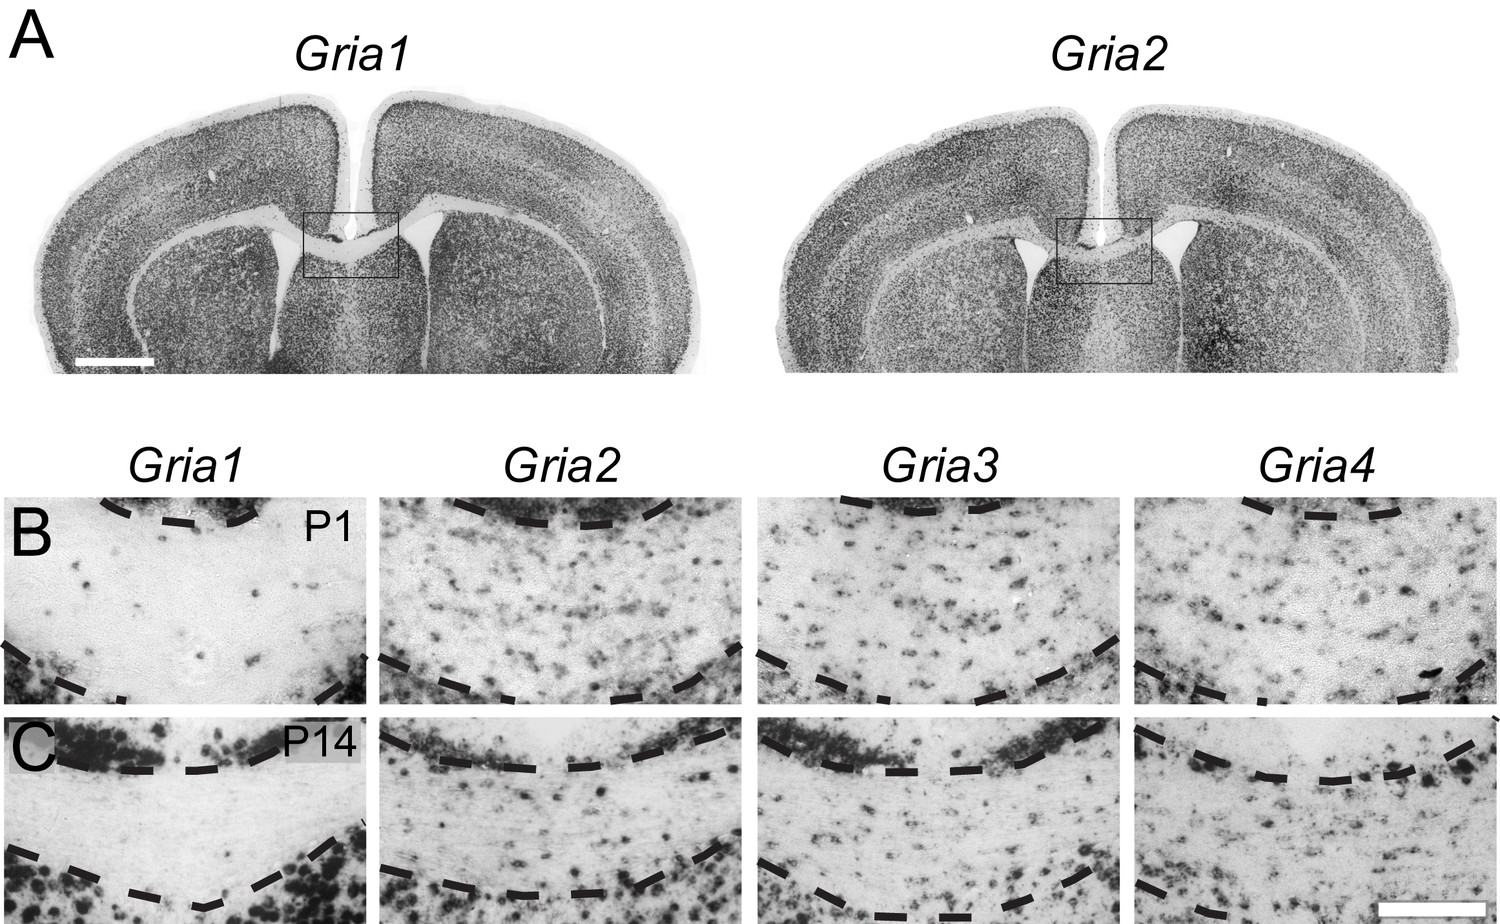
GluA2–4, but not GluA1 are expressed by presumptive OL lineage cells in the corpus callosum.
(A) Low-magnification images of Gria1 and Gria2 ISH at P14. The corpus callosum (rectangles) is shown at higher magnification for Gria1-4 (left to right) at P1 (B) and P14 (C). Gria2, Gria3 and Gria4 are expressed in many cells with small cell bodies - putative OL lineage cells - in the corpus callosum. The few Gria1-positive cells visible in white matter are misplaced neurons (NeuN-positive, not shown). Many forebrain neurons in grey matter strongly express Gria1-4. Scale bars: (A) 400 μm, (B–C) 50 μm.
Figure 2
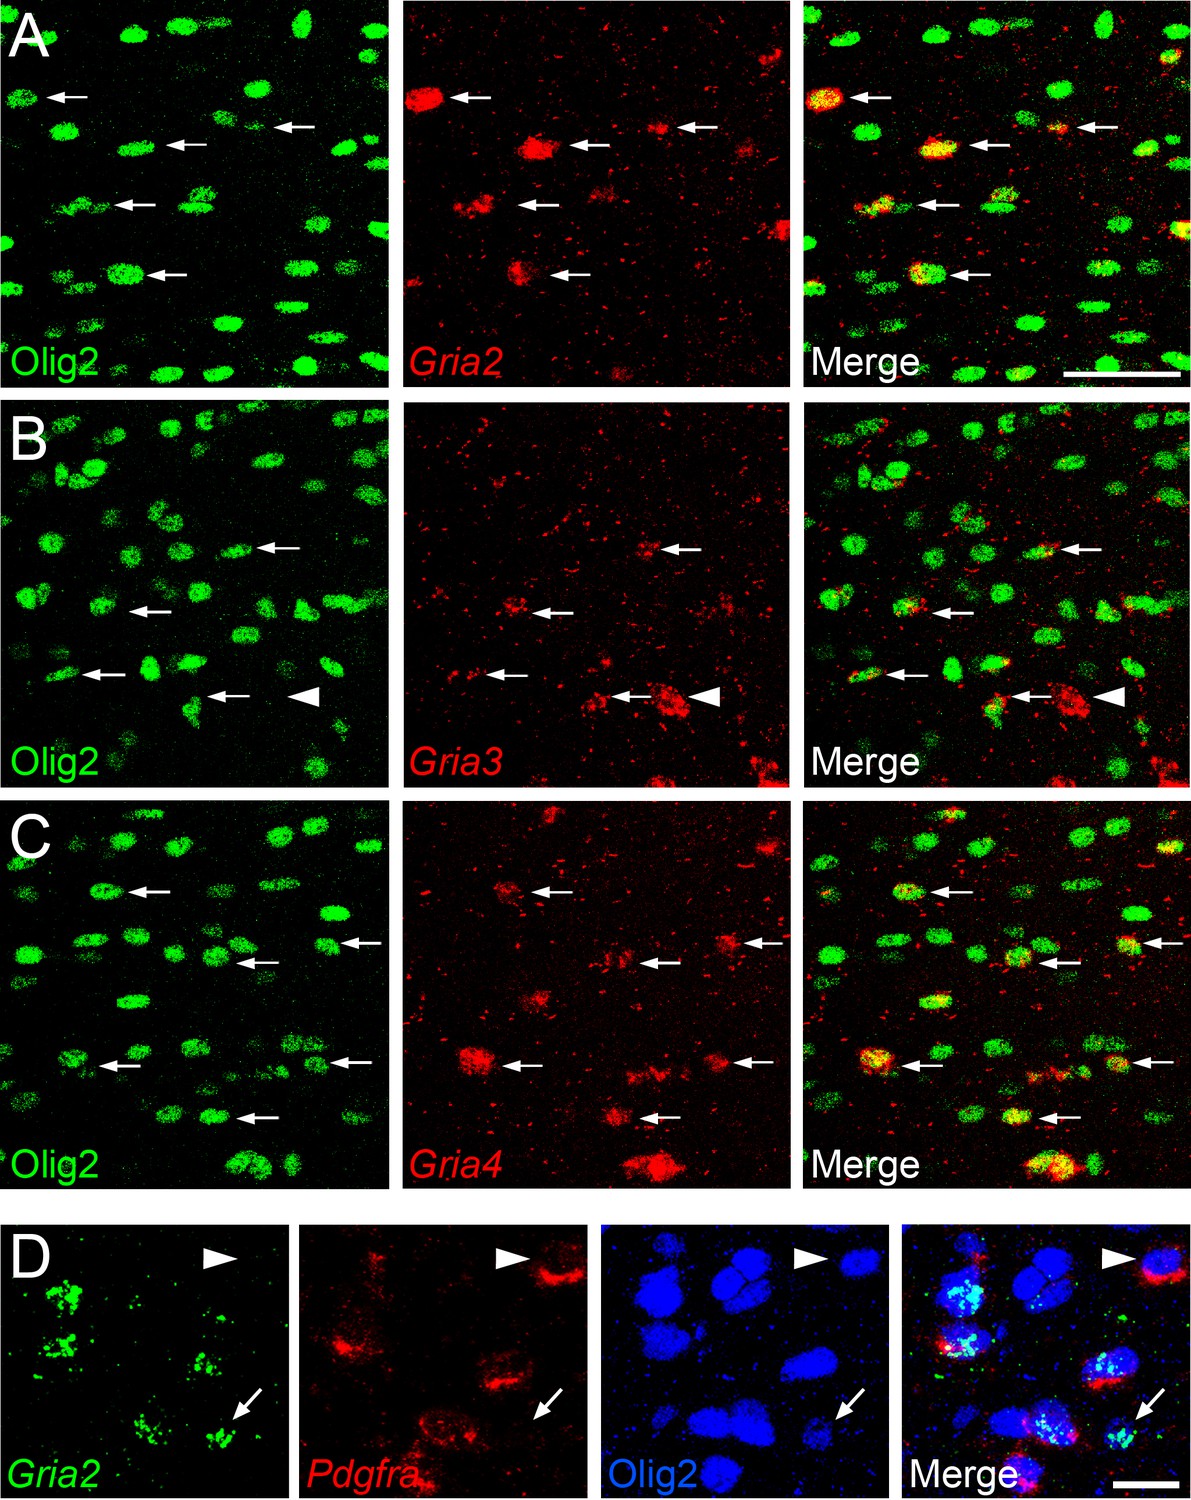
Gria2-4 are expressed in OL lineage cells.
(A–C) Fluorescence ISH for Gria2-4 followed by immunohistochemistry for Olig2 in P14 corpus callosum indicates that Gria2-4 are expressed in OL lineage cells (arrows). Occasional Gria+ Olig2– cells (e.g. arrowhead in middle row) are presumptive neurons. (D) Double fluorescence ISH for Gria2 and Pdgfra followed by immunolabelling for Olig2, P9 corpus callosum. All Gria2+ cells are Olig2+ OL lineage cells. Many of these are (Gria2+, Pdgfra+, Olig2+) OPs. Some (Gria2–, Pdgfra+) cells (arrowhead) and (Gria2+, Pdgfra–, Olig2+) cells (arrow) are also present, suggesting that not all OPs express detectable levels of Gria2 and that some differentiating OLs (Pdgfra–, Olig2+) continue to express Gria2. Scale bars: (A–C) 50 μm, (D) 25 μm.
Figure 3

Gria3 germline KO mice generate normal numbers of OPs and OLs.
(A, B) Immunolabelling for Pdgfra+ OPs (A) or CC1+ OLs (B) in P14 corpus callosum of wild type (WT) and Gria3null mice. (C) EdU was administered to P14 wild type and Gria3null mice for 8 hr before analyzing the corpus callosum by Pdgfra immunolabelling and EdU detection. (D, E) Cell counts reveal no difference in the density of OPs at P14 and P21 (D; p=0.66 at P14, p=0.7 at P21, Mann-Whitney test; >600 cells counted in each mouse) or OLs (E; p=0.66 at P14, p=0.7 at P21, Mann-Whitney test; >900 cells counted in each mouse) in Gria3null versus WT corpus callosum. (F) Cell counts reveal no difference between the EdU labelling indices of Pdgfra+ OPs in WT versus Grianull corpus callosum (p=0.66, Mann-Whitney test). (G) There was no change in the number of cross-sectional myelin figures per unit area in P14 Gria3null compared to WT littermate controls (p=0.4, Mann-Whitney test). (H) Scatter plot of g-ratios as a function of axon diameter in P14 Gria3null and wild type mice (>130 axons measured in each of three mice per group). (I) Frequency distribution of myelinated axon diameters from P14 Gria3null and WT mice (>800 axons measured in each of three mice per group). (J) Frequency distribution of unmyelinated axon diameters from P14 Gria3null and WT mice (>800 axons measured in each of three mice per group). Numbers of mice analyzed are indicated in (D), (E) and (F). Scale bar: 50 μm.
Figure 4 with 2 supplements

Gria2 knock-out renders AMPARs in OPs inwardly-rectifying but does not alter numbers of OL lineage cells in white matter.
(A) Patch-clamp recording of an OP in SCWM in an acute slice of wild type mouse forebrain, showing inward current generated by bath application of 100 μM kainate. (B) Currents evoked by voltage steps from –63 mV in Gria3null2+/+ OP before (control) and during application of 100 μM kainate. Voltage steps were in 20 mV increments from –103 mV to +17 mV. (C) Current-voltage (I–V) plots of kainate-evoked current in OPs of P14 Gria2-/– mice and littermate controls. With 100 μM spermine included in the patch pipette, inward rectification of the current was observed in Gria2–/– but not in Gria2 +/– or Gria2+/+. (D) Rectification index (RI; current at +17 mV/ current at –63 mV) of cells from (C). RI is greatly reduced in Gria2–/– mice (p<10–4, one-way ANOVA with Bonferroni post-hoc test). (E) Mean kainate-evoked current density (current/capacitance, pA/pF) is the same in P14 Gria2–/–, Gria2+/– and Gria2+/+ OPs (p=0.73, Kruskal-Wallis with Dunn’s post-hoc test). (F) Immunolabelling for Pdgfra+ OPs (top) and CC1+ OLs (bottom) in P14 Gria2–/– and Gria2+/+ corpus callosum. (G) EdU incorporation by proliferating OPs (Pdgfra+) in the P14 corpus callosum of Gria2–/– and Gria2+/– mice. The bottom panels show higher-magnification images of the cells indicated on the top; all Pdgfra+ OPs co-expressed YFP confirming that Sox10-Cre is expressed in all these cells. (H) There were no significant changes in the densities of either Pdgfra+ OPs (p=0.34, Mann-Whitney test; >600 cells counted per mouse) or CC1+oligodendrocytes (p=0.40, Mann-Whitney test; >900 cells counted per mouse) at P14. (I) There were no significant differences in the fractions (%) of EdU+ Pdgfra+ OPs in Gria2–/– versus Gria2+/– (p=0.89, Mann-Whitney test). Numbers of cells and mice analyzed are indicated in (D, E) and (H, I), respectively. Scale bars: 50 μm.
Figure 4—figure supplement 1
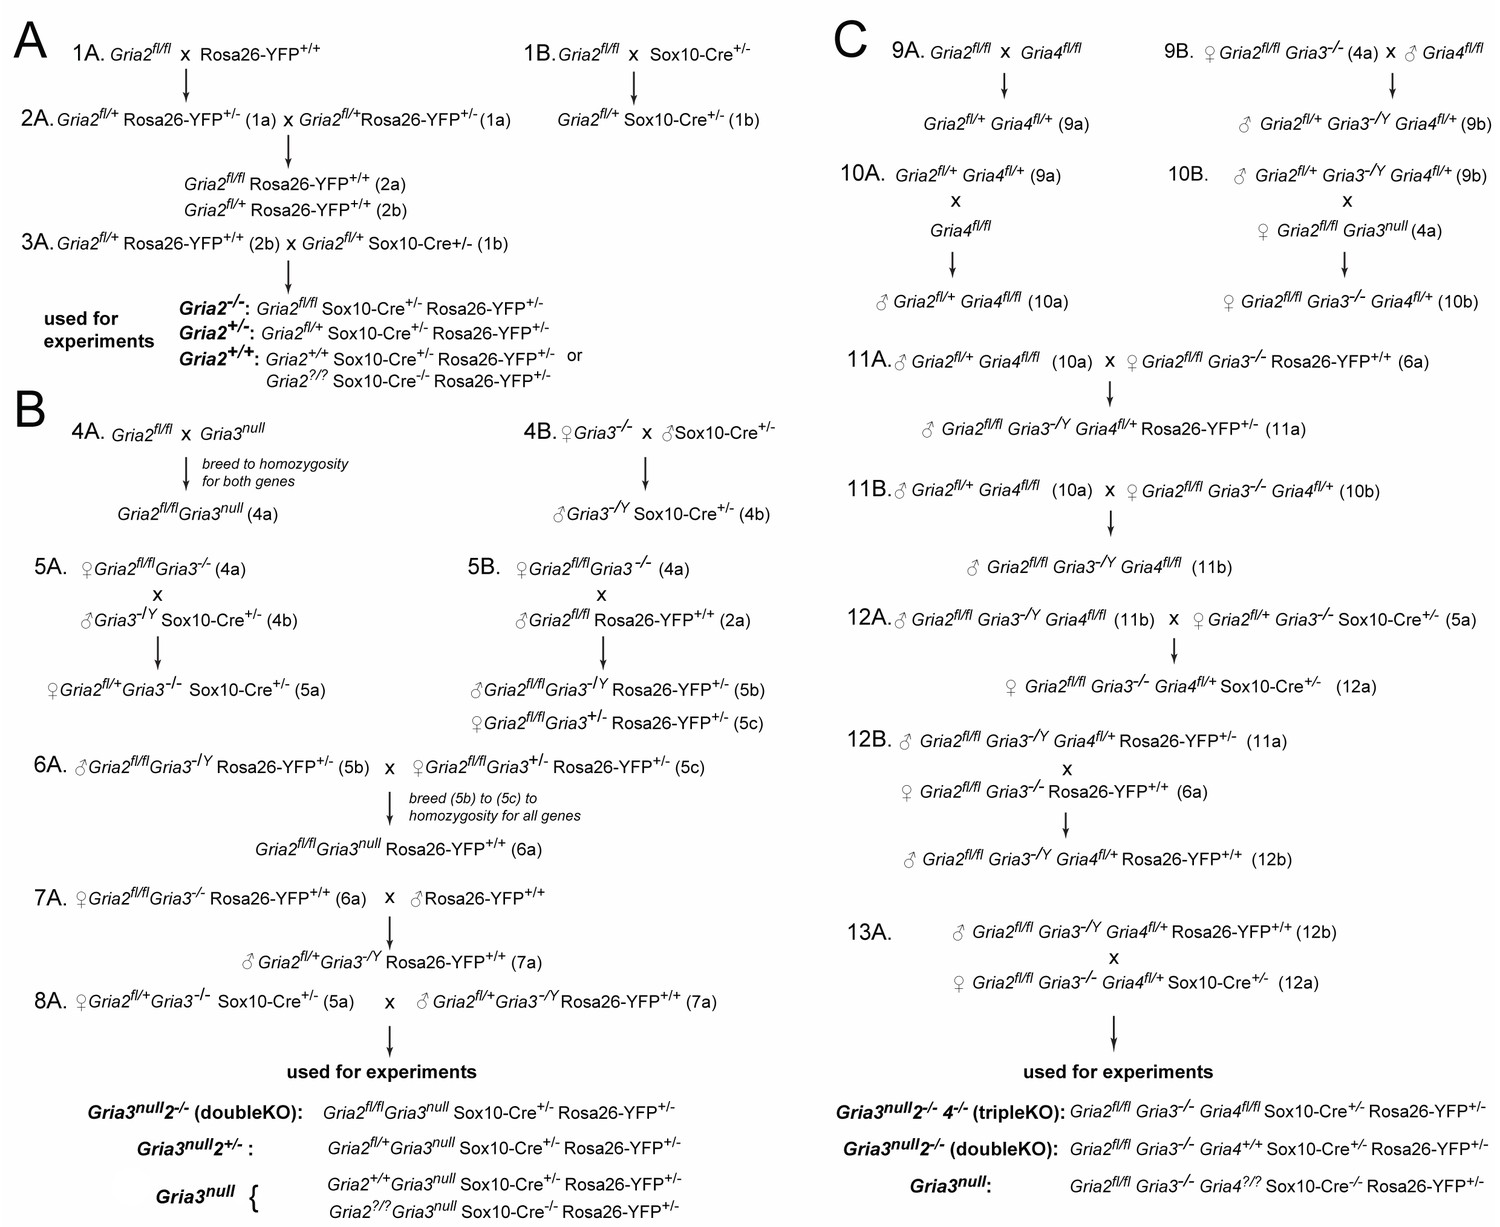
Breeding strategies.
(A) Obtaining Gria2 cKO in OL lineage cells. (B) Obtaining Gria3null2–/– double knockouts in OL lineage cells. (C) Obtaining Gria3null2–/–4–/– triple knockouts in OL lineage cells. (?) indicates that either a floxed or wild type allele was present. A number with an upper-case letter (e.g. 1A) indicates the parental generation, while the same number with a lower-case letter (e.g. 1a) indicates the f1 generation of that cross.
Figure 4—figure supplement 2
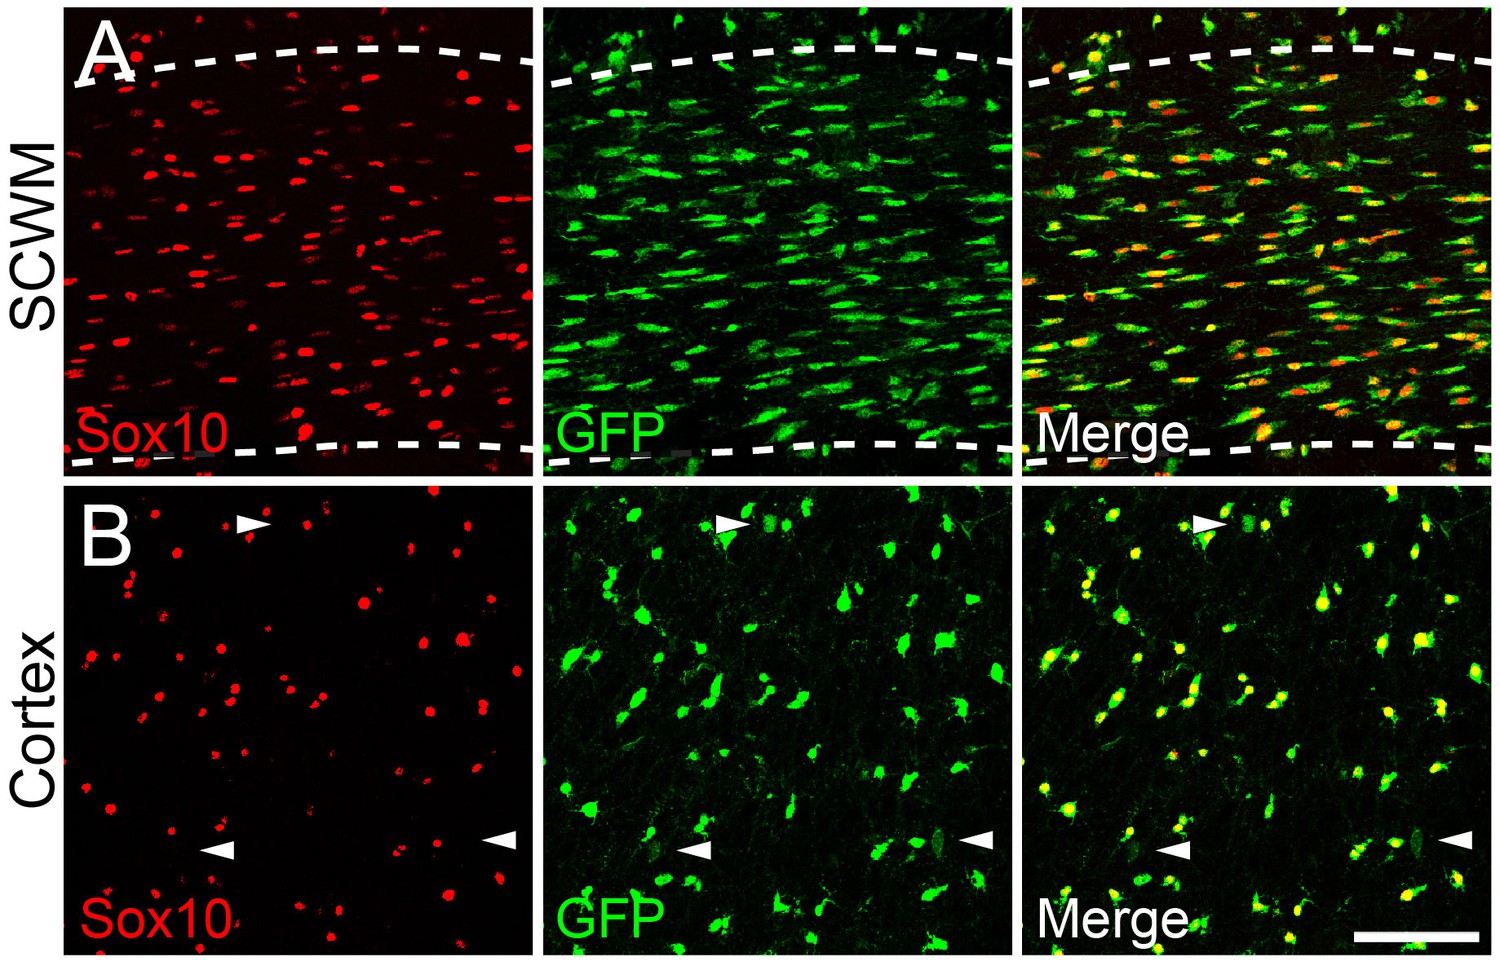
Sox10-Cre drives recombination in OL lineage cells in the sub-cortical white matter and cerebral cortex.
Coronal sections of P14 Sox10-Cre: Rosa-YFP mouse forebrain were double-immunolabelled with anti-Sox10 and anti-GFP/YFP. (A) In the corpus callosum (within the dashed lines) the great majority of Sox10+ OL lineage cells (red) were also YFP+ (green) and vice versa (see main text). (B) In the cerebral cortex practically all Sox10+ cells were YFP+. Some Sox10–, weakly YFP+ cells were also present (arrowheads); these included small numbers of NeuN+ neurons and astrocytes (see main text). Scale bar: 100 µm.
Figure 5 with 2 supplements
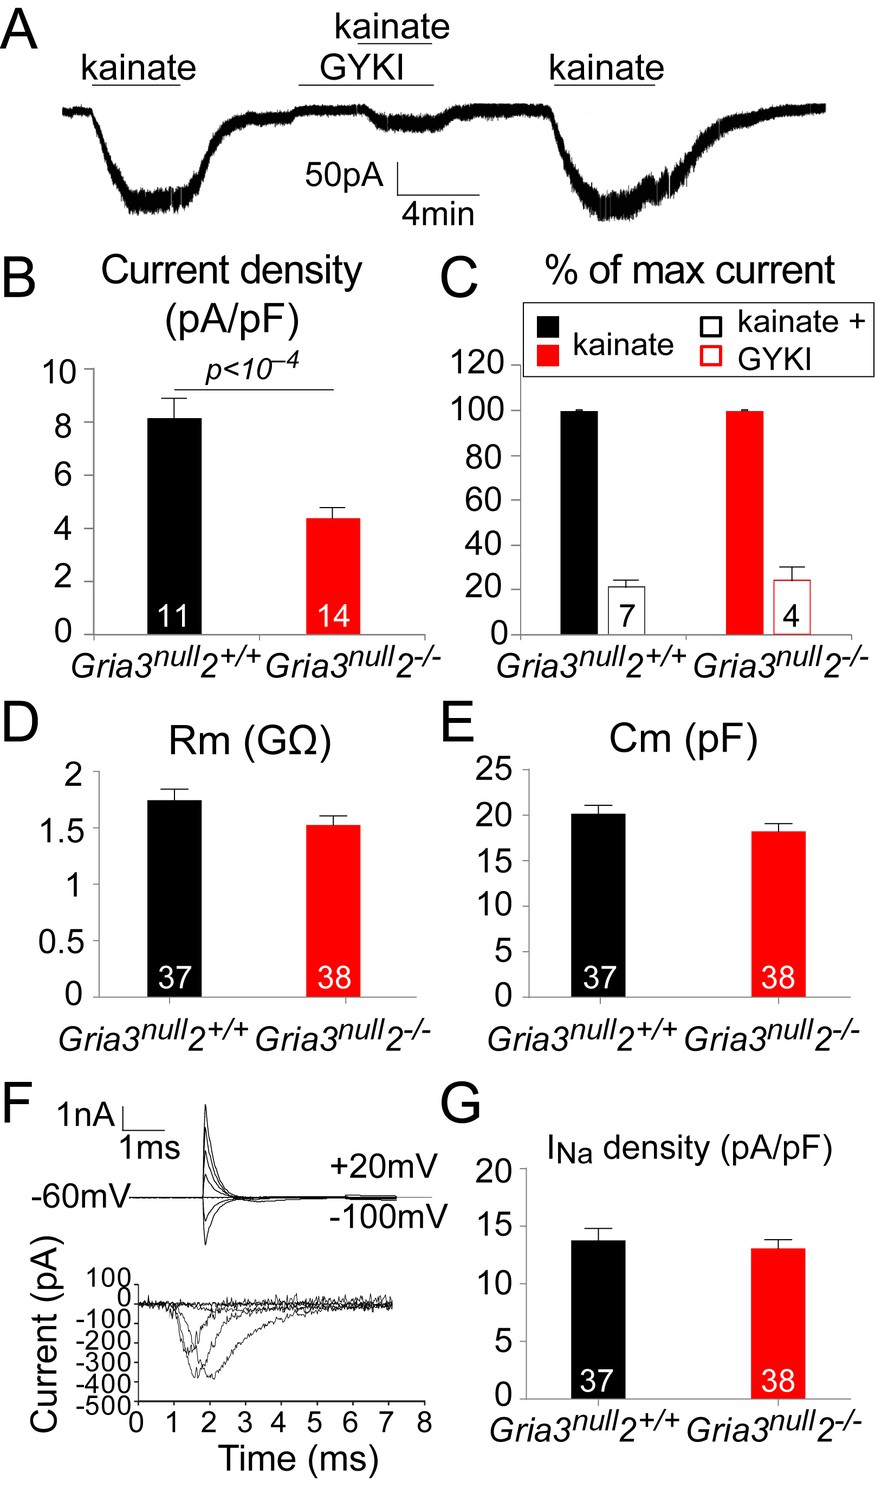
The kainate- evoked current in OPs is reduced in Gria3null2–/– mice.
(A) The kainate-evoked current is blocked reversibly by the AMPAR antagonist GYKI-52466 (GYKI, 50 μM). (B) Mean kainate-evoked current density is ∼47% less in Gria3null2–/– OPs compared to Gria3null2+/+ (p<10−4, Student’s t-test). (C) GYKI blocks the kainate-evoked current in both Gria3null2–/– and Gria3null2+/+ mice (normalized to 100% before GYKI application). (D, E) No significant changes in membrane resistance Rm (D), p=0.16, Mann-Whitney test) or capacitance Cm (E), p=0.13, Student’s t-test) of OPs from Gria3null2–/– compared to Gria3null2+/+. (F) INa recorded from P14 Gria3null2+/+ OPs. Top current traces are responses to voltage steps in 20 mV increments from −63 mV, showing the capacity current and the subsequent (much smaller) ionic current changes evoked by the voltage steps. Bottom trace is after subtraction of the linearly scaled response to a 20 mV hyperpolarizing step. (G) There was no significant change in INa density in Gria3null2–/– compared to Gria3null2+/+ controls (p=0.72, Mann-Whitney test). Numbers of cells analyzed are indicated in (B–E, G).
Figure 5—figure supplement 1
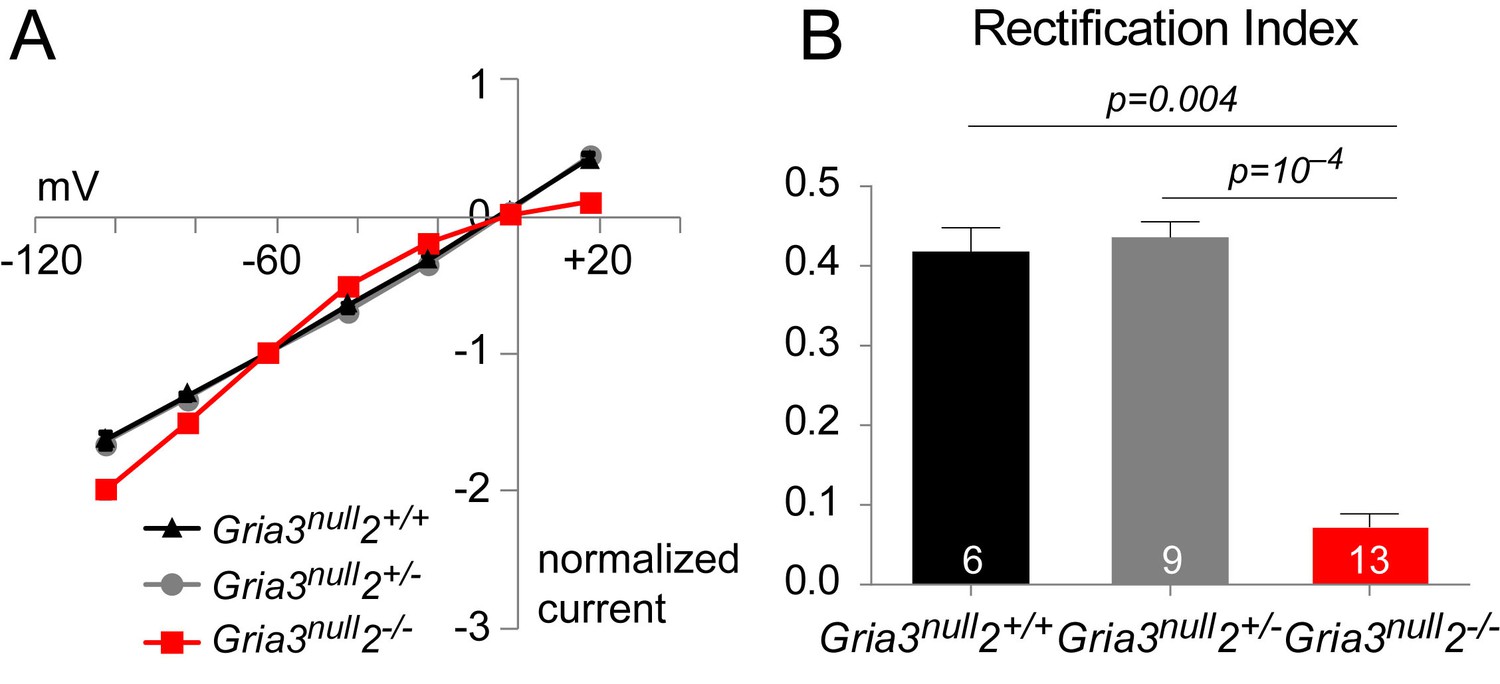
Gria2 is successfully knocked out in Gria3null2–/– mice.
(A) Current-voltage plot showing inward rectification in OPs of P14 Gria3null2–/– mice but not Gria3null2+/– or Gria3null2+/+ when 100 μM spermine is included in the patch pipette. (B) Rectification indices of cells in (A) are significantly reduced in Gria3null2–/– (p<10–4, Kruskal Wallis with Dunn’s post-hoc test). Numbers of cells analyzed are indicated in (B).
Figure 5—figure supplement 2
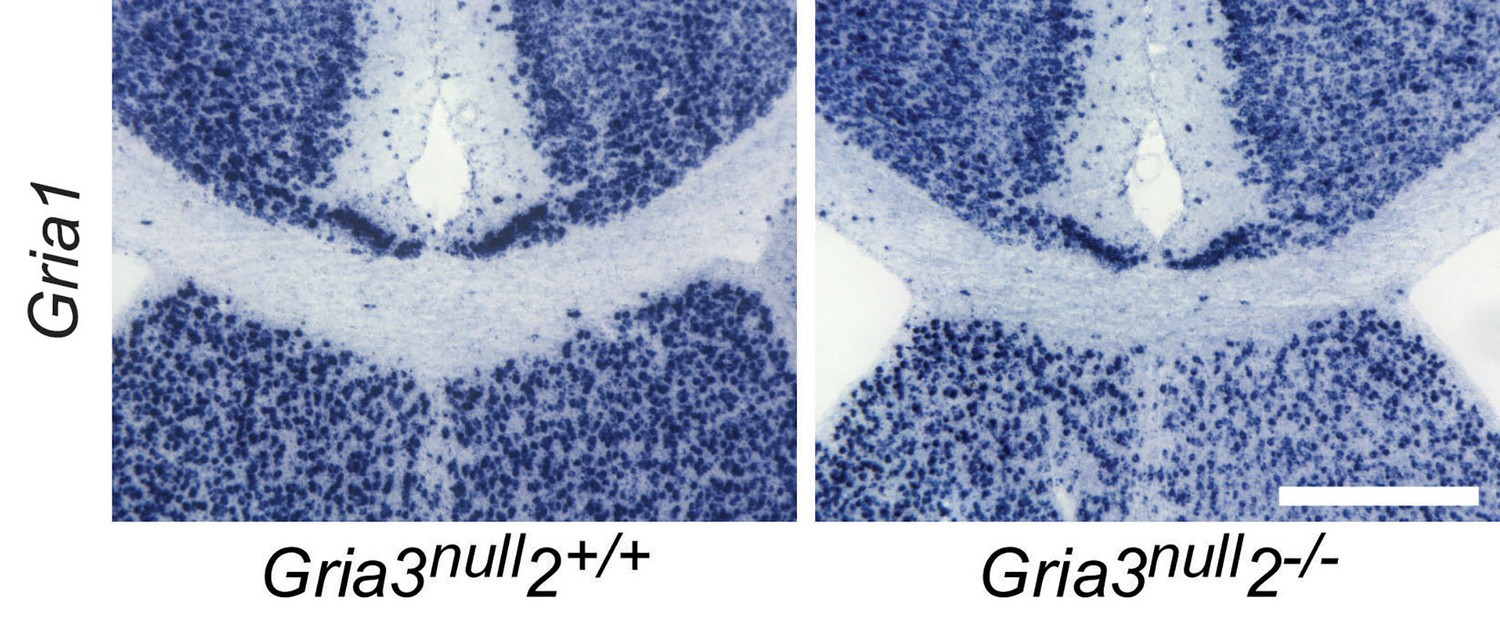
Gria1 is not up-regulated in cells in the corpus callosum of Gria3null2–/– mice.
ISH for Gria1 in the P14 corpus callosum of Gria3null2–/– and Gria3null2+/+ mice provides no evidence for compensatory up-regulation of Gria1. Scale bar: 100 μm.
Figure 6
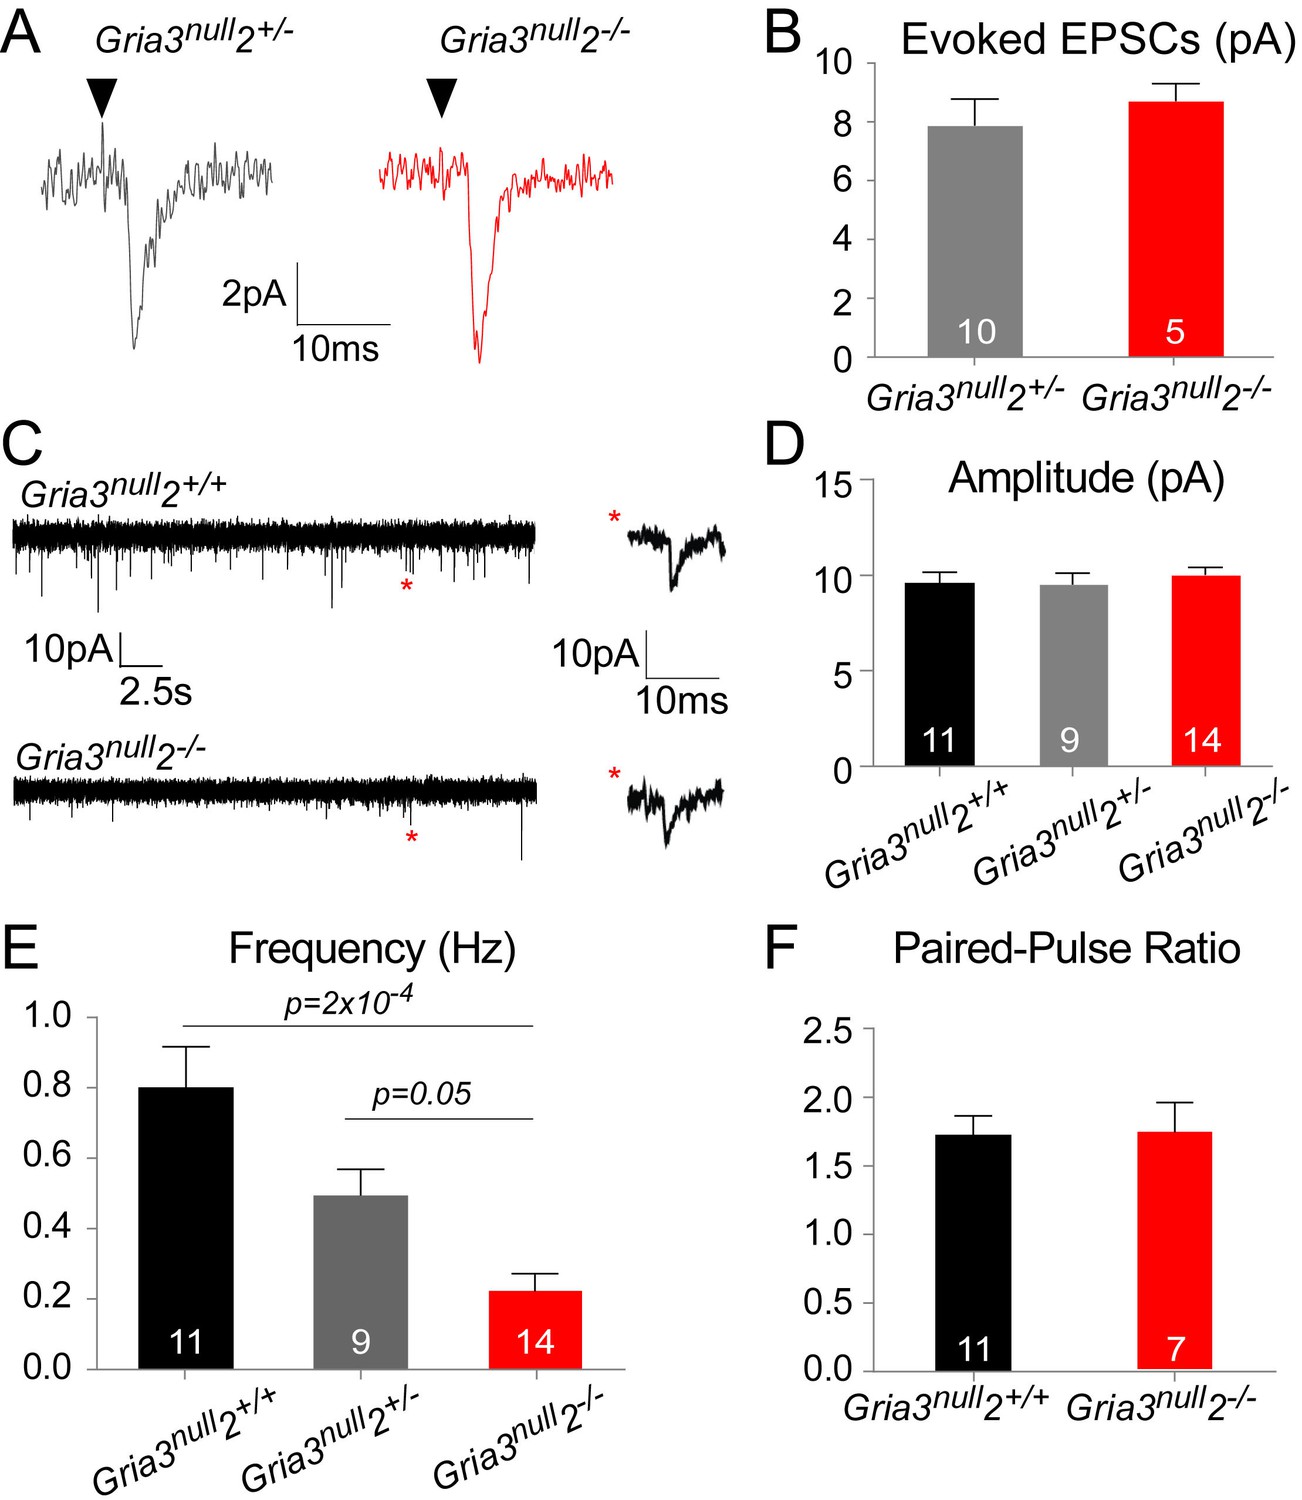
AMPAR-mediated synaptic input is reduced in Gria3null2–/– mice.
(A) EPSCs evoked by minimal stimulation in OPs in the SCWM of P14 Gria3null2+/– and Gria3null2–/– mice. Black triangle marks the time point of stimulation. (B) The amplitude of minimal stimulation-evoked EPSCs is not affected in Gria3null2–/– compared to Gria3null2+/– (p=0.37, Mann-Whitney test). (C) EPSCs evoked in OPs by Ruthenium Red (RR, 100 µM) in the corpus callosum of P14 Gria3null2+/+ and Gria3null2–/– mice. Single events marked by asterisks (red) are enlarged on the right. (D) The amplitude of RR-evoked EPSCs is not affected in Gria3null2–/– compared to Gria3null2+/+ or Gria3null2+/– (p=0.73, one-way ANOVA with Bonferroni post-hoc test). (E) The frequency of RR-evoked EPSCs is ~70% less in Gria3null2–/– compared to Gria3null2+/+ (p=2×10⁻⁴, Kruskal-Wallis with Dunn’s post-hoc test). (F) There was no change in the paired-pulse ratio in Gria3null2–/– compared to Gria3null2+/+ (p=0.95, Student’s t-test). Numbers of cells analyzed are indicated in (B, D–F).
Figure 7 with 2 supplements
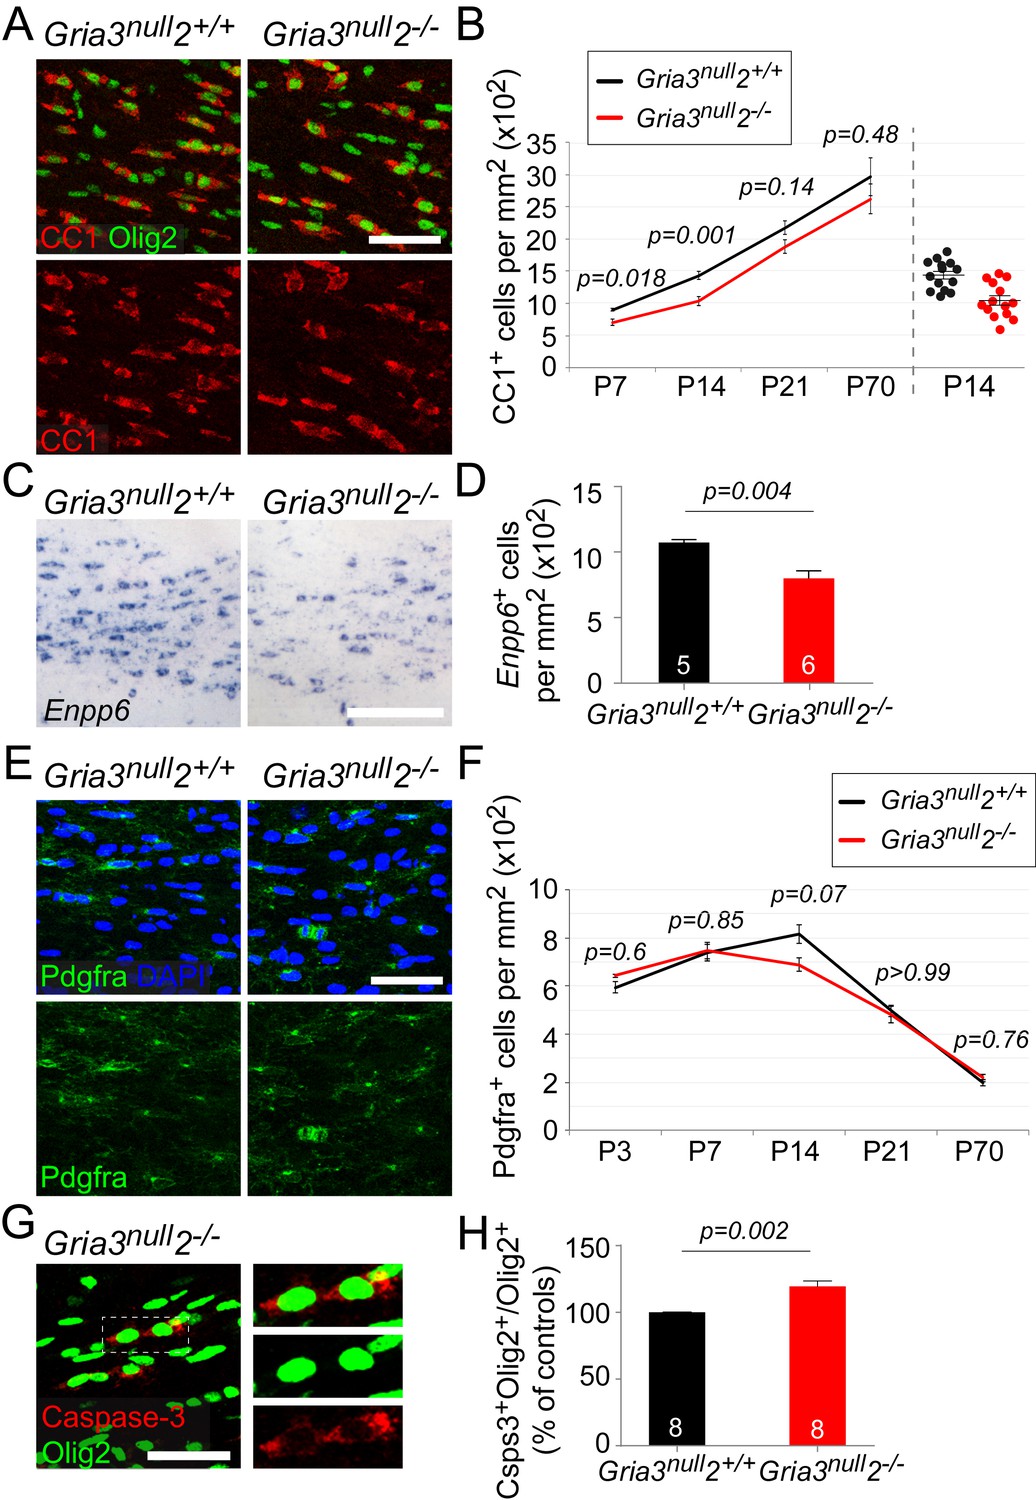
Gria3null2–/– mice generate fewer OLs in the corpus callosum.
All data at P14 unless otherwise stated. (A) Immunolabelling for Olig2 and CC1 antigen visualizes differentiated OLs in Gria3null2+/+ and Gria3null2–/– mice. (B) The density of CC1+ OLs is significantly less (by ∼27%) in Gria3null2–/– mice relative to Gria3null2+/+ controls at both P7 and P14 (t- or Mann-Whitney tests with Holm-Bonferroni correction; n = 7, 14, 7 and 6 mice at P7, P14, P21 and P70, respectively, for Gria3null2–/–; n = 5, 14, 9 and 6 mice at P7, P14 and P21 for Gria3null2+/+. >800 cells were counted per mouse at all ages). Right hand side of the graph visualizes the spread of data at P14. (C) ISH for Enpp6 in Gria3null2+/+ and Gria3null2–/– mice. (D) There is a ∼26% reduction in the density of Enpp6 cells in Gria3null2–/–compared to Gria3null2+/+ (p=0.004, Mann-Whitney test). (E) Pdgfra+ OPs in Gria3null2+/+ and Gria3null2–/– mice. (F) There were no significant differences in the density of Pdgfra+ OPs in Gria3null2–/– versus Gria3null2+/+ mice between P3-P70, although there was a trend towards transient reduction in cell density at P14 in Gria3null2–/– (t- or Mann-Whitney tests with Holm-Bonferroni correction; n = 4, 8, 14, 7 and 8 mice at P3, P7, P14, P21 and P70, respectively, for Gria3null2–/–, n = 4, 6, 14, 9 and 7 mice at P3, P7, P14, P21 and P70 for Gria3null2+/+. >800 cells were counted per mouse at all ages). (G) Cleaved Caspase-3+, Olig2+ OL lineage cells in SCWM of P14 Gria3null2–/– mice. Cells in the rectangle (dotted line) are shown on the right at higher magnification. (H) There was a ∼19% increase in the fraction of Olig2+ cells that expressed cleaved Caspase-3 in Gria3null2–/– compared to Gria3null2+/+ littermate controls (p=0.002, Student’s t-test with Welch’s correction; >800 Olig2+ cells were counted in each mouse). Numbers of mice analyzed are indicated in (D) and (H). Scale bars: 50 μm.
Figure 7—figure supplement 1
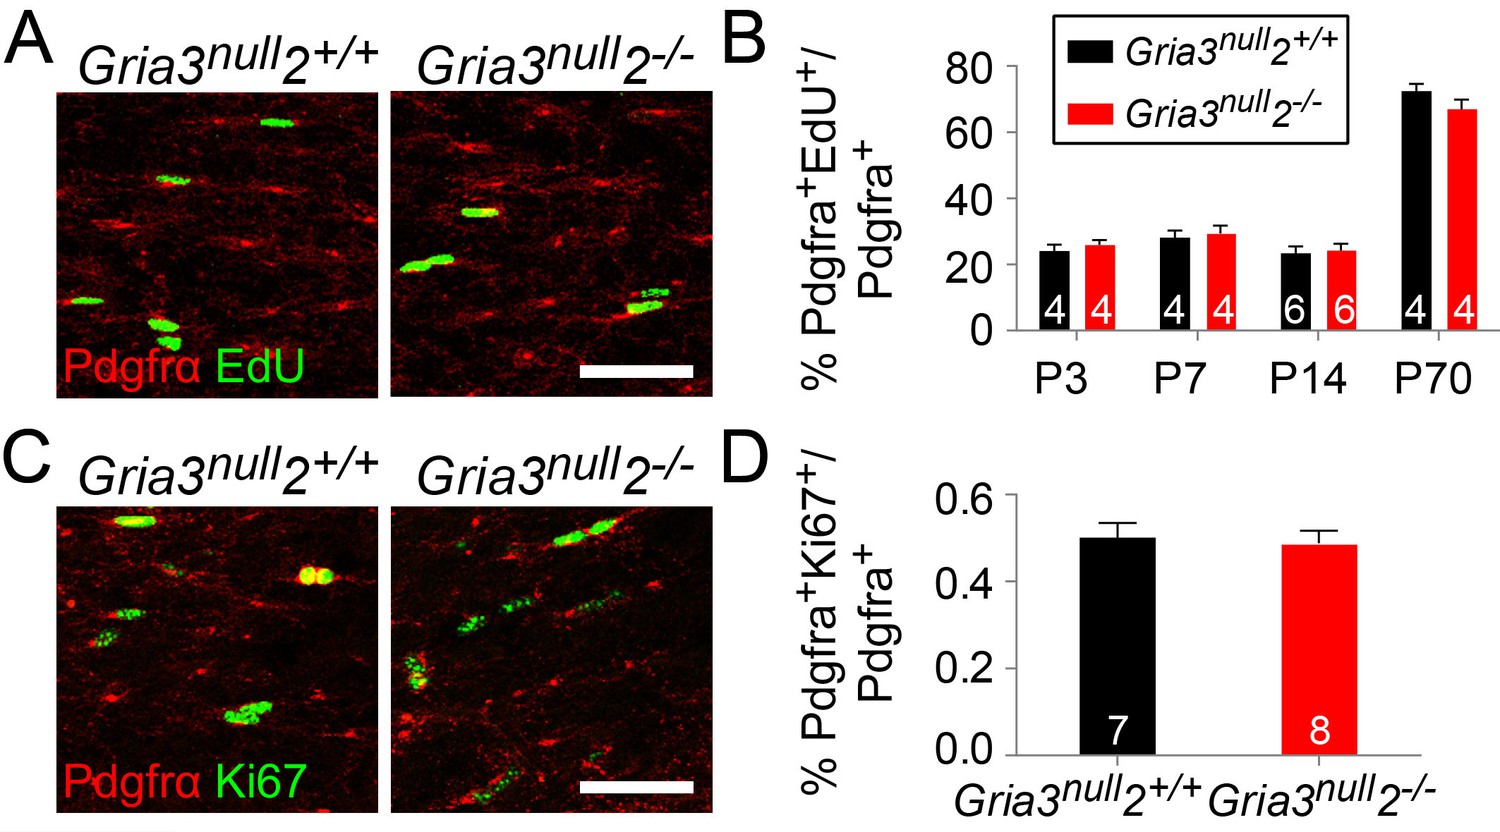
The division rate of OPs in the corpus callosum is not affected in Gria3null2–/– mice.
(A) Pdgfra immunolabelling and EdU detection in the SCWM of P14 Gria3null2+/+ and Gria3null2–/– mice that were labelled with EdU for 8 hr before fixation. (B) There were no significant changes in the EdU+ labelling indices of Pdgfra+ OPs of Gria3null2–/– versus Gria3null2+/+ mice at P3-P70 (P3, p=0.66; P7, p=0.66; P14, p=0.67; P70; p=0.34, Mann-Whitney tests without correction for multiple comparison). (C) Co-immunolabelling for Ki67 and Pdgfra in Gria3null2–/– and Gria3null2+/+ mice. (D) There was no change in the fraction (%) of Pdgfra+ OPs that were Ki67+ in Gria3null2–/– versus Gria3null2+/+ mice (p=0.78, Student’s t-test). Numbers of mice analyzed are indicated in (B, D). Scale bars: 50 μm.
Figure 7—figure supplement 2
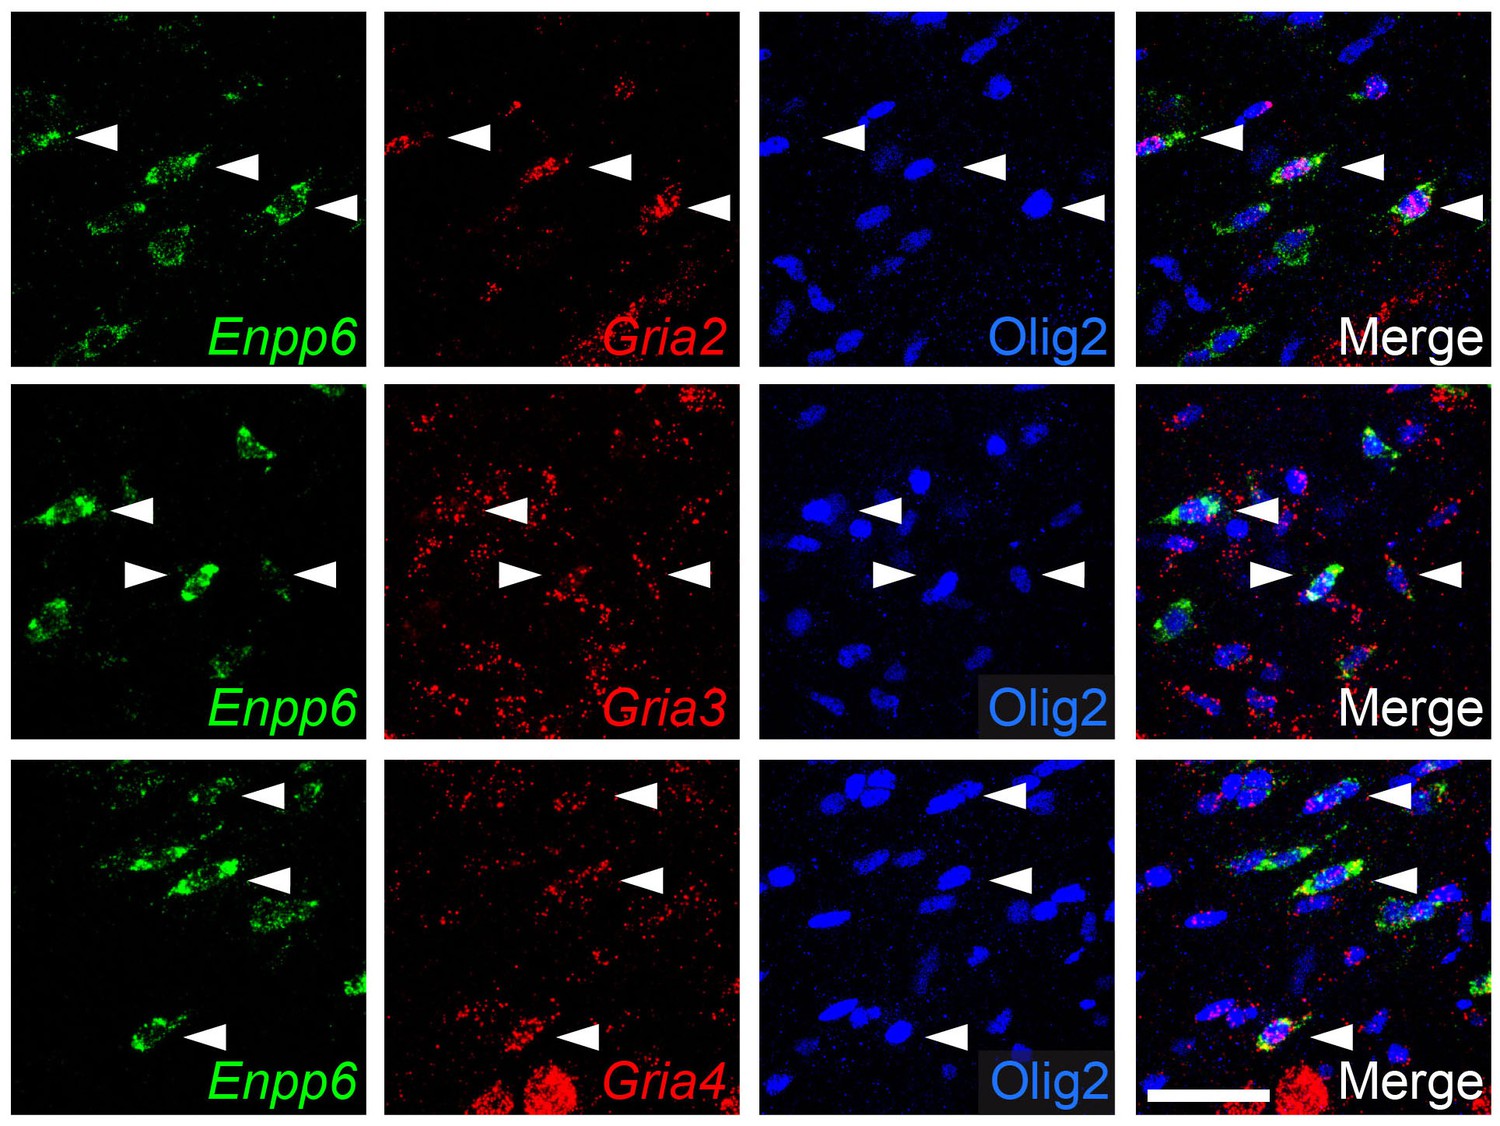
mRNA encoding GluA2-4 continue to be expressed in Enpp6+ early-differentiating OLs.
Double fluorescence ISH for Gria2-4 and Enpp6 followed by immunolabelling for Olig2 in wild type P12 corpus callosum. Many Enpp6+ cells co-express Gria2-4 (arrowheads). Scale bar: 50 μm.
Figure 8
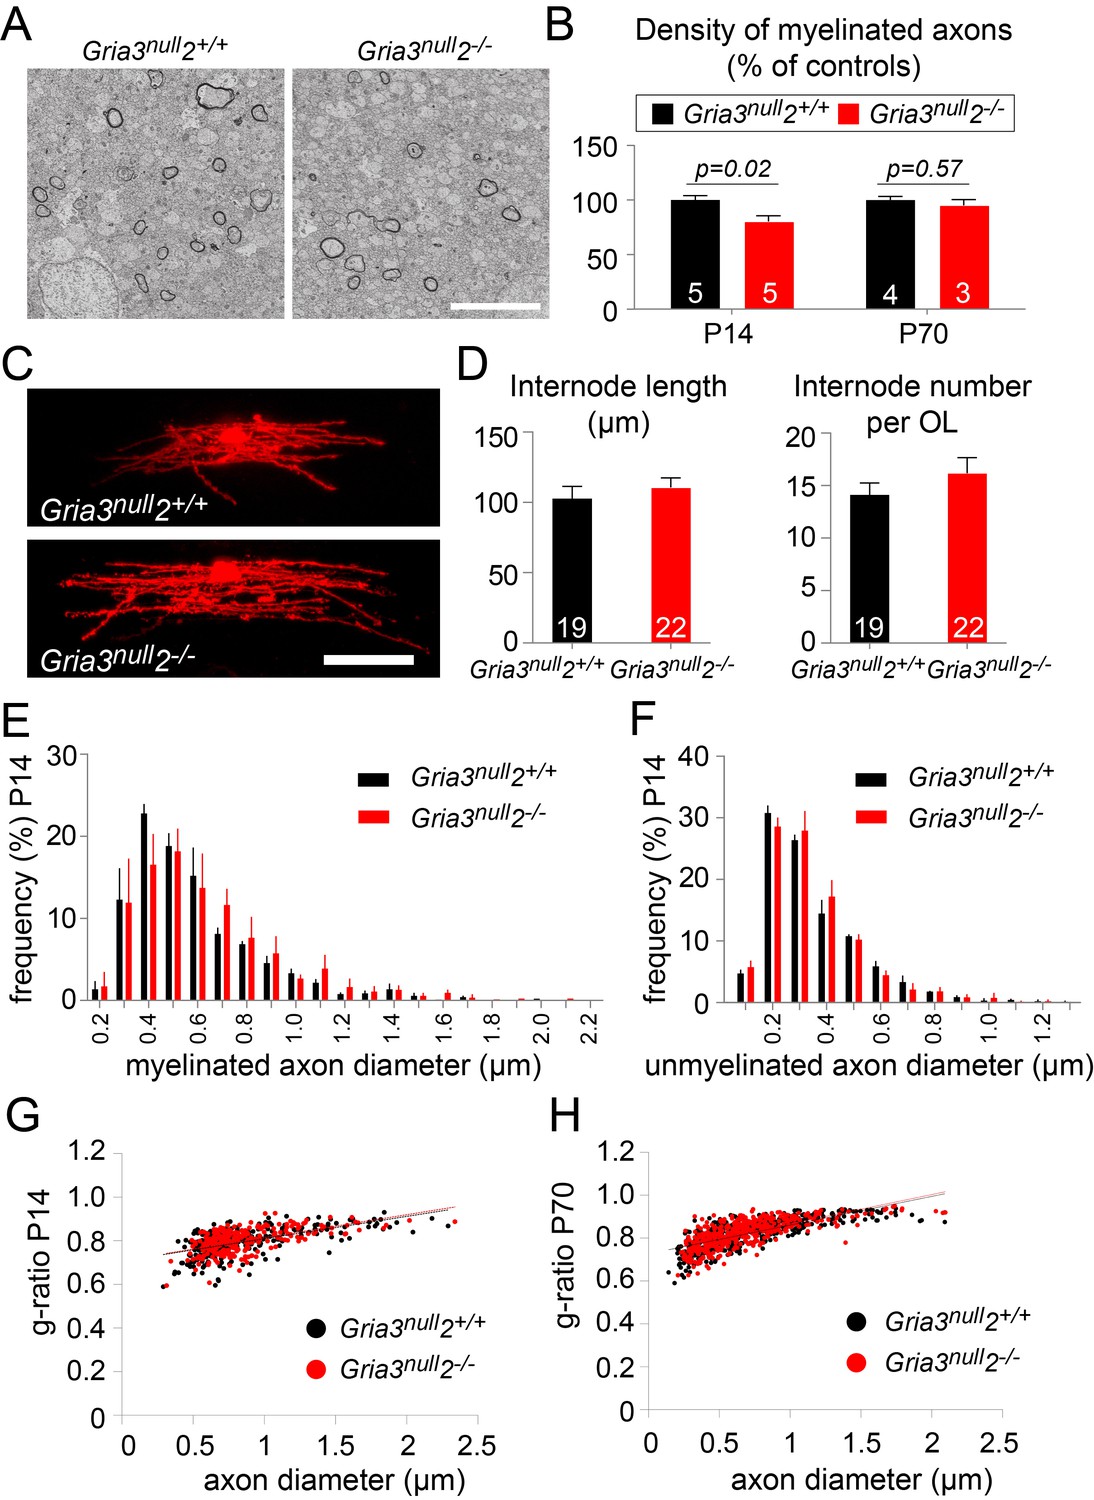
Less myelin in Gria3null2–/– corpus callosum.
(A) Transmission electron micrograph of P14 corpus callosum from Gria3null2+/+ and Gria3null2–/– mice. Scale bar: 5 µm. (B) There was a ∼20% reduction in the number of cross-sectional myelin figures per unit area in Gria3null2–/– compared to Gria3null2+/+ mice at P14, but not at P70 (p=0.02 at P14, p=0.57 at P70, Mann-Whitney tests). (C) Dye-filled OLs in P14 corpus callosum of Gria3null2+/+ and Gria3null2–/– mice. (D) There was no difference in the length of the internodes (p=0.47, Student’s t-test) or the number of internodes per OL (p=0.26, Mann-Whitney test) in Gria3null2–/– compared to Gria3null2+/+ mice. (E) Frequency distribution of myelinated axon diameters from P14 Gria3null2+/+ and Gria3null2–/– mice (100–350 axons measured in each of three mice per group). (F) Frequency distribution of unmyelinated axon diameters from P14 Gria3null2+/+ and Gria3null2–/– mice (>300 axons measured in each of three mice per group). (G) Scatter plots of g-ratios as a function of axon diameter in P14 Gria3null2+/+ and Gria3null2–/– mice (>260 axons measured from four mice per group). (H) Scatter plots of g-ratios as a function of axon diameter in P70 Gria3null2+/+ and Gria3null2–/– mice (>150 axons measured from each of three mice per group). Number of mice analyzed is indicated in (B) and number of cells analyzed in (D).
Figure 9
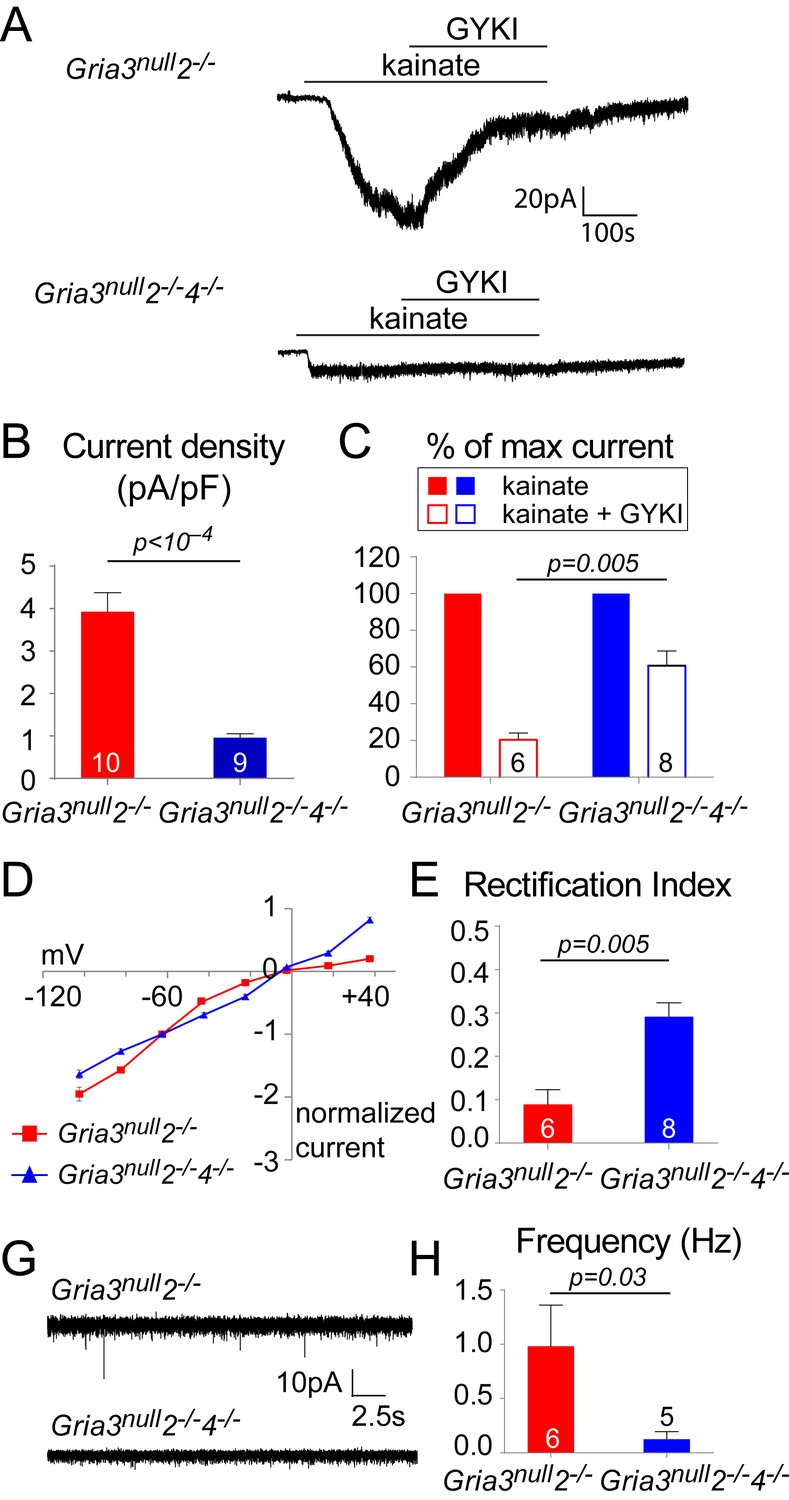
Gria3null2–/–4–/– mice lack AMPAR-mediated inputs.
(A) The kainate-evoked current is greatly reduced in OPs of P14 Gria3null2–/–4–/– mice compared to Gria3null2–/– littermates and is less effectively blocked by the AMPAR antagonist GYKI-52466 (GYKI, 50 μM). (B) Mean kainate-evoked current density in P14 Gria3null2–/–4–/– OPs is ∼24% that of Gria3null2–/– littermates (p<10–4, Student’s t-test with Welch correction), corresponding to ∼13% that of Gria3null OPs (Figure 5B). (C) GYKI blocks the kainate-evoked current by ∼80% in Gria3null2–/–, but only by ∼39% in. Gria3null2–/–4–/– mice (p=0.005, Mann-Whitney test). (D) Current-voltage plot showing inward rectification in OPs of P14 Gria3null2–/– mice but not Gria3null2–/–4–/–, when 100 μM spermine is included in the patch pipette. (E) Rectification indices of cells recorded in (D) are significantly increased in Gria3null2–/–4–/– compared to Gria3null2–/– littermates (p=0.005, Mann-Whitney test). (F) EPSCs evoked in OPs by Ruthenium Red (RR, 100 µM) in the corpus callosum of P14 Gria3null2–/– and Gria3null2–/–4–/– mice. (G) The frequency of RR-evoked EPSCs is dramatically reduced in Gria3null2–/–4–/– compared to Gria3null2–/– littermates (p=0.03, Mann-Whitney test). Numbers of cells analyzed are indicated in (B), (C), (E) and (G).
Figure 10
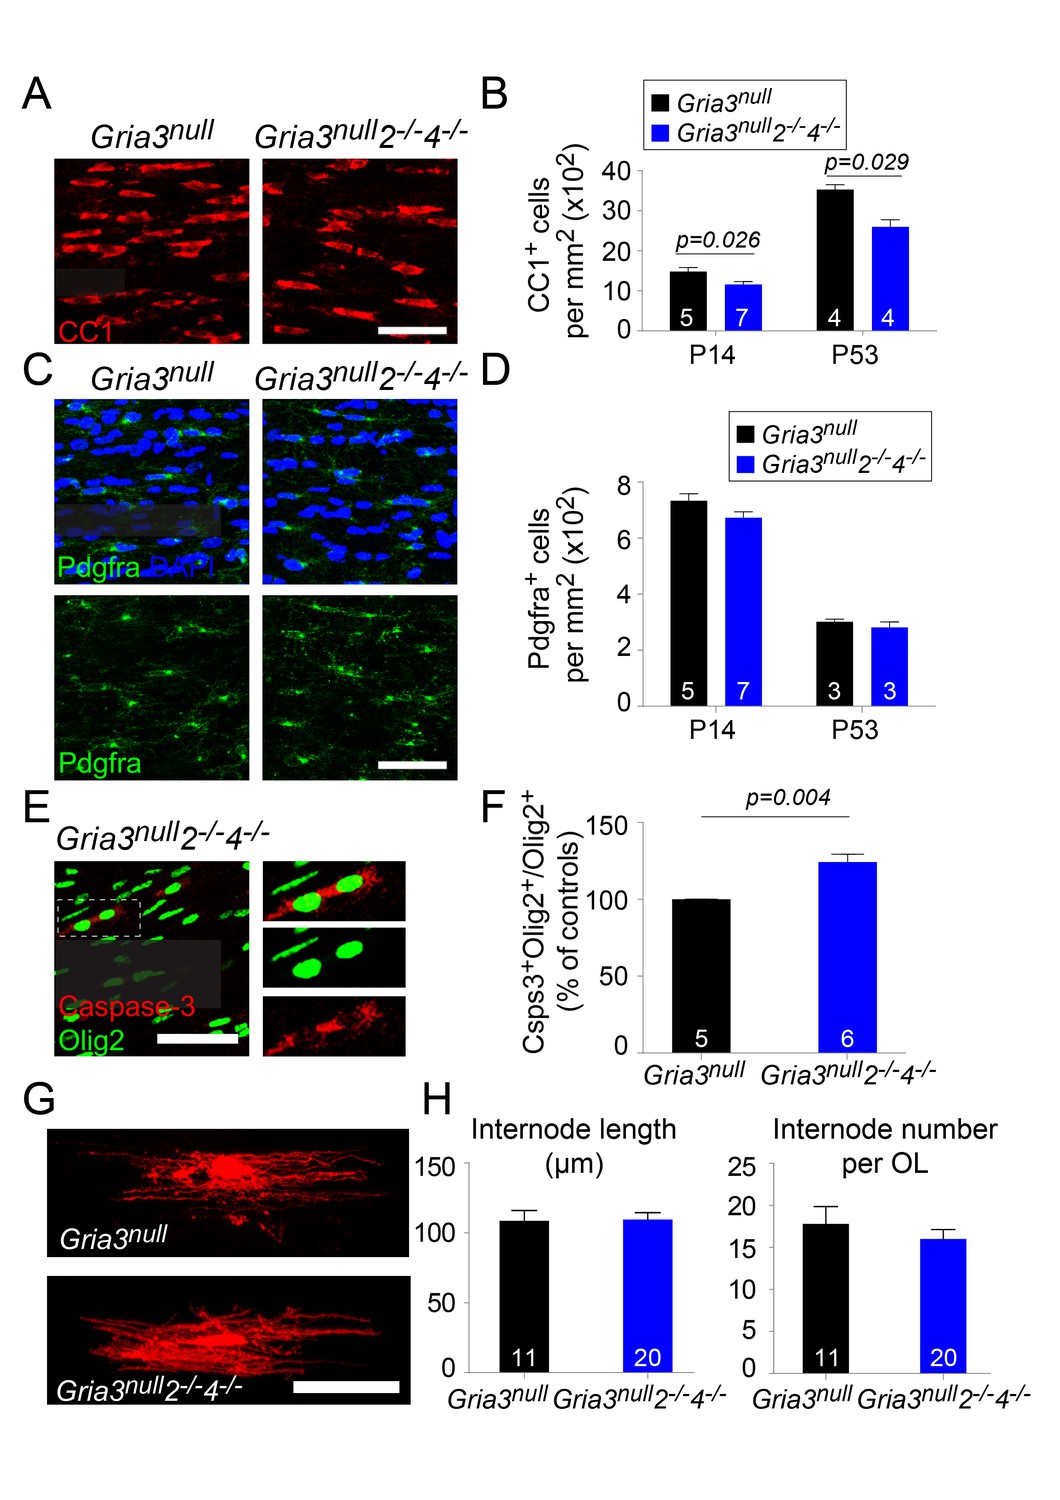
Gria3null2–/–4–/– mice generate fewer OLs in the corpus callosum.
(A) CC1 immunolabelling marks differentiated OLs in Gria3null and Gria3null2–/–4–/– mice. (B) The density of CC1+ OLs is significantly less (by ∼22% at P14 and ~26% at P53) in Gria3null2–/–4–/– mice relative to Gria3null controls (p=0.026 at P14, p=0.029 at P53, Mann-Whitney test; >900 cells were counted per mouse at all ages). (C) Pdgfra+ OPs in Gria3null and Gria3null2–/–4–/– mice. (D) There were no significant differences in the density of Pdgfra+ OPs at P14 or P53 in Gria3null2–/–4–/– versus Gria3null mice (p=0.11 at P14; p=0.7 at P53, Mann-Whitney test; >400 cells were counted per mouse at all ages). (E) Cleaved Caspase-3+, Olig2+ OL lineage cells in Gria3null2–/–4–/– mice. Cells in the rectangle (dotted line) are shown on the right at higher magnification. (F) There was a ~24% increase in the fraction of Olig2+ cells that expressed cleaved Caspase-3 in Gria3null2–/–4–/– compared to Gria3null mice (p=0.004, Mann-Whitney test; >1500 Olig2+ cells were counted in each mouse). (G) Dye-filled OLs in P14 corpus callosum of Gria3null and Gria3null2–/–4–/– mice. (H) There was no change in the length of the internodes (p=0.93, Student’s t-test) or the number of internodes per OL (p=0.41, Student’s t-test) in Gria3null2–/–4–/– compared to Gria3null mice. Numbers of mice analyzed are indicated in (B), (D) and (F) and numbers of cells in (H). Scale bars: 50 μm.
Download links
A two-part list of links to download the article, or parts of the article, in various formats.
Downloads (link to download the article as PDF)
Open citations (links to open the citations from this article in various online reference manager services)
Cite this article (links to download the citations from this article in formats compatible with various reference manager tools)
Signalling through AMPA receptors on oligodendrocyte precursors promotes myelination by enhancing oligodendrocyte survival
eLife 6:e28080.
https://doi.org/10.7554/eLife.28080


