Figures
Figure 1 with 12 supplements
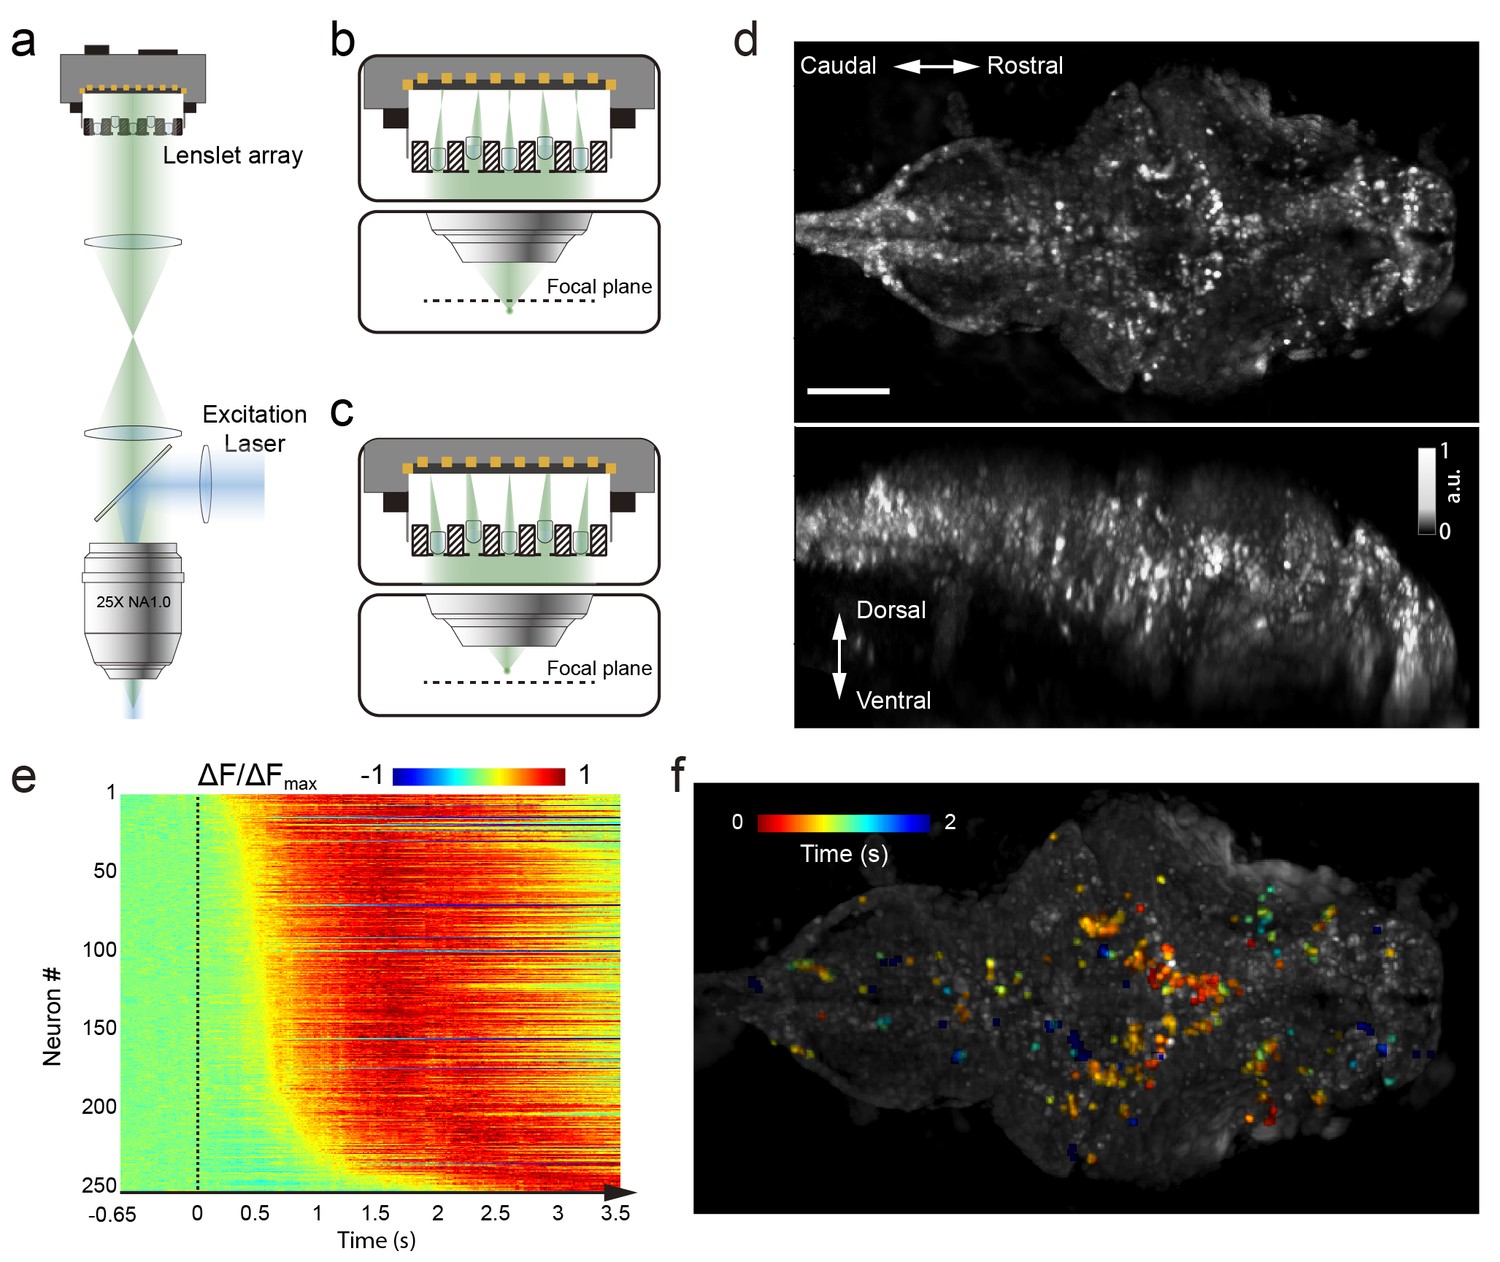
Whole brain imaging of larval zebrafish with XLFM.
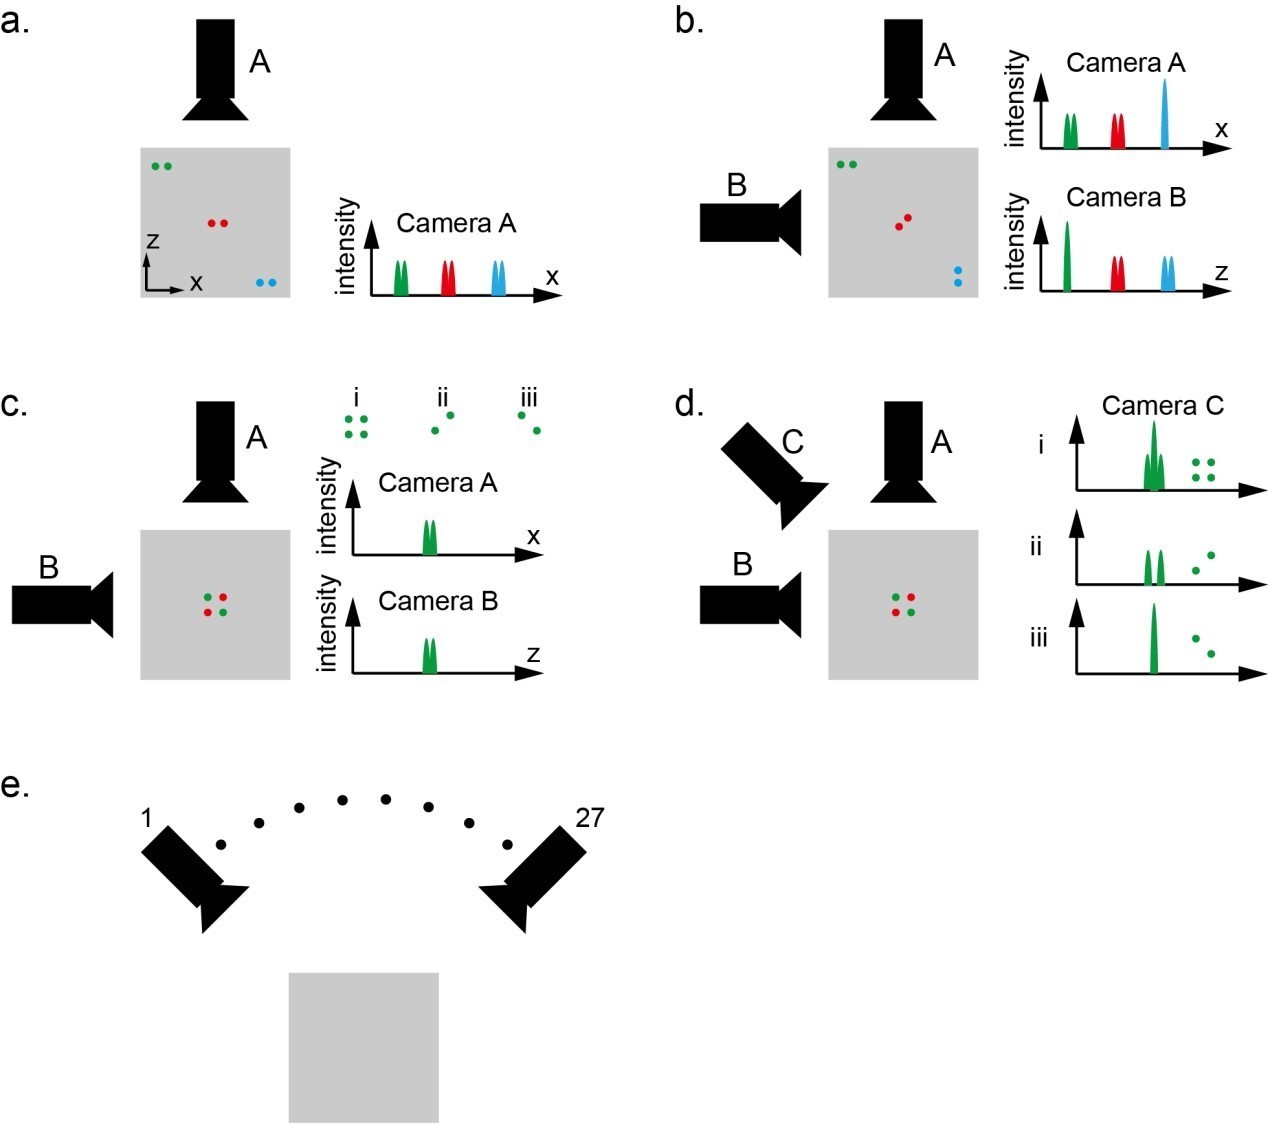
(a) Schematic of XLFM. Lenslet array position was conjugated to the rear pupil plane of the imaging objective. Excitation laser (blue) provided uniform illumination across the sample. (b–c) Point sources at two different depths formed, through two different groups of micro-lenses, sharp images on the imaging sensor, with positional information reconstructed from these distinct patterns. (d) Maximum intensity projections (MIPs) on time and space of time series volume images of an agarose-restrained larval zebrafish with pan-neuronal nucleus-localized GCaMP6f (huc:h2b-gcamp6f) fluorescence labeling. (e) Normalized neuronal activities of selected neurons exhibited increasing calcium responses after the onset of light stimulation at t = 0. Neurons were ordered by the onset time when the measured fluorescence signals reached 20% of their maximum. (f) Selected neurons in (e) were color coded based on their response onset time. Scale bar is 100 μm.
Figure 1—figure supplement 1

Customized lenslet array.
Customized lenslet array consisted of 27 customized micro-lenses embedded in an aluminum plate with 27 drilled holes. (a) Micro-lenses were divided into two groups (A or B), illustrated in yellow and green, respectively. (b) Micro-lens had a diameter of 1.3 mm and focal length of 26 mm. (c). The aluminum housing plate had a 1.3 mm diameter aperture on one side and 1 mm diameter aperture on the other side. Group A and Group B micro-lenses were displaced axially.
Figure 1—figure supplement 2
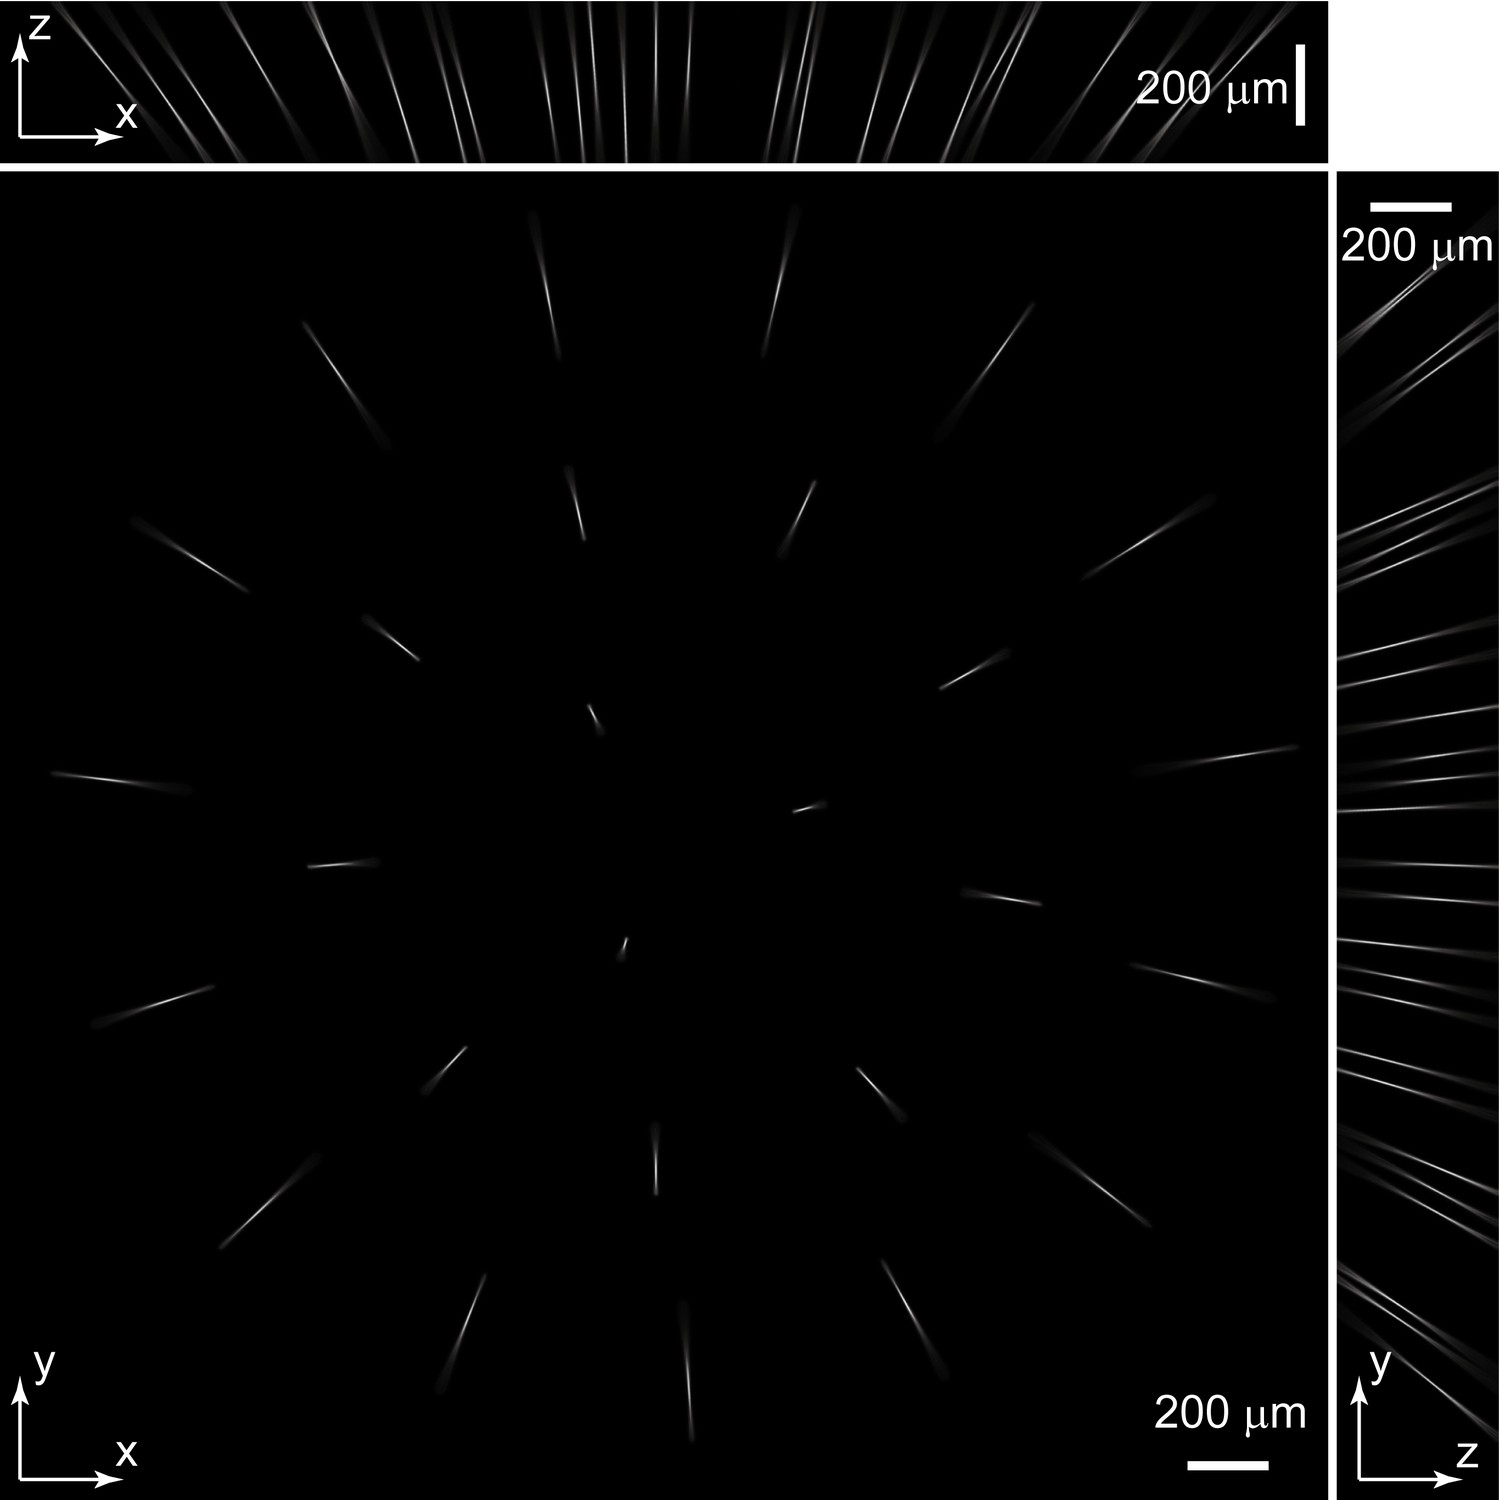
Experimentally measured PSF of the whole imaging system.
Maximum intensity projections (MIPs) of the measured raw PSF stack. The stack was 2048 pixels × 2048 pixels×200 pixels with a voxel size of 1.6 µm × 1.6 μm × 2 μm.
Figure 1—figure supplement 3

PSF of Group A micro-lenses: PSF_A.
Maximum intensity projections (MIP) of PSF_A. PSF_A was extracted from experimentally measured PSF (Figure 1—figure supplement 2) according to individual micro-lens positions in group A.
Figure 1—figure supplement 4

PS F of Group B micro-lenses: PSF_B.
Maximum intensity projections (MIP) of PSF_B. PSF_B was extracted from experimentally measured PSFs (Figure 1—figure supplement 2) according to individual micro-lens positions in group B.
Figure 1—figure supplement 5
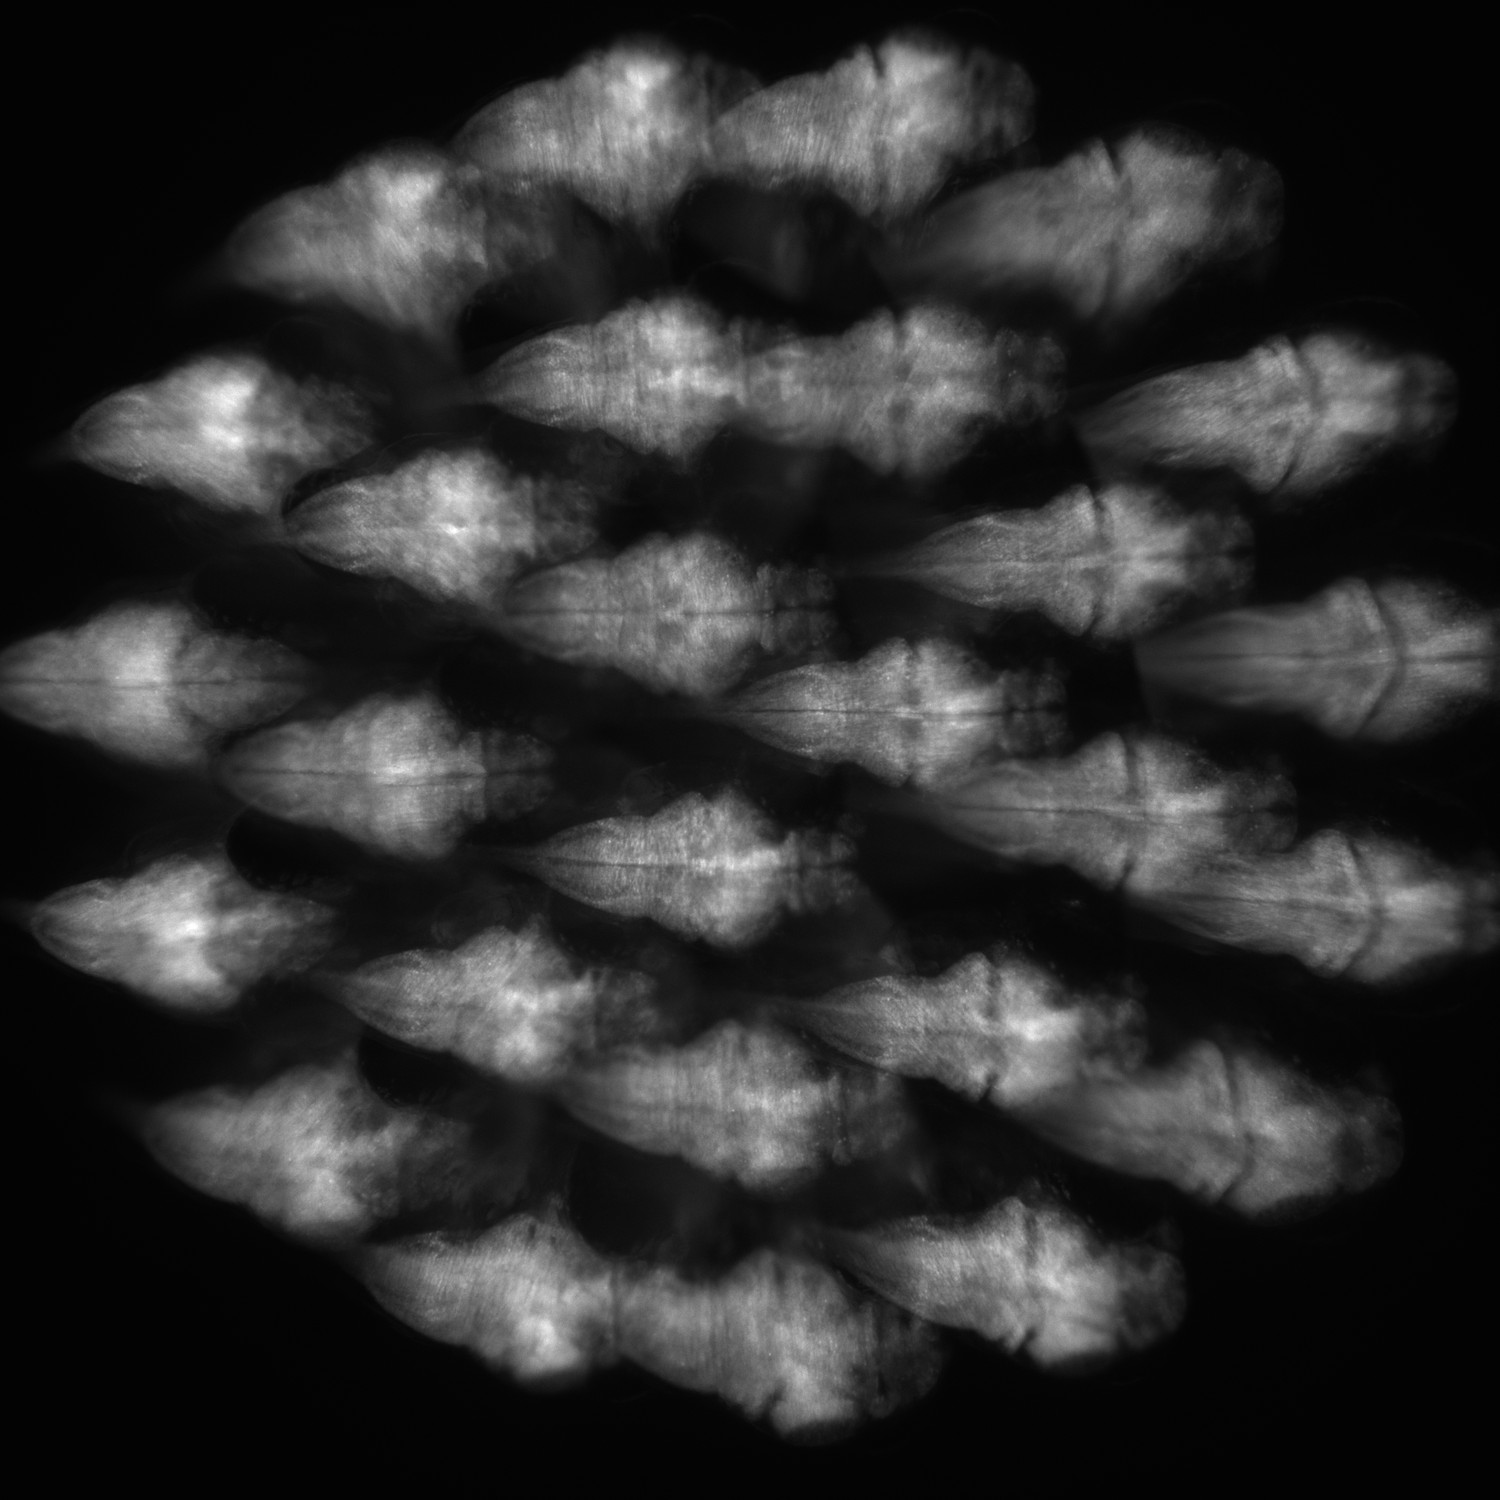
Example of camera captured raw imaging data of larval zebrafish.
Raw fluorescence imaging data consisted of 27 sub-images of a larval zebrafish formed by 27 micro-lenses. Under the condition that the PSF is spatially invariant, which is satisfied apart from small aberrations, the algorithm can handle overlapping fish images.
Figure 1—figure supplement 6
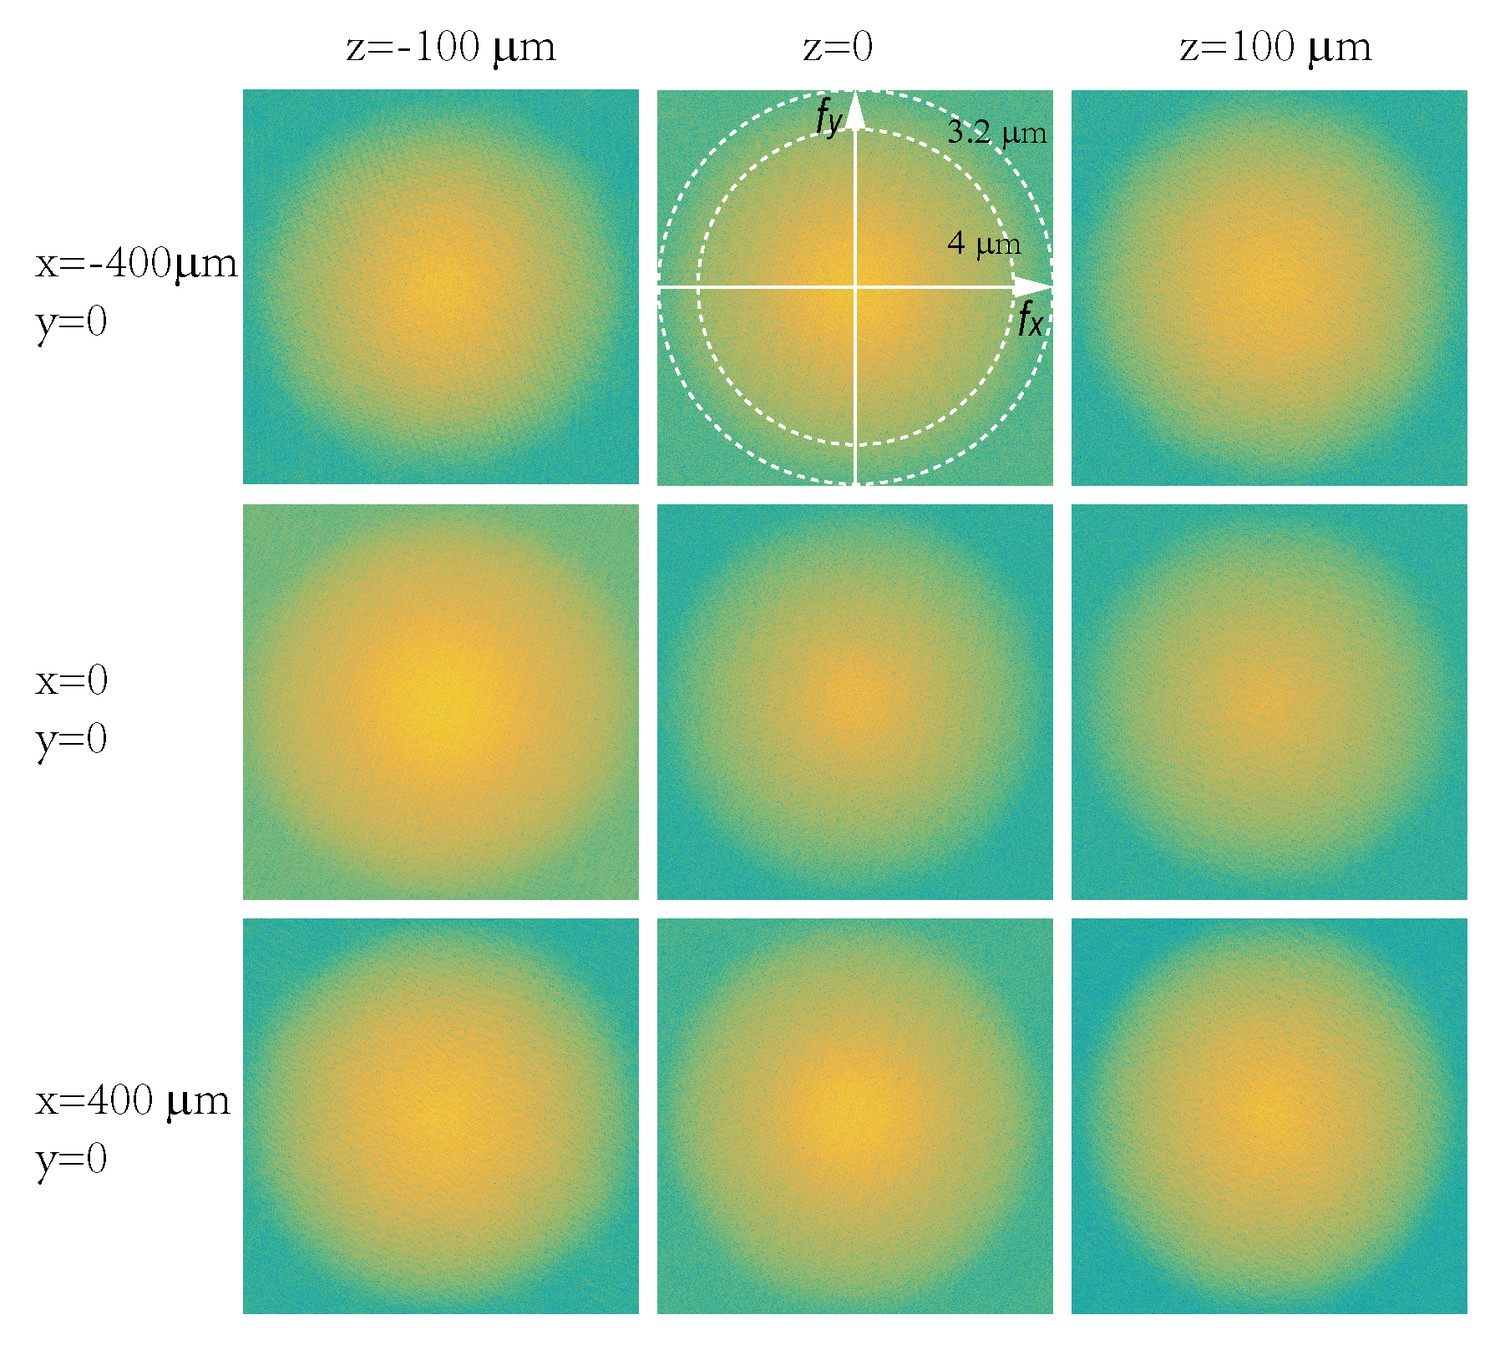
Characterization of in-plane resolution of micro-lenses.
Fourier transforms of raw images of a 0.5- diameter fluorescent particle placed at different locations (x = −400, 0, 400 μm; z = −100, 0, 100 μm) were plotted in log scales. Dashed circles represent in-plane spatial frequency coordinates corresponding to spatial resolutions of 3.2 μm and 4 μm, respectively.
Figure 1—figure supplement 7
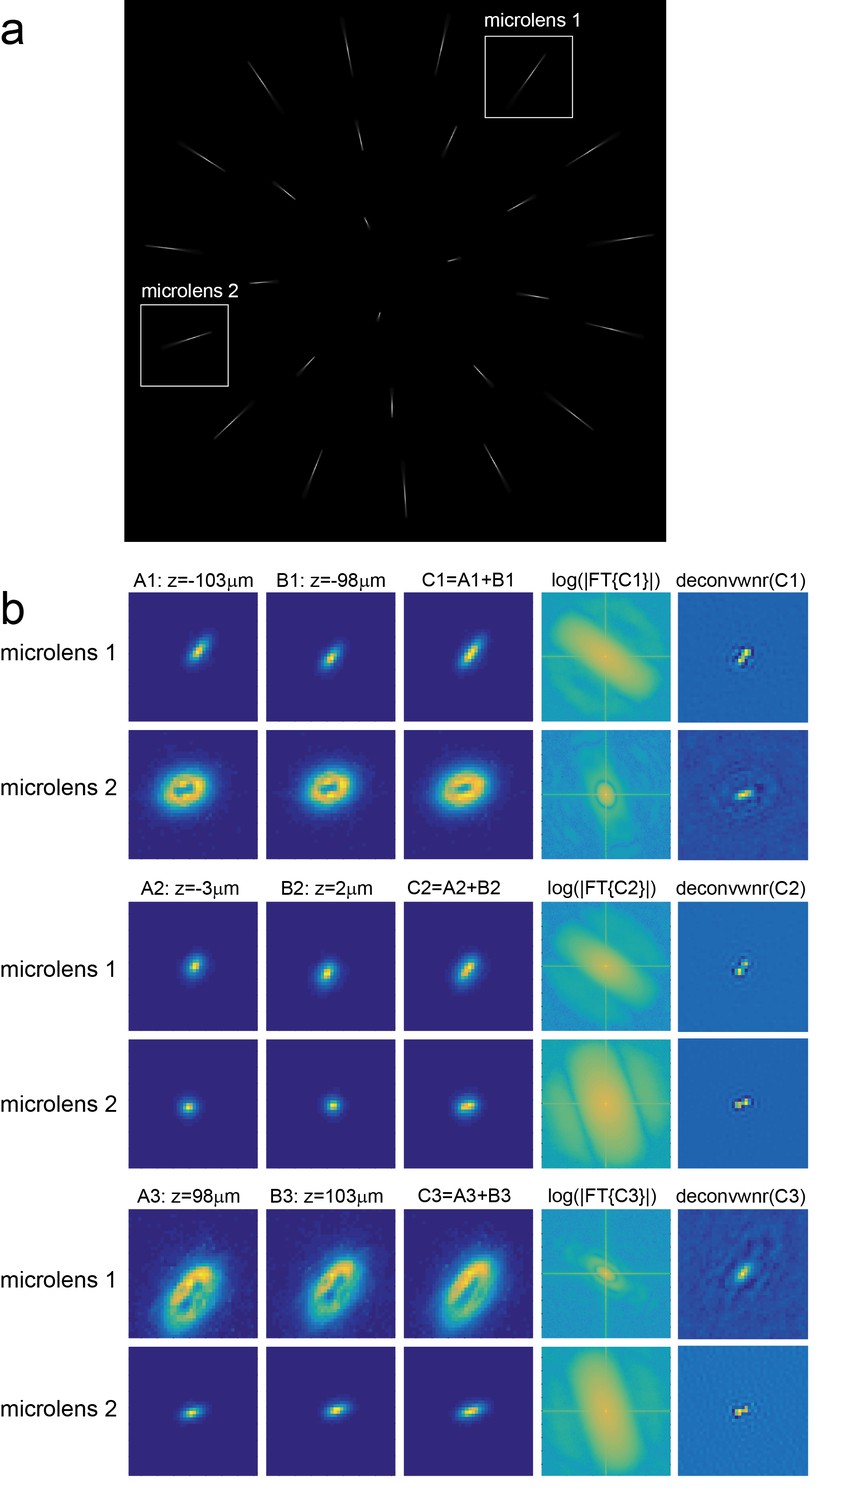
Characterization of axial resolution of XLFM afforded by individual micro-lenses.
Characterization of axial resolution using a 0.5 μm diameter bright fluorescent particle. (a) Maximum intensity projection of an image stack consisting of the particle’s fluorescent images captured at different z positions. (b) Analysis of the images formed by micro-lenses 1 and 2, indicated by sub-regions in (a). The first and second columns are the particle’s fluorescent images captured at different z positions separated by 5 μm. The third column is the sum of columns 1 and 2. The fourth column is the Fourier analysis of column three using function: ), where represents the Fourier transform. The fifth column is the deconvolution of column three using Wiener filtering method. Experimentally measured images of the bead at different z positions (z = −100 μm, z = 0 μm and z = 100 μm) are employed as PSFs to deconvolve different images (C1, C2 and C3), respectively.
Figure 1—figure supplement 8
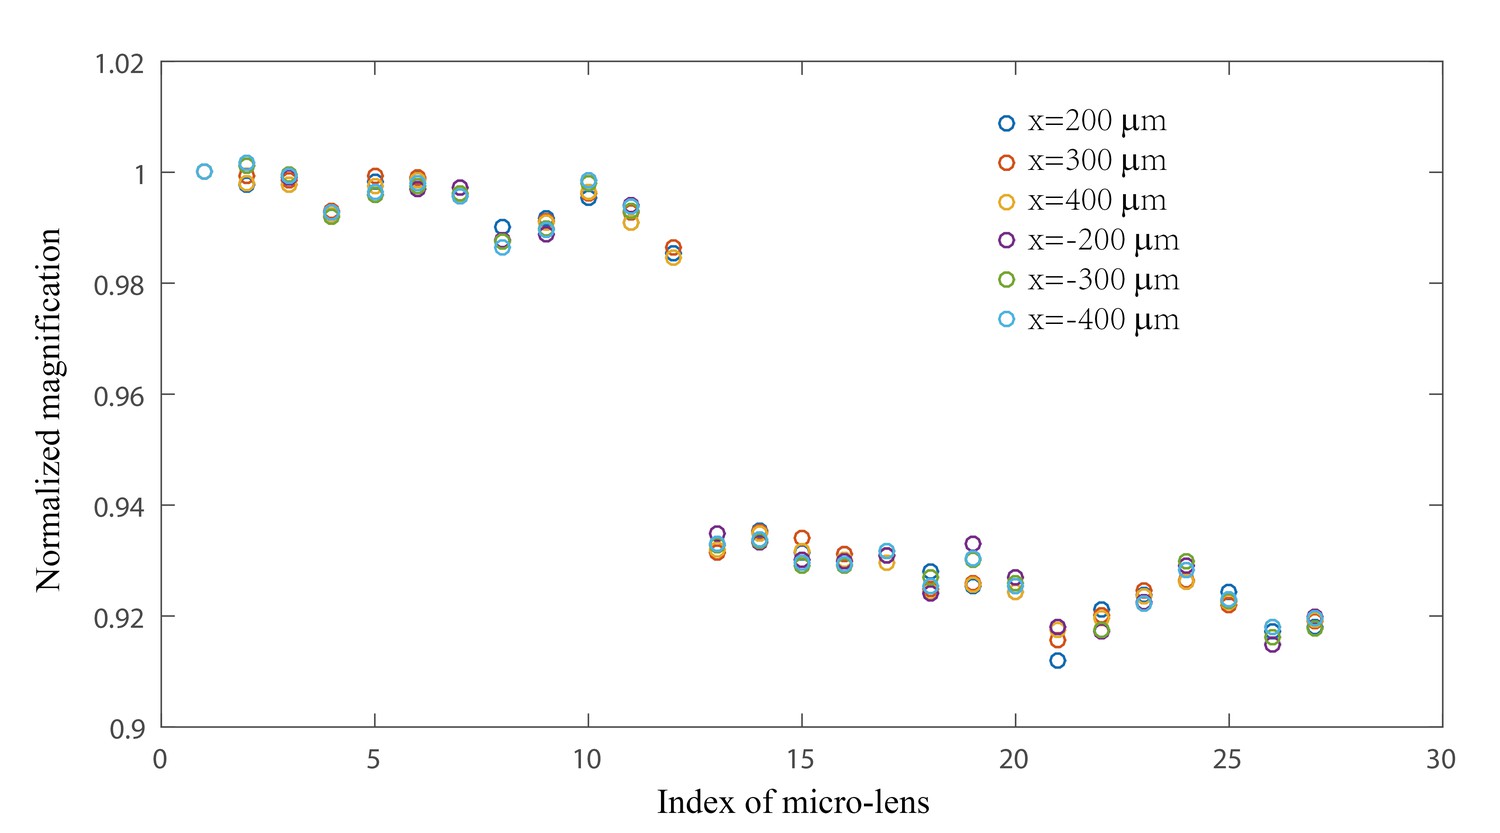
Characterization of magnification variation of micro-lenses in XLFM.
Magnifications of 27 micro-lenses were measured at different locations across the field of view. A fluorescent bead originally placed at the center of the field of view (x, y, z = 0) was moved to six different locations (x = 200 μm, 300 μm, 400 μm, −200 μm, −300 μm, −400 μm, y = 0, z = 0). Six classes of the bead’s image shifts, represented by different colors, were measured. Each class consisted of 27 image shifts formed by 27 micro-lenses. Within each class, image shifts were normalized to the one from the first micro-lens. The first 12 micro-lenses and the rest formed two different groups of micro-lenses: group B and group A, consistent with Figure 1—figure supplements 3 and 4. The magnification variation of a single micro-lens across the field of view was small (<0.3%), suggesting that the spatial invariance of individual micro-lens’ PSF was well preserved across the field of view of Ø = 800 μm. The variation across different micro-lenses within one group (A/B) was more evident (~2%), suggesting that the combined PSF from different micro-lenses was not perfectly spatially invariant.
Figure 1—figure supplement 9
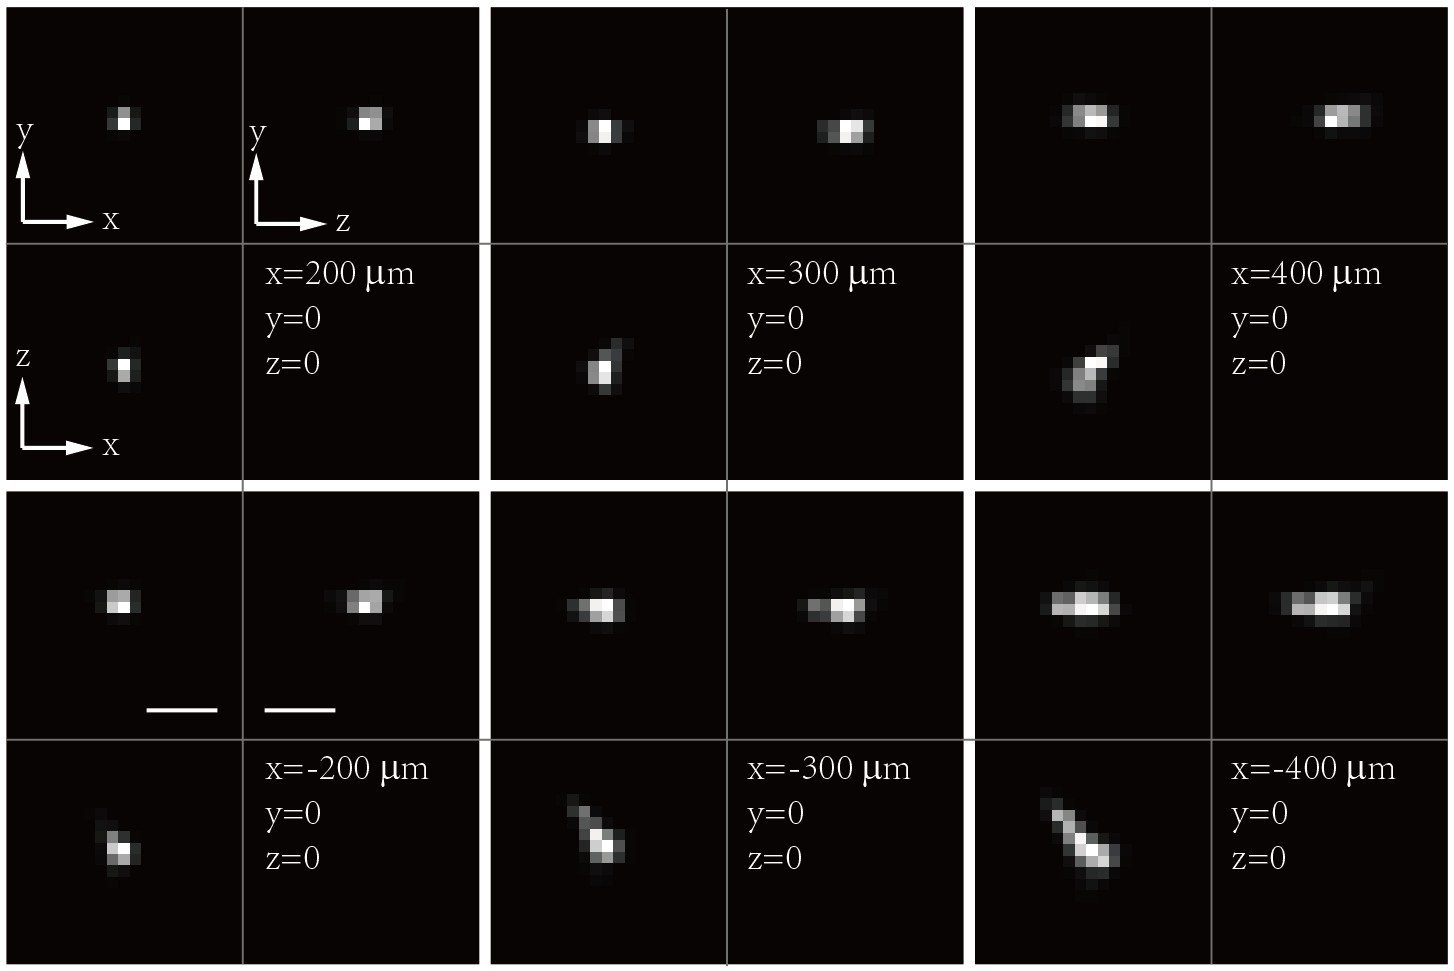
Resolution degradation due to focal length variation of micro-lenses.
Maximum intensity projections (MIPs) of a reconstructed fluorescent bead positioned at different locations across the field of view. As the bead moved to the edge of the field of view, the reconstruction became distorted because the magnification variation of the micro-lenses led to spatial variance of total PSF. Scale bars are 10 µm.
Figure 1—figure supplement 10
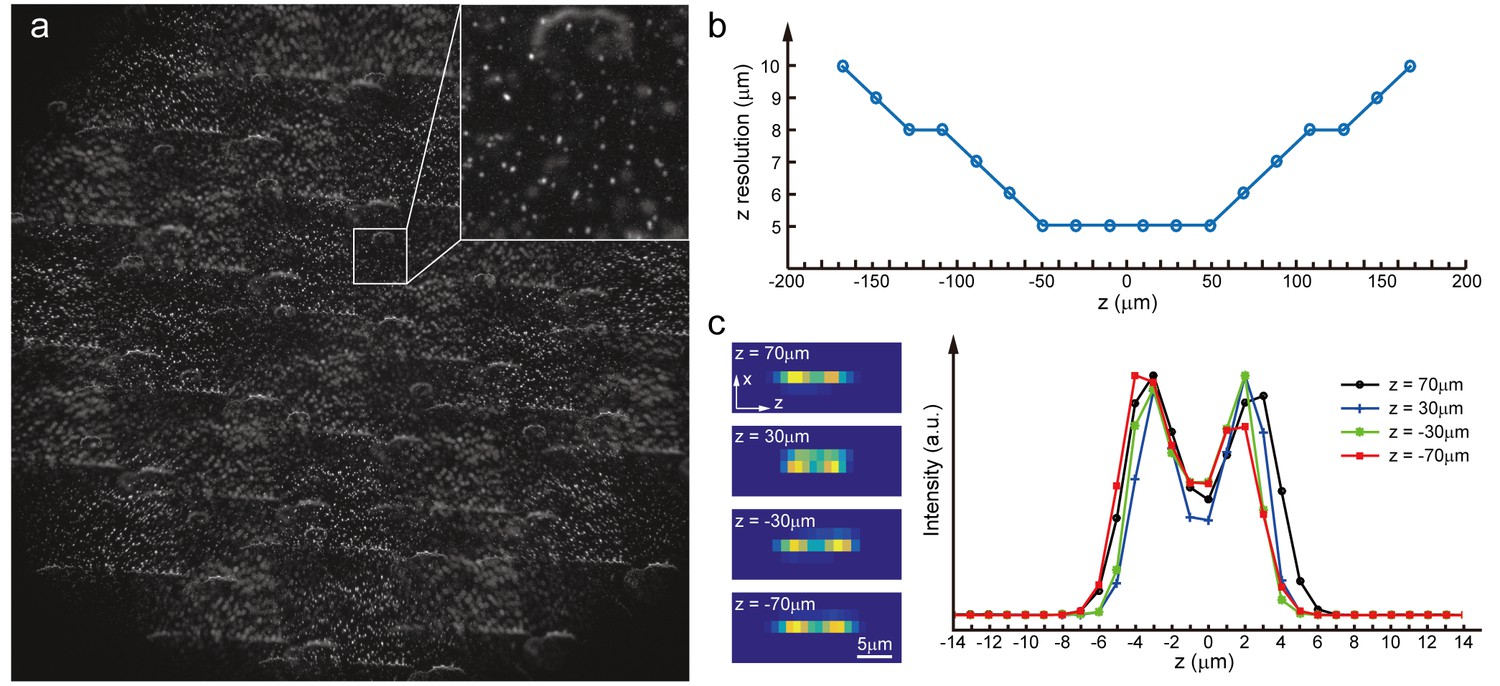
Characterization of axial resolution of XLFM at low SNR.
Characterization of axial resolution using densely packed fluorescent particles (0.5 μm in diameter) at low SNR. (a) Synthetic XLFM raw image (Materials and methods) formed by two layers of fluorescent particles with different z positions. (b) Axial resolution at different depths characterized by the minimum separation of two particles in z, which can be resolved using the reconstruction algorithm (Materials and methods). (c) Left, reconstructed examples of X-Z projections of two particles located at different z positions (−70 μm, −30 μm, 30 μm, 70 μm) with different axial separations (6 μm, 5 μm, 5 μm, 6 μm); right, extracted intensity profiles of these examples.
Figure 1—figure supplement 11
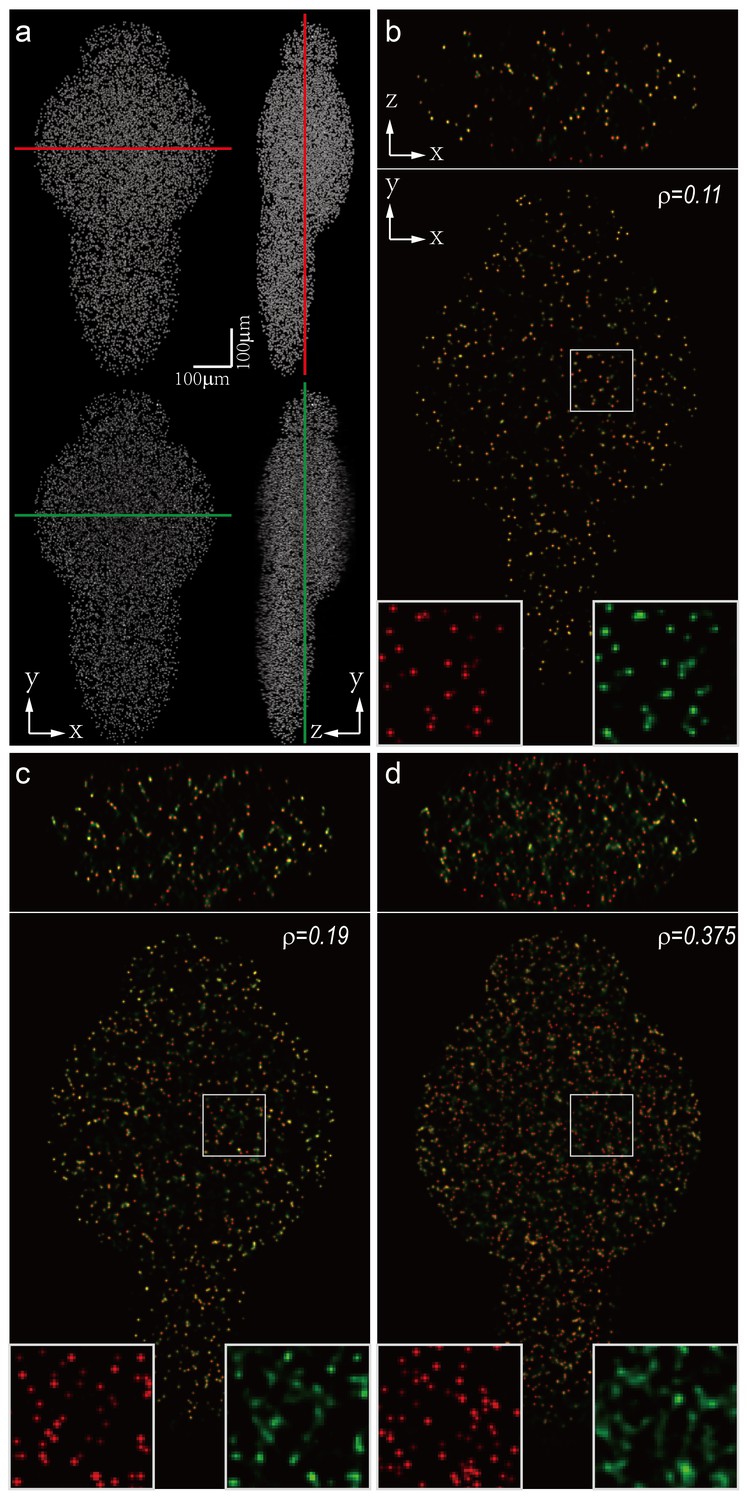
Dependence of imaging resolution on the sparseness of the sample.
Characterization of the dependence of imaging resolution on the sparseness of the sample using computer simulation. (a) Maximum intensity projections (MIPs) of a numerically simulated (top) and reconstructed (bottom) larval zebrafish with randomly distributed active neurons. Red and green lines indicate positions where simulated (red) and reconstructed (green) cross-sections are compared. We assumed that the total number of neurons in the zebrafish brain is 80,000, and gradually increased the sparseness index ρ, the fraction of neurons activated at a given frame. (b–d) Characterization of the reconstruction results for different ρ. Insets are magnified views of rectangular regions. Red and green dots are simulated and reconstructed neurons, respectively.
Figure 1—figure supplement 12
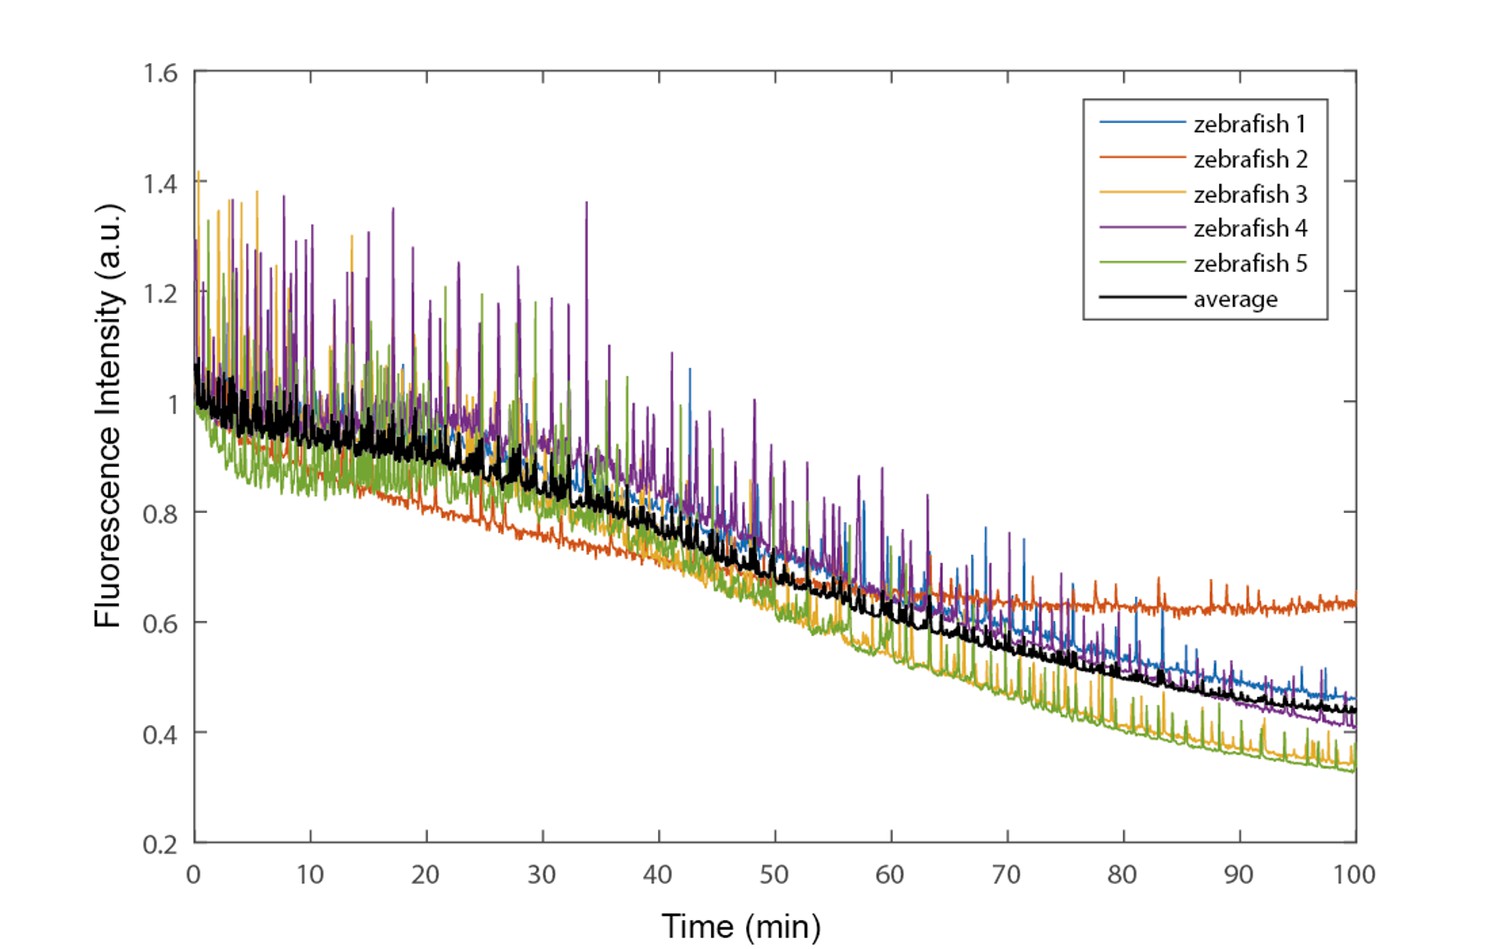
Characterization of photobleaching in fluorescence imaging by XLFM.
Photobleaching was characterized by a total fluorescence intensity change of five 5 dpf zebrafish larval with nucleus-localized GCamp6f (huc:h2b-gcamp6f). Each fish was embedded in 1% agarose and continuously exposed to 2.5 mW/mm2 fluorescence excitation laser (488 nm) illumination. After ~100 min, corresponding to 300,000 volumes with a volume rate of 50 volumes/s, total fluorescence intensity dropped to half of that at the starting point. Random spikes corresponded to spontaneous neural activity. Fish were alive and swam normally when they were relieved from the agarose after imaging.
Figure 2 with 1 supplement
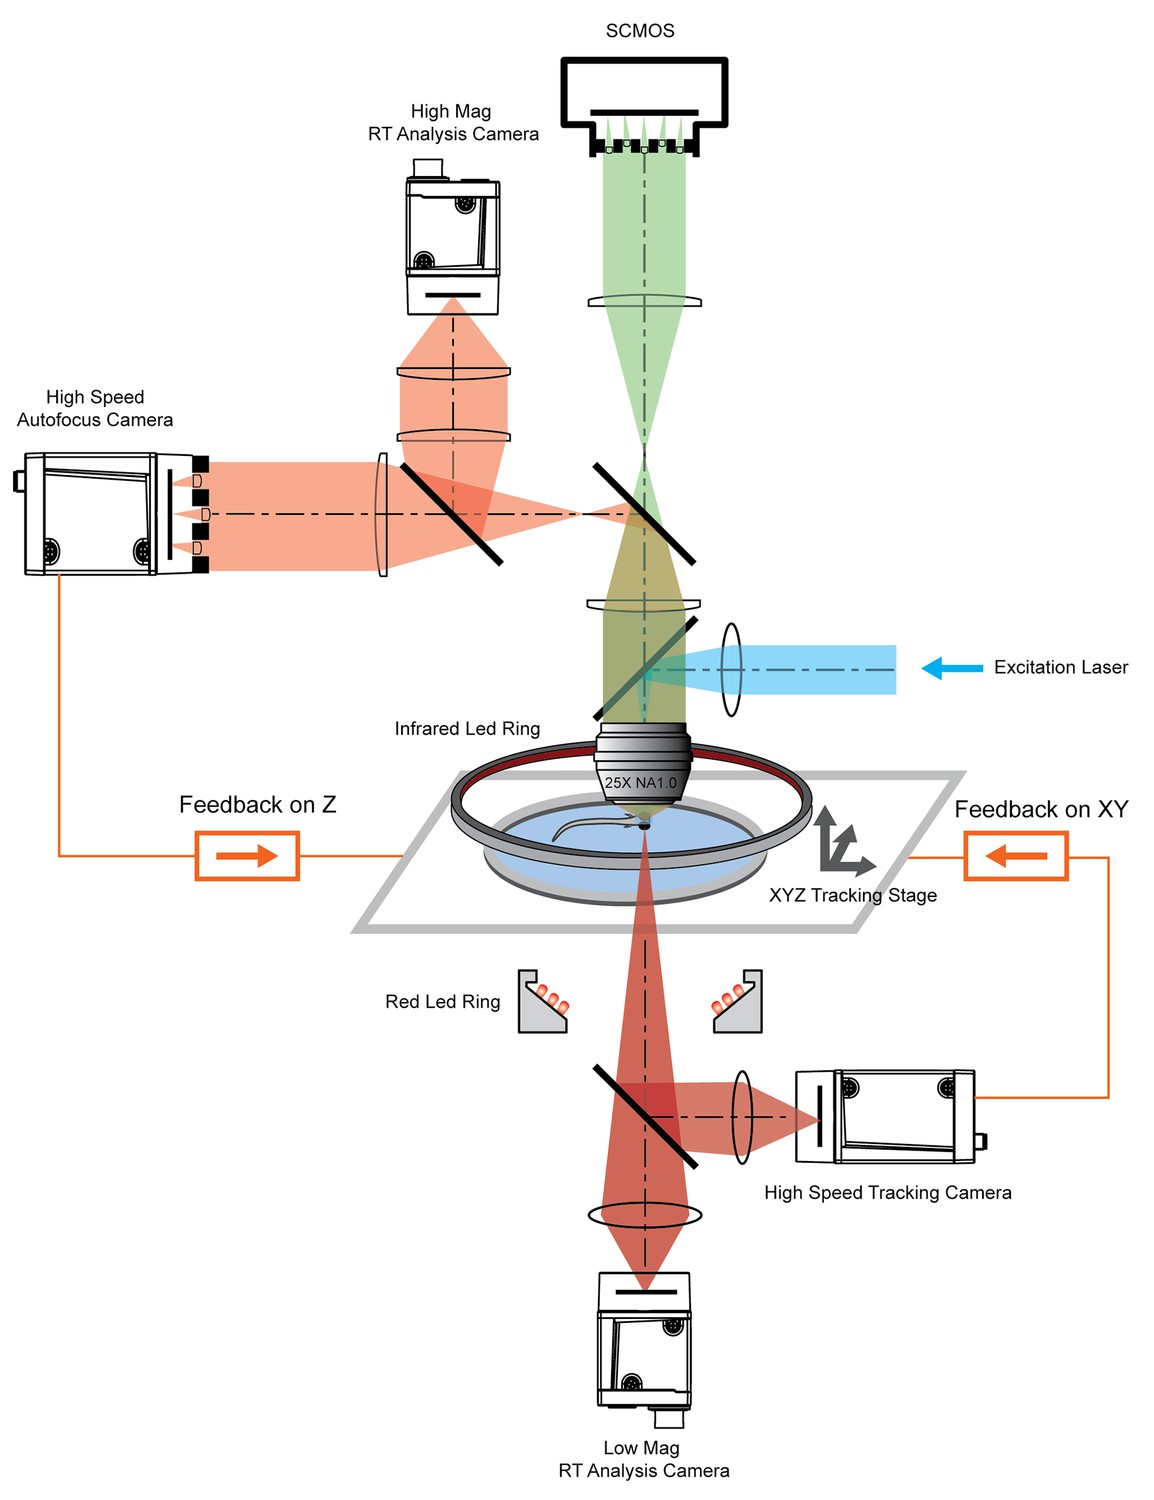
System schematics that integrated tracking, whole brain functional imaging, and real time behavioral analysis.
Larval zebrafish swam in a customized chamber with an optically transparent ceiling and floor. The water-filled chamber was mounted on a high-speed three-axis stage (PI M686 and PI P725KHDS). Customized LED rings generated dark field illumination of the zebrafish. The scattered light was collected by four cameras: two cameras below the chamber were used for x-y plane tracking and low magnification real-time (RT) analysis, respectively; two cameras above the chamber and after the imaging objective were used for Z autofocus and high magnification RT analysis. The positional information of the larval zebrafish, acquired from the tracking and autofocus system, was converted to feedback voltage signals to drive the three-axis stage and to compensate for fish movement. The functional imaging system, described in Figure 1, shared the same imaging objective placed above the swimming chamber. The 3D tracking, RT behavioral analysis, and functional imaging system were synchronized for accurate correlation between neural activity and behavioral output.
Figure 2—figure supplement 1

Characterization of the autofocus system.
(a) Autofocus camera behind a one-dimensional lenslet array captured triplet images of the fish head (up). Its autocorrelation function was computed (bottom). (b) Central line profile of the autocorrelation function was extracted and inter-fish distance was computed as local maximums in the autocorrelation function. (c) Axial shift of the fish head, calibrated by moving the piezo at a constant interval, changed linearly (red line) with inter-fish distance.
Figure 3
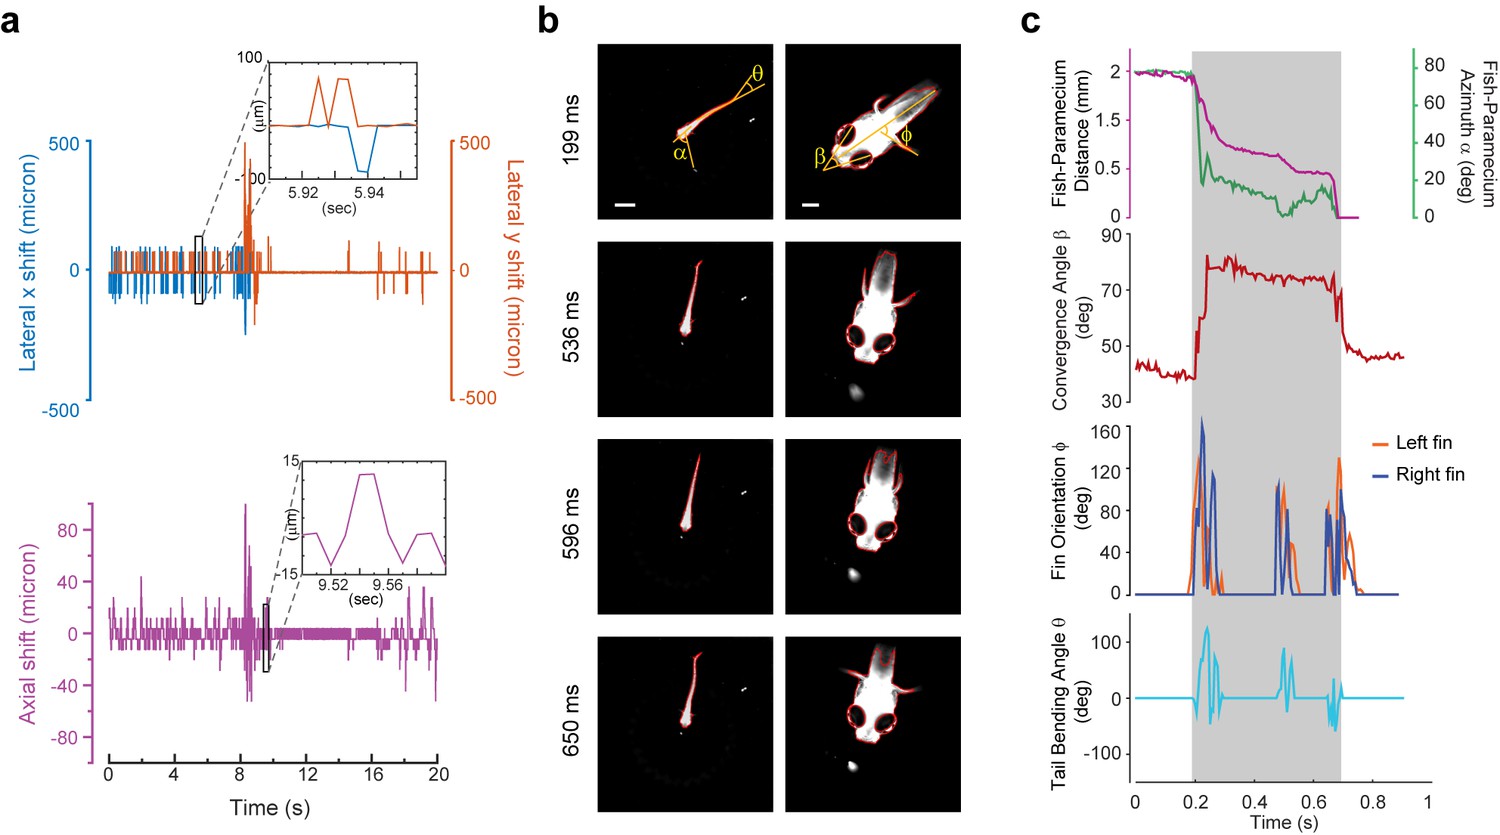
3D tracking of larval zebrafish.
(a) Representative time varying error signals in three dimensions, defined as the difference between real head position and set point. Inset provides magnified view at short time interval. Lateral movement can be rapidly compensated for within a few milliseconds with an instantaneous velocity of up to 10 mm/s. The axial shift was small compared with the depth coverage (200 μm) during whole brain imaging, and thereby had minor effect on brain activity reconstruction. (b) Tracking images at four time points during prey capture behavior, acquired at low (left) and high (right) magnification simultaneously. Scale bars are 1 mm (left) and 200 μm (right). (c) Kinematics of behavioral features during prey capture. Shaded region marks the beginning and end of the prey capture process.
Figure 4
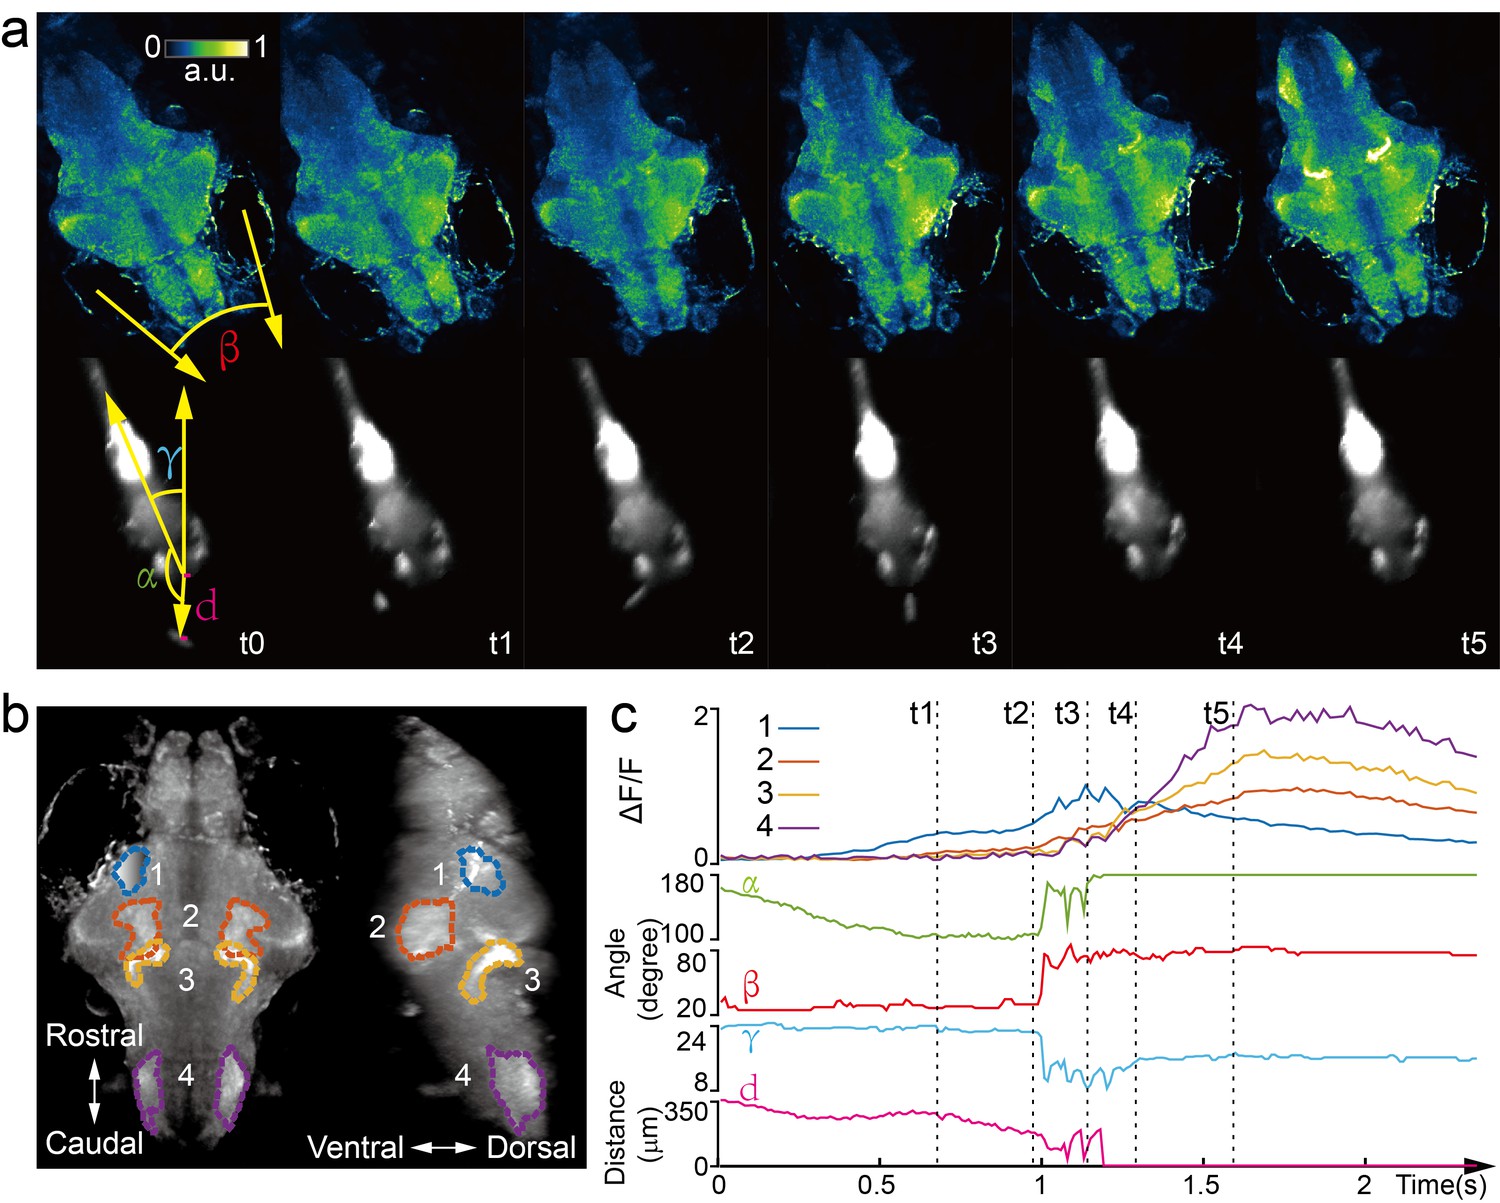
Whole brain imaging of larval zebrafish during prey capture behavior.
(a) Renderings of whole brain calcium activity at six time points (up) and the corresponding behavioral images (bottom). Features used to quantify behavior were: fish-paramecium azimuth α; convergence angle between eyes β; head orientation γ; and fish-paramecium distance d. (b) Maximum intensity projections of zebrafish brain with pan-neuronal cytoplasm-labeled GCaMP6s (huc:gcamp6s). Boundaries of four brain regions are color marked. (c) Neural dynamics inferred from GCaMP6 fluorescence changes in these four regions during the entire prey capture behavior (up) and the kinematics of behavioral features (bottom). Note that between t2 and t4, fish-paramecium distance d exhibits three abrupt kinks, representing the three attempts to catch prey.
Author response image 1
Author response image 2

Point spread function of XLFM.
Author response image 3

Resolution degradation caused by magnification variation of micro-lenses in XLFM.
Videos
Video 1
Whole brain functional imaging of larval zebrafish under light stimulation.
Whole brain XLFM imaging of a 5 dpf agarose-embedded larval zebrafish expressing nucleus-localized GCamp6f (huc:h2b-gcamp6f). Light stimulation was introduced at time point t = 0. Whole brain activity was recorded at 77 volumes/s.
Video 2
Whole brain functional imaging of spontaneous activities of larval zebrafish.
Whole brain XLFM imaging of a 5 dpf agarose-embedded larval zebrafish expressing nucleus-localized GCamp6f (huc:h2b-gcamp6f). Spontaneous neural activity was recorded at 0.6 volumes/s.
Video 3
Whole brain functional imaging of spontaneous activities of larval zebrafish.
Whole brain XLFM imaging of a 5 dpf agarose-embedded larval zebrafish expressing cytoplasm-labeled GCamp6s (huc:gcamp6s). Spontaneous neural activity was recorded at 0.6 volumes/s.
Video 4
Whole brain functional imaging of larval zebrafish under light stimulation.
Whole brain XLFM imaging of a 5 dpf agarose-embedded larval zebrafish expressing cytoplasm-labeled GCamp6s (huc:gcamp6s). Light stimulation was introduced at time point t = 0. Whole brain activity was recorded at 50 volumes/s.
Video 5
Tracking of larval zebrafish during prey capture behavior at low resolution
Tracking and real time kinematic analysis of larval zebrafish during prey capture behavior at low resolution. Recorded at 190 frames/s.
Video 6
Tracking of larval zebrafish during prey capture behavior at high resolution.
Tracking and real time kinematic analysis of larval zebrafish during prey capture behavior at high resolution. Recorded at 160 frames/s.
Video 7
Whole brain functional imaging of a freely swimming larval zebrafish under light stimulation
Whole brain XLFM imaging of a 7 dpf freely swimming larval zebrafish expressing cytoplasm-labeled GCamp6s (huc:gcamp6s). Light stimulation was introduced at time point t = 0. Whole brain activities were recorded at 77 volumes/s and with a flashed excitation laser under 0.3 ms exposure time.
Video 8
Whole brain functional imaging of a freely swimming larval zebrafish during prey capture behavior.
Whole brain XLFM imaging of an 11 dpf freely swimming larval zebrafish expressing cytoplasm-labeled GCamp6s (huc:gcamp6s). The entire process during which the larval zebrafish caught and ate the paramecium was recorded.
Video 9
Whole brain functional imaging of a freely swimming larval zebrafish during prey capture behavior.
Whole brain XLFM imaging of a 7 dpf freely swimming larval zebrafish expressing nucleus-localized GCamp6f (huc:h2b-gcamp6f). The entire process during which the larval zebrafish caught and ate the paramecium was recorded.
Additional files
-
Source code 1
Computer-Aided design files of mounting plates for micro-lenses array.
- https://doi.org/10.7554/eLife.28158.029
-
Source code 2
Source code for XLFM reconstruction.
- https://doi.org/10.7554/eLife.28158.030
-
Source code 3
Source code for Real-Time behavioral analysis.
- https://doi.org/10.7554/eLife.28158.031
-
Supplement file 1
Acquisition parameters for fluorescence imaging.
- https://doi.org/10.7554/eLife.28158.032
-
Transparent reporting form
- https://doi.org/10.7554/eLife.28158.033
Download links
A two-part list of links to download the article, or parts of the article, in various formats.
Downloads (link to download the article as PDF)
Open citations (links to open the citations from this article in various online reference manager services)
Cite this article (links to download the citations from this article in formats compatible with various reference manager tools)
Rapid whole brain imaging of neural activity in freely behaving larval zebrafish (Danio rerio)
eLife 6:e28158.
https://doi.org/10.7554/eLife.28158


