The ESRP1-GPR137 axis contributes to intestinal pathogenesis
- University of Bern, Switzerland
- University Hospital Zurich, Switzerland
- Inselspital, Bern University Hospital, University of Bern, Switzerland
- University of Texas Southwestern Medical Center, United States
- The Scripps Research Institute, United States
Figures
Figure 1 with 1 supplement
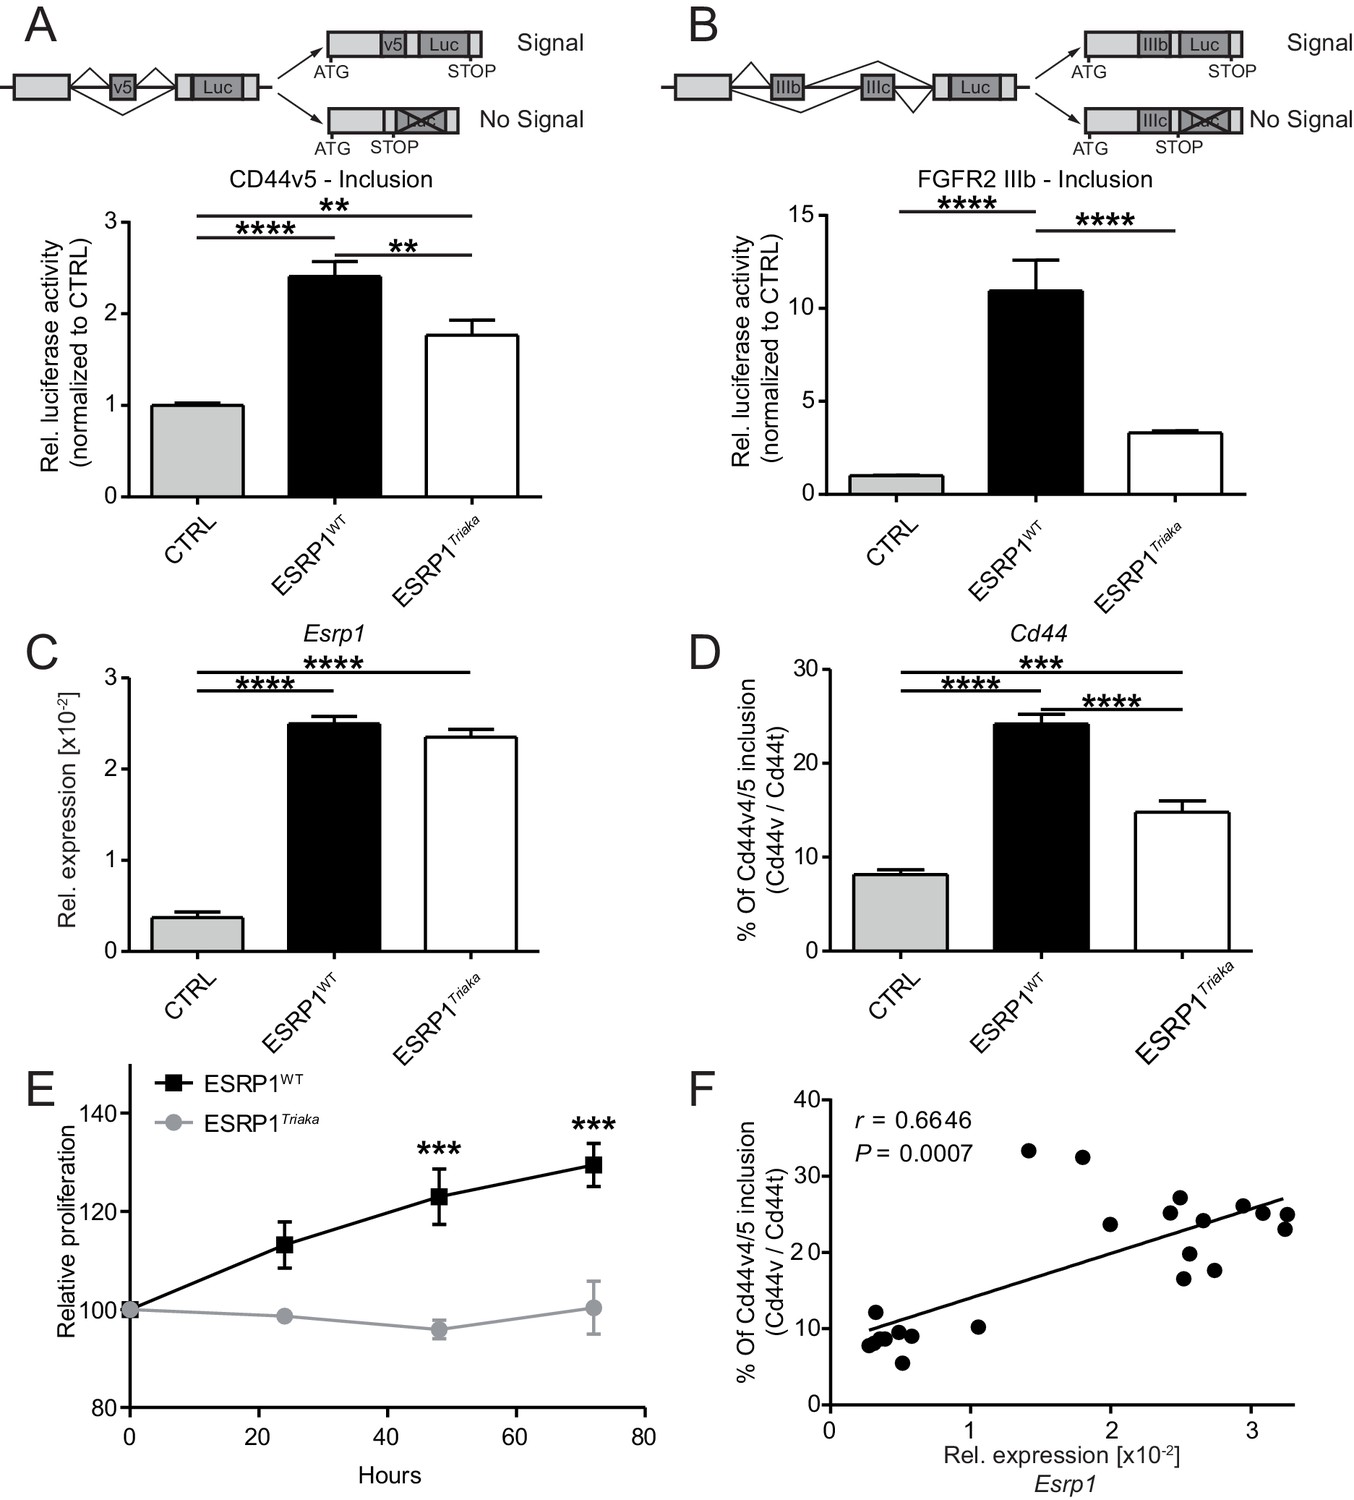
Esrp1Triaka leads to altered mRNA splicing and reduced epithelial cell proliferation.
To quantify exon splicing, HEK-293 cells were co-transfected with a vector encoding Esrp1WT or Esrp1Triaka or an empty control (CTRL) vector and with an exon trap construct containing (A) Cd44 variant 5 (Cd44v5) or (B) Ffgr2-IIIb variable exon. Upper panels in (A) and (B) show schemes of the respective exon trap constructs. Inclusion of exon Cd44v5 or Ffgr2-IIIb results in luciferase (Luc) expression. Luciferase activity normalized to control vector-transfected cells is shown in the lower panels. Relative expression of (C) Esrp1 and (D) Cd44v4/5 transcripts were measured in CMT-93 cells transduced with inducible vectors encoding Esrp1WT, Esrp1Triaka, or a control construct, after treatment with 4-hydroxytamoxifen. (E) Proliferation of Esrp1WT- and Esrp1Triaka-expressing CMT-93 cells was measured using a WST-1 assay and normalized to control vector-transduced cells. (F) Relative expression of Esrp1 and Cd44v4/5 transcripts were measured in CMT-93 cells transduced with a vector encoding Esrp1WT, after induction with 4-hydroxytamoxifen, and correlated. Data represent: Pooled means ± standard error of the mean from (A and B) five or (C–E) three independent experiments performed in biological triplicates. (F) Means measured in technical duplicates (n = 22). Statistics: (A–D) One-way ANOVA with Bonferroni post-test. (E) Two-way ANOVA with Bonferroni post-test. (F) Spearman correlation. **p<0.01; ***p<0.001; ****p<0.0001.
Figure 1—figure supplement 1
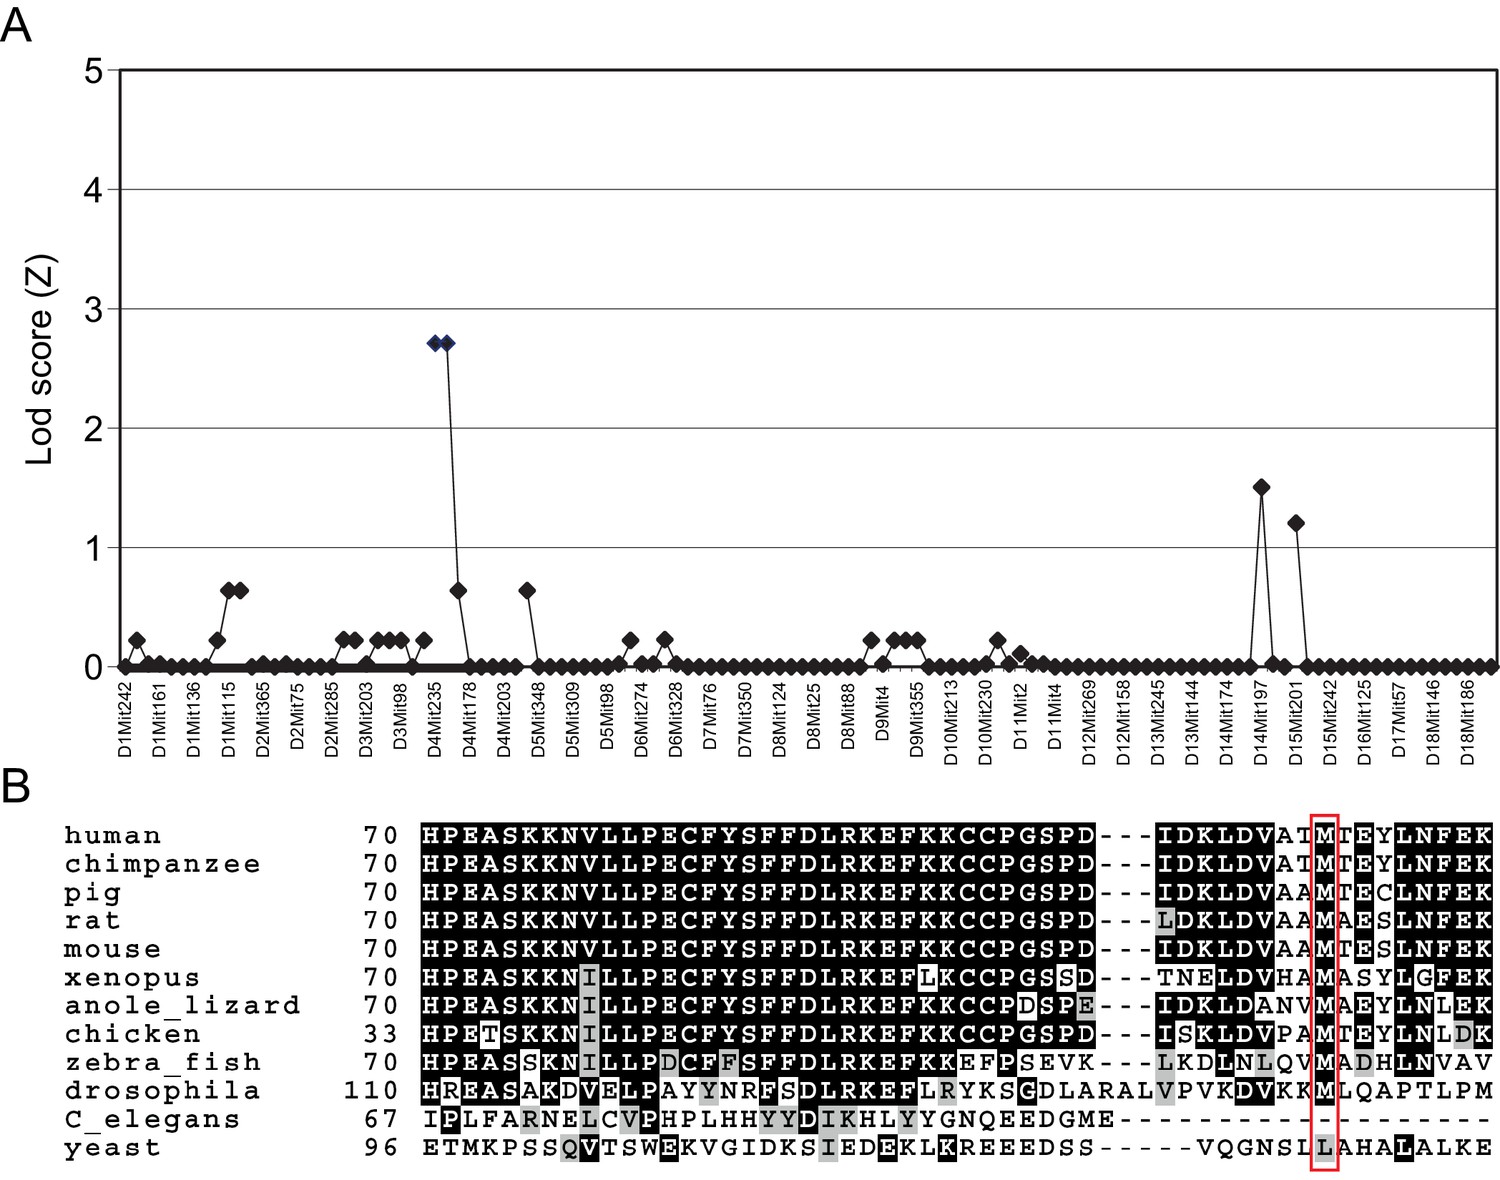
Mapping of the Triaka mutation.
(A) The Triaka mutation was mapped based on the hyperactivity and circling phenotype of the strain to proximal Chromosome 4, with a peak LOD score of 2.71 at D4Mit235. (B) The Triaka mutation causes a methionine to valine substitution at the amino acid position 161 (M161V) of the gene Esrp1. The mutated residue is conserved in several species and is indicated by a red box.
Figure 2 with 1 supplement
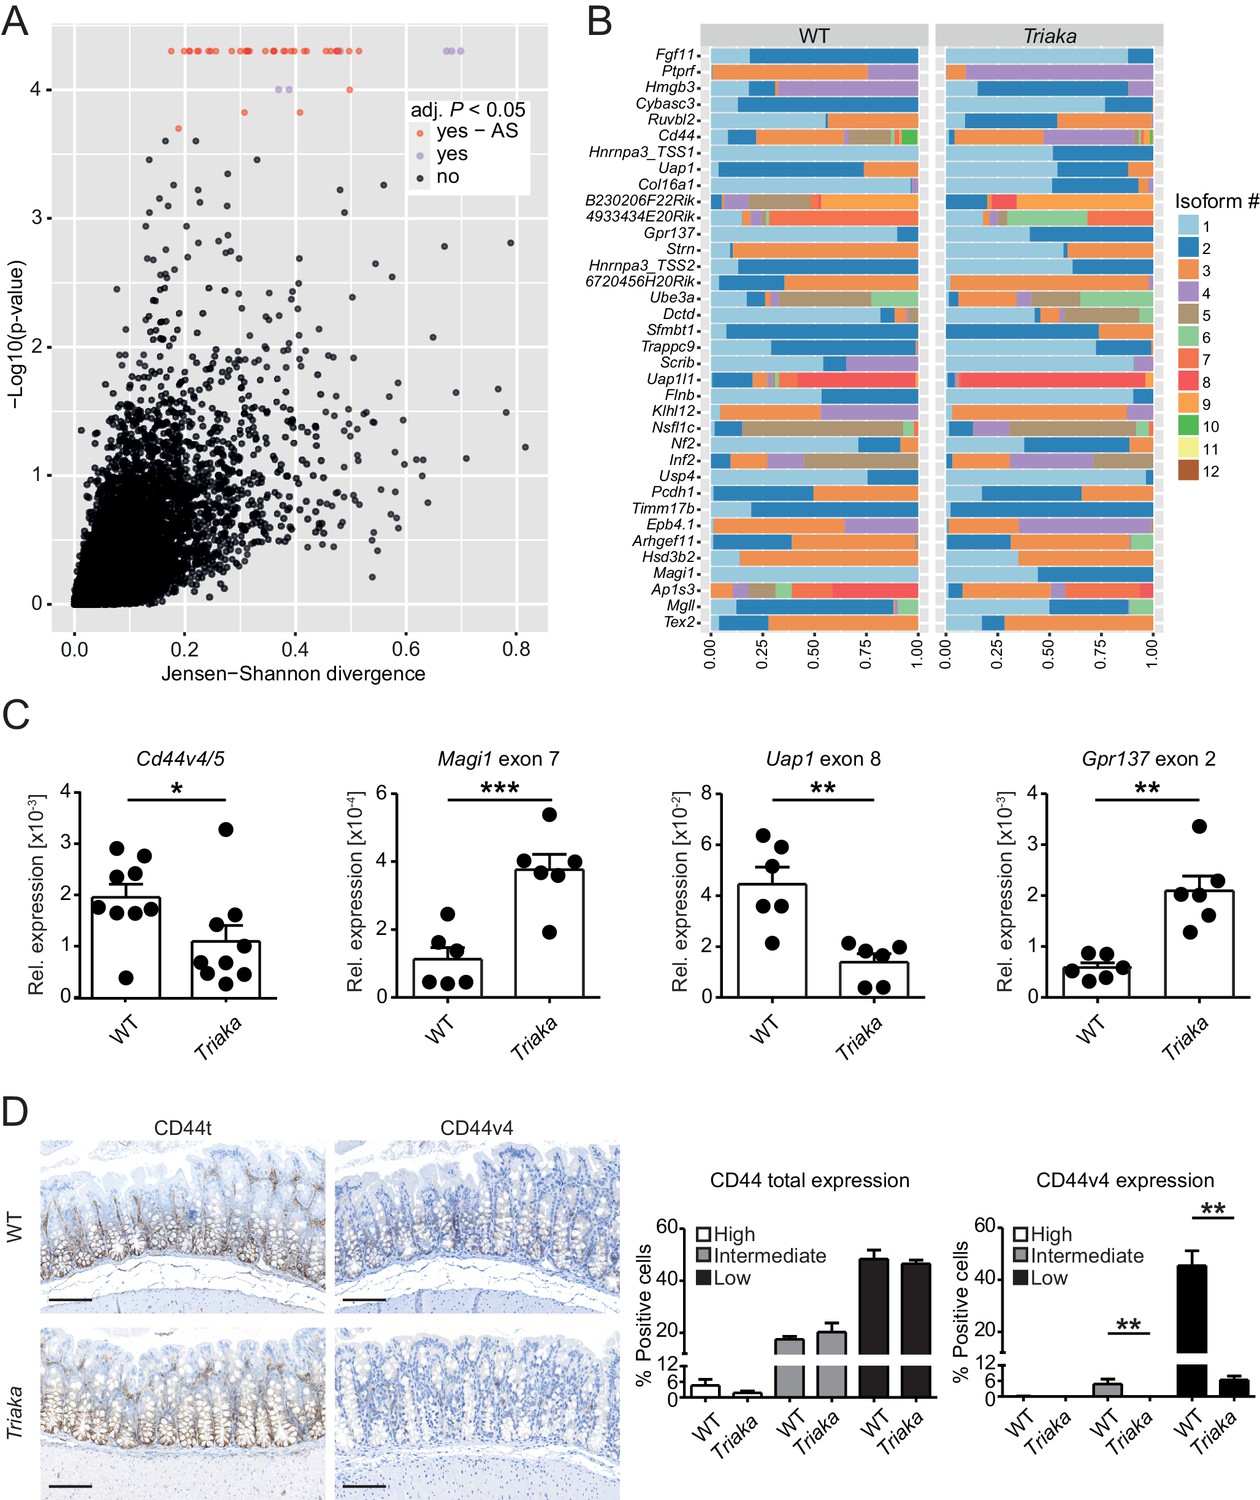
Esrp1Triaka alters mRNA splicing patterns in colonic intestinal epithelial cells.
(A) RNA sequencing analysis was performed on colonic intestinal epithelial cells (cIECs) isolated from WT and Triaka mice. Dot plot indicating the relative difference in isoform usage for a given transcription start site expressed as Jensen-Shannon divergence and the associated p-values. Analysis was performed through CummeRbund and FDR-adjusted p-value<0.05 were considered significant. Red and orange dots represent genes with differences in transcript isoforms generated by bona fide alternative splicing (AS) events or by other mechanisms, respectively (n = 4 donor mice per group). (B) Panel showing the relative frequency of the different isoforms identified as AS events in (A) for 36 transcription start sites and from 35 genes, in WT versus Triaka cIECs. (C) Transcript levels for the indicated isoforms were measured in WT and Triaka cIECs using qPCR and normalized to Gapdh expression (n = 6–11 mice per group). Cd44v4-5: Cd44 variant 4–5. (D) Immunohistochemistry was performed on colonic tissue of indicated mice to detect total CD44 (CD44t) or CD44v4. Representative pictures and percentage of positive cells for the indicated staining intensities are shown (n = 5–6 mice per group, pooled from three independent experiments). Histograms represent the mean ± standard error of the mean. Statistics: (C) Student's t test; (D) Mann-Whitney test. *p<0.05; **p<0.01; ***p<0.001; ****p<0.0001.
-
Figure 2—source data 1
Altered ratios of transcript isoforms in Triaka epithelial cells.
- https://doi.org/10.7554/eLife.28366.007
Figure 2—figure supplement 1
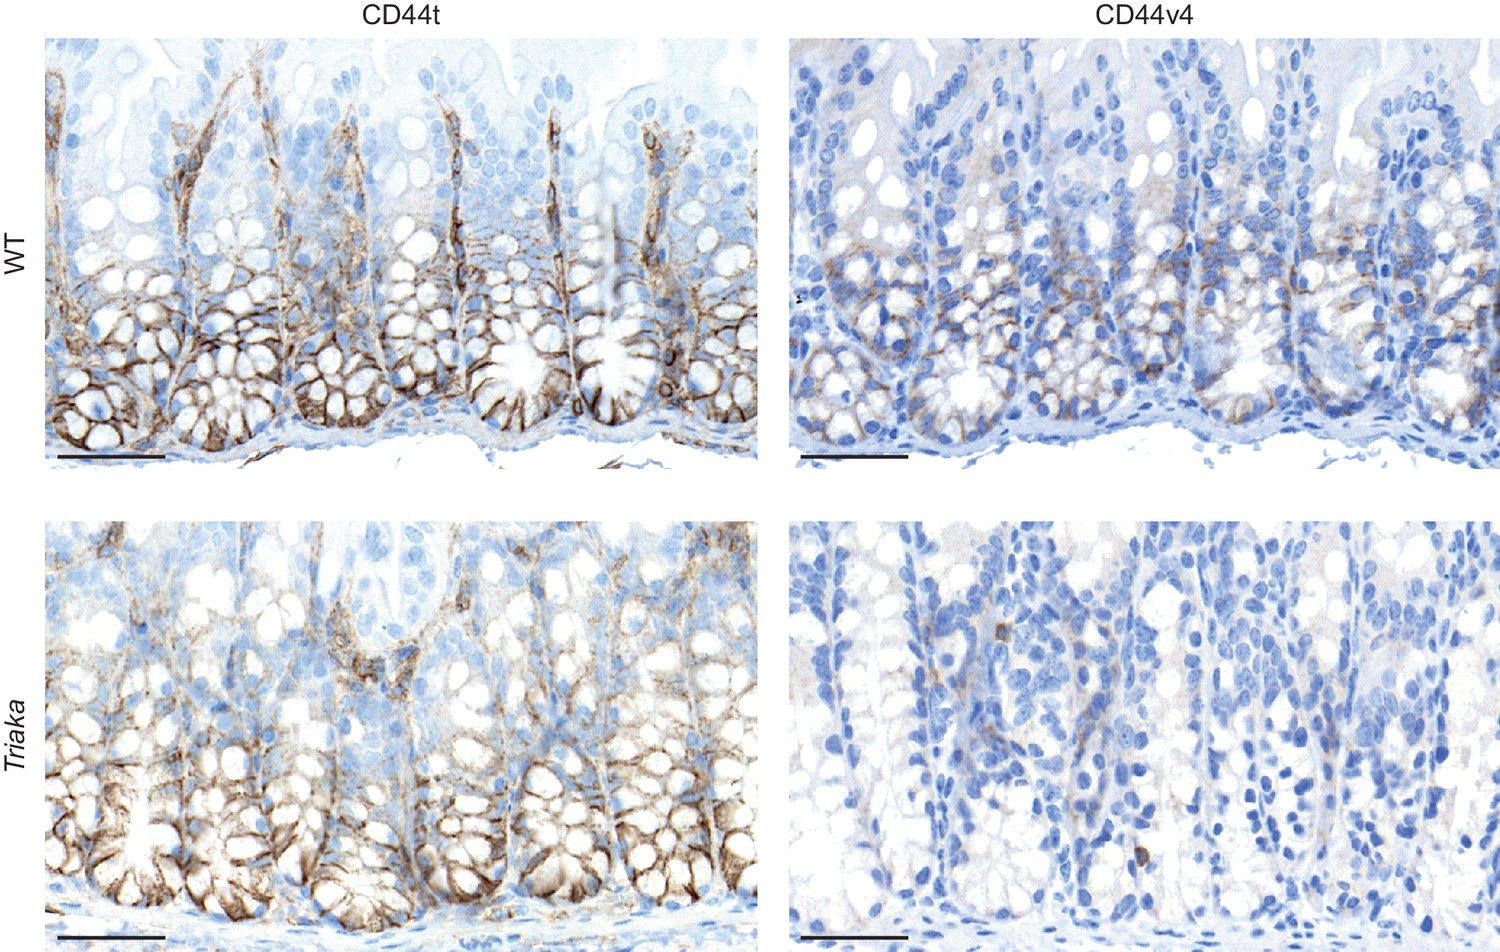
CD44 expression in Triaka and WT colons.
Immunohistochemistry was performed on colonic tissue of indicated mice to detect total CD44 (CD44t) or CD44v4. Representative pictures are shown. Scale bars: 50 µm (magnification of data shown in Figure 2D).
Figure 3 with 3 supplements

Esrp1Triaka decreases the barrier function of the intestine.
(A) Representative flow cytometry plot of colonic single cells stained for EpCAM and CD45 (left panel). Representative histogram indicating surface E-cadherin expression on EpCAM+ epithelial cells (right panel). (B) Median fluorescence intensity (MFI) of E-cadherin expression on EpCAM+ cells from WT and Triaka mice. Data from one representative experiment of three are shown (n = 5 mice per group). (C) Intestinal barrier resistance in colonic tissue of WT and Triaka was measured using an Ussing chamber (n = 6 mice per group, pooled from two independent experiments). (D) Immunofluorescence for 16S rRNA (in red) was performed on colon tissue. Nuclei were visualized with DAPI. White arrows indicate presence of bacterial products in mucus and crypts of Triaka mice. Representative pictures are shown (n = 7–8 mice per group). Scale bars: overview: 200 µm; detail: 100 µm. (E) Commensal-specific IgG1 and IgG2b antibodies were assessed in the serum of WT and Triaka animals. Representative flow cytometry histograms are shown (n = 10 per group). Data are shown as mean ± standard error of the mean. Statistics: (B) and (C) Student's t test. **p<0.01; ****p<0.0001.
-
Figure 3—source data 1
Gene expression and pathway analysis.
- https://doi.org/10.7554/eLife.28366.012
Figure 3—figure supplement 1

Esrp1Triaka alters the expression of genes associated with cell proliferation.
RNA sequencing data were used to perform a gene set enrichment analysis using the SetRank method. LogFC plots show genes that are differently expressed in Triaka versus WT colonic intestinal epithelial cells (n = 4 donor mice per group). The color of each dot reflects the log2 fold change and the size of a dot represents the Benjamini-Hochberg adjusted p-value of a gene involved in the indicated pathways. Genes with individual significant p-values are indicated and p-value for the indicated pathways are shown.
Figure 3—figure supplement 2
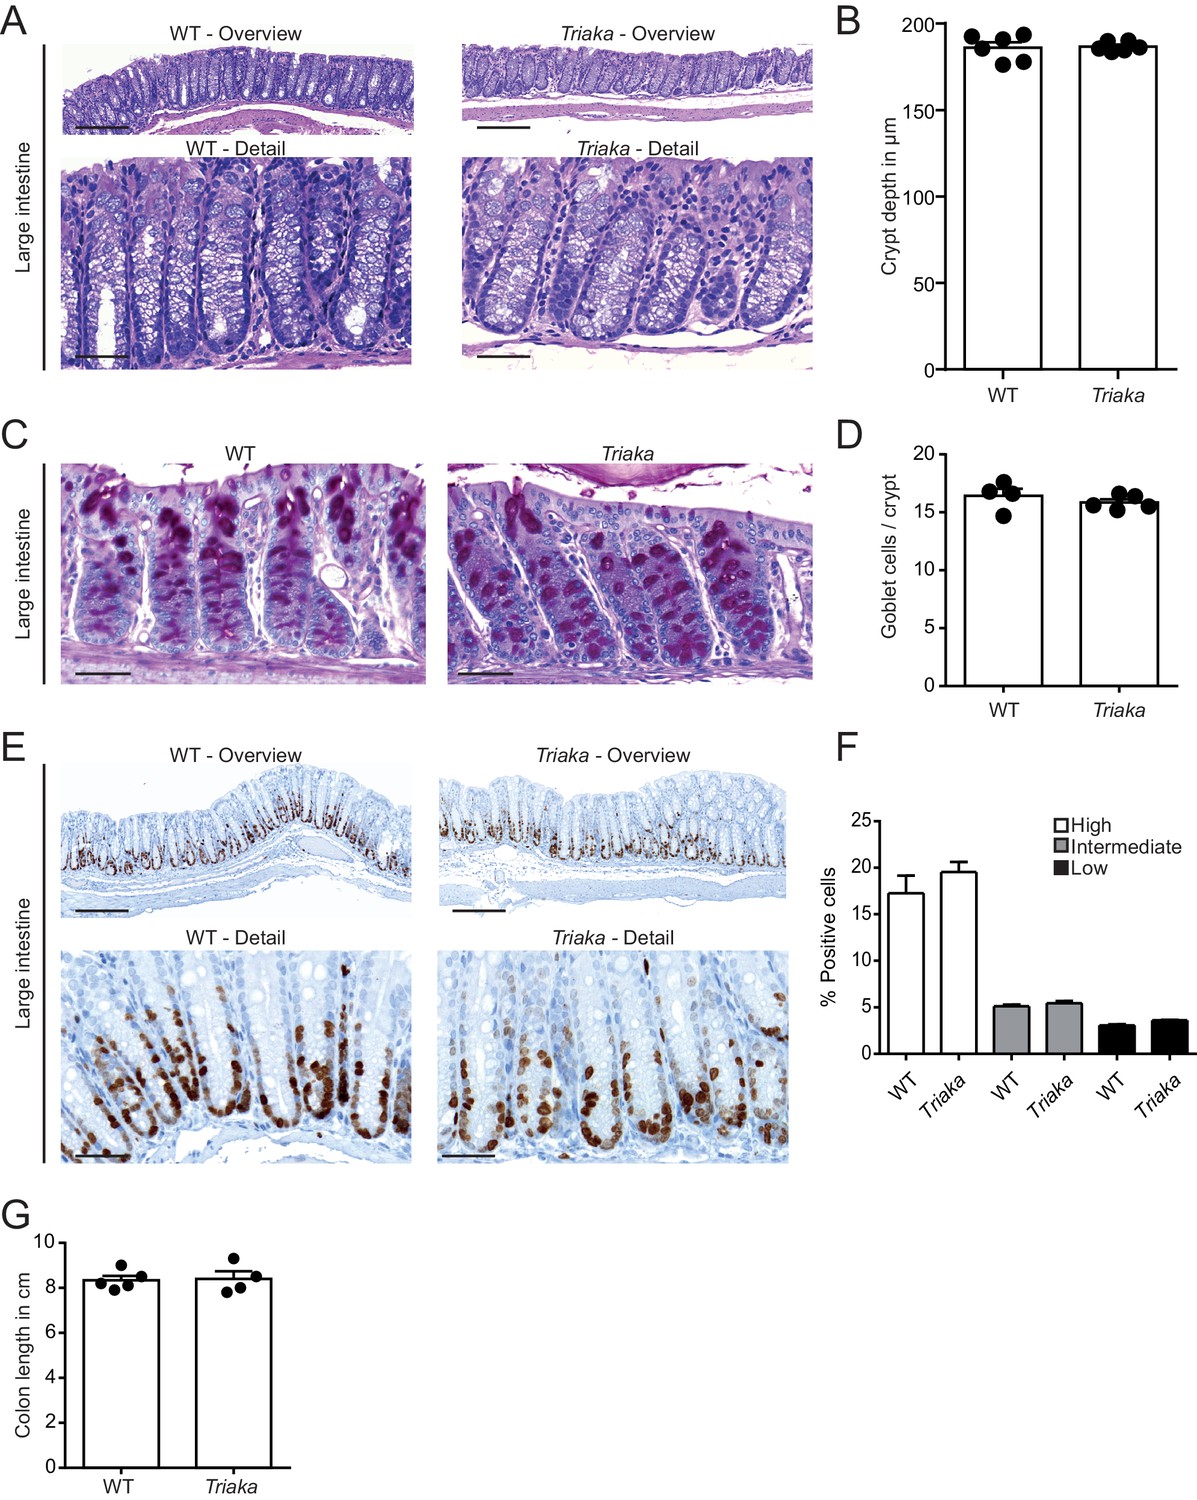
Normal colonic histomorphology in Triaka mice.
Intestinal sections of WT and Triaka mice. (A) Representative H&E-stained sections of the large intestine. (B) Colonic crypt depth was measured on H&E stained sections (n = 6 mice per group). (C) Representative periodic acid-Schiff (PAS)-stained sections of the large intestine. (D) Colonic goblet cells per crypt were counted on PAS-stained sections (n = 4–5 mice per group). (E) Representative Ki-67-stained sections of the large intestine. (F) Percentage of Ki-67-positive cells for the indicated staining intensities are shown (n = 3 mice per group). (G) Colon length of naïve WT and Triaka mice (n = 4–5 mice per group). Scale bars: Overview; 200 µm (A and E). Detail; 50 µm (A, C and E).
Figure 3—figure supplement 3

Normal small intestinal barrier integrity, fecal lipocalin-2 and albumin levels in Triaka mice.
(A) Barrier resistance in the small intestine tissue of WT and Triaka was measured using an Ussing chamber (n = 6 mice per group). Fecal pellets of WT and Triaka animals were collected to measure fecal (B) lipocalin-2 (n = 19–23 mice per group) and (C) albumin (n = 8–12 mice per group) by ELISA. Data represent: Pooled means ± standard error of the mean from (A) two independent experiments, (B) six independent experiments and (C) three independent experiments.
Figure 4 with 3 supplements
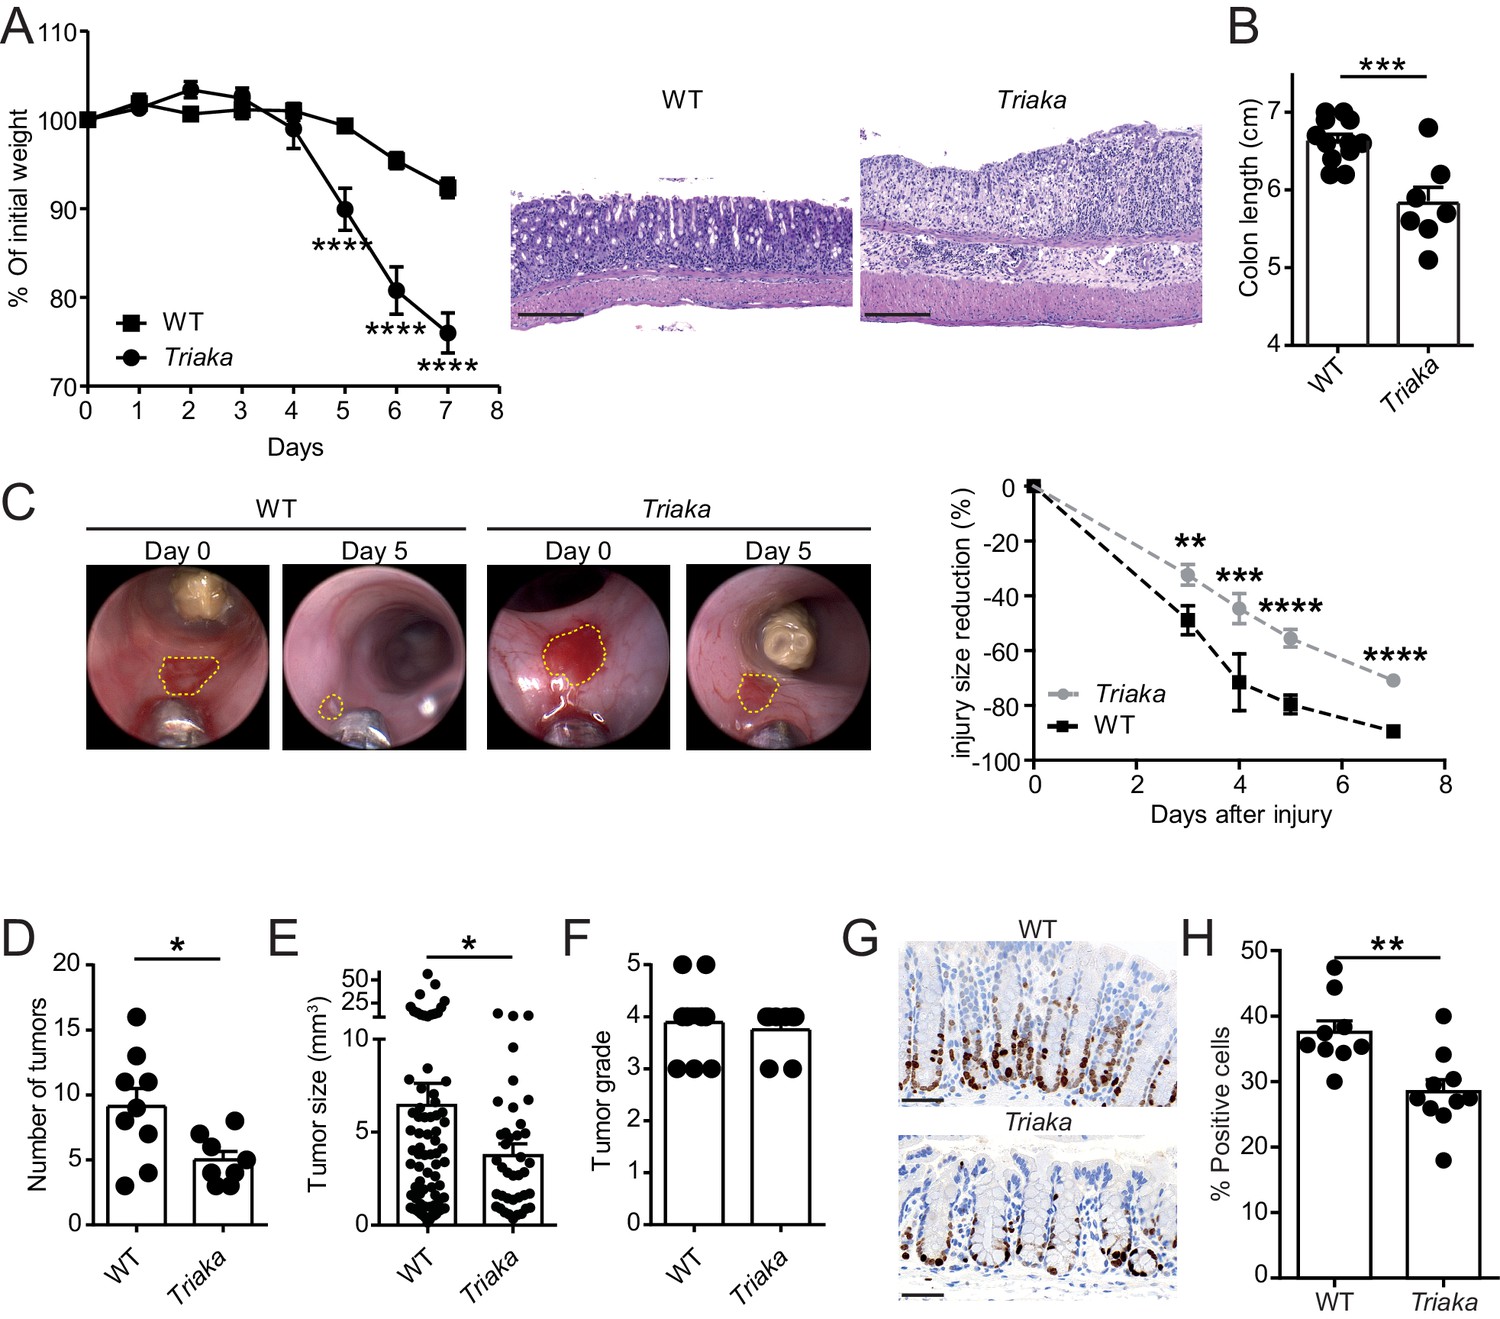
Esrp1Triaka modulates the course of experimental intestinal immunopathology.
(A) WT (n = 7) and Triaka (n = 4) mice were challenged with 2% DSS in the drinking water for 7 days. Weight loss was measured daily (left panel). One representative out of four different experiments is shown. Representative H&E slides from colonic sections illustrate the degree of pathology in the different groups 7 days after the start of DSS treatment (right panel). Scale bars: 200 µm. (B) Colon length was measured in DSS-treated mice (n = 7–12 mice per group). (C) A miniature forceps was used to induce injuries in the colonic mucosa of the indicated groups of mice. Wound-healing was monitored by colonoscopy. Representative pictures (left panel) and quantification of wound-healing over time (right panel) are shown. Right panel represents pooled data from four independent experiments (n = total of 17 wounds from 8 to 9 mice, per group). (D) WT and Triaka mice were treated with AOM/DSS and sacrificed. Number of tumors, (E) tumor size and (F) the highest tumor grade per mouse are shown, assessed 70 days after the initial AOM injection. For (D), (E) and (F), one representative experiment of two is shown (n = 8–9 mice per group). (G) WT and Triaka mice were treated with 2% DSS in the drinking water for 3 days and Ki-67 staining was performed. Representative pictures are shown and (H) Ki-67-positive cells were quantified (n = 9–10 mice per group). Statistics: (A) and (C) Two-way ANOVA with Bonferroni post-test, (B) and (H) Student's t test, (D) Mann-Whitney test and (E) Student’s t test with Welch’s correction. *p<0.05; **p<0.01; ***p<0.001; ****p<0.0001.
Figure 4—figure supplement 1
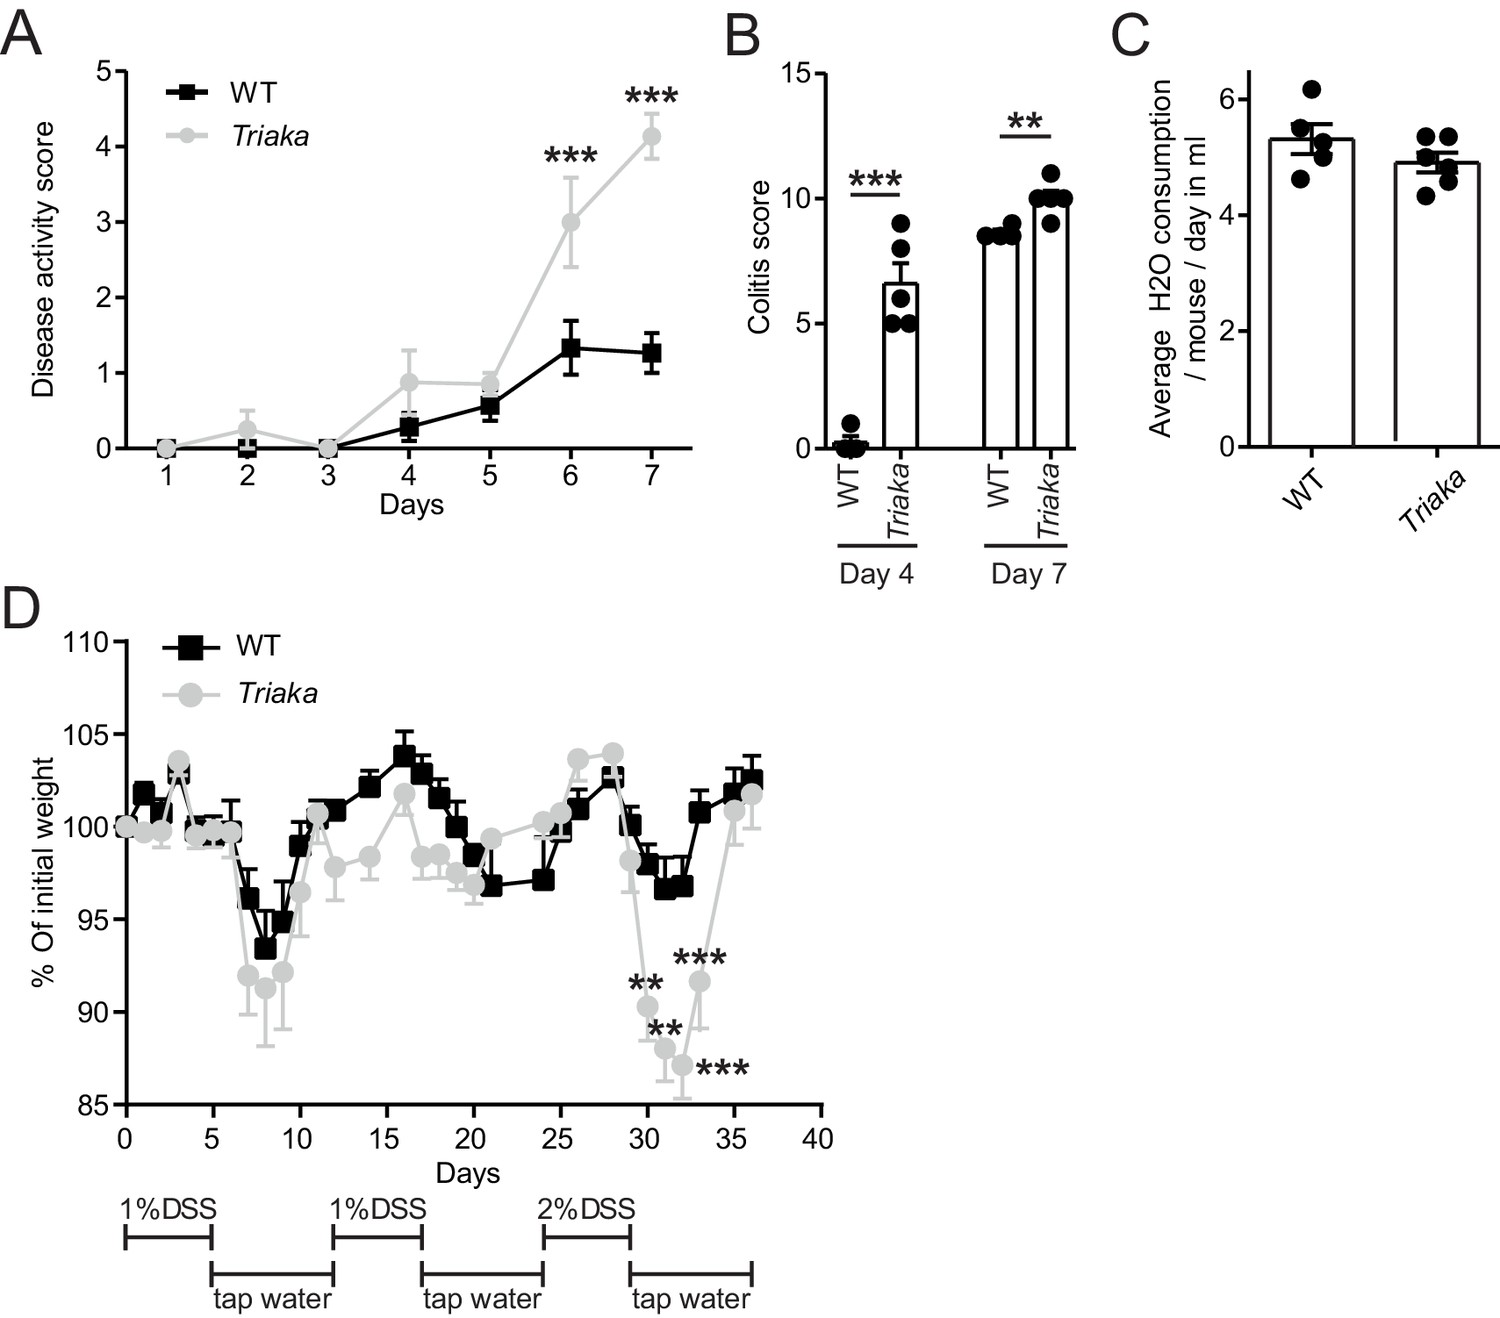
Triaka mice show increased susceptibility to experimental colitis.
(A) WT and Triaka mice were treated with 2% DSS water and disease activity score was assessed at the indicated time points (n = 4–7 mice per group). (B) Colitis score was assessed by histological analysis at the indicated time points after start of DSS treatment (n = 4–5 mice per group). (C) Water consumption of single-housed mice of the indicated genotypes was measured daily during 7 days and averaged (n = 6–7 mice per group). (D) Mice were given 3 cycles of DSS alternated with regular water, as indicated, and weight loss was measured (n = 5 mice per group). Data represent: Means ± standard error of the mean from (A) one representative experiment repeated three times. Statistics: (A) and (D) Two-way ANOVA with Bonferroni post-test. (B) Student's t test. *p<0.05; **p<0.01; ***p<0.001.
Figure 4—figure supplement 2
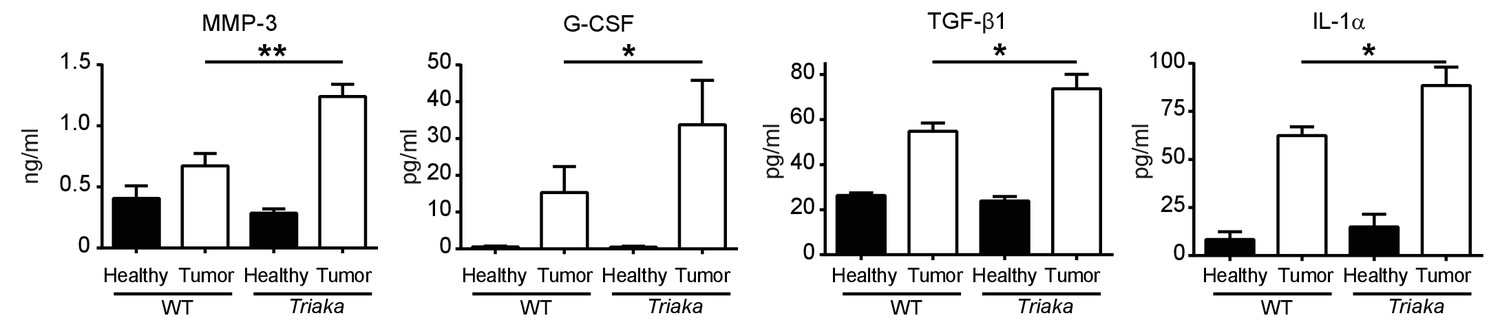
More aggressive molecular signature in Triaka intestinal tumors.
WT and Triaka mice were treated with AOM/DSS. Seventy days after the first AOM injection, tumors or adjacent tumor-free (healthy) colonic tissue were homogenized and the indicated proteins were measured by Multiplexing LASER Bead Technology. n = 5–8 mice per group. Statistics: Student's t test. *p<0.05; **p<0.01.
Figure 4—figure supplement 3

Partial EMT signature in Triaka cIECs.
Quantitative PCR was applied to measure transcript levels of (A) Cdh1, (B) Zeb1, (C) Zeb2, and (D) Esrp1 in WT and Triaka cIECs, after normalization to Gapdh expression. n = 9–14 mice per group. Statistics: Student’s t test. *p<0.05, **p<0.01.
Figure 5 with 3 supplements
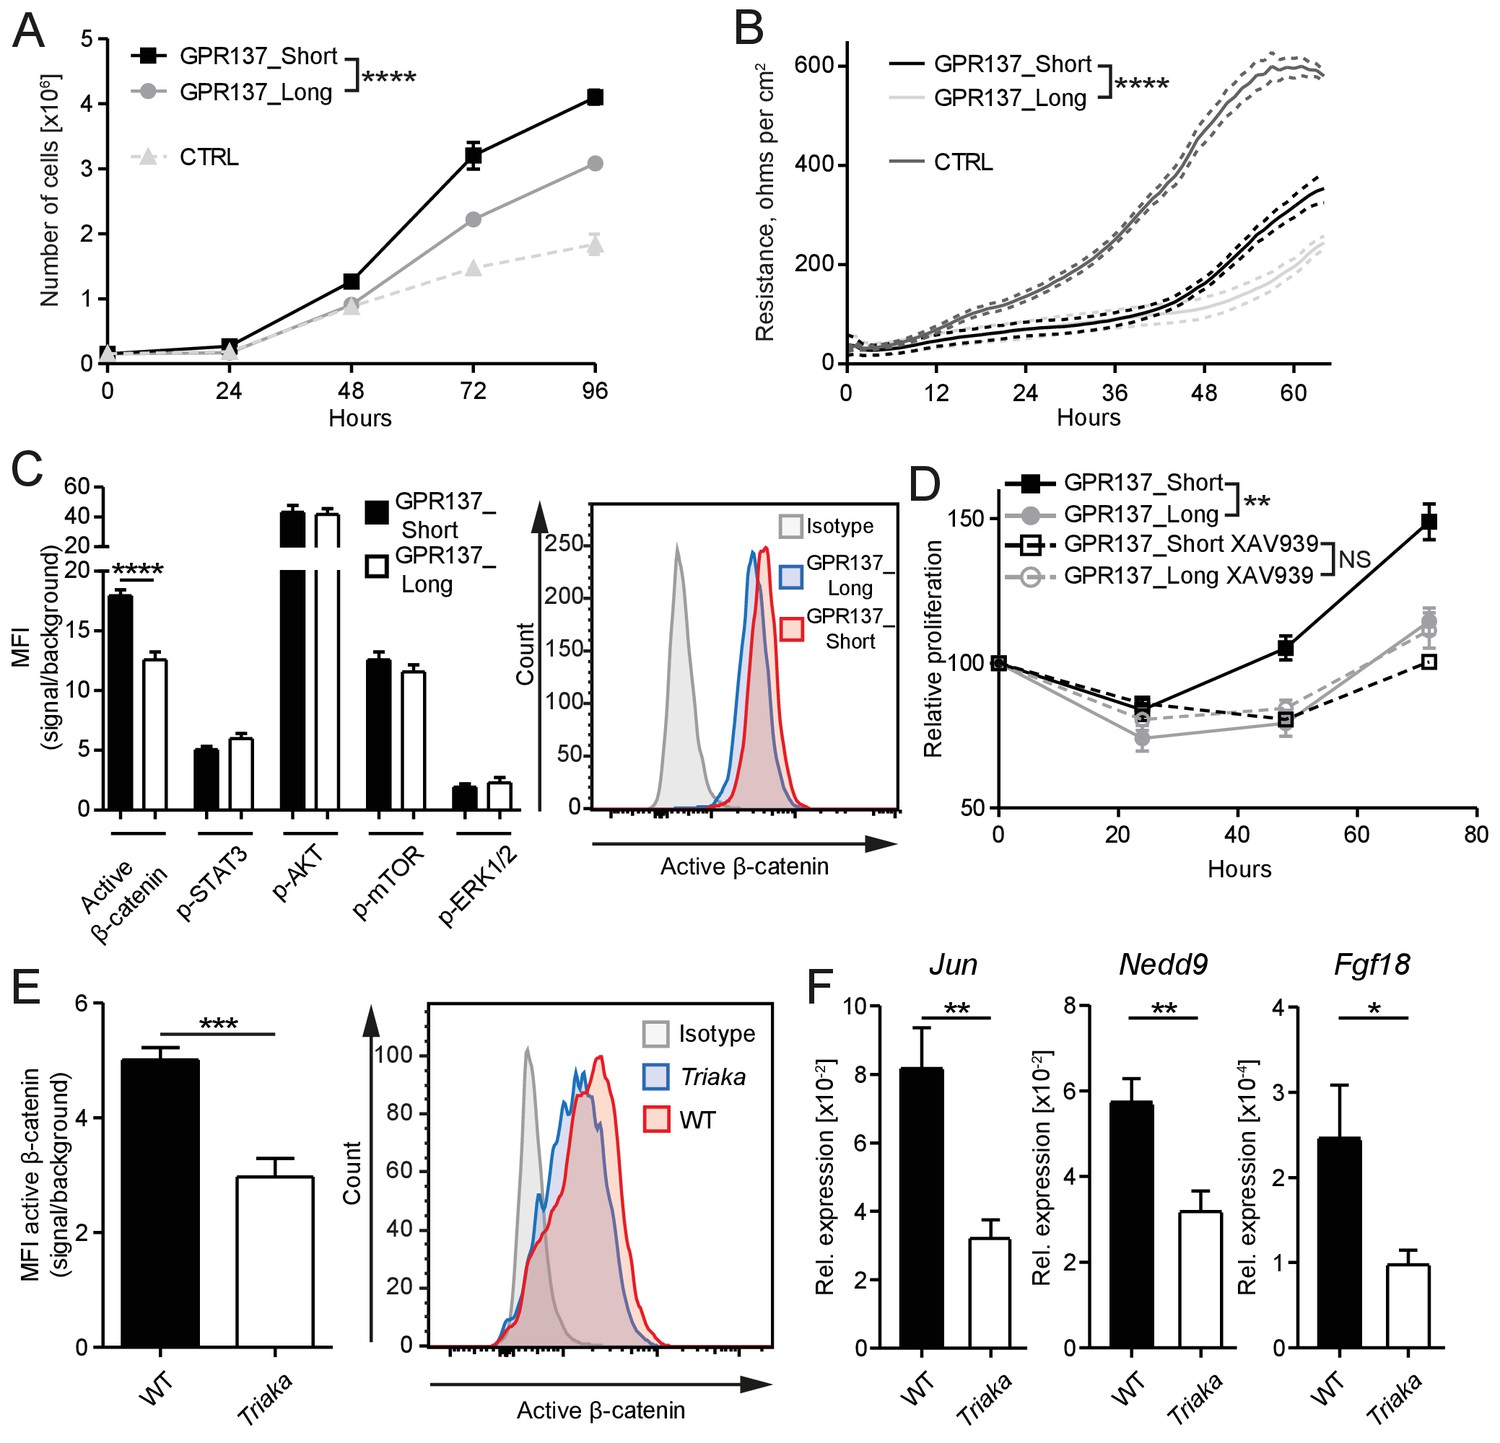
GPR137 isoforms differentially activate Wnt/β-catenin signaling to modulate epithelial cell function.
(A) CMT-93 IECs were transduced with vectors encoding the indicated Gpr137 isoforms or a control vector (CTRL) and live cells were counted daily by microscopy. (B) Alternatively, monolayer resistance was assessed using a cellZscope device. (C) Flow cytometry analysis was performed to assess the activity of selected signaling pathways in Gpr137 isoform-transduced CMT-93 cells. Median fluorescence intensity (MFI) of the indicated proteins (left panel) and representative histogram indicating the level of active β-catenin (right panel) are shown. (D) A WST-1 assay was used to assess the relative proliferation of Gpr137 isoform-transduced CMT-93 cells in the presence or absence of the Wnt/β-catenin signaling inhibitor XAV-939. Proliferation was normalized to control vector-transduced cells. (E) Expression levels of active β-catenin in primary cIECs of WT and Triaka mice (n = 7–8 mice per group) were measured by flow cytometry (left panel). A representative histogram is also shown (right panel). (F) Transcript levels of selected Wnt/β-catenin signaling target genes were measured in primary cIECs of WT and Triaka mice (n = 7–8 mice per group). Data shown: One representative experiment performed in (A and D) biological triplicates or (B) quadruplicates, and which was repeated four times (A) or twice (B and D). Pooled data from (C) three individual experiments performed in biological triplicates or (E and F) two individual experiments. Statistics: (A), (B) and (D) Two-way ANOVA with Bonferroni post-test. (C), (E) and (F) Student's t test. *p<0.05; **p<0.01; ***p<0.001; ****p<0.0001.
Figure 5—figure supplement 1
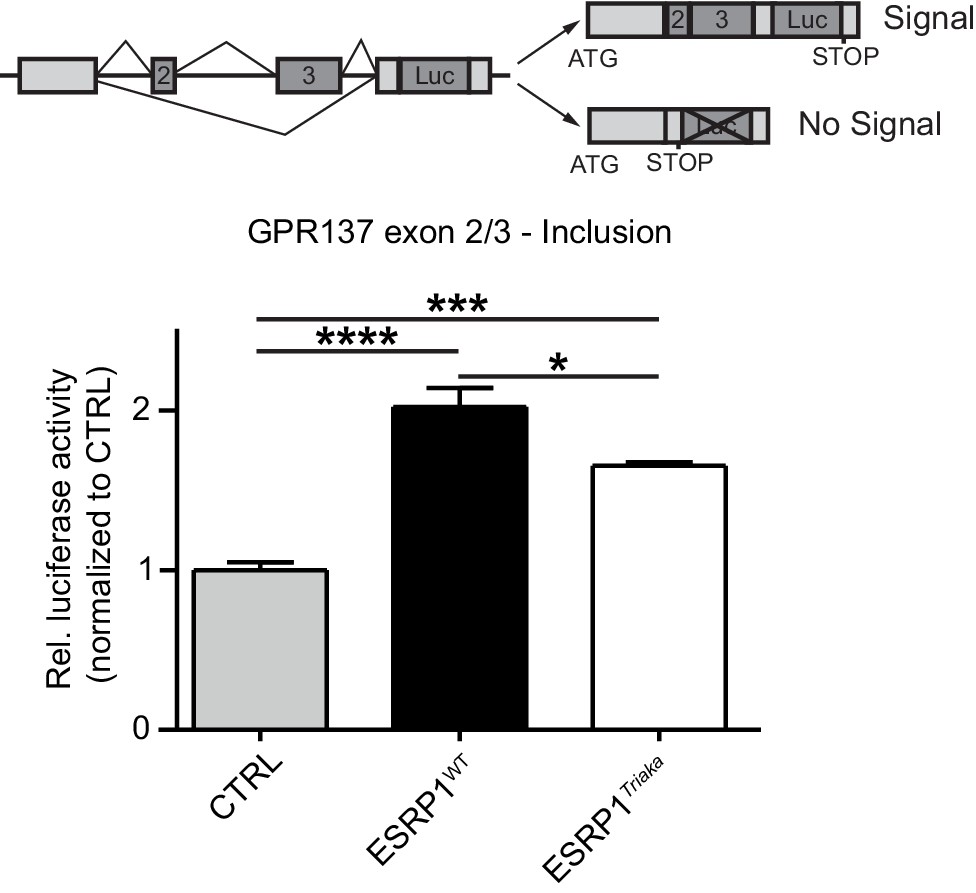
Gpr137 is a splicing target of ESRP1.
To quantify exon splicing, HEK-293 cells were co-transfected with a vector encoding Esrp1WT or Esrp1Triaka or an empty control (CTRL) vector and with an exon trap construct containing Gpr137 exon 2 and 3. The upper panel shows a scheme of the exon trap construct. Inclusion of Gpr137 exon 2 and 3 results in luciferase (Luc) expression. Luciferase activity normalized to control vector-transfected cells is shown in the lower panel. Data represent means ± standard error of the mean from one representative experiment, performed in biological quadruplicates and repeated twice. Statistics: One-way ANOVA with Bonferroni post-test. *p<0.05; ***p<0.001; ****p<0.0001.
Figure 5—figure supplement 2
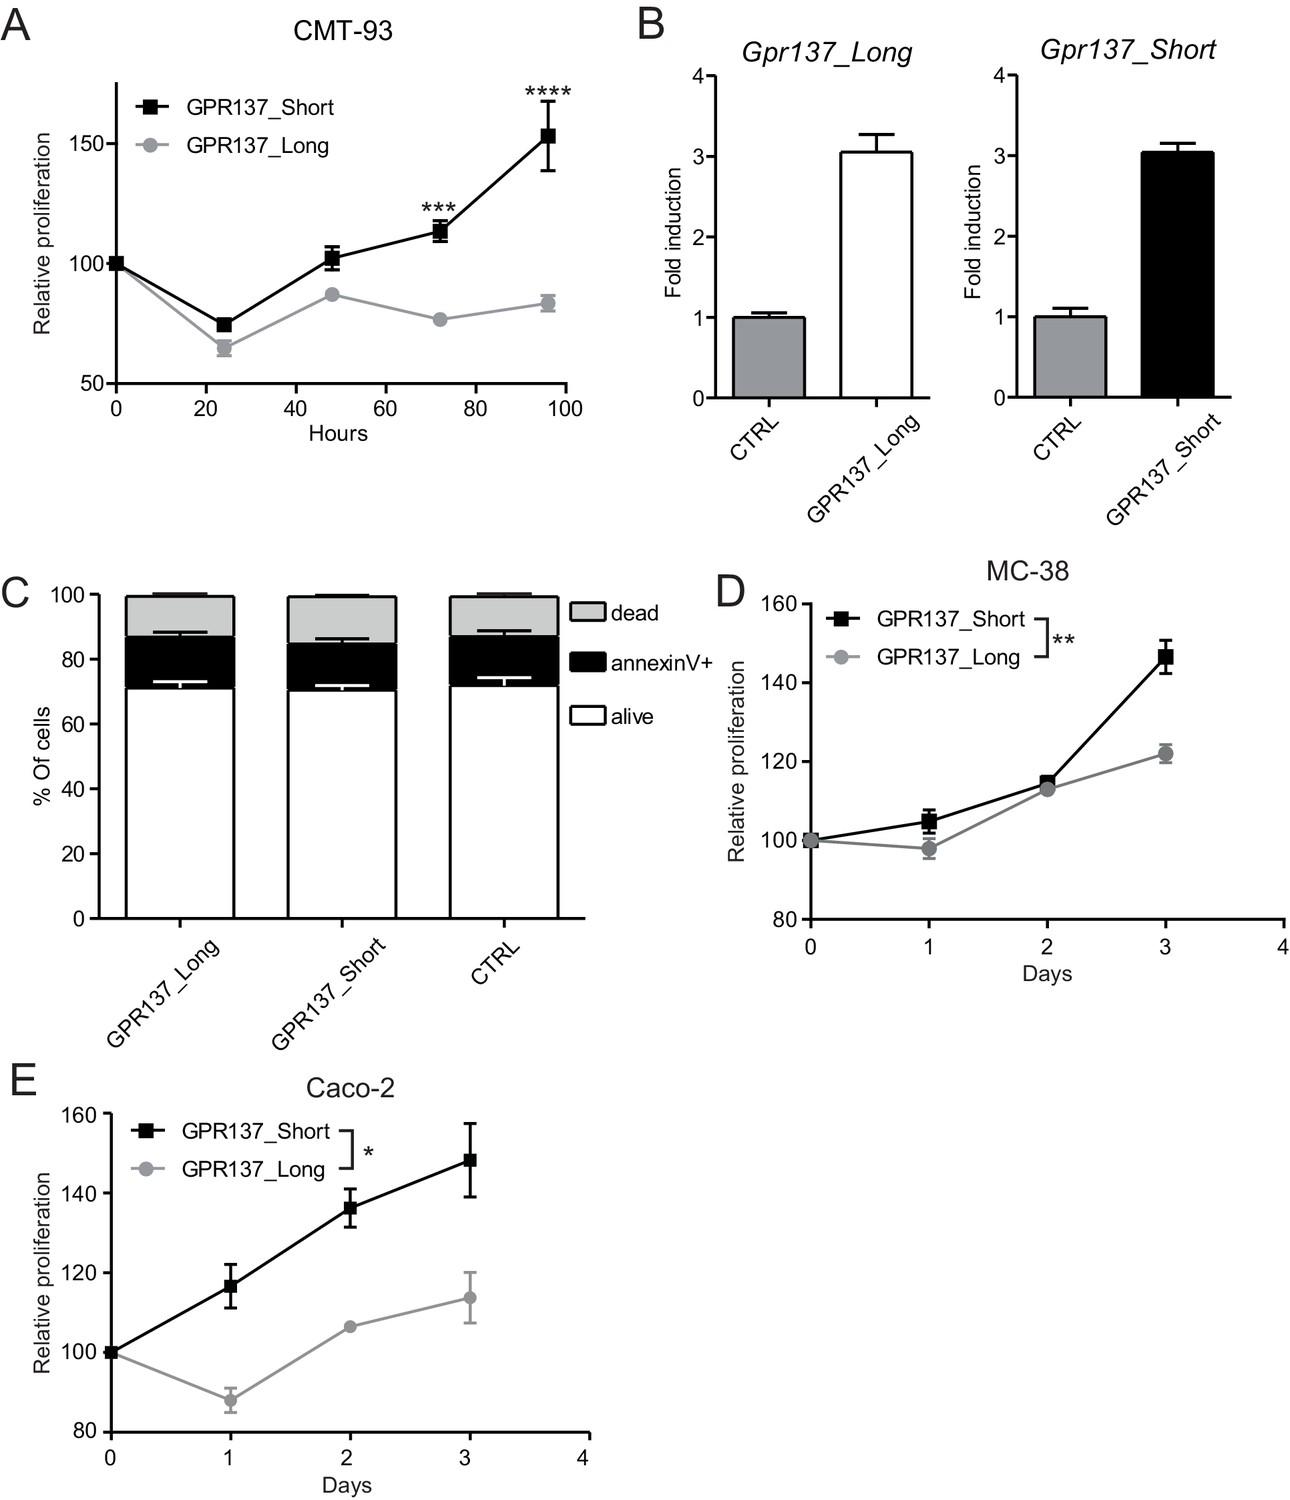
Gpr137 isoforms differently modulate the proliferation of epithelial cells.
CMT-93 IECs were transduced with vectors encoding the indicated Gpr137 isoforms and (A) cell proliferation relative to control vector-transduced cells was measured in a WST-1 assay. (B) Transcript levels of Gpr137_Long (left panel) or Gpr137_Short (right panel) isoforms were measured in the indicated cell lines and normalized to levels in control construct-transduced cells. (C) Flow cytometry was applied to measure live, apoptotic and dead cells in the indicated transduced cell lines, using annexin V and DAPI. (D) MC-38 and (E) Caco-2 IECs were transduced with vectors encoding the indicated Gpr137 isoforms and cell proliferation relative to control cells was measured in a WST-1 assay. Data represent means ± standard error of the mean of: One representative experiment performed in biological triplicates which was repeated twice (A, C, D and E). (B) Pooled data from six individual experiments measured in technical duplicates. Statistics: (A, D and E) Two-way ANOVA with Bonferroni post-test. *p<0.05; **p<0.01; ***p<0.001; ****p<0.0001.
Figure 5—figure supplement 3
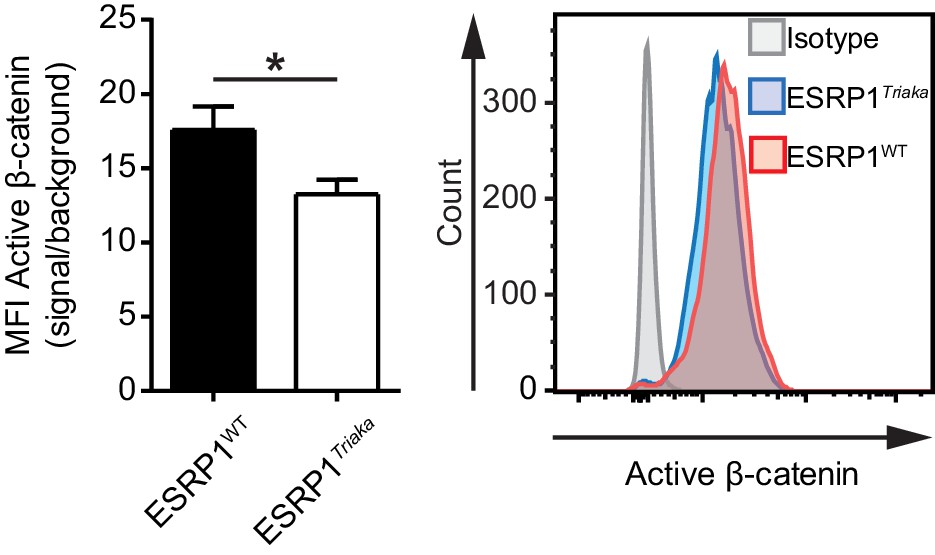
Reduced Wnt/β-catenin signaling in Esrp1Triaka- compared with Esrp1WT-transduced cells.
CMT-93 cells were transduced with inducible lentiviral vectors encoding Esrp1Triaka or Esrp1WT and active β-catenin was measured by flow cytometry, after treatment with 4-hydroxytamoxifen. Quantitative analysis of median fluorescence intensity (MFI) (left panel) and a representative histogram (right panel) are shown. Data represent: Means ± standard error of the mean of two individual experiments performed in biological triplicates. Statistics: Student's t test. *p<0.05.
Figure 6 with 2 supplements
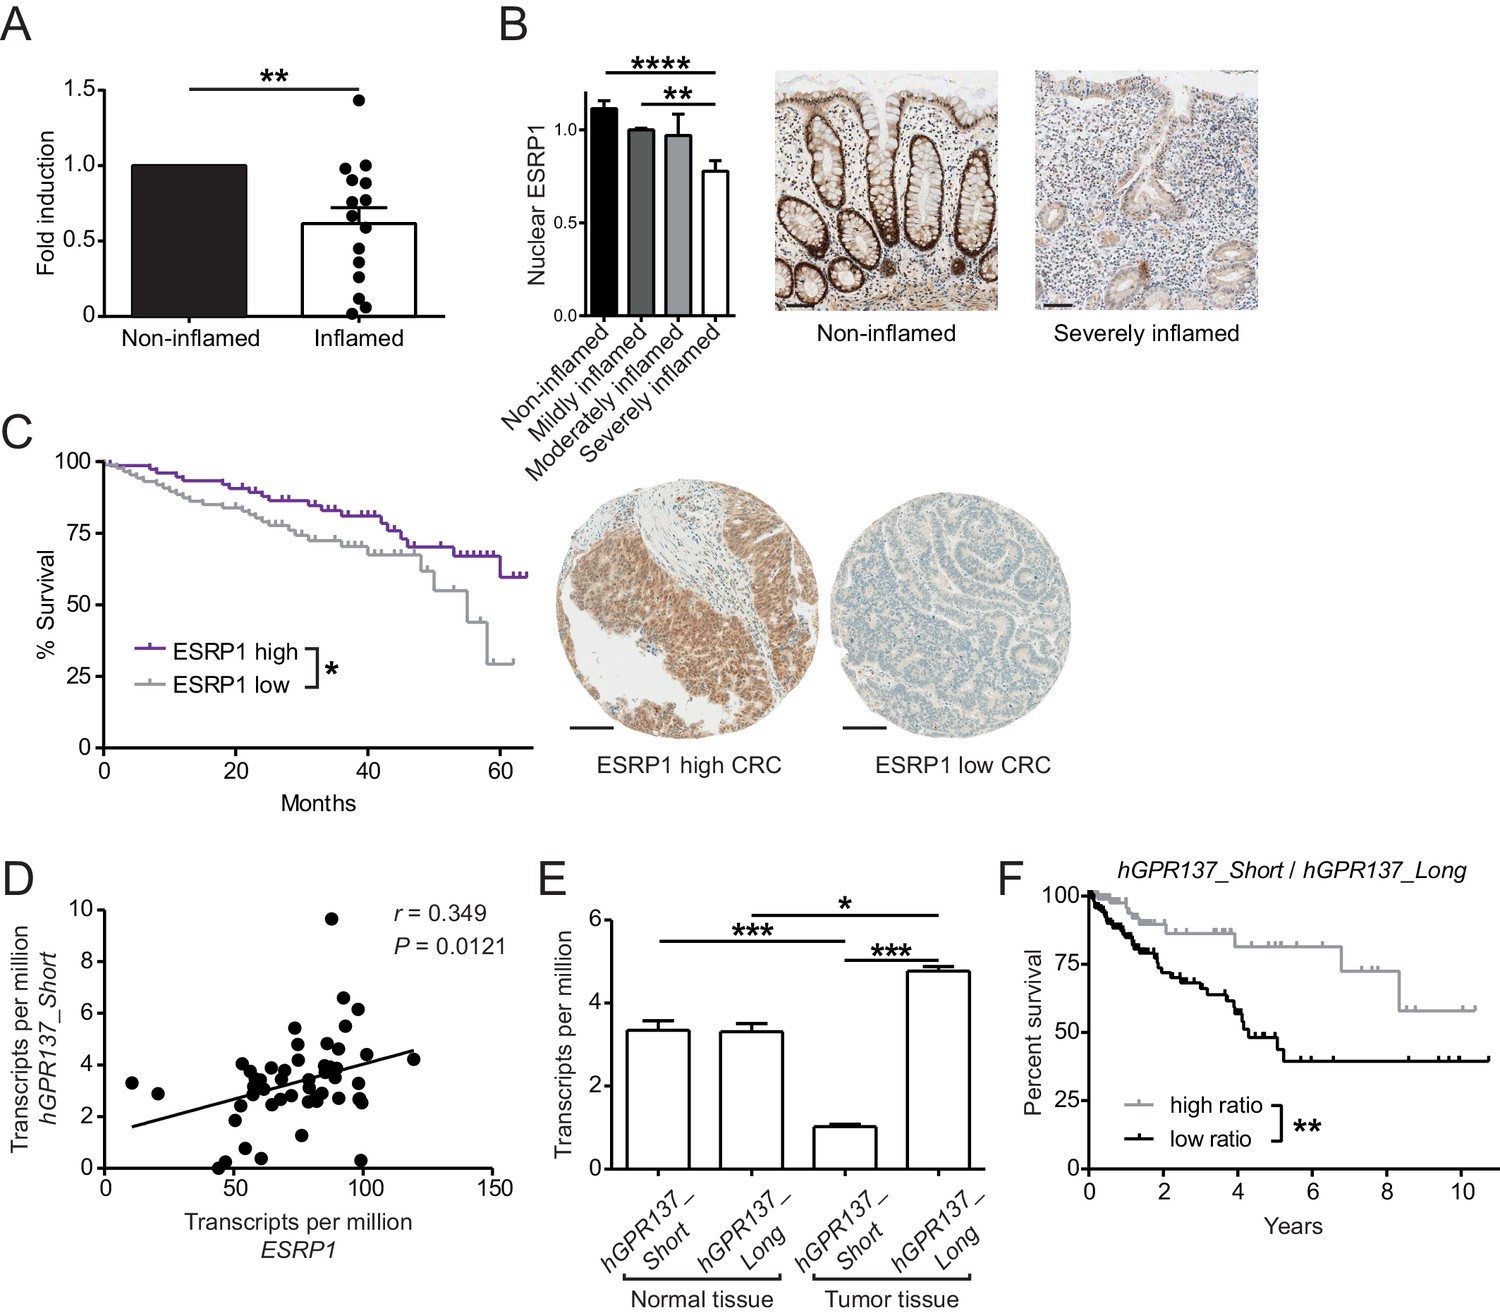
Expression of ESRP1 and ESRP1-dependent hGPR137 isoforms is down-regulated in the diseased intestine and predicts CRC patient survival.
(A) ESRP1 transcript levels were measured in inflamed versus matched, non-inflamed intestinal biopsies from Crohn’s disease (CD) patients and normalized to EPCAM expression. Normalized ESRP1 transcript levels in the non-inflamed biopsy were set to one for each patient and fold induction was calculated for the corresponding inflamed biopsy (n = 15 samples per group). Data represent means ± standard error of the mean. (B) Immunohistochemistry was performed on intestinal tissue of CD patients to detect nuclear ESRP1, which was measured using automated quantification and normalized. Representative pictures are shown from a patient during remission and active disease, respectively (n = 31, 32, 7 and 14 biopsies per indicated group of cases). Data represent means ± standard error of the mean. Scale bars: 50 µm. (C) Kaplan-Meier survival curves of CRC patients with high (n = 77) or low (n = 88) expression of ESRP1 in tumor tissues. Representative IHC showing ESRP1-high and -low intestinal tumors. Scale bars: 100 µm. (D) Correlation between ESRP1 and hGPR137_Short expression in normal tissue of the large intestine (n = 51). (E) hGPR137_Short and hGPR137_Long isoform expression in tumor (n = 647) versus normal (n = 51) tissue of the large intestine. Data represent means ± standard error of the mean. (F) Kaplan-Meier survival curves of CRC patients with a high (n = 142) or low (n = 261) ratio of hGPR137_Short to hGPR137_Long transcripts in tumor tissues. Statistics: (A) Wilcoxon signed-rank test, (B) One-way ANOVA with Bonferroni post-test, (C) and (F) Log-rank test, (D) Spearman correlation, (E) Kruskal-Wallis with Dunn’s post-test. *p<0.05; **p<0.01; ***p<0.001; ****p<0.0001.
-
Figure 6—source data 1
Association of (nuclear) ESRP1 expression with clinicopathological features in 185 CRC patients.
- https://doi.org/10.7554/eLife.28366.025
-
Figure 6—source data 2
Univariate and multivariate survival analysis in 185 CRC patients.
- https://doi.org/10.7554/eLife.28366.026
-
Figure 6—source data 3
Correlation of hGPR137_Short with Wnt target genes.
- https://doi.org/10.7554/eLife.28366.027
Figure 6—figure supplement 1
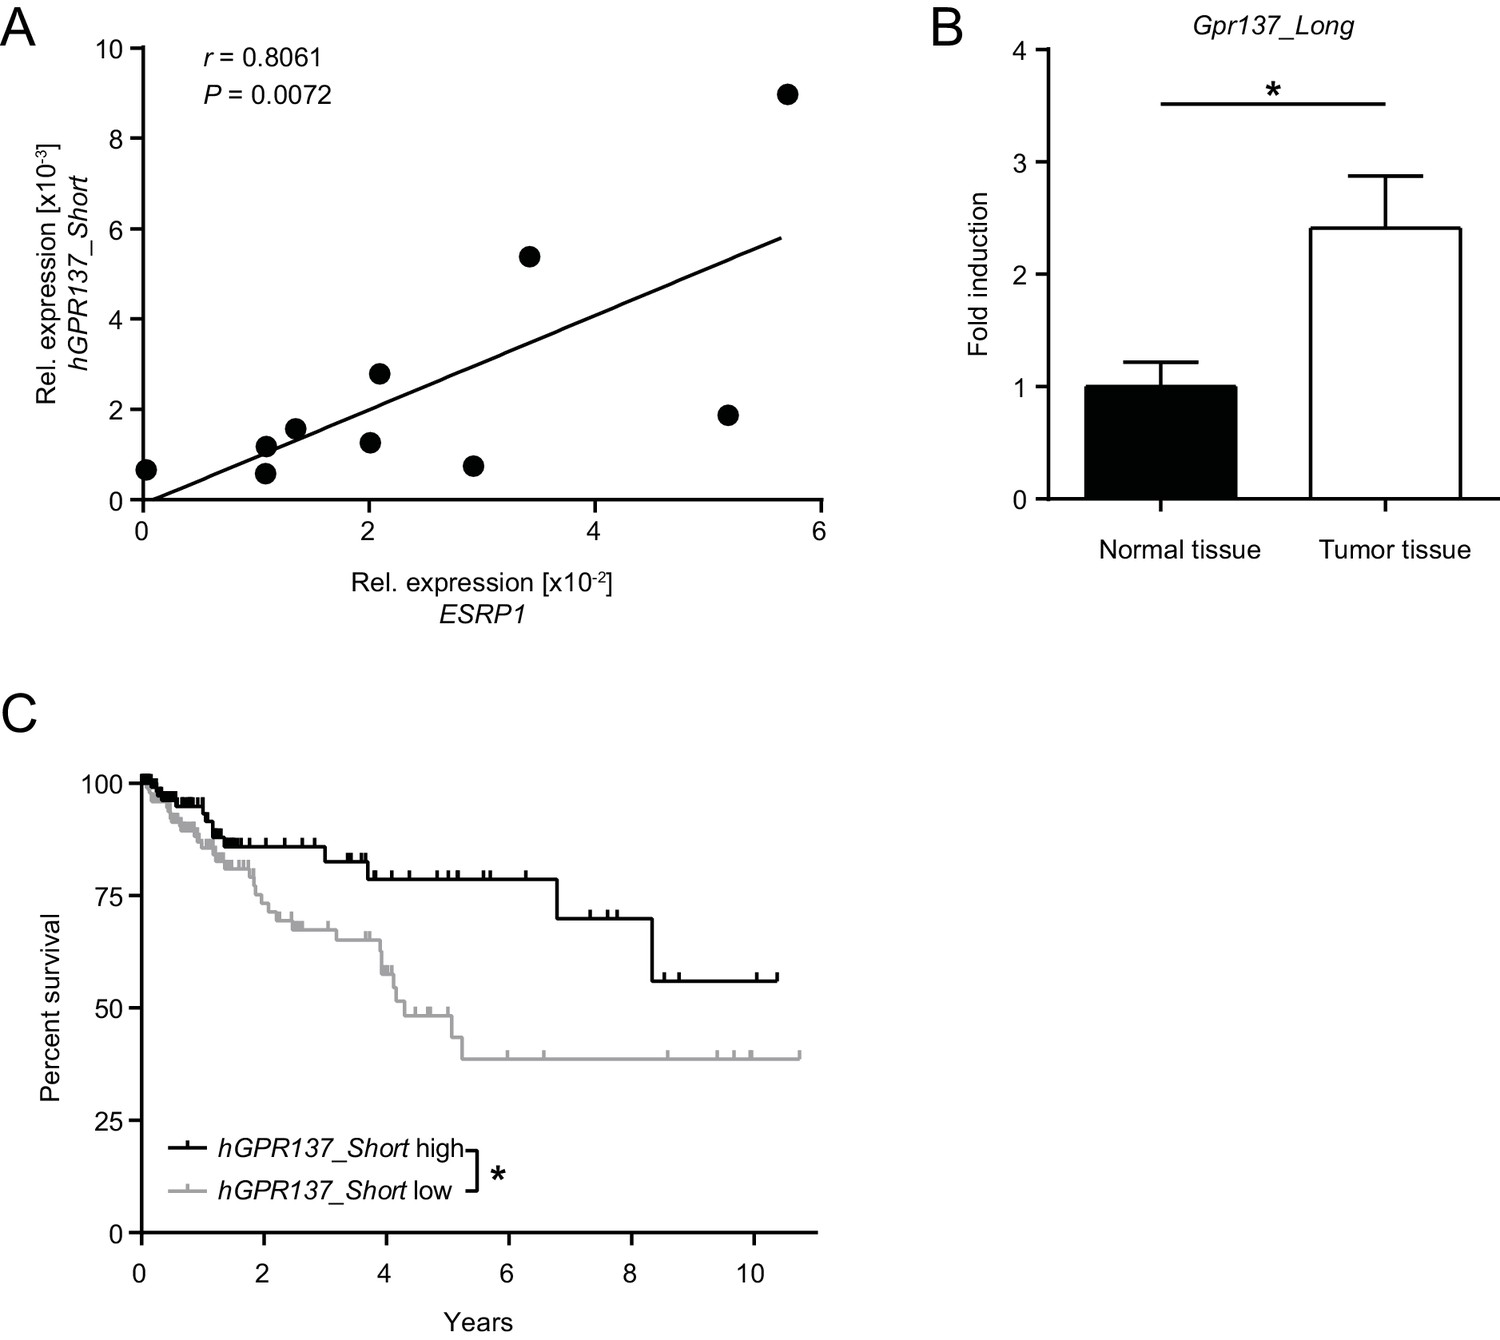
Expression of GPR137 isoforms in the healthy and diseased intestine.
(A) Transcript levels of ESRP1 and hGPR137_Short were measured in normal human colon tissue (n = 10) and normalized to GAPDH expression. Expression of hGPR137_Short was assessed using primers specific for hGPR137 exon 4 and 5. (B) Transcript levels of Gpr137_Long were measured in normal and tumor intestinal tissue of AOM/DSS-treated WT mice. Data represent means ± standard error of the mean. n = 6 mice per group. (C) Kaplan-Meier survival curves of CRC patients with high (n = 163) or low (n = 241) hGPR137_Short expression in tumor tissues. Statistics: (A) Spearman correlation, (B) Student's t test and (C) Log-rank test.
Figure 6—figure supplement 2
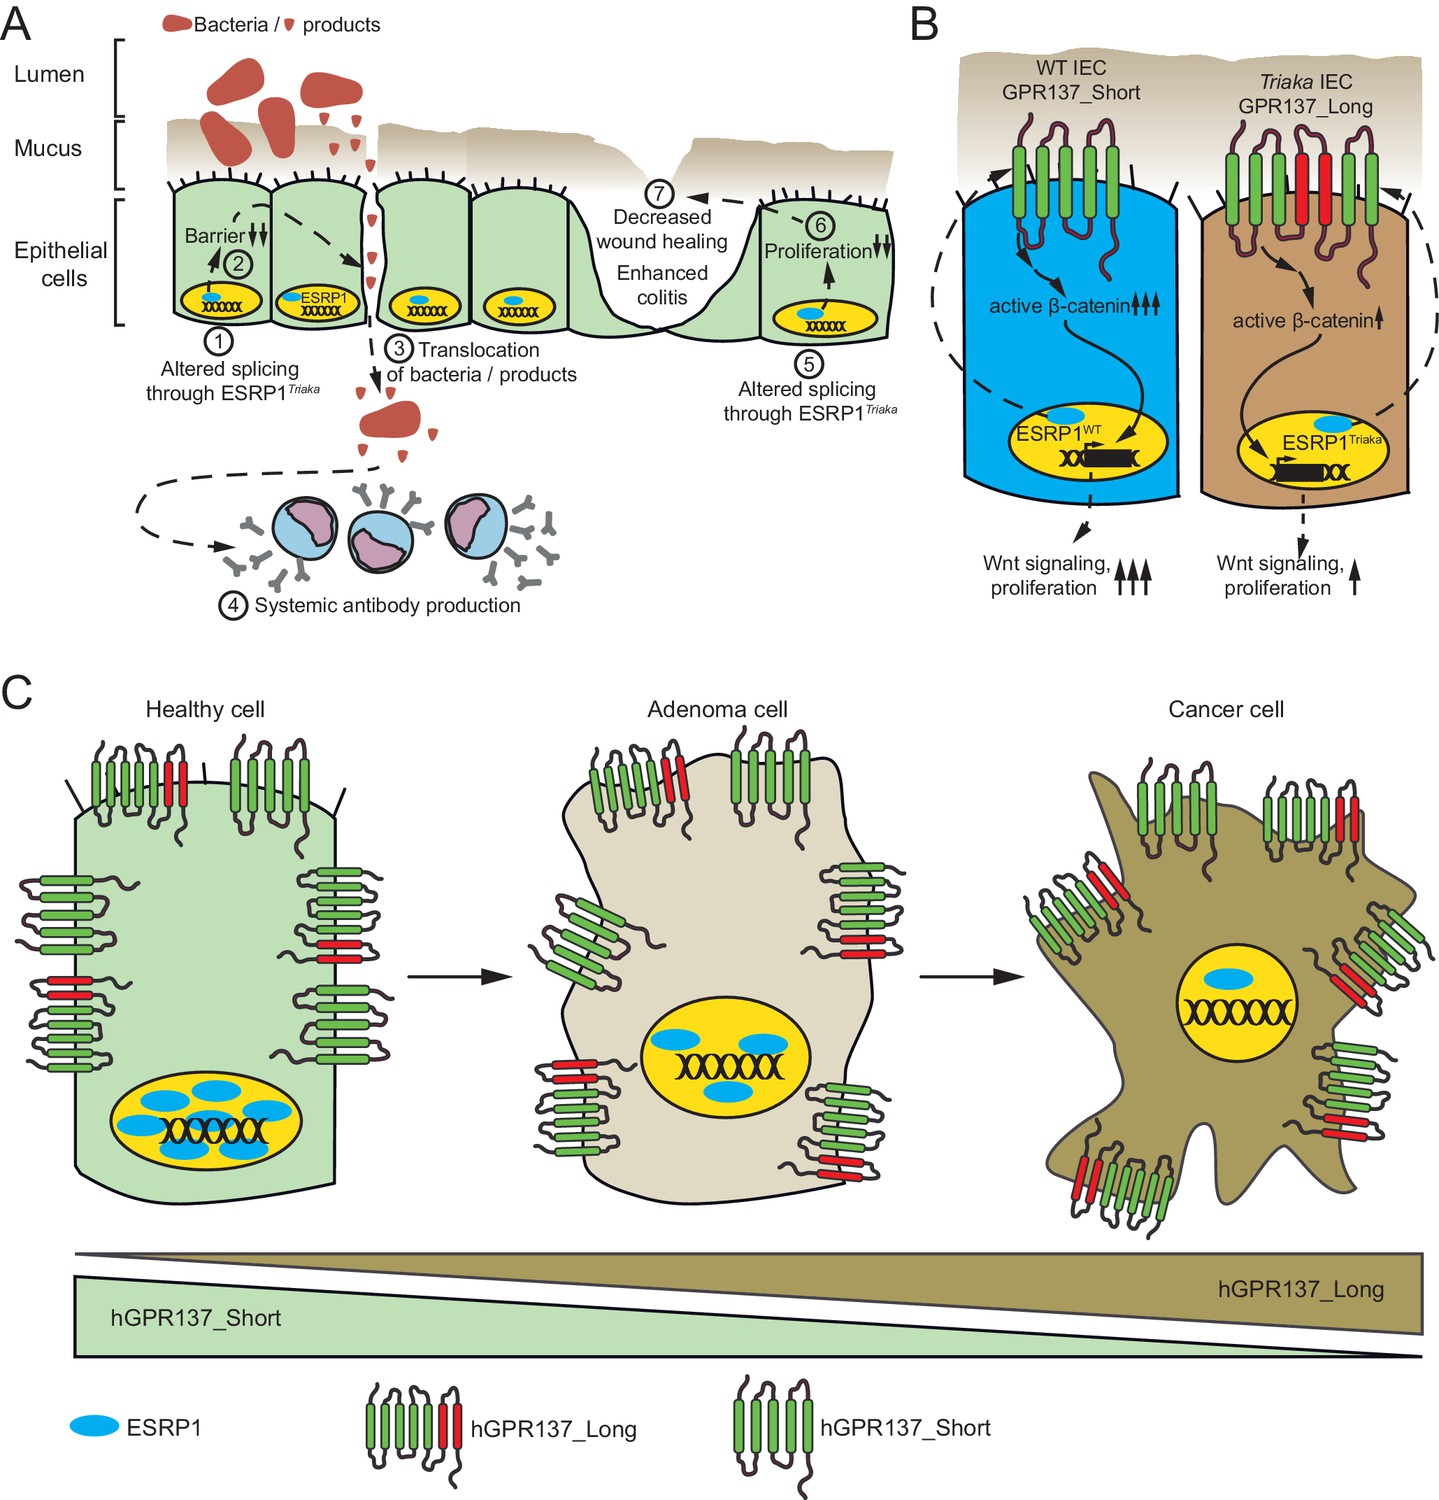
ESRP1-dependent alternative mRNA splicing is required for epithelial integrity and intestinal homeostasis.
(A) (1) The Esrp1Triaka allele generates altered mRNA splicing events. (2) Perturbation in the distribution of specific isoforms or generation of aberrant protein isoforms in epithelial cells reduce the integrity of the intestinal barrier. (3) This results in a facilitated penetration of microbes or microbial products into the intestinal mucosa. (4) A systemic antibody response is raised against translocated intestinal microbes. (5) Altered splicing through Esrp1Triaka (6) decreases the proliferative capacity of intestinal epithelial cells. (7) This affects intestinal wound-healing, inflammation, and tumor development. (B) Mechanistically, Esrp1Triaka leads to an altered ratio of Gpr137 transcript isoforms, among others. Preferential generation of Gpr137 Long in Esrp1Triaka epithelial cells is associated with reduced Wnt/β-catenin signaling, and consequently diminished intestinal homeostasis and function. (C) ESRP1 protein is gradually downregulated during the adenoma to carcinoma sequence in human intestinal tumors. This correlates with a reduced expression of hGPR137_Short and an increase in hGPR137_Long isoforms, thereby possibly supporting tumor progression.
Author response image 1
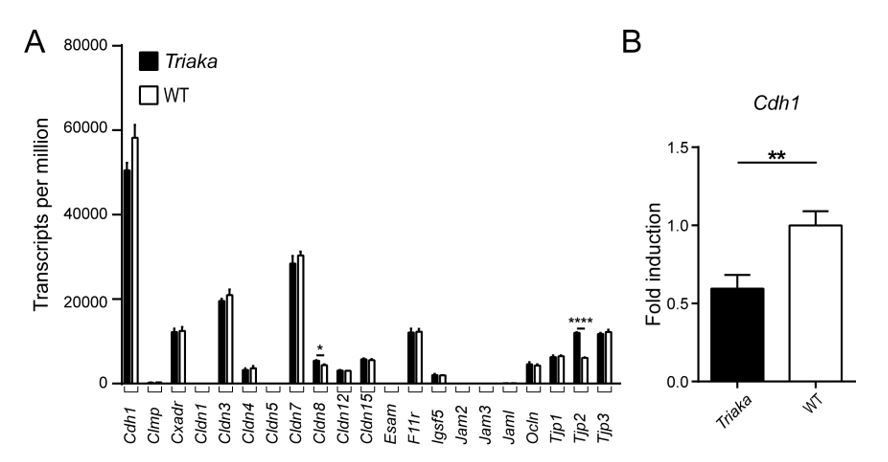
Expression analysis of selected genes with known function for intestinal barrier integrity.
(A) RNA sequencing was performed on colonic intestinal epithelial cells (cIECs) from Triaka and WT mice to assess expression of the indicated genes (n = 4 mice per group). (B) Quantitative PCR was performed to determine Cdh1 transcript levels in Triaka versus WT cIECs, after normalization to Gapdh expression (n = 13-14 mice per group). Statistics: (A) Benjamini-Hochberg adjusted p-values from test for differential gene expression. (B) Student’s t test. **, P < 0.01; ****, P < 0.0001.
Author response image 2
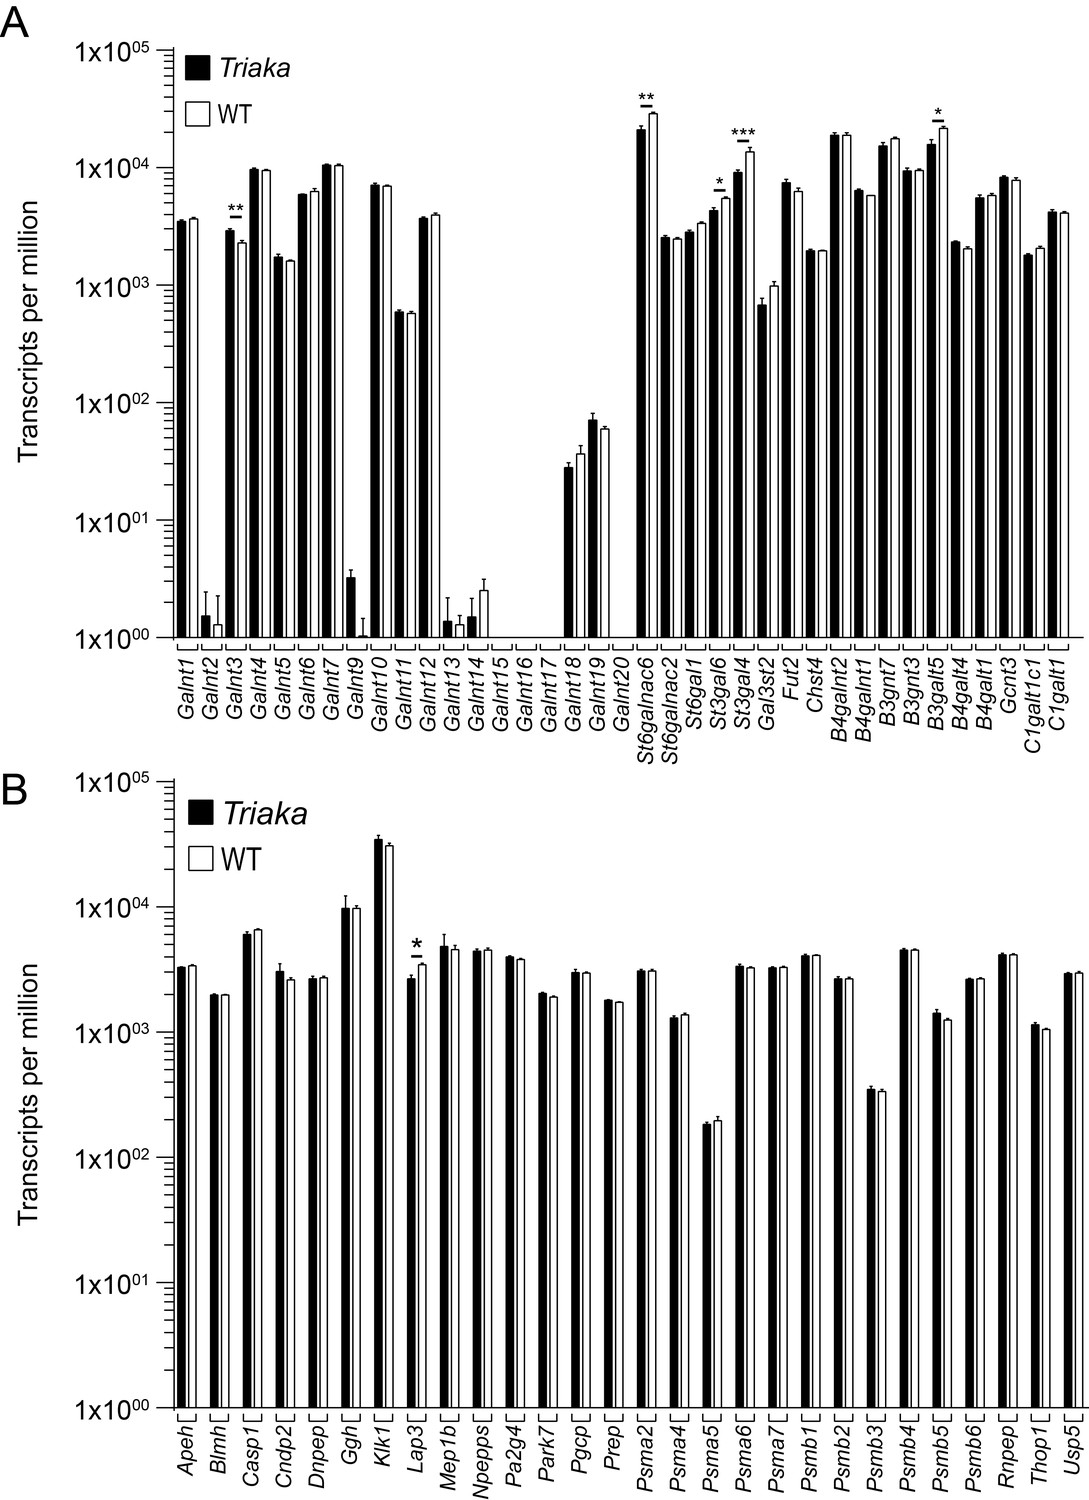
Expression analysis of selected genes with known function for post-translational modification of intestinal mucus.
RNA sequencing was performed on colonic intestinal epithelial cells (cIECs) from Triaka and WT mice (n = 4 mice per group) to assess expression of the indicated genes involved in (A) glycosylation or (B) proteolytic cleavage of MUC2. Statistics: Benjamini-Hochberg adjusted p-values from test for differential gene expression.
Author response image 3
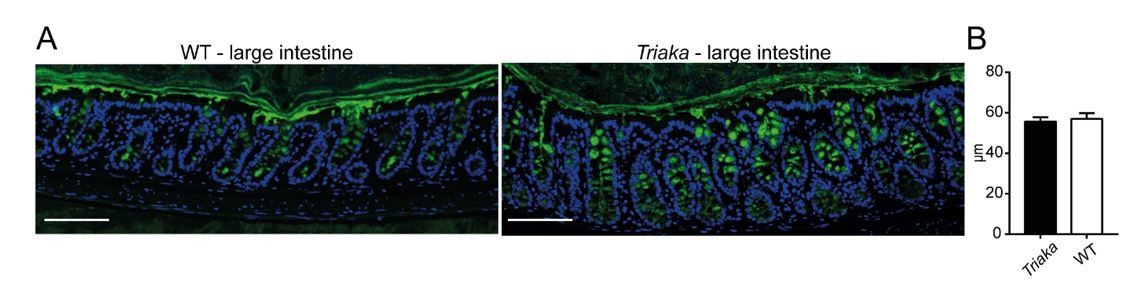
Analysis Mucin-2 (MUC2) layer.
(A) Immunofluorescence for MUC2 (in green) was performed on colon tissue of the indicated strains. Nuclei were visualized with DAPI. Representative pictures are shown (scale bar: 100µm). (B) Thickness of the inner mucus layer was measured on MUC2 immunofluorescent stained slides (n = 4-5 WT and Triaka mice, with 3 individual measurements per mouse).
Author response image 4
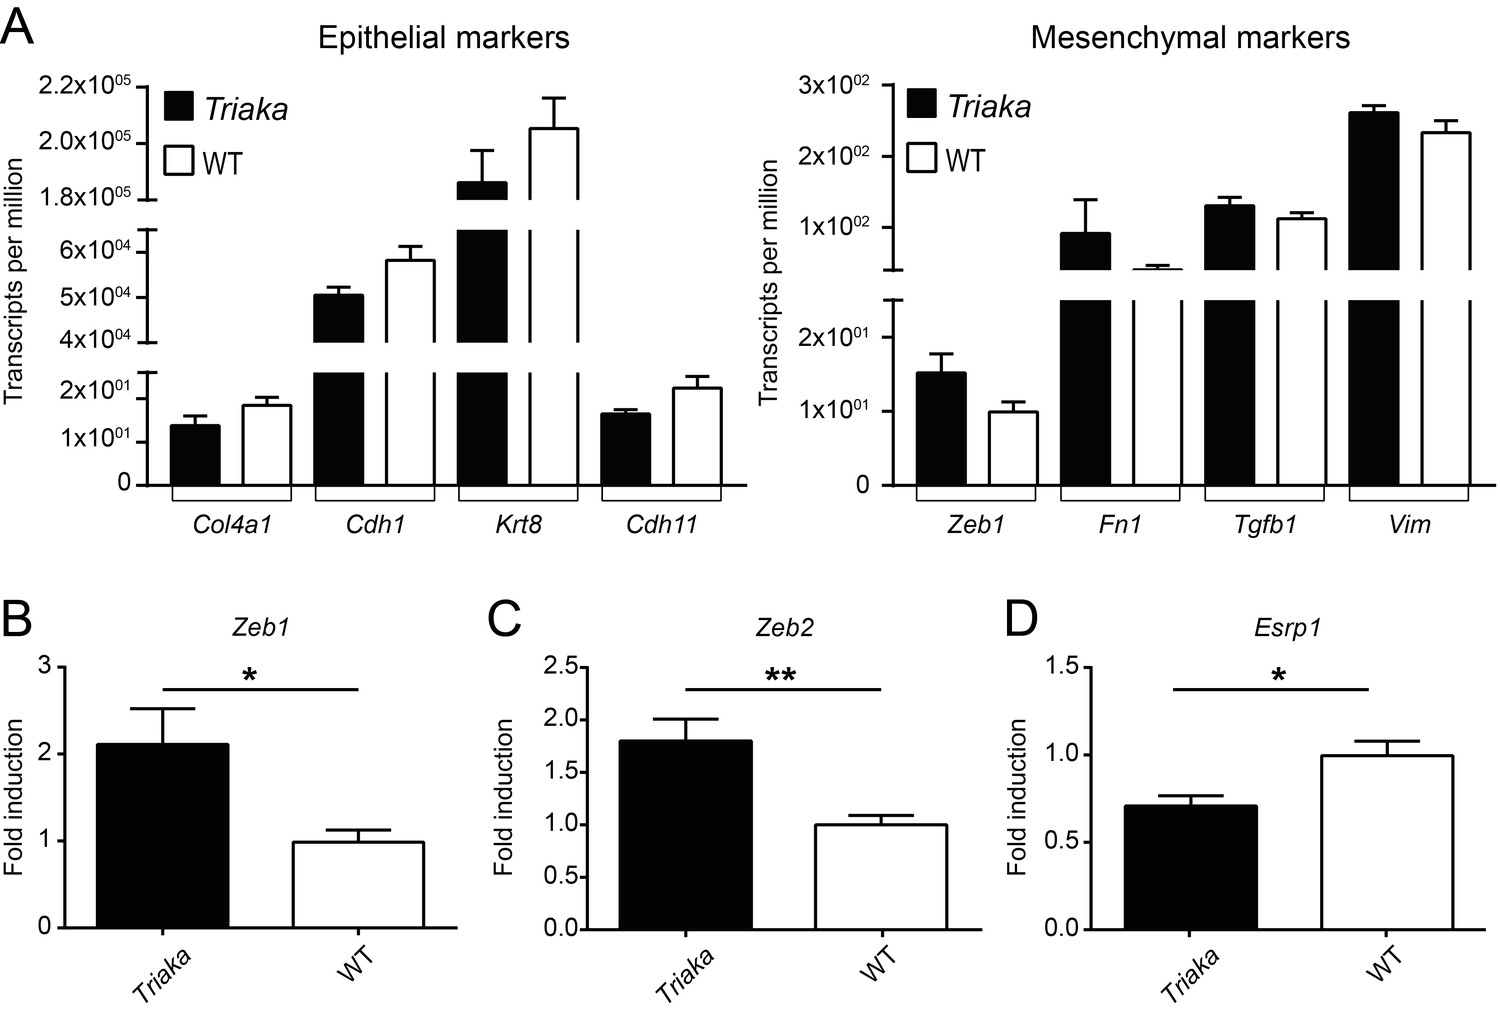
Partial EMT signature in Triaka cIECs.
(A) RNA sequencing was performed on colonic intestinal epithelial cells (cIECs) from Triaka and WT mice to assess expression of the indicated epithelial or mesenchymal marker genes (n = 4 mice per group). (B) Quantitative PCR was applied to measure transcript levels for Zeb1, Zeb2 (mesenchymal genes) and Esrp1 (epithelial gene) in WT and Triaka cIECs, after normalization to Gapdh expression (n = 9-14 mice per group). Statistics: (B) Student’s t test. *, P < 0.05, **, P < 0.01.
Author response image 5
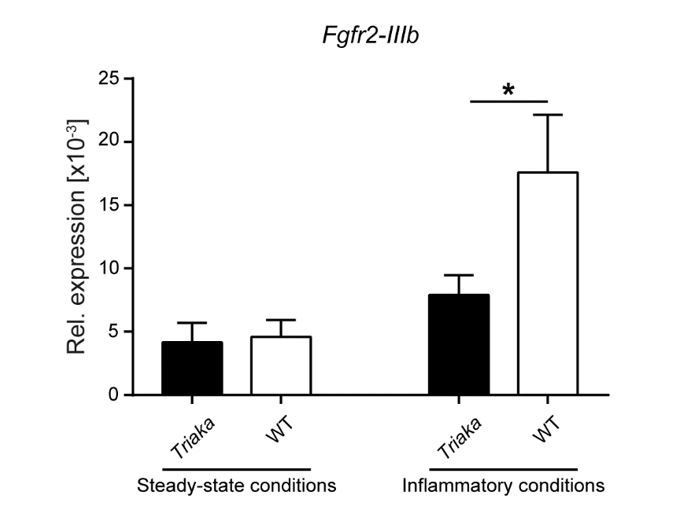
Availability of target transcripts may determine the effect of the Esrp1Triaka mutation.
Fgfr2-IIIb expression levels were measured in EPCAM+-sorted colonic intestinal epithelial cells of the indicated strains and normalized to Gapdh expression.
Intestinal epithelial cells were isolated from mice at steady-state or from animals that underwent a short 3 day-treatment with dextran sodium sulfate (indicated as “Inflammatory conditions”) (n = 9 mice per group for steady-state conditions and n = 7 mice per group during inflammation conditions. Statistics: (B) Mann-Whitney test. *, P < 0.05.
Tables
Table 1
Bacterial translocation and serum anti-commensal antibodies.
https://doi.org/10.7554/eLife.28366.013| No. of WT mice | No. of Triaka mice | p-value | |
|---|---|---|---|
| Penetration of bacteria in mucus or mucosa | |||
| 16S rRNA | 0/9 | 6/8 | 0.0023 |
| Serum anti-commensal antibodies | |||
| IgG1 | 1/10 | 7/10 | 0.0198 |
| IgG2b | 1/10 | 8/10 | 0.0055 |
-
Statistics: Fisher's exact test was performed. This table relates to Figure 3.
Table 2
Gradual loss of nuclear ESRP1 expression is associated with CRC progression
https://doi.org/10.7554/eLife.28366.028| Tissue type | Number of cases | ESRP1 expression (%) | p-value | |
|---|---|---|---|---|
| Average | Median | |||
| Normal | 26 | 75 | 75 | <0.0001 |
| Adenoma | 42 | 56.8 | 60 | |
| Carcinoma | 185 | 26.5 | 15 | |
| Lymph node metastasis | 68 | 9.1 | 0 | |
-
Statistics: Kruskal-Wallis test was performed. This table relates to Figure 6.
Author response table 1
Unaltered barrier function or mucus production/modification pathways in Triaka cIECs.
https://doi.org/10.7554/eLife.28366.035| SetID | Database | Description | Change Triaka vs. WT |
|---|---|---|---|
| GO:0070254 | GOBP | mucus secretion | Not significant |
| GO:0070255 | GOBP | regulation of mucus secretion | Not significant |
| GO:0070256 | GOBP | negative regulation of mucus secretion | Not significant |
| GO:0070257 | GOBP | positive regulation of mucus secretion | Not significant |
| GO:0070701 | GOCC | mucus layer | Not significant |
| GO:0070702 | GOCC | inner mucus layer | Not significant |
| GO:0070703 | GOCC | outer mucus layer | Not significant |
| GO:0006486 | GOBP | protein glycosylation | Not significant |
| GO:0006487 | GOBP | protein N-linked glycosylation | Not significant |
| GO:0006493 | GOBP | protein O-linked glycosylation | Not significant |
| GO:0006517 | GOBP | protein deglycosylation | Not significant |
| GO:0018242 | GOBP | protein O-linked glycosylation via serine | Not significant |
| GO:0018243 | GOBP | protein O-linked glycosylation via threonine | Not significant |
| GO:0018279 | GOBP | protein N-linked glycosylation via asparagine | Not significant |
| GO:0033575 | GOBP | protein glycosylation at cell surface | Not significant |
| GO:0033577 | GOBP | protein glycosylation in endoplasmic reticulum | Not significant |
| GO:0033578 | GOBP | protein glycosylation in Golgi | Not significant |
| GO:0060049 | GOBP | regulation of protein glycosylation | Not significant |
| GO:0060050 | GOBP | positive regulation of protein glycosylation | Not significant |
| GO:0060051 | GOBP | negative regulation of protein glycosylation | Not significant |
| GO:0090283 | GOBP | regulation of protein glycosylation in Golgi | Not significant |
| GO:0090284 | GOBP | positive regulation of protein glycosylation in Golgi | Not significant |
| GO:0090285 | GOBP | negative regulation of protein glycosylation in Golgi | Not significant |
| 5894152 | Reactome | O-glycosylation of TSR domain-containing proteins | Not significant |
| GO:0070830 | GOBP | tight junction assembly | Not significant |
| GO:1902396 | GOBP | protein localization to tight junction | Not significant |
| GO:2000810 | GOBP | regulation of tight junction assembly | Not significant |
| GO:0005923 | GOCC | tight junction | Not significant |
| GO:0007045 | GOBP | cell-substrate adherens junction assembly | Not significant |
| GO:0034332 | GOBP | adherens junction organization | Not significant |
| GO:0034333 | GOBP | adherens junction assembly | Not significant |
| GO:0034334 | GOBP | adherens junction maintenance | Not significant |
| GO:0071896 | GOBP | protein localization to adherens junction | Not significant |
| GO:0005912 | GOCC | adherens junction | Not significant |
| GO:0005913 | GOCC | cell-cell adherens junction | Not significant |
| GO:0005914 | GOCC | spot adherens junction | Not significant |
| GO:0005924 | GOCC | cell-substrate adherens junction | Not significant |
Additional files
-
Supplementary file 1
Antibodies and conjugates used for flow cytometry analysis.
- https://doi.org/10.7554/eLife.28366.029
-
Supplementary file 2
Self-designed primers for qPCR analysis.
- https://doi.org/10.7554/eLife.28366.030
-
Transparent reporting form
- https://doi.org/10.7554/eLife.28366.031
Download links
A two-part list of links to download the article, or parts of the article, in various formats.
Downloads (link to download the article as PDF)
Open citations (links to open the citations from this article in various online reference manager services)
Cite this article (links to download the citations from this article in formats compatible with various reference manager tools)
The ESRP1-GPR137 axis contributes to intestinal pathogenesis
eLife 6:e28366.
https://doi.org/10.7554/eLife.28366


