Cryo-EM structure of the SAGA and NuA4 coactivator subunit Tra1 at 3.7 angstrom resolution
- University College London, United Kingdom
- Birkbeck College, United Kingdom
Figures
Figure 1 with 4 supplements
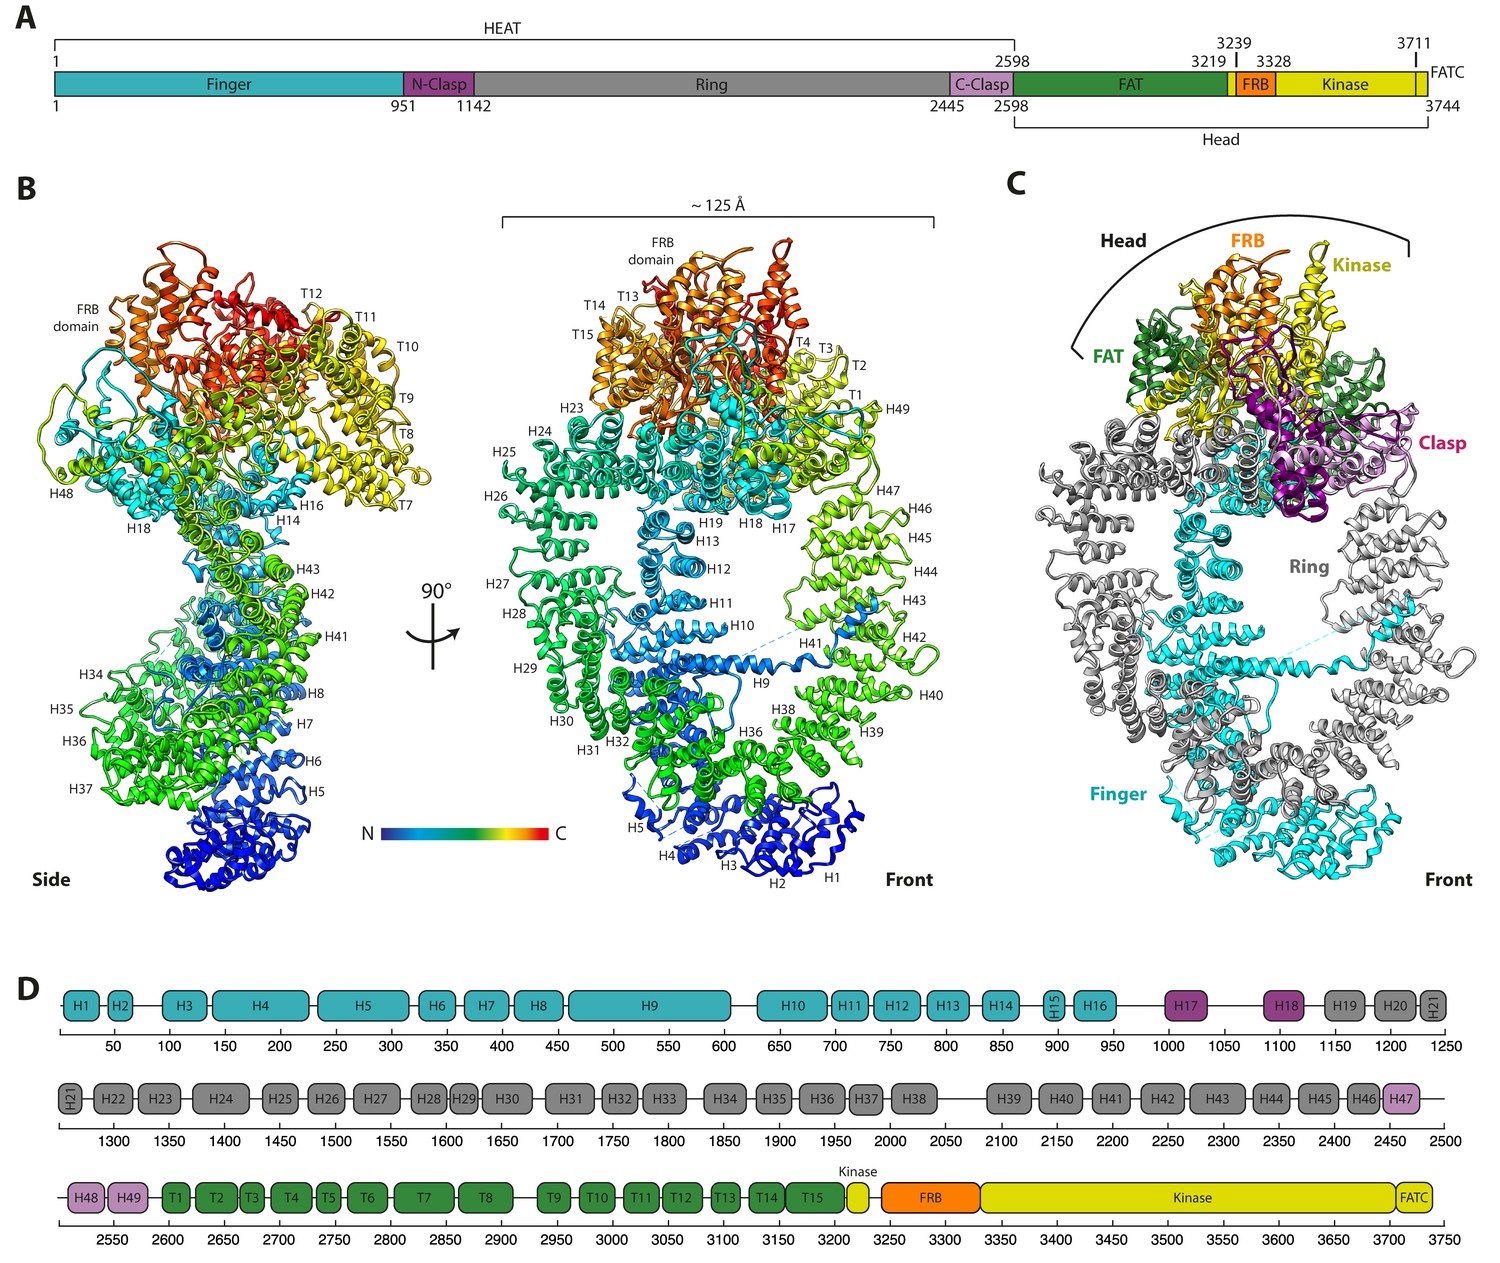
The cryo-EM structure of the Tra1 protein.
(A) The domain organisation of Tra1. Colouring is matched to Figure 1C,D. The HEAT domain contains 49 HEAT repeats and the FAT domain (named after FRAP, ATM and TRRAP) contains 15 TPR (tetratricopeptide) repeats. The FRB domain (FKBP-Rapamycin-Binding), Kinase and FATC (FRAP-ATM-TRRAP C-terminus) domains are located at the C-terminus. (B) Front and side views of the Tra1 protein. The N-terminus is represented in blue and transitions to red at the C-terminus. Missing residues are shown as dotted lines. Where visible, HEAT repeats H1-H49 and TPR repeats T1-T15 are labelled sequentially, from N- to C-terminus. (C) The ring organisation of the Tra1 protein defined by its topological regions of Finger, Clasp, Ring, FAT, FRB and Kinase. The two halves of the clasp are shown in different shades of purple. The view is from the front as in Figure 1A. (D) Schematic detailing the primary sequence positions of alpha solenoid repeats H1-H49 and T1-T15 and their correspondence to the regions defined in panels A and C.
Figure 1—figure supplement 1

Conservation plot and example of alignment.
(A) Sequence conservation of Tra1. 18 Homologs of Tra1 from 17 species (S. cerevisiae, S. pombe Tra1, S. pombe Tra2, K. lactis, C. albicans, C. glabrata, C. thermophilum, D. melanogaster, C. elegans, A. thaliana, O. sativa, N. crassa, A. niger, H. sapiens, X. tropicalis, D. rerio, M. musculus and G. gallus) were aligned with Clustal Omega (Sievers et al., 2011) and submitted to the CONSURF server (Ashkenazy et al., 2010) for conservation scoring. Scores are plotted as a function of S. cerevisiae Tra1 residue position. Grey trace indicates scores for individual residues, red trace indicates scores averaged over an 11-residue sliding window. The domain structure of Tra1 is indicated above the trace, as drawn for Figure 1D. The highlighted region shaded in orange is expanded in the next panel. (B) Example of sequence alignment of Tra1 over the residues shaded in previous panel with UNIPROT codes for each sequence. Numbering is for S. cerevisiae Tra1.
Figure 1—figure supplement 2
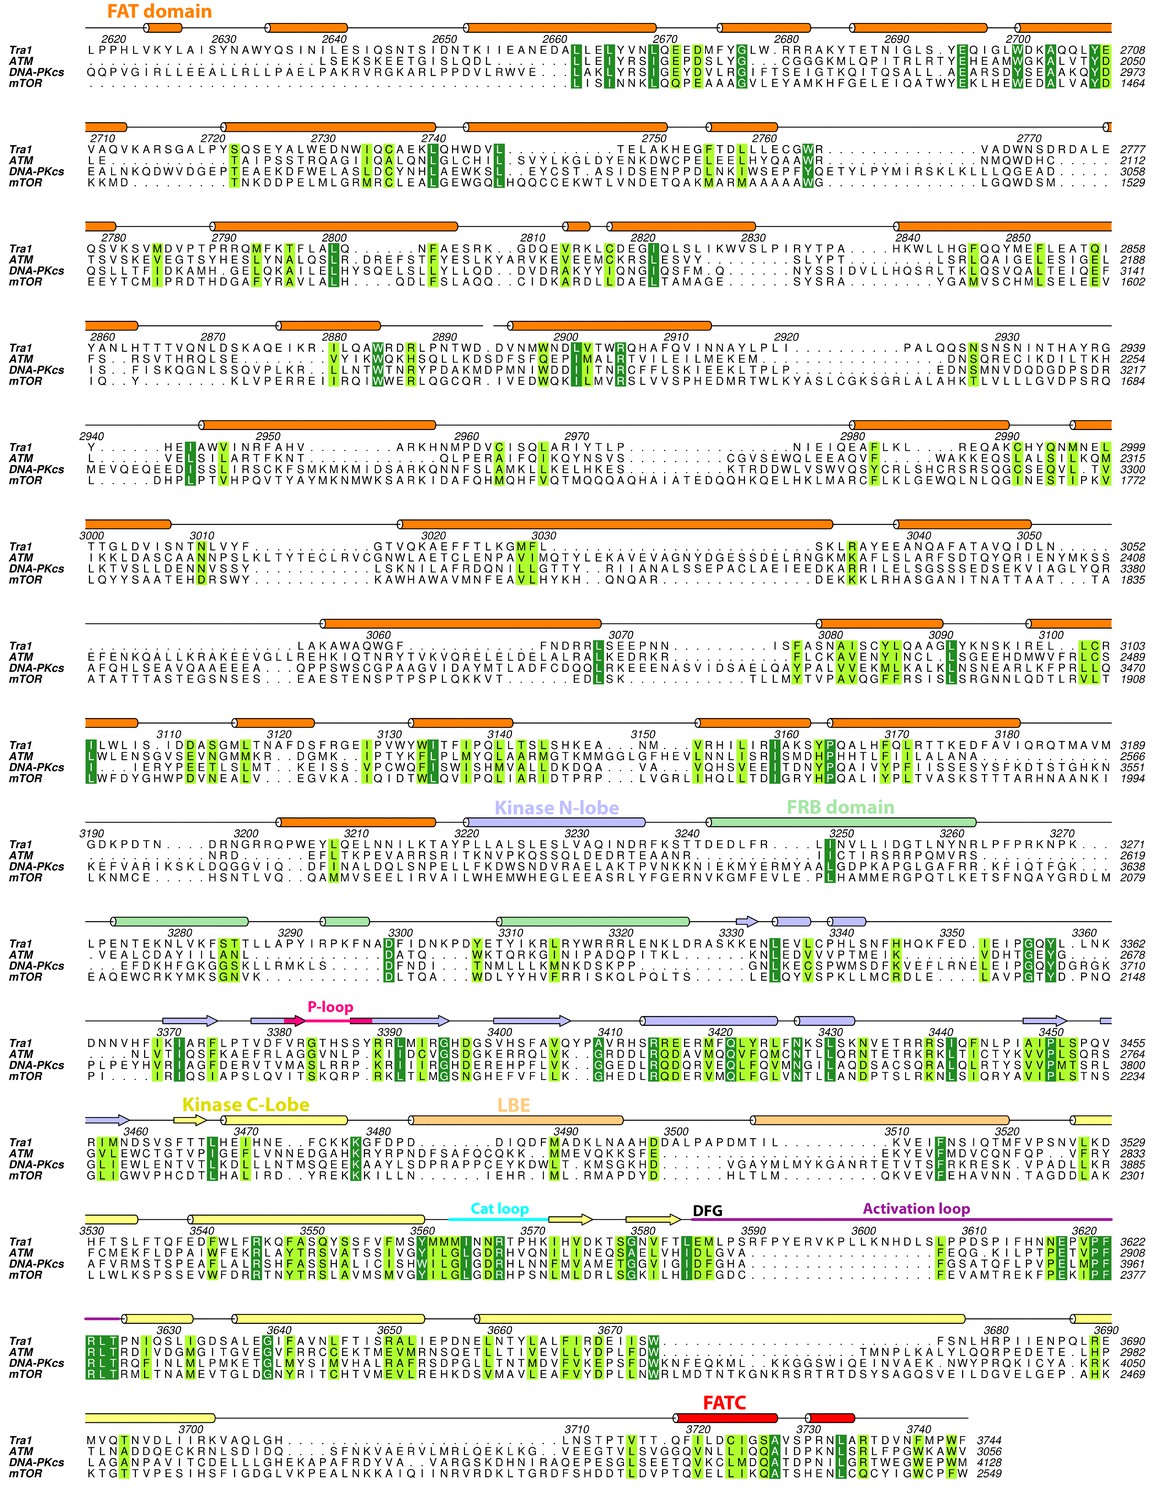
Sequence alignment of FRB and Kinase domains from ATM, DNA-PKcs, mTOR and Tra1.
FAT, FRB, Kinase and FATC domain sequences of Tra1, DNA-PKcs and mTOR were aligned with Clustal Omega and formatted with ALINE (Bond and Schüttelkopf, 2009). Numbering and secondary structure elements are shown for Tra1, and coloured as in Figure 2B. Highlighted above the sequence are the phosphate binding loop, catalytic loop, DFG motif and activation loop.
Figure 1—figure supplement 3

Purification, data collection, image processing and overall reconstruction of Tra1.
(A) A chromatogram from a Superose 6 10/300 GL SEC column showing a peak at 14 ml. (B) SDS-PAGE analysis of chromatogram given in (a). Lane 1: Molecular weight markers (KDa). Lanes 2–10: 0.25 ml fractions eluting between 12.5 and 14.75 ml, indicating pure Tra1 at ~450 KDa. (C) Representative micrograph of Tra1 on lacey carbon grids. Scale bar is 20 nm. (D) 2D class averages of Tra1. (E) Angular distribution of particle images from Tra1. (F) Gold standard FSC plot for the reconstruction both with masking (orange) and without masking (green). The 0.143 cutoff is indicated with associated resolution for both plots. (G) Map to model FSC plots for cross validation. The final Tra1 coordinates were randomly perturbed by a maximum of 0.5 Å before full refinement with secondary structure restraints against an unmasked map reconstruction from 50% of the data. FSCs were calculated between the refined model and the refinement map (FSCwork, blue) and the withheld validation map (FSCfree, red). Also shown is the FSC between the final refined model and the total map from all the data (FSCtotal, black). The resolution limit used in all refinements was 3.7 Å.
Figure 1—figure supplement 4
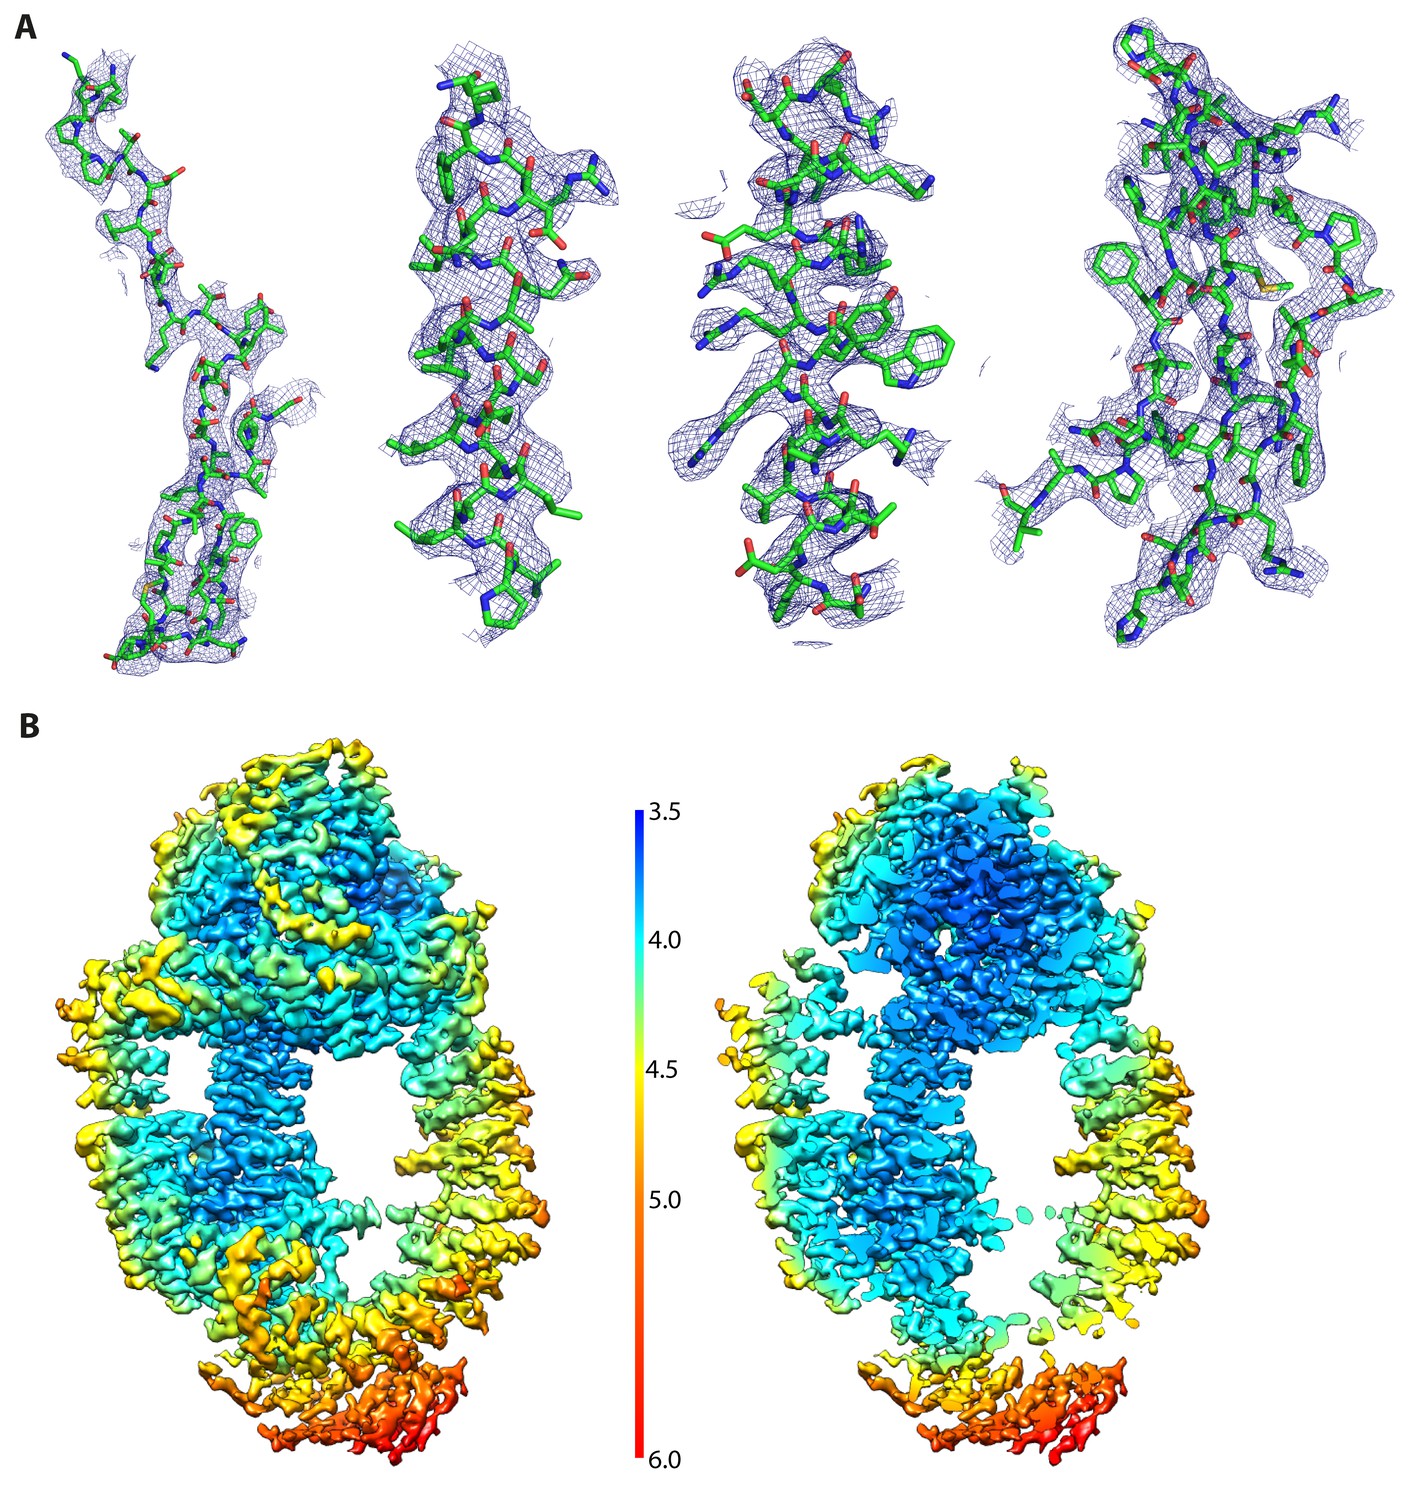
Resolution map and exemplary electron density for Tra1.
(A) Exemplary electron density from the reconstruction. Four regions representing residues 960–996, 3220–3238, 3306–3327 and 3371–3410 (left to right) are overlaid with their electron density. Regions 960–996 and 3371–3410 contain significant proportion of beta strands and loops and highlight the quality of the reconstruction. Generated with PyMOL. (B) Local resolution variations of the Tra1 reconstruction was calculated using RELION and coloured as indicated in the legend. The left panel view is from the front, as in Figure 1A. The right panel is oriented as in Figure 1A but sliced vertically through Tra1, highlighting the resolution distribution within the core of Tra1.
Figure 2 with 1 supplement
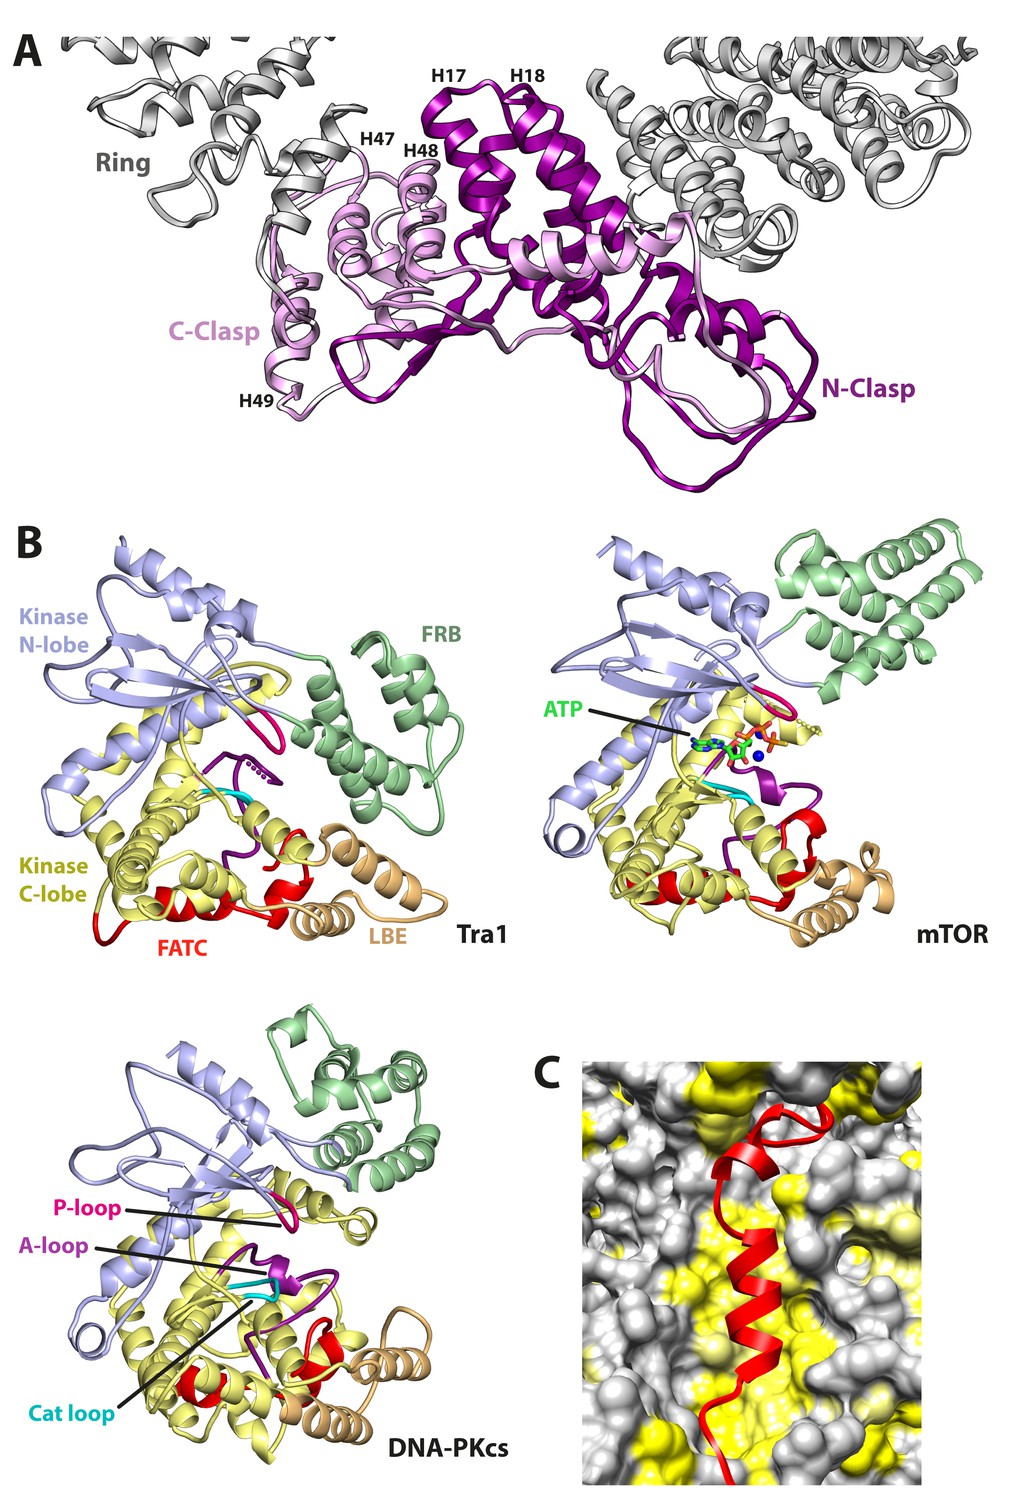
Structural features of Tra1.
(A) The clasp region of Tra1 is shown as part of the ring. Repeats H17, H18, H47, H48 and H49 form the clasp and contain interlocking protein loops that fix the clasp together. The view is from the front. Finger and Head regions have been removed for clarity. (B) Comparison of FRB, Kinase, LBE and FATC domains between PIKK family members. The kinase domain is split into N-lobe and C-lobe halves. Structures of Tra1, mTOR with bound ATP (PDB code 4JSP) and DNA-PKcs (PDB code 5LUQ) are indicated. The phosphate binding loop (P-loop), catalytic loop (Cat loop) and Activation loop (A-loop) are highlighted for each structure. (C) The FATC domain binds to a hydrophobic pocket. FATC is shown as a red riboon, bound to the Kinase domain shown in surface representation. Hydrophobic surfaces are coloured in yellow.
Figure 2—figure supplement 1
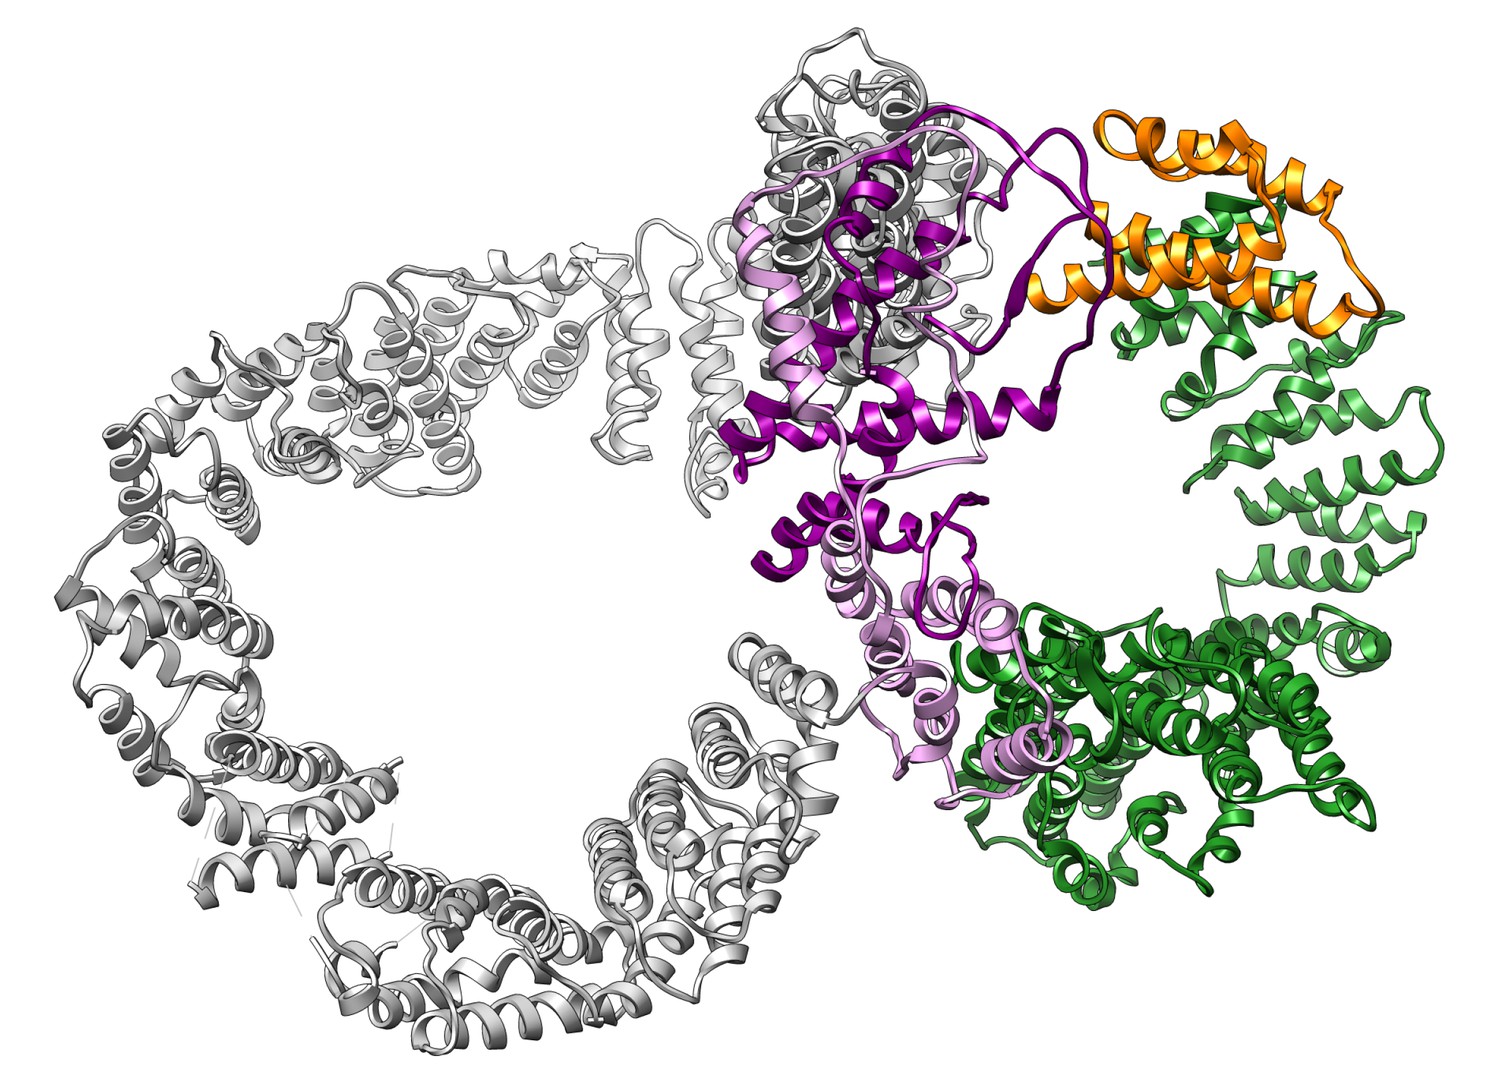
Figure of eight organisation of the Ring (grey), Clasp (purple, FAT (green) and FRB (orange) domains.
The juxtaposition of the Ring, Clasp, FAT and FRB domains generates two rings that form a bent ‘figure-of-eight’ conformation, where the clasp represents the crossover. Finger and KF regions have been omitted for clarity.
Figure 3 with 1 supplement
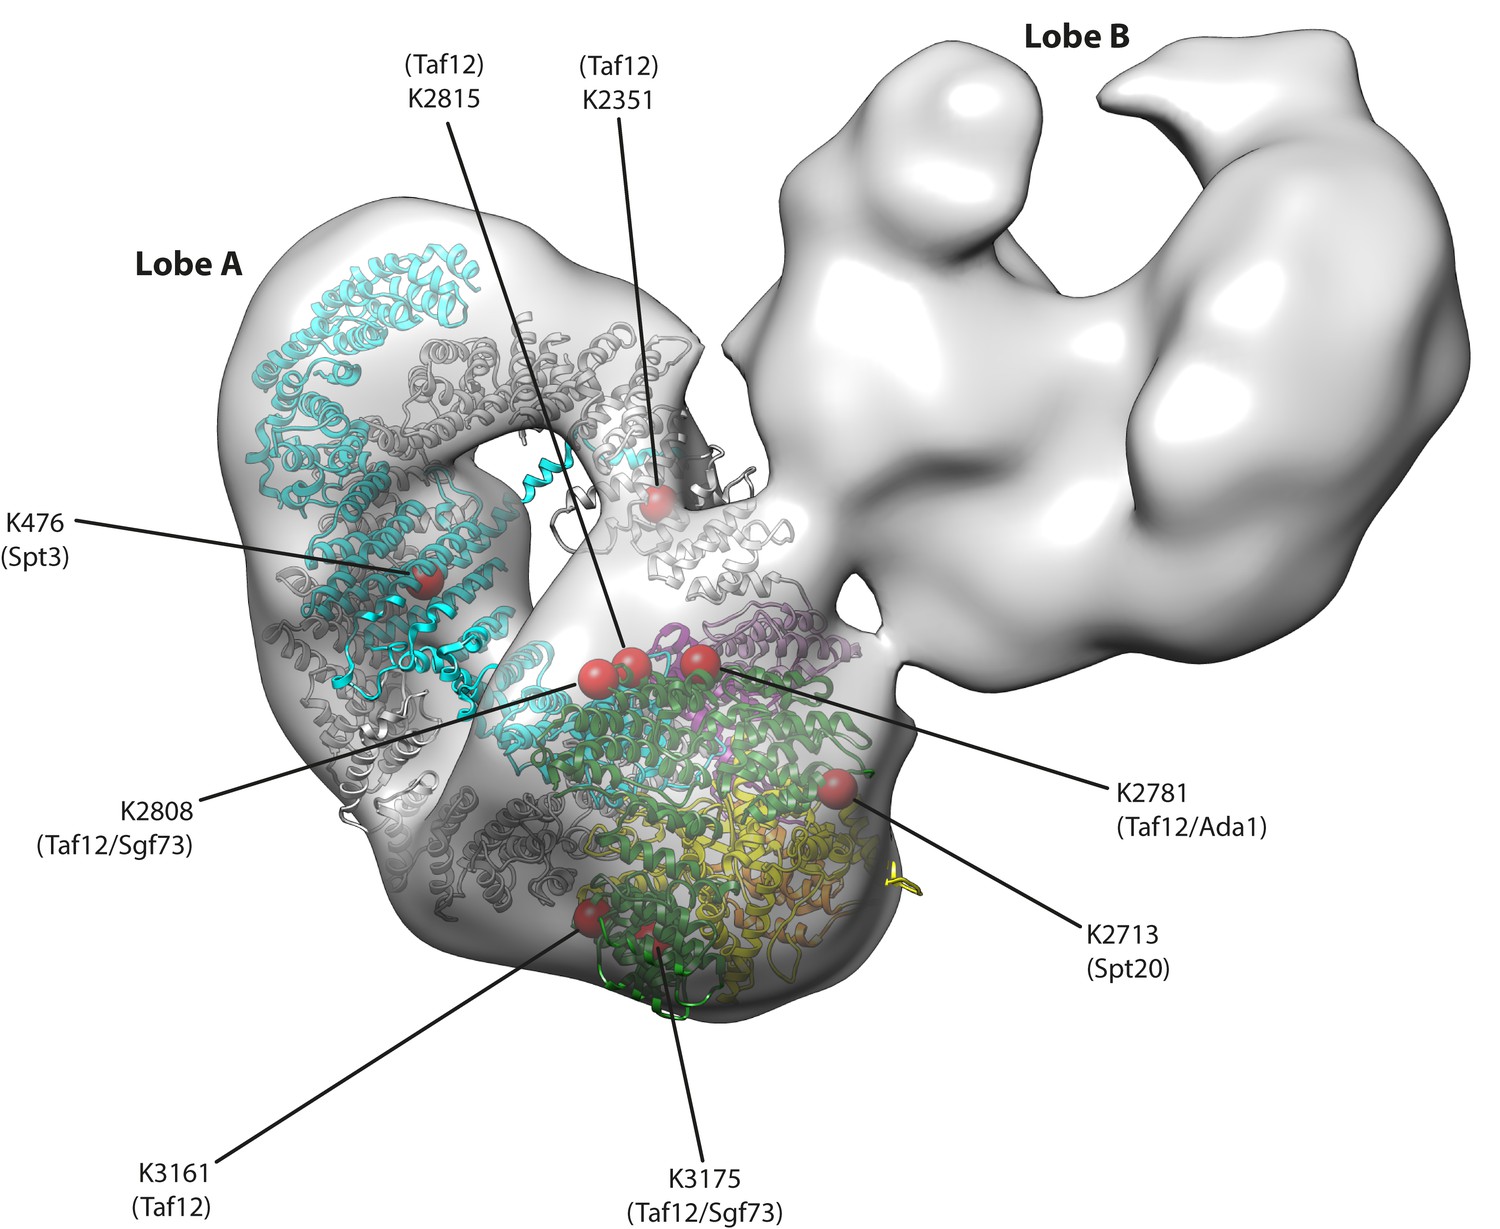
Tra1 occupies a peripheral position within SAGA.
A negative stain reconstruction of S. cerevisiae SAGA was retrieved from the EMDB (EMD-2693) and Tra1 was fitted into the map using Chimera. An fit to the density was found to lobe A, and displayed as a ribbon model within the SAGA map (coloured as in Figure 1C). Eight red spheres on the Tra1 model indicate crosslinking sites to SAGA determined by mass spectrometry, and are labelled with residue position and target subunit within SAGA. Also see Video 1.
Figure 3—figure supplement 1

Representative 2D class average of Tra1 (left panel) was filtered to 21 Å (middle panel) for comparison with 2D class average determined for the NuA4 complex (Chittuluru et al.
, 2011) (right panel, reproduced with permission). Scale bar represents 5 nm.
Figure 4
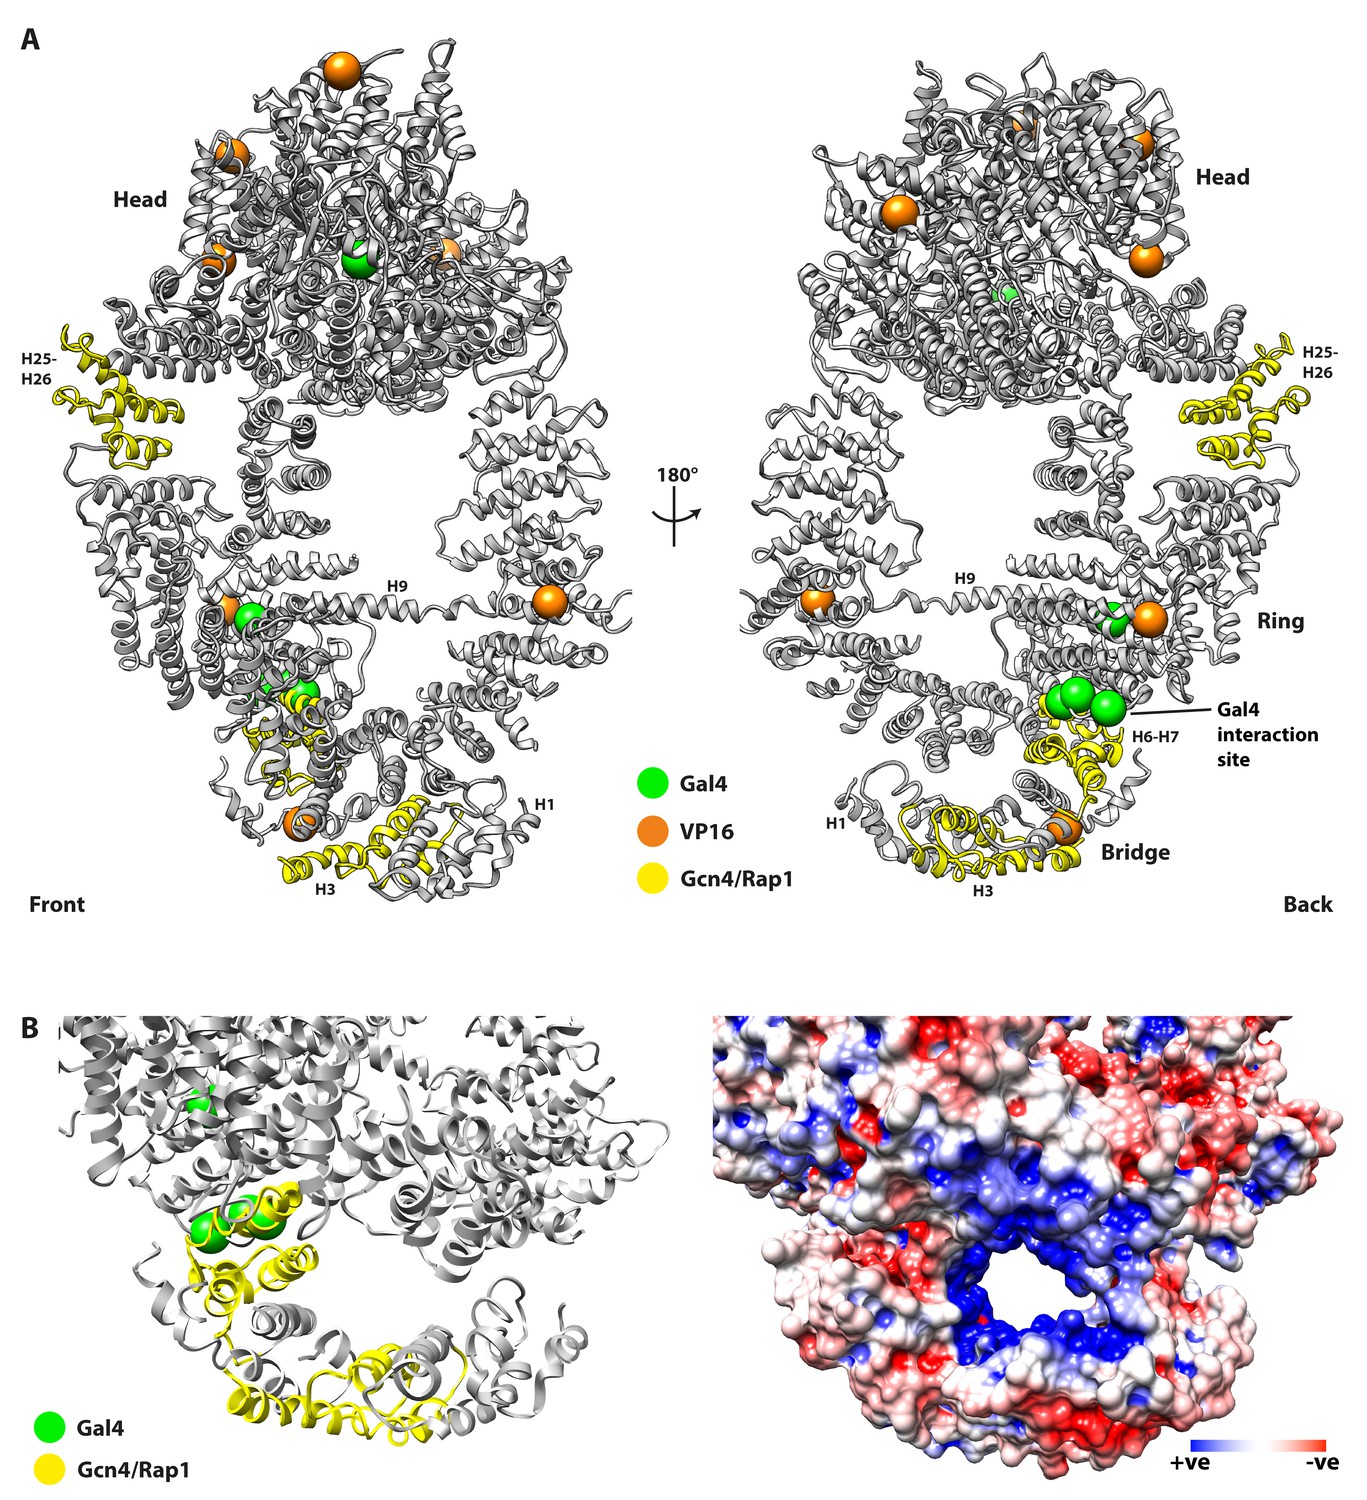
Mutations of Tra1 that disrupt activator targeting are distributed across the Tra1 structure.
(A) Front and back view of Tra1 are shown together with mutations that disrupt activator targeting of SAGA/NuA4. Tra1 is shown as grey ribbon, and locations of amino acid substitutions and deletions are shown as spheres and yellow ribbon respectively. (B) Left panel shows a close up view of the N-terminal region of the Finger and its position relative to the Ring, with mutations that impair activator recruitment coloured as in Figure 4. Right panel has the same view but showing an electrostatic surface potential, highlighting the negatively charged channel that is lined by the Finger and Ring regions. Electrostatic surface potentials were calculated using PDB2PQR (Dolinsky et al., 2007) and APBS (Baker et al., 2001) tools implemented in Chimera.
Figure 5 with 1 supplement
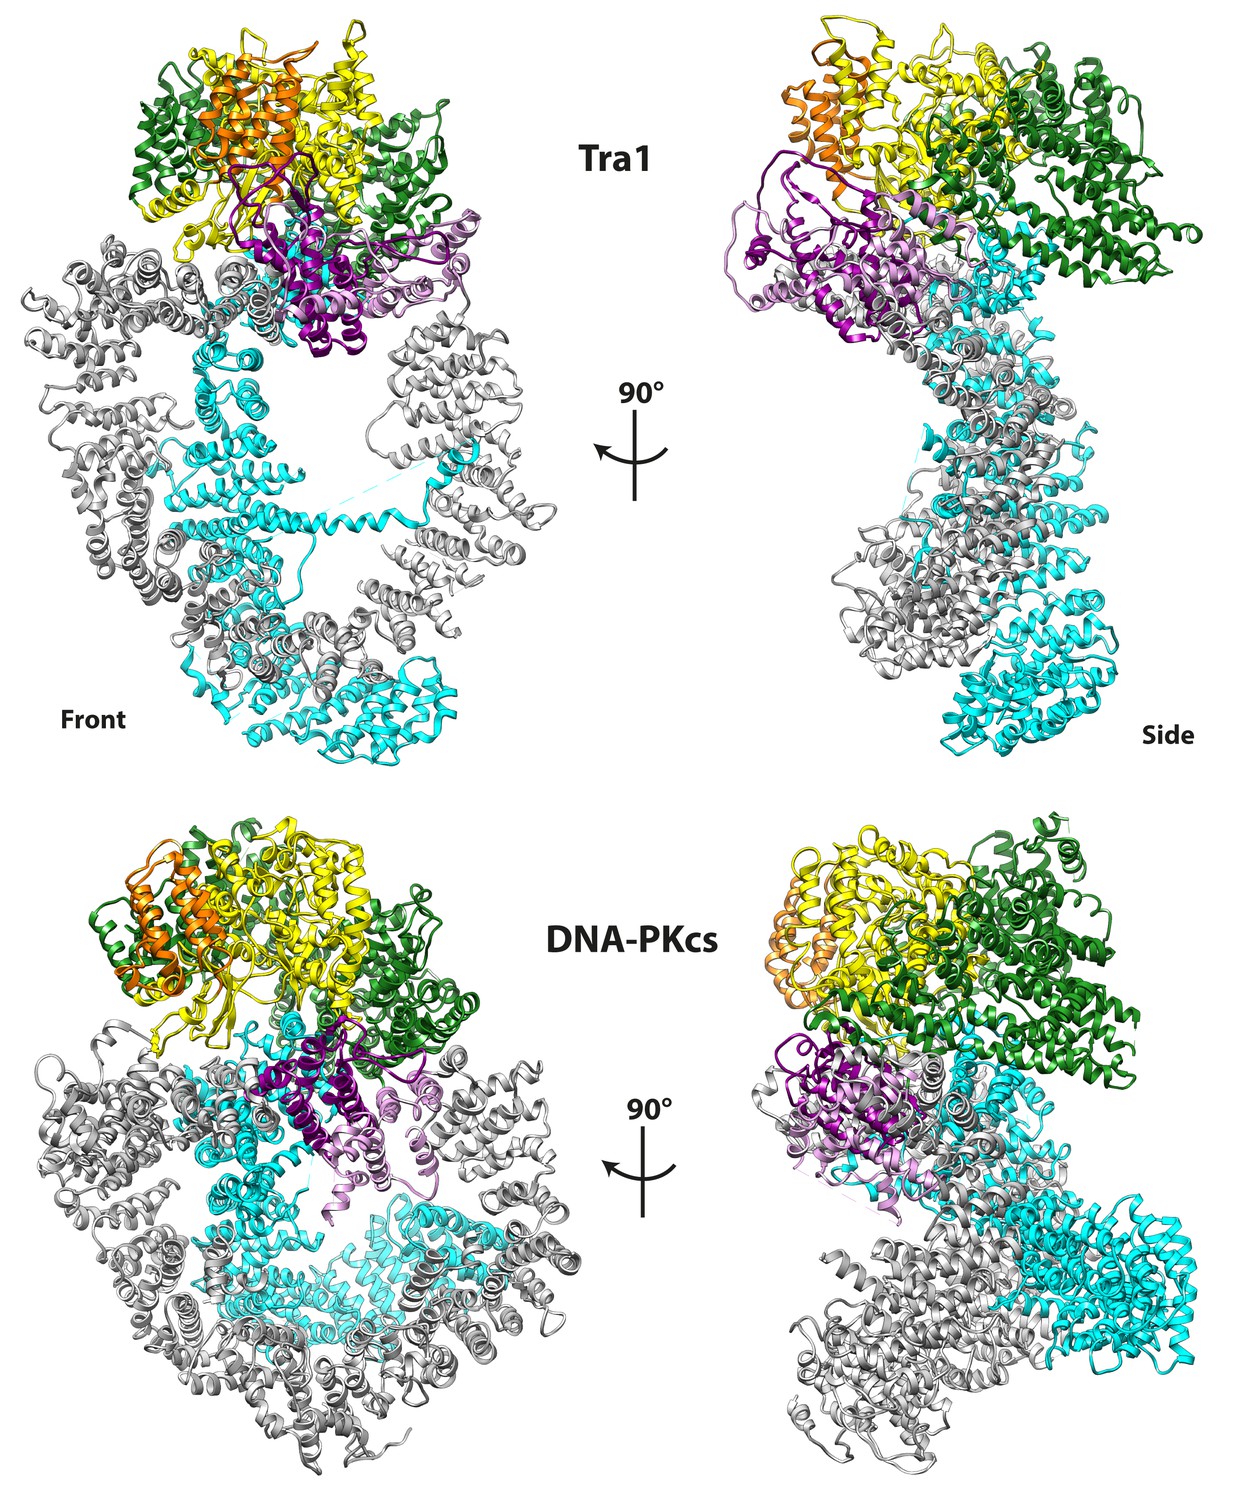
Tra1 is structurally homologous to DNA-PKcs.
DNA-PKcs (PDB code 5LUQ) was superposed with Tra1, and regions of DNA-PK analogous to Finger, Ring, Clasp, FAT, FRB and Kinase are coloured according to the scheme given in Figure 1C and D. Front and side views are shown and highlight their similar topology.
Figure 5—figure supplement 1
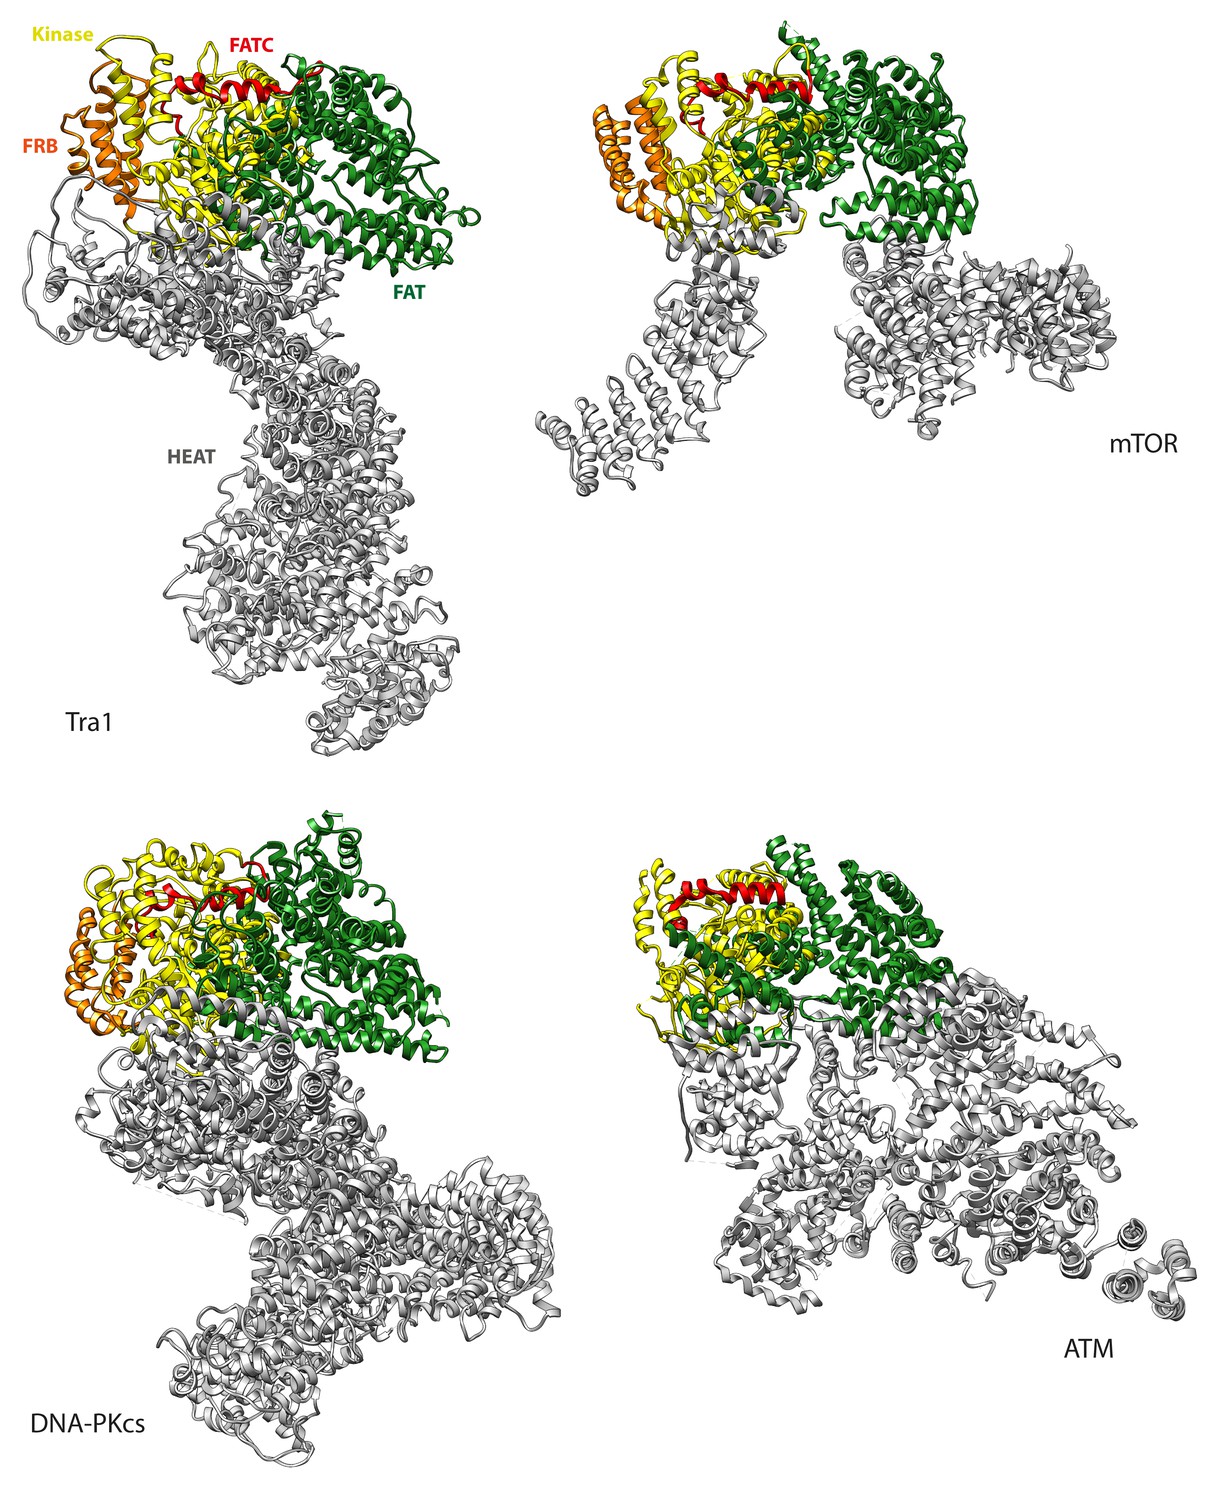
HEAT domain comparison with mTOR, ATM and DNA-PKcs.
Tra1 was structurally aligned with mTOR (PDB code 5FLC), ATM (PDB code 5NP1) and DNA-PKcs (PDB code 5LUQ) via their conserved kinase domains. The HEAT, FAT, FRB, Kinase and FATC domains are coloured grey, green, orange, yellow and red respectively. The conformations of the FAT, FRB, Kinase and FATC domains are similar, but the the HEAT domain follows a completely different trajectory in both proteins.
Videos
Video 1
The structure of the Tra1 protein and its position within the SAGA complex.
A rotating movie of the Tra1 protein is shown, coloured from blue at the N-terminus to red at the C-terminus. The colours then transition to those defined for the regions described in Figure 1C and are labelled within the movie. Finally, the view zooms out and shows the fit of Tra1 within a reconstruction of the SAGA complex.
Tables
Table 1
Structure determination and refinement details.
https://doi.org/10.7554/eLife.28384.008| Data collection | |
|---|---|
| Particles | 182,285 |
| Pixel Size (Å) | 1.06 |
| Defocus Range (-μm) | 1.5–3.5 |
| Voltage (kV) | 300 |
| Electron Dose (e- Å−2) | 44 |
| Refinement and validation | |
|---|---|
| Resolution (Å) | 3.7 |
| Map CC (whole unit cell) | 0.817 |
| Average B-factor (Å2) | 79.2 |
| RMS deviations – Bonds (Å) | 0.010 |
| RMS deviations – Angles (deg) | 1.41 |
| EMRinger score | 1.62 |
| Molprobity Score | 2.29 |
| Clashscore | 8.27 |
| Ramachandran plot (%) | |
| Favoured | 84.6 |
| Allowed | 14.8 |
| Outlier | 0.64 |
| C-beta deviations | 0 |
| Rotamer Outliers (%) | 1.72 |
Additional files
-
Transparent reporting form
- https://doi.org/10.7554/eLife.28384.017
Download links
A two-part list of links to download the article, or parts of the article, in various formats.
Downloads (link to download the article as PDF)
Open citations (links to open the citations from this article in various online reference manager services)
Cite this article (links to download the citations from this article in formats compatible with various reference manager tools)
Cryo-EM structure of the SAGA and NuA4 coactivator subunit Tra1 at 3.7 angstrom resolution
eLife 6:e28384.
https://doi.org/10.7554/eLife.28384


