A novel region in the CaV2.1 α1 subunit C-terminus regulates fast synaptic vesicle fusion and vesicle docking at the mammalian presynaptic active zone
- Max Planck Florida Institute for Neuroscience, United States
- University of Iowa, United States
- Leiden University Medical Center, Netherlands
Figures
Figure 1
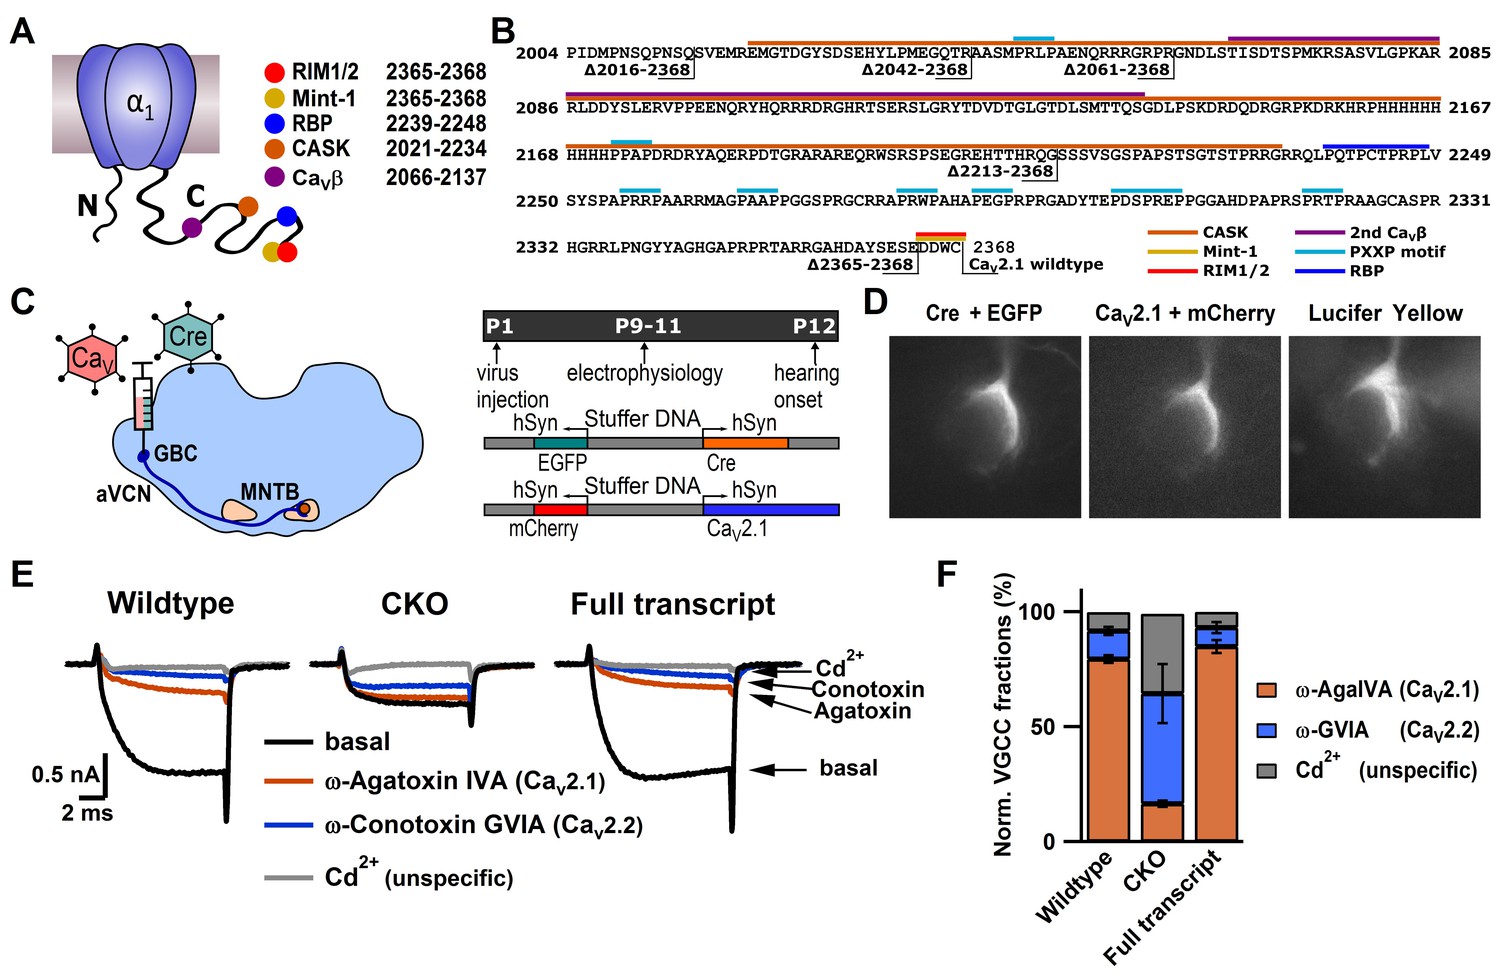
CaV2.1 can be selectively ablated and functionally rescued at the calyx of Held.
(A) Cartoon depicting CaV2.1 α1 subunit distal C-terminal interaction partners. (B) Amino acid sequence of the distal Cav2.1 C-terminus indicating interaction sites and truncation mutants. (C) left: Schematic view of stereotactic surgery to inject/coinject HdAd vectors expressing Cre + eGFP and CaV2.1 constructs + mCherry into the aVCN at age P1. Right: top: Experimental timeline from virus injection at P1 to electrophysiological recordings at P9-P11 prior to the onset of hearing (P12). Middle and bottom: schematic view of the viral constructs used, expressing either Cre + eGFP or CaV2.1 constructs + mCherry, respectively, driven by individual promotors. (D) Calyx of Held terminals transduced with Cre + eGFP (top) and CaV2.1 + mCherry (middle). eGFP and mCherry signals overlap with those of a calyx of Held loaded with Lucifer Yellow via a patch pipette (bottom). (E) Pharmacological isolation of presynaptic CaV2 isoforms in wildtype, CKO and CaV2.1 full transcript rescue calyxes. Traces in absence of any blockers (black), after blocking CaV2.1 fraction with 200 nM ω-AgaIVA (brown), after blocking CaV2.2 fraction with 2 µM ω-GVIA (blue) and after blocking all CaV2 channels with 50 µM Cd2+ (gray). (F) Relative CaV2 current fractions in wildtype, CKO and CaV2.1 full transcript rescue calyxes (n = 3 for each condition).
Figure 2 with 1 supplement
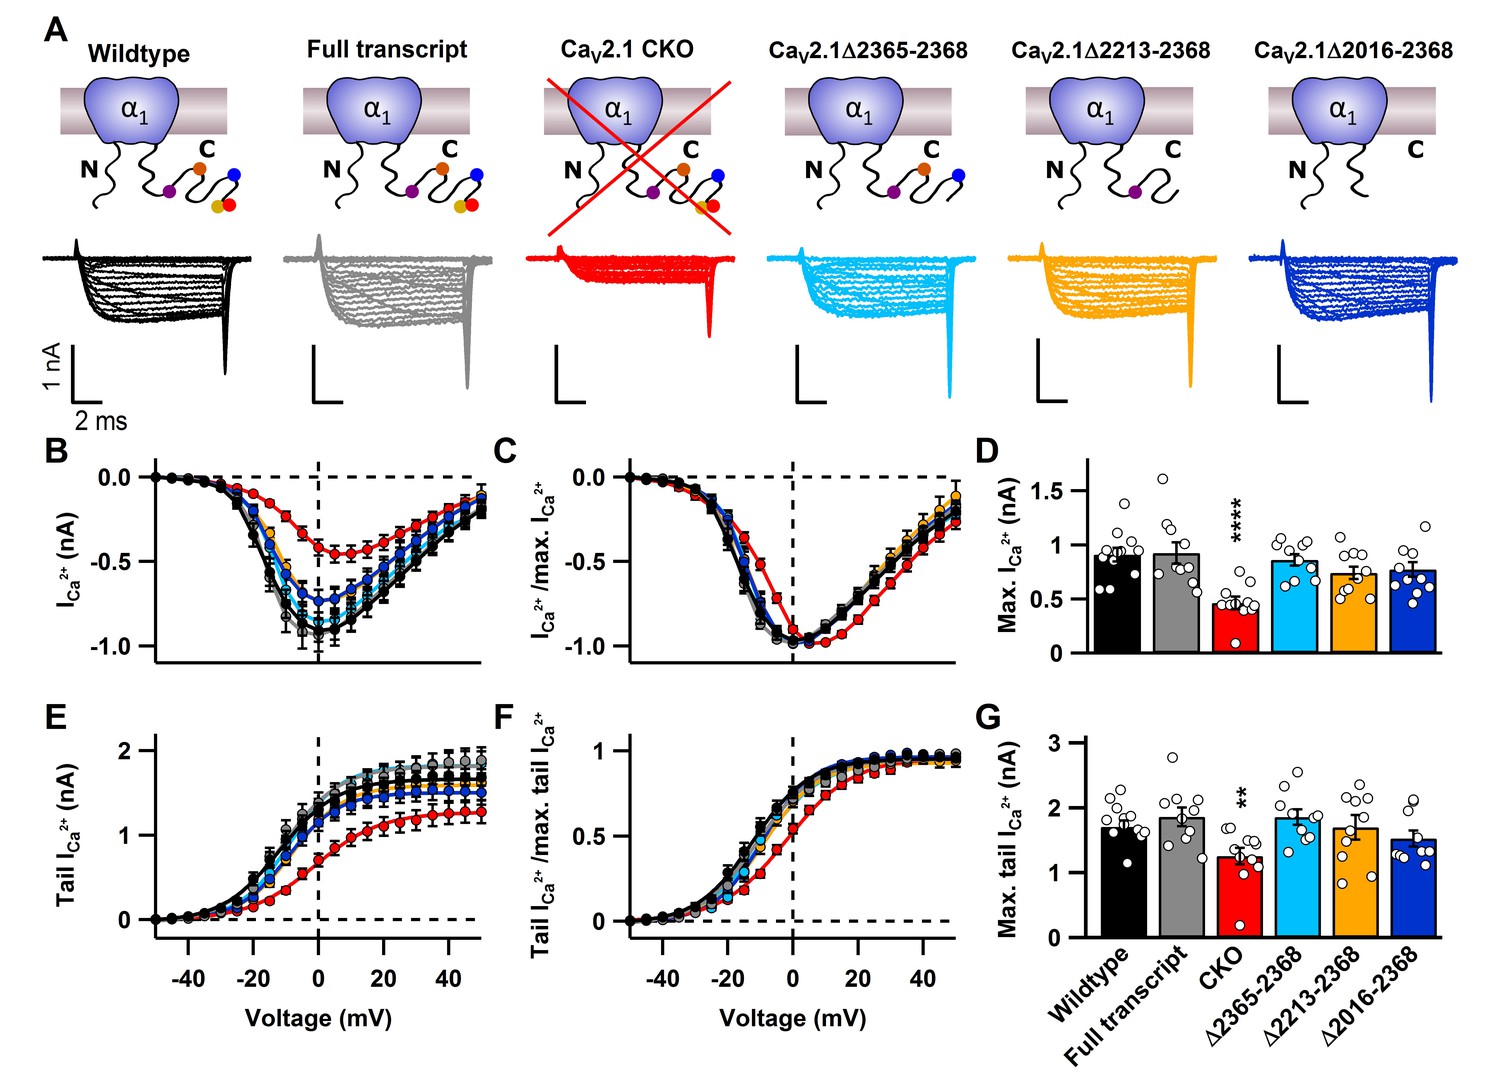
C-terminal deletions in CaV2.1 do not affect CaV2 abundance at the presynaptic terminal.
(A) Cartoons depicting CaV2.1 full transcript or mutants (top) with corresponding exemplary Ca2+ currents (bottom) triggered by 10 ms voltage steps from d -50 mV to 50 mV in 5mV steps. (B–C) Current-voltage relationship of absolute Ca2+ currents (B) and normalized current-voltage relationships (I/Imax; C). (D) Mean absolute Ca2+ currents. (E–F) Absolute tail currents (E) and normalized (I/Imax; F) tail currents as a function of voltage. (G) Mean tail Ca2+ currents at +40 mV. For CaV2.1 α1 CKO (n = 11), wildtype (n = 12), CaV2.1 α1full transcript (n = 10), Δ2365–2368 (n = 10), Δ2213–2368 (n = 10) and Δ2016–2368 (n = 10). All data are depicted as mean ± SEM. Detailed values can be derived from Table 1.
Figure 2—figure supplement 1
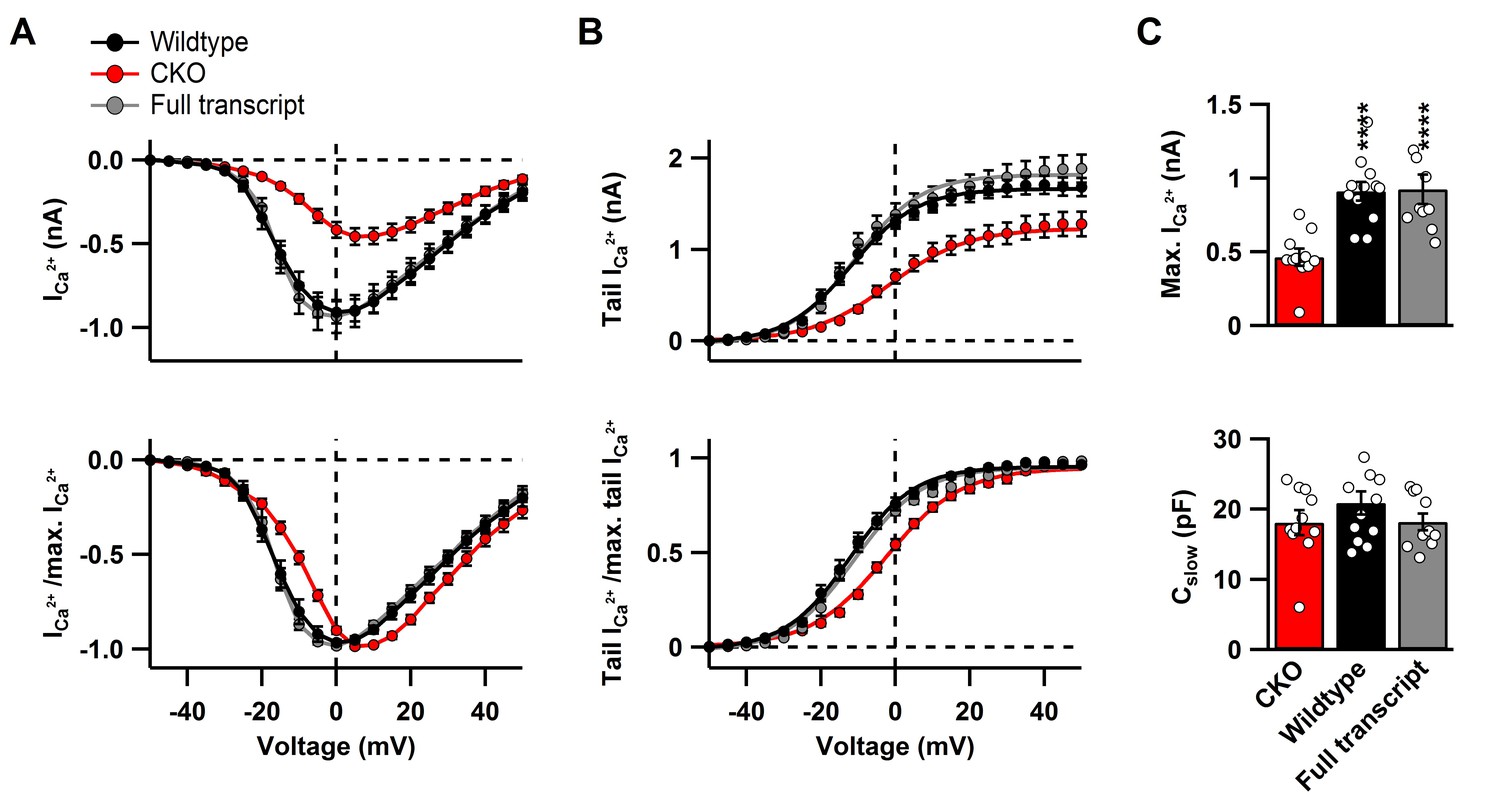
Cav2.1 rescue after CKO does not affect biophysical properties of the Ca2+ current at the calyx of Held.
(A) top: Raw peak Ca2+ current amplitudes and, bottom: normalized peak currents (I/Imasx) as a function of voltage. Continuous curves represent fits according to Equation 1. (B) top: Averaged raw and, bottom: normalized tail currents (I/Imax) (bottom) as a function of voltage. Continuous curves represent Boltzmann fits according to Equation 2. (C) top: Quantification of maximal Ca2+ peak currents and, bottom: cell capacitance. All data are depicted as mean ± SEM with wildtype (n = 12), full transcript (n = 10) and CKO (n = 11).
Figure 3 with 1 supplement
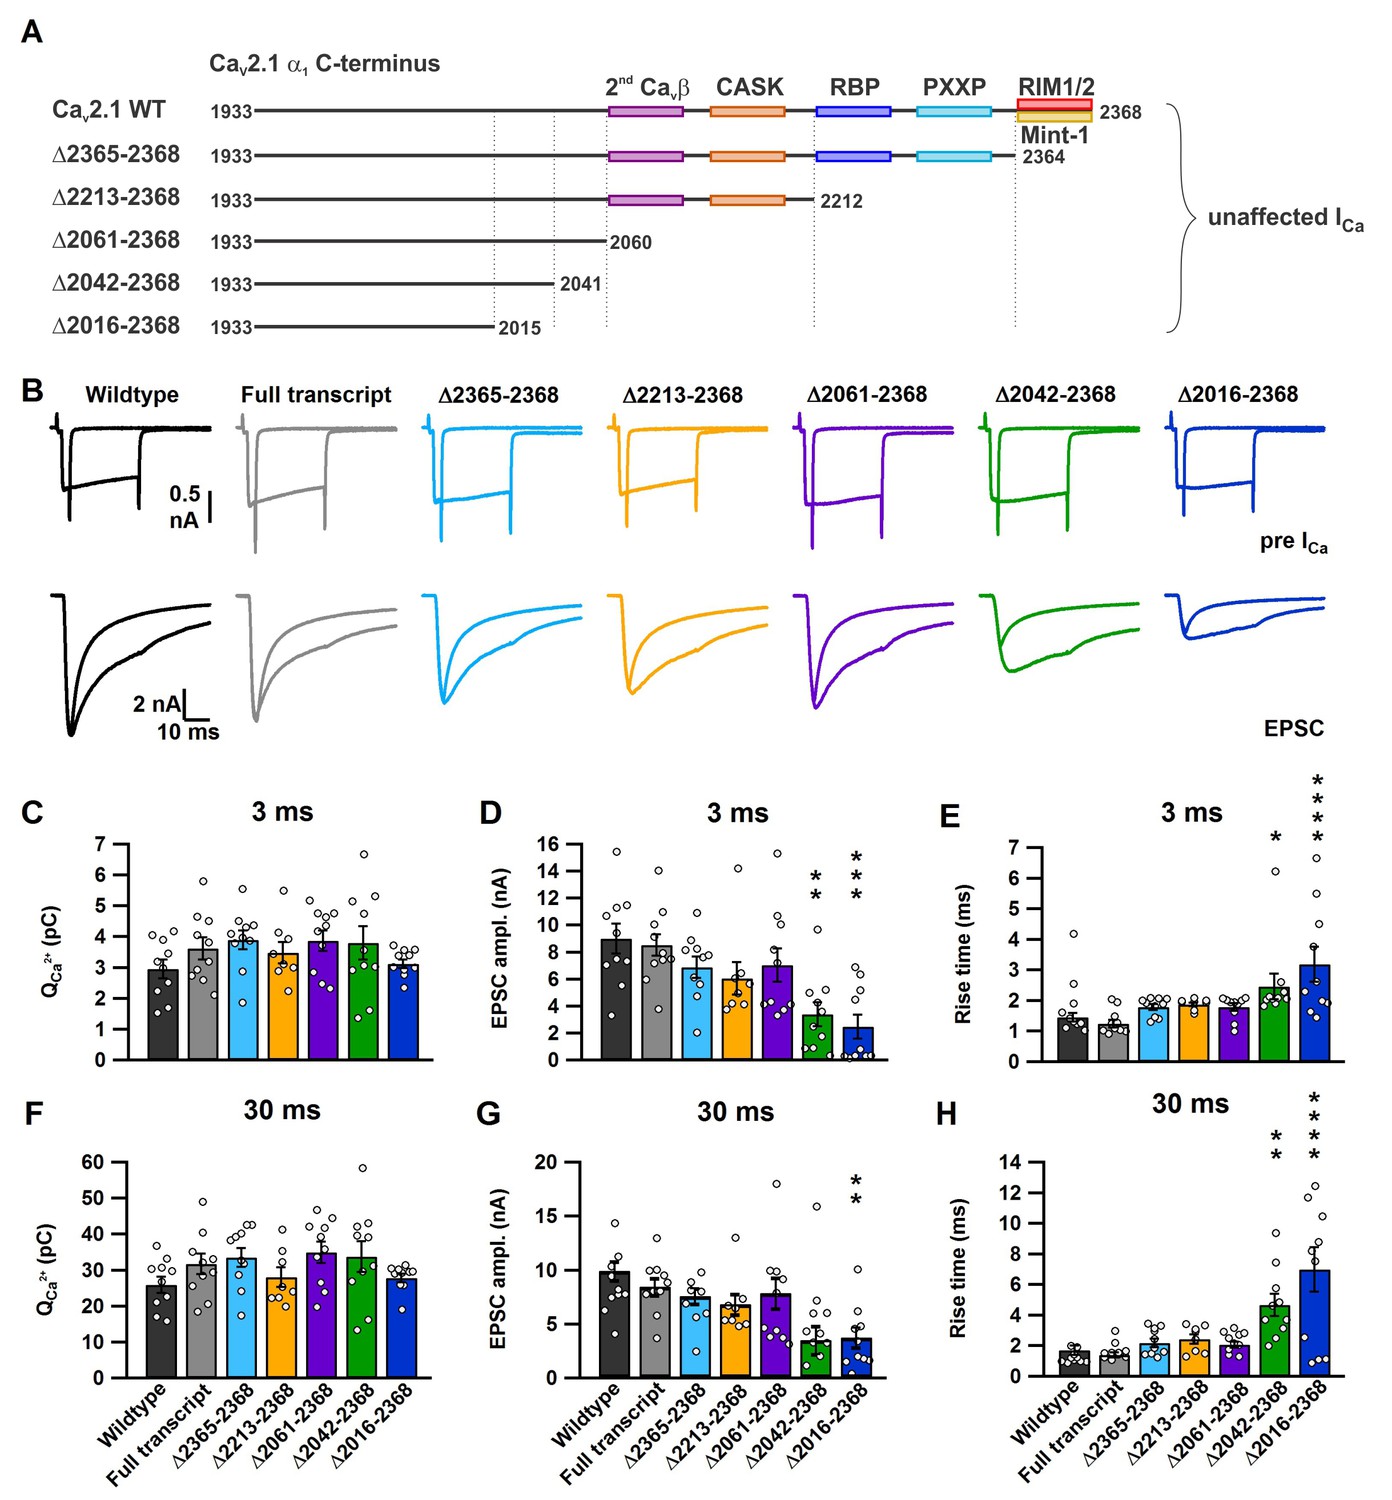
A novel role for a C-terminal region between amino acids 2042 and 2061 that regulates fast release independent of CaV2.1 abundance.
(A) Cartoon depicting truncated regions in our CaV2.1 α1 deletion mutants including the binding sites for CaVβ4, CASK, RBP, PXXP, RIM1/2 and Mint-1 along with the effects of C-terminal truncations on ICa. (B) Averaged traces of RRP and total releasable pool measurements from mice expressing Cre + full transcript CaV2.1 rescue (grey), Δ2365–2368 (cyan), Δ2213–2368 (yellow), Δ2061–2368 (purple), Δ2042–2368 (green) or Δ2016–2368 (blue). ICa (top) and EPSCs (bottom) triggered by 3 ms and 30 ms pulses, plotted on top of each other (n = 10 for each group, except for Δ2212–2368: n = 8). (C–H) Quantification of ICa charge (3 ms: C; and 30 ms: F), max. EPSC amplitudes (3 ms: D; 30 ms: G) and the 10–90% rise of the EPSCs (3 ms: E; 30 ms: H). All data are depicted as mean ± SEM. Detailed values can be derived from Table 2.
Figure 3—figure supplement 1
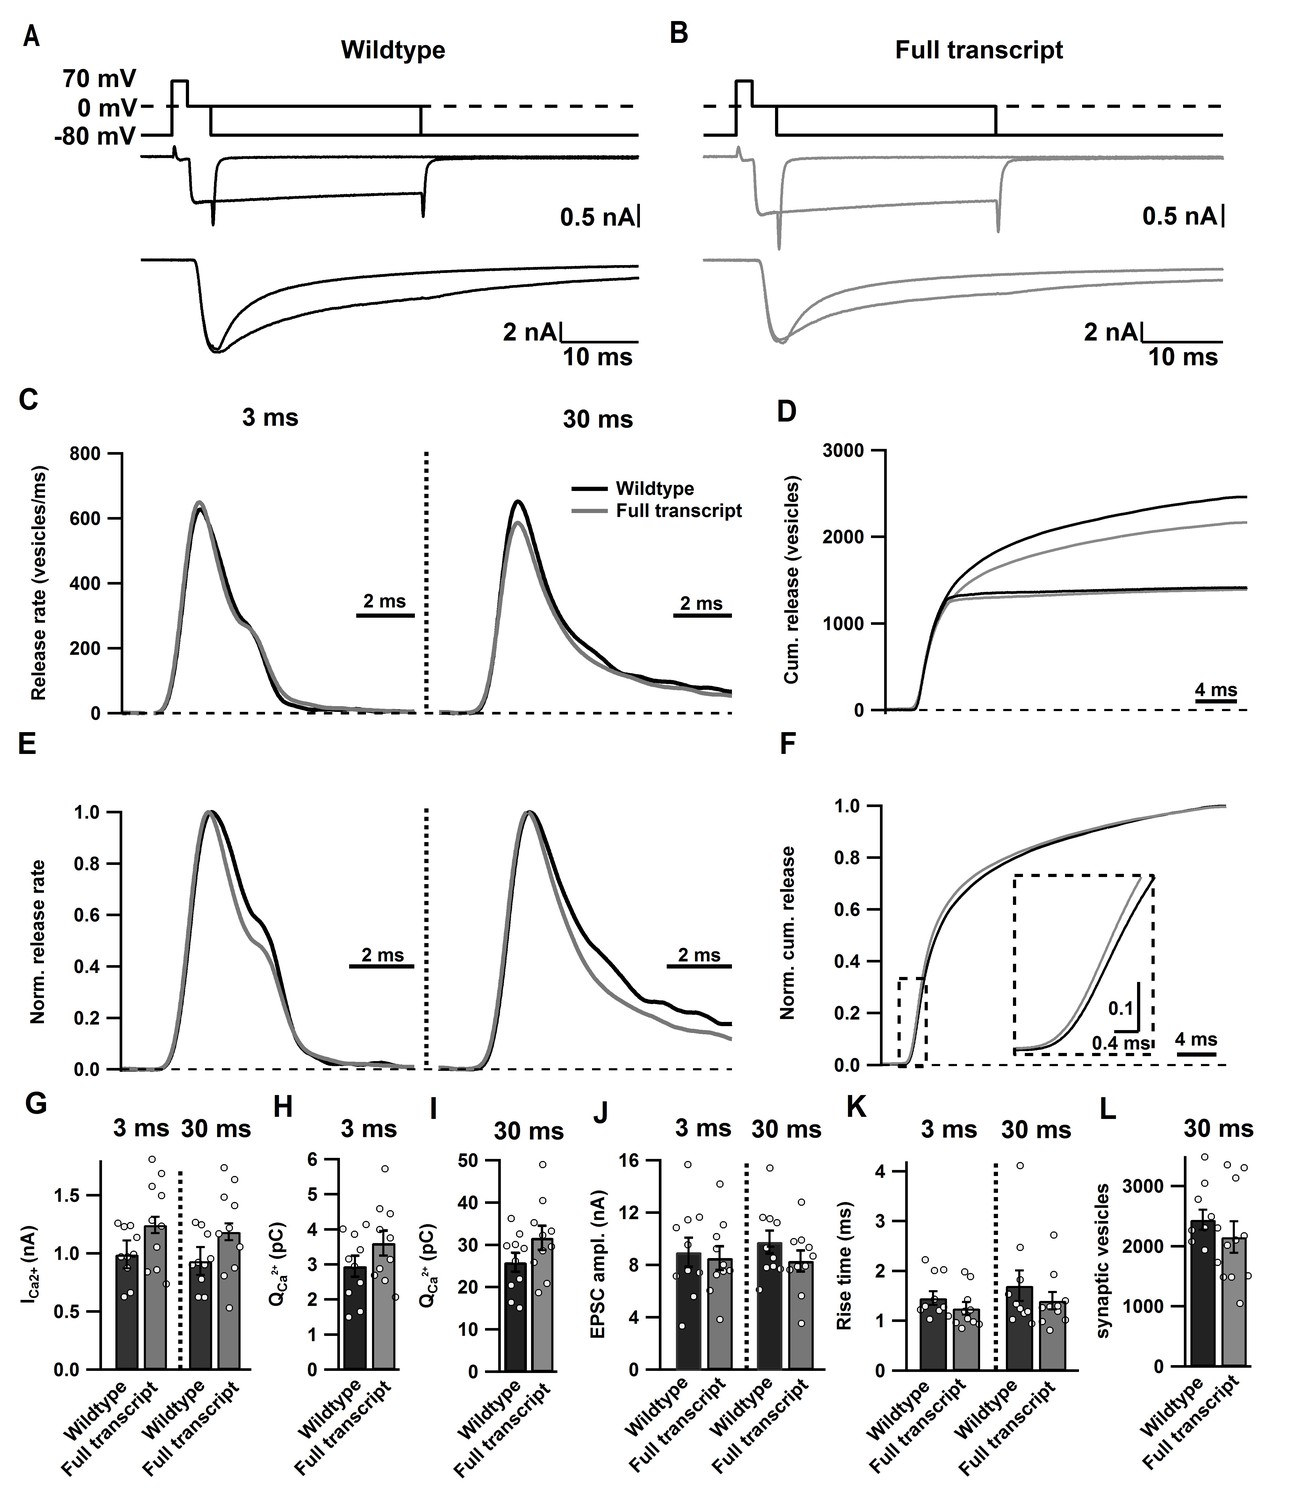
Cav2.1 Full transcript rescue does not affect synaptic transmission at the calyx of Held/MNTB synapse.
(A–B) Averaged traces of SV pool measurements in noninjected control mice (black; a) and mice expressing Cre + Full length rescue construct (grey; B). Top: stimulation protocol driving SV release by depolarization from −80 mV to 70 mV for 2 ms, followed by 0 mV for 3 ms or 30 ms. Below: Traces depicting the resulting presynaptic ICa (middle) with corresponding EPSCs (bottom). (C–D) Summary graphs of SV release rates (c) and the cumulative synaptic vesicle release rates (D) after 3 ms and 30 ms stimulation. (E–F) Summary graphs depicting normalized SV release after 3 ms and 30 ms stimulation (E) and normalized cumulative SV release after 30 ms stimulation (F). (G–L) Quantification of ICa amplitude (G), charge of Ca2+ currents (H I), EPSC amplitude (J), 10–90% rise time of the EPSC (K) after 3 ms and 30 ms stimulation, respectively, as well as the number of SVs released by 30 ms stimulation (L). Data are represented as mean ± SEM.
Figure 4
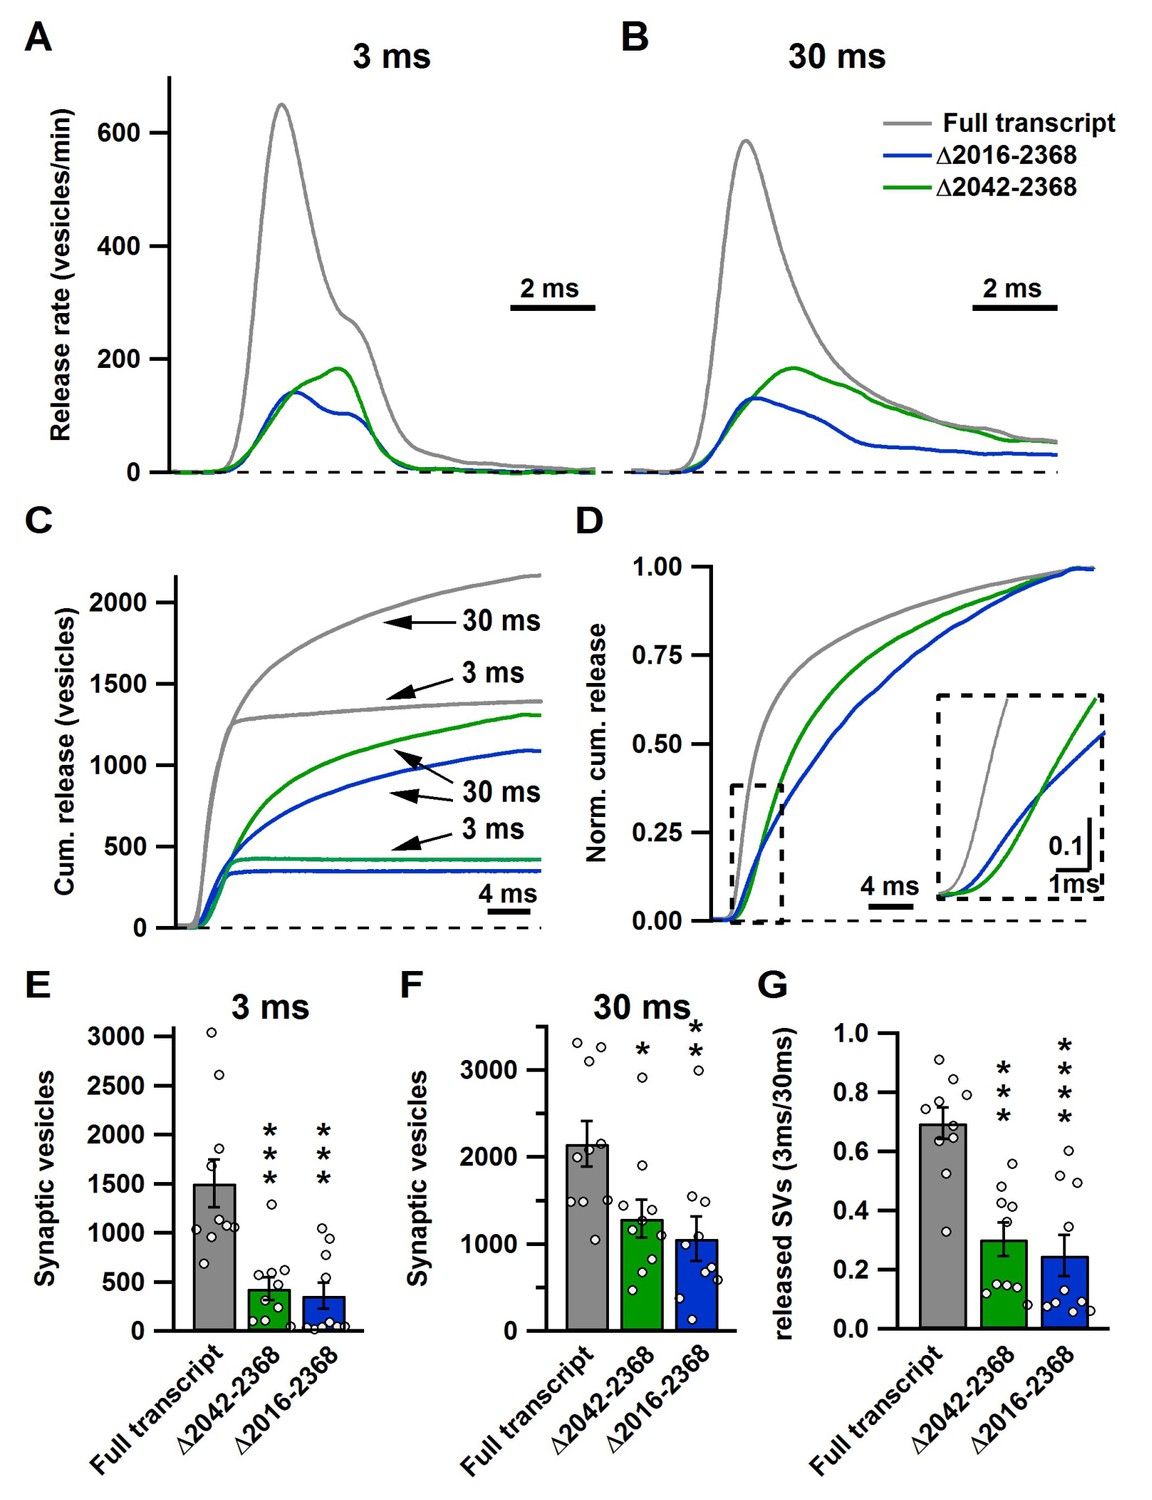
The novel C-terminal region between amino acids 2042 and 2061 regulates size of the fast and total releasable pool and synaptic vesicle release kinetics.
(A–B) Average release rate trace after 3 ms (A) or 30 ms stimulation (B) from calyces expressing either Cre + full transcript rescue (grey), Δ2042–2368 (green) or Δ2016–2368 (blue); n = 10 for each group; (C) Averaged cumulative release after 3 ms and 30 ms stimulation. (D) Normalized cumulative release of the total releasable pool triggered by 30 ms stimulation. Inset presents a magnified view of the area encircled by the dashed box. (E–G) Quantification of SV numbers released by 3 ms (E) and 30 ms (F) as well as the ratio of SVs released by 3 ms and 30 ms stimulation (G). All data are depicted as mean ± SEM.
Figure 5
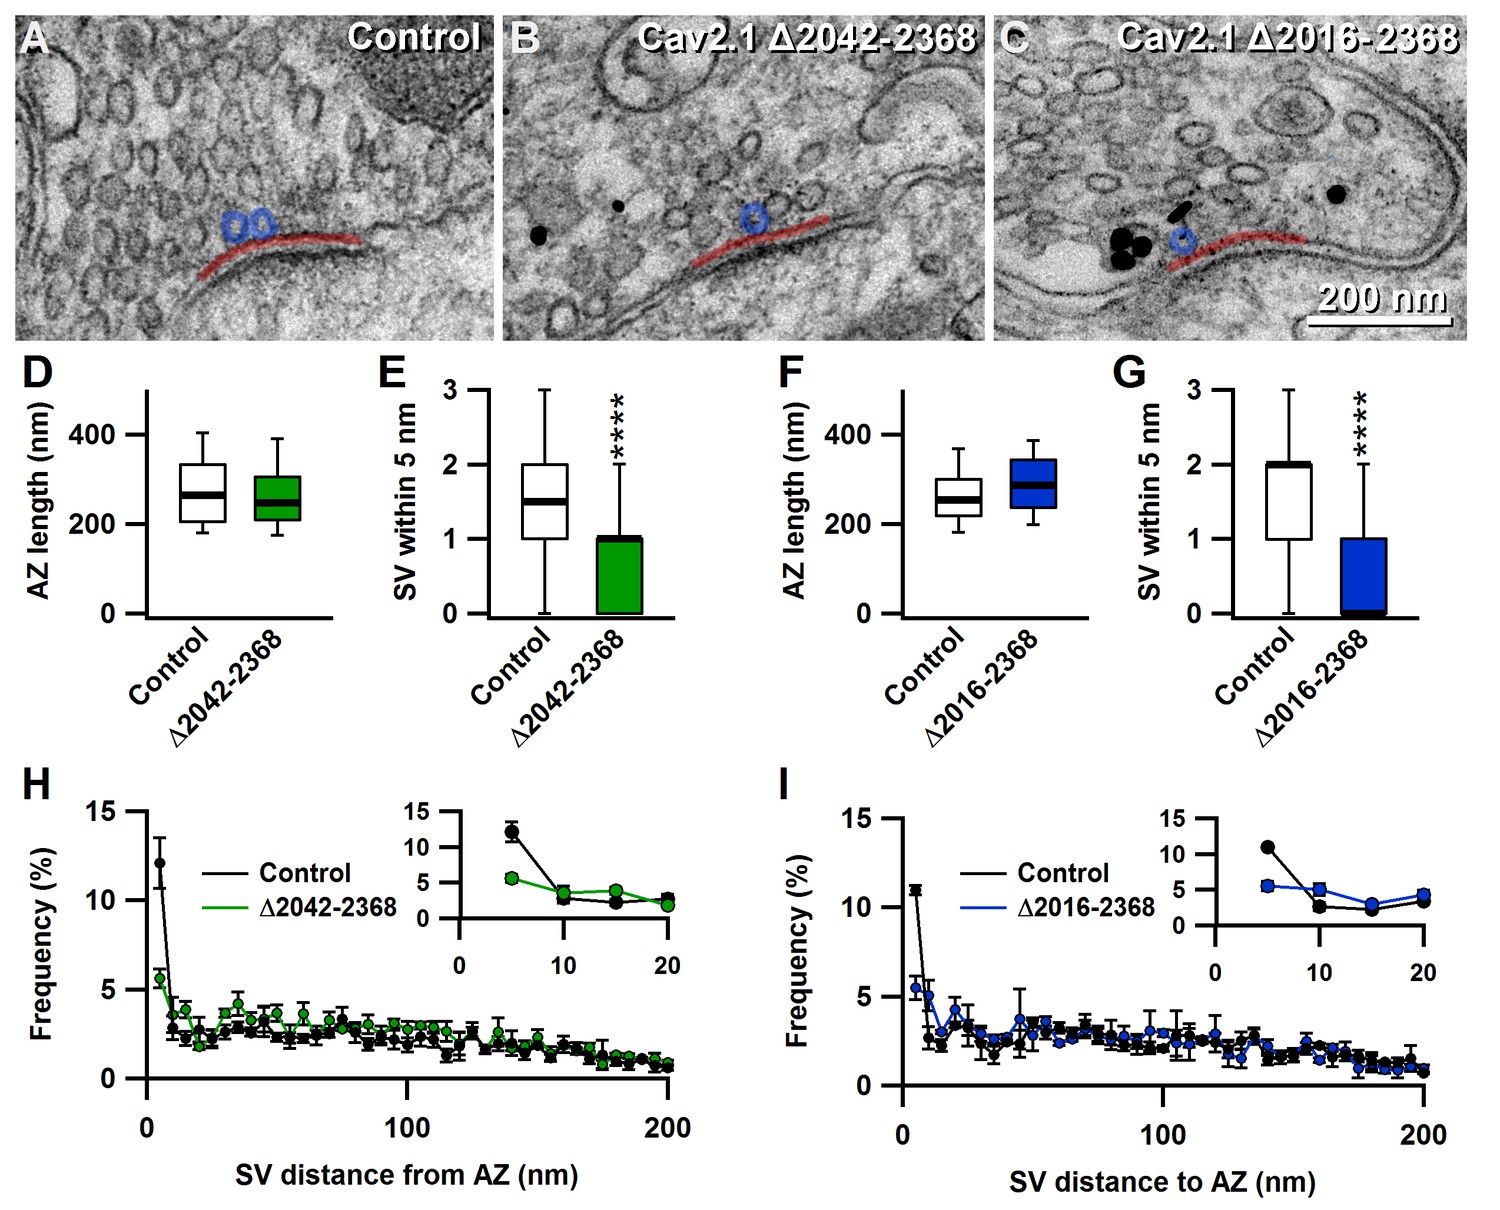
The novel C-terminal region between amino acids 2042 and 2061 regulates the number of docked synaptic vesicles at the active zones.
(A–C) Representative EM images showing AZs from nontransduced calyces (A), and calyces transduced with Δ2042–2368 (B) or Δ2016–2368 (C). Transduced cells were identified by pre-embedded nanogold immunolabelling for eGFP (black dots in B and C). (D–G) Quantification of mean AZ length and docked SVs (within 5 nm of the membrane) of calyces transduced with Δ2042–2368 (n = 120; D E) or Δ2016–2368 (n = 100; F G), compared to AZs from the nontransduced contralateral MNTB, respectively. (H–I) Quantification of the mean distribution of SVs up to 200 nm distant from AZs for calyces expressing Δ2042–2368 (n = 120; H) or Δ2016–2368 (n = 100; I). Insets show SVs in closest proximity to the membrane (up to 20 nm). All data are depicted as mean ± SEM.
Figure 6
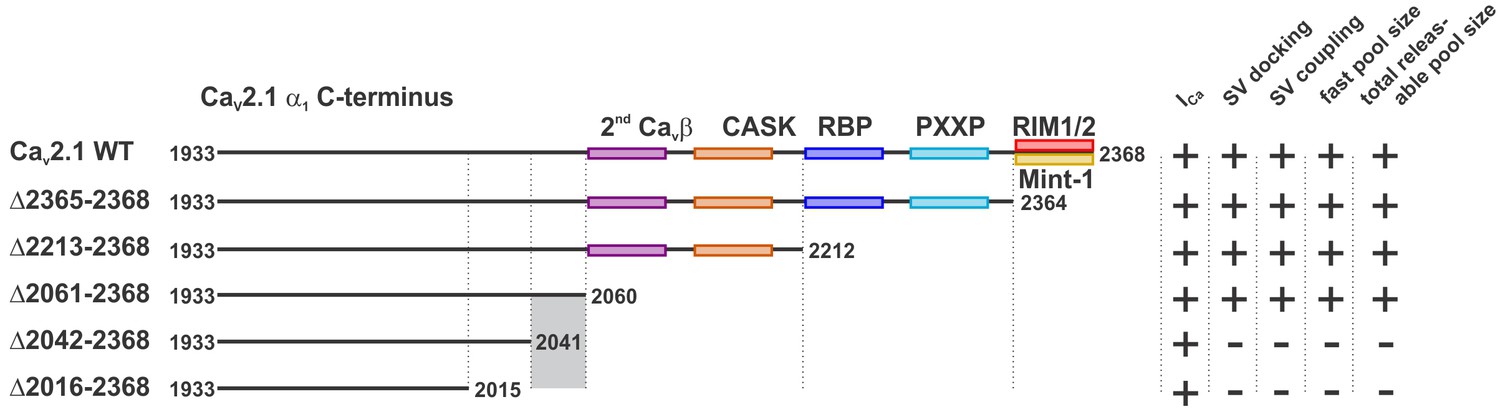
A novel C-terminal region in CaV2.1 α1 subunit regulates SV docking at the active zone and RRP size independent of Ca2+ signaling.
Cartoon depicting truncated regions in our CaV2.1 α1 deletion mutants including the binding sites for CaVβ, CASK, RBP, RBP, RIM1/2, Mint-1 as well as PXXP motifs and the effects of truncations on ICa, SV docking, SV coupling as well as size of the fast and the total releasable synaptic vesicle pools. The critical region 2042–2061 is highlighted in grey.
Tables
Table 1
Electrophysiological parameters of IV relations of Ca2+ currents.
| Parameter | Mean ± SEM (n) | OW-ANOVA Dunnett’s Test |
|---|---|---|
| Max. Ca2+ current amplitude Imax (pA) | ||
| Wild type | 911 ± 63 (12) | p=0.9998 (n.s.) |
| Full transcript | 925 ± 99 (10) | control group |
| CKO | 464 ± 59 (11) | p<0.0001 (****) |
| △2365–2368 | 863 ± 53 (10) | p=0.9513 (n.s.) |
| △2213–2368 | 741 ± 56 (10) | p=0.2261 (n.s.) |
| △2016–2368 | 744 ± 67 (10) | p=0.2383 (n.s.) |
| Membrane capacitance Cslow (pF) | ||
| Wild type | 20.9 ± 1.6 (12) | p=0.5071 (n.s.) |
| Full transcript | 18.2 ± 1.2 (10) | control group |
| CKO | 18.1 ± 1.8 (11) | p>0.9999 (n.s.) |
| △2365–2368 | 16.9 ± 1.1 (10) | p=0.9593 (n.s.) |
| △2213–2368 | 19.8 ± 1.4 (10) | p=0.9933 (n.s.) |
| △2016–2368 | 17.2 ± 1.8 (10) | p=0.8986 (n.s.) |
| IV fit: Half-maximal activation voltage Vm (mV) | ||
| Wild type | −24.6 ± 1.3 (12) | p=0.9986 (n.s.) |
| Full transcript | −25.1 ± 1.3 (10) | control group |
| CKO | −22.3 ± 1.3 (11) | p=0.3604 (n.s.) |
| △2365–2368 | −23.1 ± 1.1 (10) | p=0.6831 (n.s.) |
| △2213–2368 | −23.8 ± 1.5 (10) | p=0.9298 (n.s.) |
| △2016–2368 | −23.3 ± 0.9 (10) | p=0.7924 (n.s.) |
| IV fit: Voltage-dependence of activation km (mV) | ||
| Wild type | 8.0 ± 0.5 (12) | p=0.9524 (n.s.) |
| Full transcript | 7.4 ± 0.5 (10) | control group |
| CKO | 12.6 ± 1.3 (11) | p<0.0001 (****) |
| △2365–2368 | 7.6 ± 0.3 (10) | p=0.9997 (n.s.) |
| △2213–2368 | 8.4 ± 0.4 (10) | p=0.7154 (n.s.) |
| △2016–2368 | 8.2 ± 0.3 (10) | p=0.8481 (n.s.) |
| Boltzmann fit: Half-maximal activation voltage V0.5 (mV) | ||
| Wild type | −10.6 ± 1.4 (12) | p=0.9997 (n.s.) |
| Full transcript | −11 ± 0.1 (10) | control group |
| CKO | −1.7 ± 1.1 (11) | p<0.0001 (****) |
| △2365–2368 | −8.7 ± 1.1 (10) | p=0.6311 (n.s.) |
| △2213–2368 | −8.2 ± 1.8 (10) | p=0.4343 (n.s.) |
| △2016–2368 | −8.9 ± 1.1 (10) | p=0.7130 (n.s.) |
| Boltzmann fit: Voltage-dependence k (mV) | ||
| Wild type | 8.3 ± 0.5 (12) | p=0.9111 (n.s.) |
| Full transcript | 8.9 ± 0.7 (10) | control group |
| CKO | 10.3 ± 0.6 (11) | p=0.3117 (n.s.) |
| △2365–2368 | 7.7 ± 0.7 (10) | p=0.4951 (n.s.) |
| △2213–2368 | 8.9 ± 0.4 (10) | p=0.9947 (n.s.) |
| △2016–2368 | 7.2 ± 0.3 (10) | p=0.1578 (n.s.) |
-
*One-Way ANOVA with a Dunnett’s Test with condition knockout as reference group was performed to calculate statistical significance.
Table 2
Summary of currents from synaptic vesicle pool measurements.
| Parameter | 3 ms (mean ± SEM (n) | OW-ANOVA Dunnett’s Test | 30 ms (mean ± SEM (n) | OW-ANOVA Dunnett’s Test |
|---|---|---|---|---|
| Ca2+ current amplitude (nA) | ||||
| Wild type | 0.99 ± 0.07 (10) | p=0.2671 (n.s.) | 0.93 ± 0.07 (10) | p=0.3557 (n.s.) |
| Full transcript | 1.24 ± 0.12 (10) | control group | 1.18 ± 0.12 (10) | control group |
| △2365–2368 | 1.14 ± 0.84 (10) | p=0.9320 (n.s.) | 1.01 ± 0.12 (10) | p=0.9451 (n.s.) |
| △2213–2368 | 1.04 ± 0.09 (8) | p=0.5366 (n.s.) | 0.9 ± 0.1 (8) | p=0.2766 (n.s.) |
| △2061–2368 | 1.23 ± 0.08 (10) | p=0.9999 (n.s.) | 1.13 ± 0.08 (10) | p=0.9993 (n.s.) |
| △2042–2368 | 1.13 ± 0.15 (10) | p=0.9121 (n.s.) | 1.03 ± 0.13 (10) | p=0.8410 (n.s.) |
| △2016–2368 | 0.93 ± 0.38 (10) | p=0.1091 (n.s.) | 0.86 ± 0.46 (10) | p=0.1175 (n.s.) |
| Ca2+ influx charge (pC) | ||||
| Wild type | 2.95 ± 0.3 (10) | p=0.5713 (n.s.) | 25.93 ± 2.22 (10) | p=0.4932 (n.s.) |
| Full transcript | 3.62 ± 0.36 (10) | control group | 31.71 ± 2.87 (10) | control group |
| △2365–2368 | 3.89 ± 0.31 (10) | p=0.9838 (n.s.) | 33.52 ± 2.65 (10) | p=0.9943 (n.s.) |
| △2213–2368 | 3.48 ± 0.35 (8) | p=0.9996 (n.s.) | 28.09 ± 2.7 (8) | p=0.8924 (n.s.) |
| △2061–2368 | 3.87 ± 0.33 (10) | p=0.9893 (n.s.) | 34.94 ± 2.93 (10) | p=0.9132 (n.s.) |
| △2042–2368 | 3.8 ± 0.54 (10) | p=0.9977 (n.s.) | 33.71 ± 4.22 (10) | p=0.9910 (n.s.) |
| △2016–2368 | 3.12 ± 0.14 (10) | p=0.8063 (n.s.) | 27.81 ± 1.14 (10) | p=0.8255 (n.s.) |
| EPSC amplitude (nA) | ||||
| Wild type | 8.99 ± 1.12 (10) | p=0.9995 (n.s.) | 9.77 ± 0.87 (10) | p=0.8167 (n.s.) |
| Full transcript | 8.54 ± 0.9 (10) | control group | 8.31 ± 0.79 (10) | control group |
| △2365–2368 | 6.88 ± 0.78 (10) | p=0.7024 (n.s.) | 7.45 ± 0.73 (10) | p=0.9789 (n.s.) |
| △2213–2368 | 6.05 ± 1.2 (8) | p=0.3672 (n.s.) | 6.7 ± 0.94 (8) | p=0.7880 (n.s.) |
| △2061–2368 | 7.05 ± 1.25 (10) | p=0.7836 (n.s.) | 7.72 ± 1.44 (10) | p=0.9963 (n.s.) |
| △2042–2368 | 3.38 ± 0.89 (10) | p=0.0028 (**) | 5.28 ± 1.31 (10) | p=0.1689 (n.s.) |
| △2016–2368 | 2.49 ± 0.89 (10) | p=0.0004 (***) | 3.61 ± 0.91 (10) | p=0.0098 (**) |
| EPSC 10–90% rise time (ms) | ||||
| Wild type | 1.46 ± 0.14 (10) | p=0.9908 (n.s.) | 1.71 ± 0.31 (10) | p=0.9995 (n.s.) |
| Full transcript | 1.25 ± 0.13 (10) | control group | 1.41 ± 0.18 (10) | control group |
| △2365–2368 | 1.79 ± 0.09 (10) | p=0.5934 (n.s.) | 2.18 ± 0.27 (10) | p=0.9097 (n.s.) |
| △2213–2368 | 1.88 ± 0.06 (8) | p=0.4956 (n.s.) | 2.43 ± 0.3 (8) | p=0.7964 (n.s.) |
| △2061–2368 | 1.8 ± 0.12 (10) | p=0.5792 (n.s.) | 2.07 ± 0.21 (10) | p=0.9529 (n.s.) |
| △2042–2368 | 2.46 ± 0.42 (10) | p=0.0200 (*) | 4.67 ± 0.72 (10) | p=0.0046 (**) |
| △2016–2368 | 3.2 ± 0.57 (10) | p<0.0001 (****) | 6.99 ± 1.45 (10) | p<0.0001 (****) |
| Synaptic delay (ms) | ||||
| Wild type | 1.82 ± 0.13 (10) | p=0.9569 (n.s.) | 1.92 ± 0.2 (10) | p=0.9977 (n.s.) |
| Full transcript | 1.7 ± 0.12 (10) | control group | 1.73 ± 0.11 (10) | control group |
| △2365–2368 | 2.11 ± 0.1 (10) | p=0.1170 (n.s.) | 2.22 ± 0.16 (10) | p=0.8464 (n.s.) |
| △2213–2368 | 2.19 ± 0.1 (8) | p=0.0615 (n.s.) | 2.33 ± 0.19 (8) | p=0.7507 (n.s.) |
| △2061–2368 | 2.14 ± 0.14 (10) | p=0.0748 (n.s.) | 2.28 ± 0.15 (10) | p=0.7714 (n.s.) |
| △2042–2368 | 2.8 ± 0.07 (10) | p<0.0001 (****) | 3.68 ± 0.3 (10) | p=0.0019 (**) |
| △2016–2368 | 2.55 ± 0.2 (10) | p<0.0001 (****) | 4.78 ± 0.83 (10) | p<0.0001 (****) |
-
*One-Way ANOVA with a Dunnett’s Test with full transcript as a control group was performed to calculate statistical significance.
Table 3
Summary of 3ms /30ms EPSC ratios.
| EPSC ratio (3 ms/30 ms) | ||
| Wild type | 0.89 ± 0.05 (10) | p=0.5456 (n.s.) |
| Full transcript | 1.03 ± 0.03 (10) | control group |
| △2365–2368 | 0.92 ± 0.04 (10) | p=0.6887 (n.s.) |
| △2213–2368 | 0.87 ± 0.05 (8) | p=0.4631 (n.s.) |
| △2061–2368 | 0.93 ± 0.04 (10) | p=0.7858 (n.s.) |
| △2042–2368 | 0.61 ± 0.09 (10) | p=0.0004 (***) |
| △2016–2368 | 0.50 ± 0.12 (10) | p<0.0001 (****) |
Download links
A two-part list of links to download the article, or parts of the article, in various formats.
Downloads (link to download the article as PDF)
Open citations (links to open the citations from this article in various online reference manager services)
Cite this article (links to download the citations from this article in formats compatible with various reference manager tools)
A novel region in the CaV2.1 α1 subunit C-terminus regulates fast synaptic vesicle fusion and vesicle docking at the mammalian presynaptic active zone
eLife 6:e28412.
https://doi.org/10.7554/eLife.28412


