Direct measurement of conformational strain energy in protofilaments curling outward from disassembling microtubule tips
- University of Washington, United States
- UT Southwestern Medical Center, United States
Figures
Figure 1
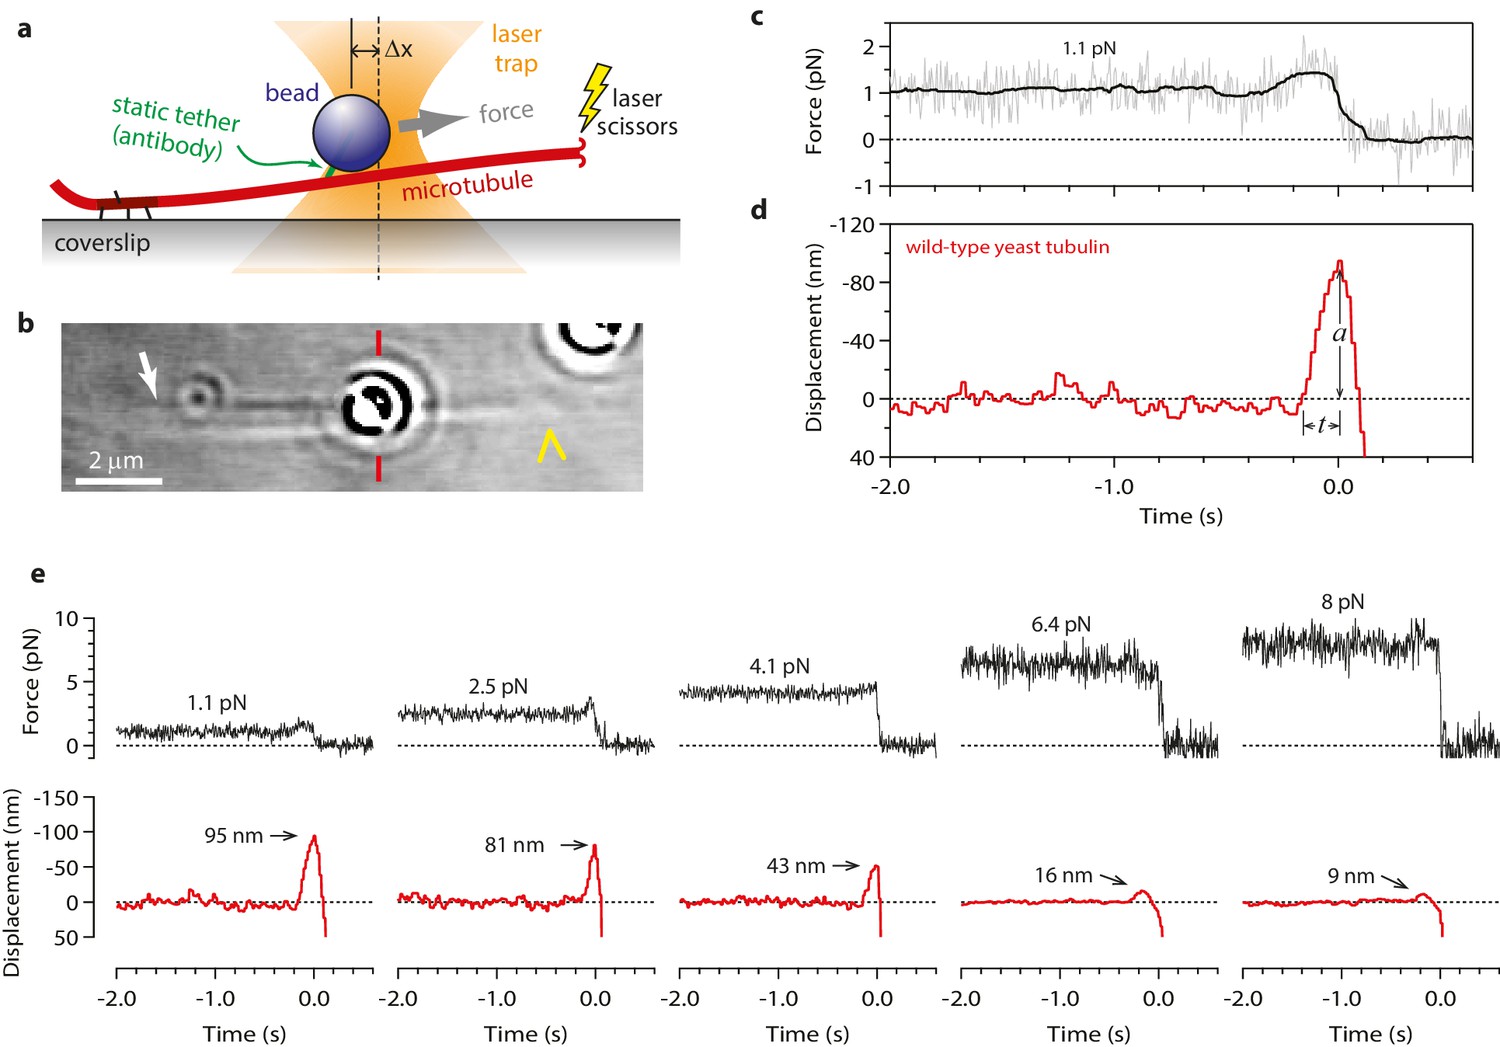
Measuring the tubulin conformational wave with a feedback-controlled laser trap.
(a) A bead is tethered to the side of a microtubule via a single antibody bound to the C-terminal tail of β-tubulin and placed under tension using the laser trap. The trap is feedback-controlled to keep a fixed separation from the bead (Δx), thereby maintaining a constant level of tension. Microtubule disassembly is induced by cutting the tip with a second laser. (b) Video-enhanced differential interference contrast (VE-DIC) image of a 900 nm bead tethered to a single microtubule under laser trap tension (from Video 1). Approximate locations for the coverslip-anchored portion of the microtubule (white arrow), the laser trap center (red dashes), and the plus end tip (yellow chevron) are indicated. (c, d) Example record showing trap force (c) and bead displacement (d) versus time. Grey trace shows raw bead-trap separation after converting to force by multiplying by the trap stiffness. Black trace shows same data after smoothing with a 250 ms median filter. When the disassembling tip arrives at the bead, the bead initially moves against the trapping force and then releases as the microtubule disassembles out from underneath it. The pulse amplitude, a, and risetime, t, are indicated. (e) Gallery of additional example records, measured at the indicated levels of tension. Data in (c - e) were collected using 900 nm beads.
Figure 2 with 1 supplement

Tubulin waves generate large forces.
(a, b) Mean pulse risetime versus force (a) and distributions of risetime at indicated forces (b) for wild-type microtubules. The mean risetime across all forces is depicted by the dashed line in (a). (c, d) Mean pulse amplitude versus force (c) and distributions of amplitude at indicated forces (d) for pulses generated by wild-type yeast microtubules. Total pulse energy, W, is estimated from the area under the line-fit in (c), shaded grey. Error bars show standard errors (for N = 6 to 87 amplitudes; N = 3 to 78 risetimes). All data in (a - d) were collected using 900 nm beads.
Figure 2—figure supplement 1
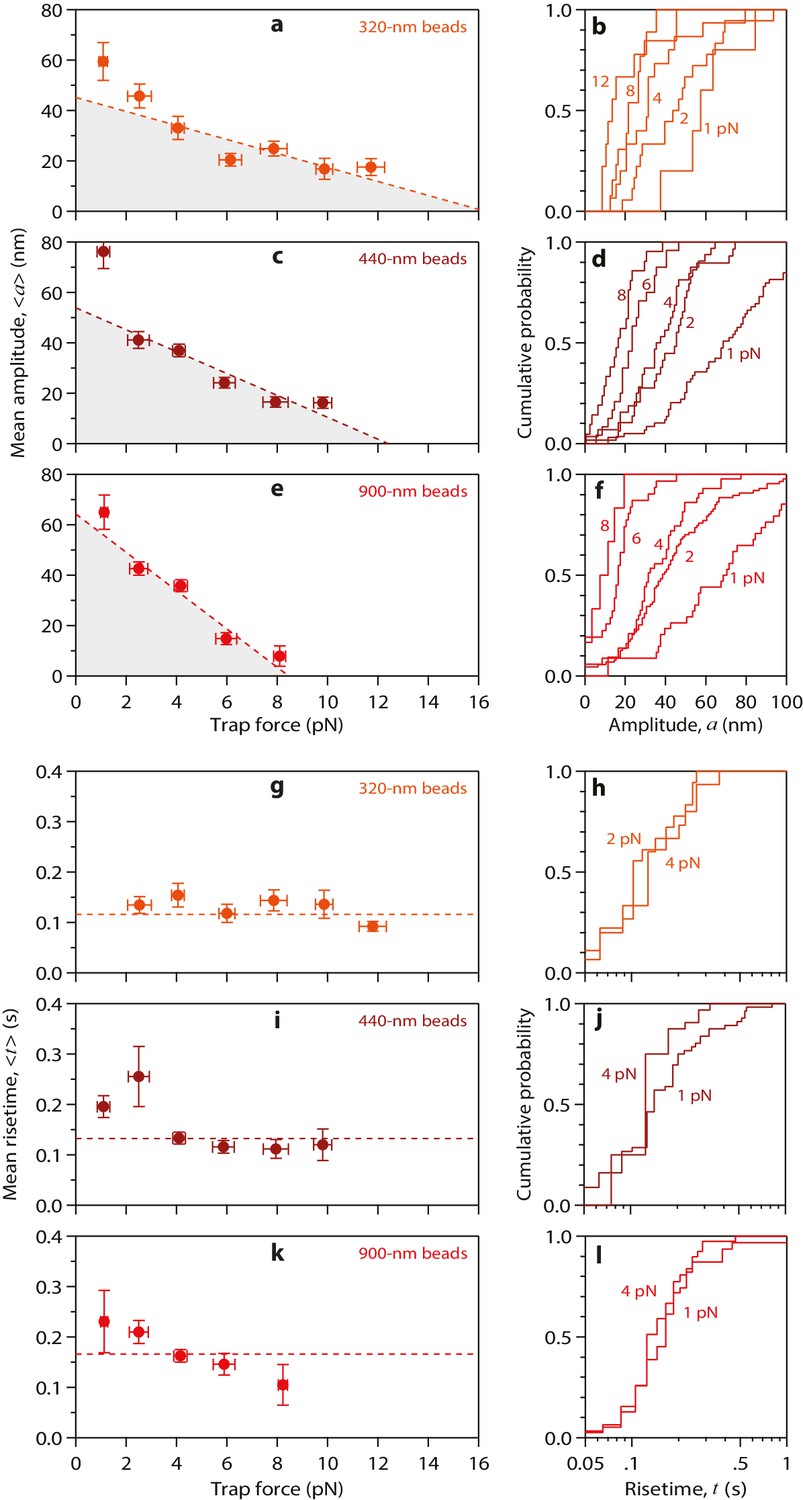
Properties of wild-type tubulin waves measured using different bead sizes.
(a – f) Mean amplitudes versus force (a, c, e) and distributions of amplitude at indicated forces (b, d, f) for pulses generated by wild-type yeast microtubules, measured with 320 nm beads (a, b), with 440 nm beads (c, d), and with 900 nm beads (e, f). (g – l) Mean pulse risetimes versus force (g, i, k) and distributions of risetime at indicated forces (h, j, l) for wild-type microtubules measured with 320 nm beads (g, h), with 440 nm beads (i, j), and with 900 nm beads (k, l). Dashed lines in (a, c, and e) show fits used to estimate the stall forces, unloaded amplitudes, and total pulse energies (shaded gray areas), which are plotted against bead size in Figure 4a–c. Horizontal dashed lines in (g, i, and k) show mean risetimes across all forces, which are plotted against bead size in Figure 4d and e. Error bars show standard errors (for N = 5 to 87 amplitudes; N = 3 to 78 risetimes).
Figure 3 with 1 supplement
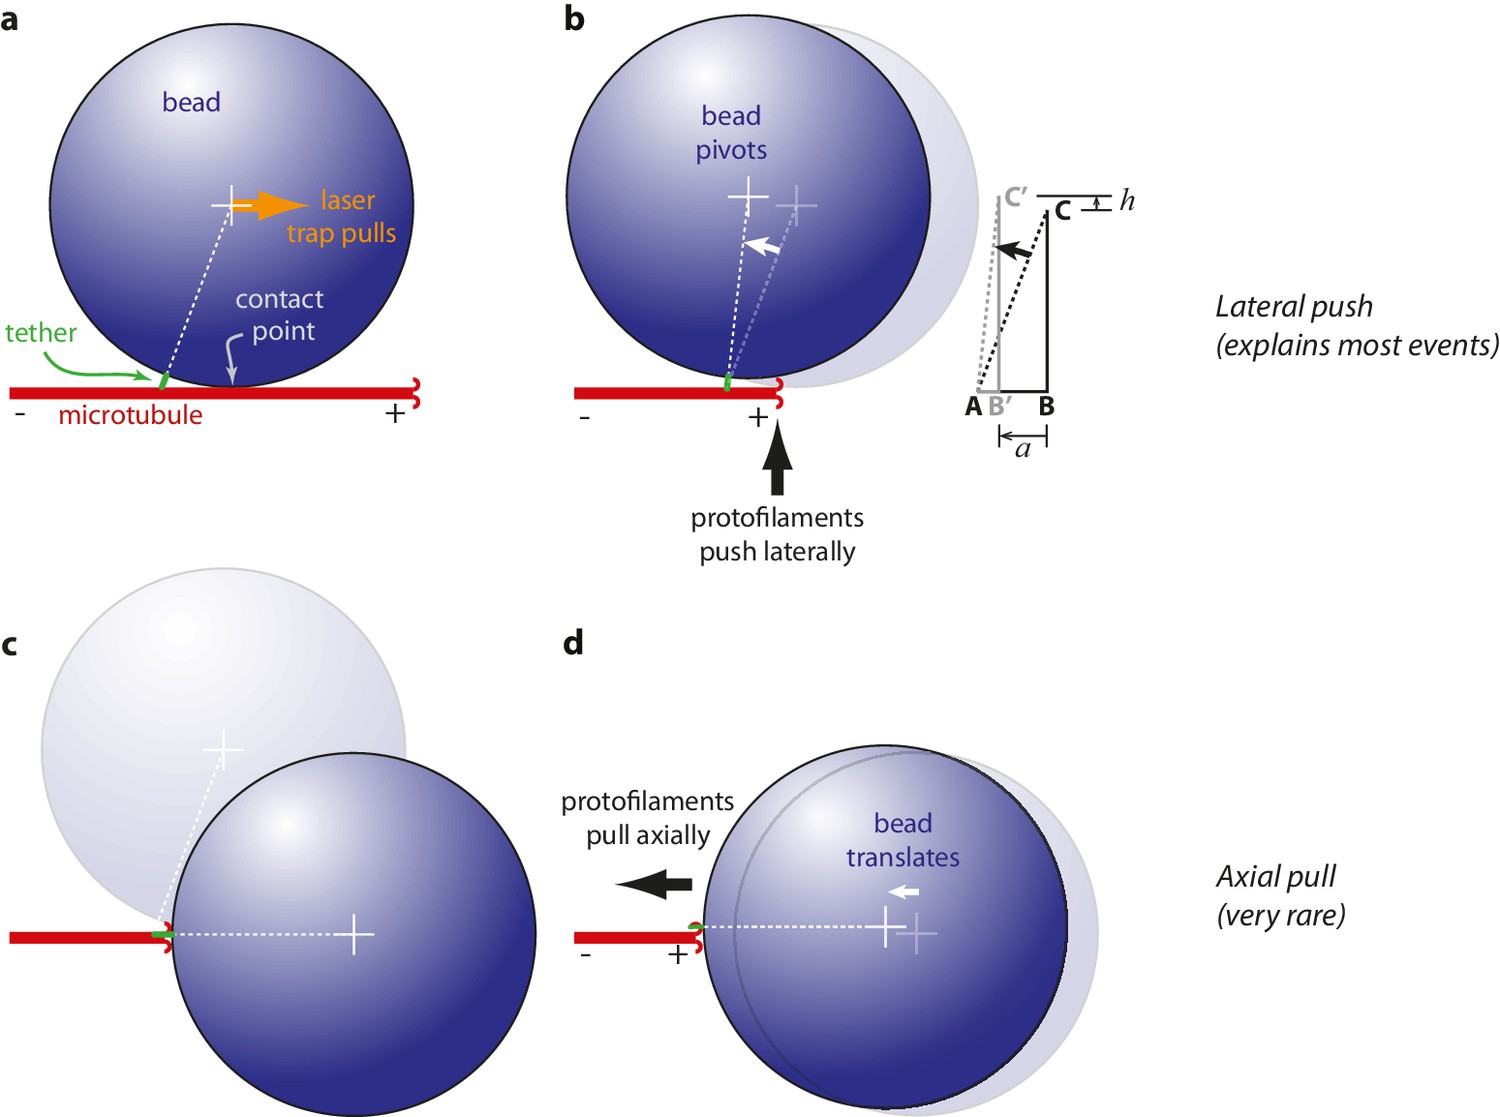
Proposed mechanisms underlying conformational wave-driven bead movement in the assay.
(a) Initially, when a bead is placed under tension it rests against the microtubule wall at a secondary contact point. (b) In the lateral push scenario, the curling protofilaments push laterally against the secondary contact point, causing the bead to pivot about the base of the tether. Lateral deflections from the protofilaments, h, produce larger axial displacements of the bead, a. If A is the tether point and B is the point of bead-microtubule contact and C is the bead center, then ABC defines a right triangle and the amount of leverage is given by the ratio of sides BC/AB. The predicted leverage for 900 nm diameter beads attached via 36 nm tethers is a·h−1=2.4. (c) In the axial pull scenario, the microtubule first disassembles past the secondary contact point, allowing the bead to rotate under laser trap tension into an end-on configuration relative to the microtubule tip. (d) Then the working stroke occurs when curling protofilaments encounter the tether and pull axially on the bead.
Figure 3—figure supplement 1
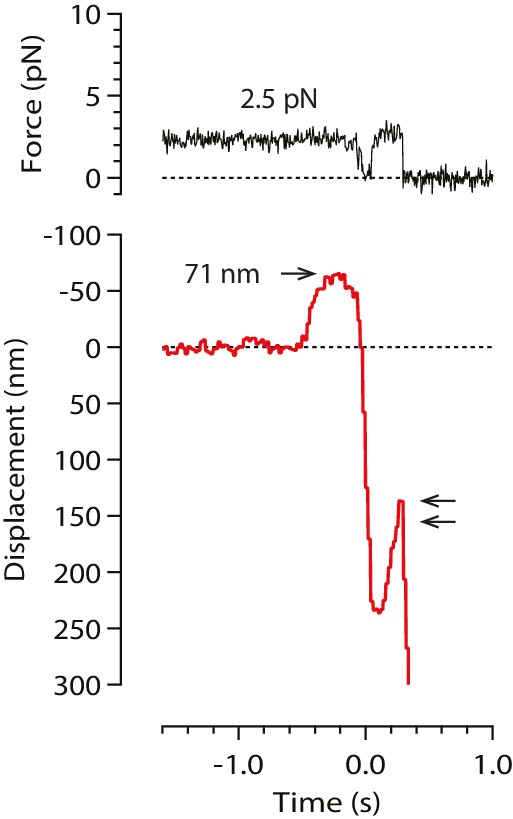
A rare example record in which the initial pulse, from a stable baseline, was followed by bead relaxation toward the trap center and then by a second pulse (double arrow).
Such secondary pulses were seen in only 2% of all recorded events (18 of 760). These rare secondary pulses might be generated by axial pulling. However, the lack of any relaxation before the primary pulses indicates that these were not preceded by bead rotation into an end-on configuration, and thus were not generated by axial pulling.
Figure 4 with 1 supplement
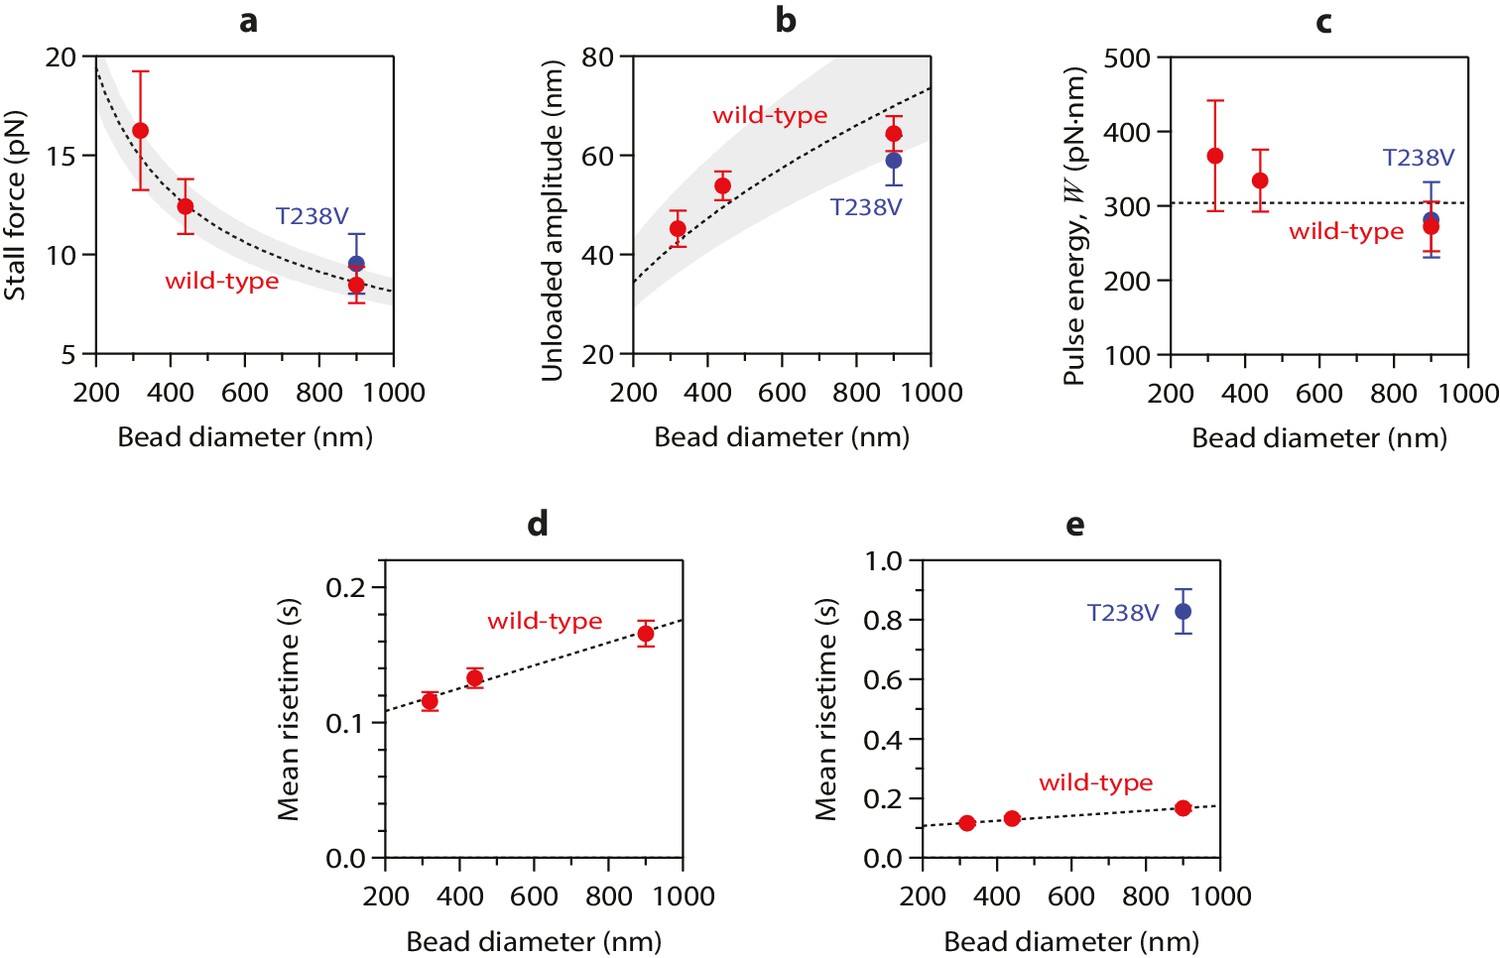
Stall forces and pulse amplitudes vary with bead size, but pulse energy is invariant.
(a) With increasing bead size, the leverage increases and therefore the trapping force required to completely suppress the pulses (i.e., the ‘stall force’) decreases. (b) Unloaded pulse amplitudes (i.e., amplitudes extrapolated to zero tension) increase with bead size, because the amplification ratio increases (see Figure 3b). Dotted curves in (a) and (b) show predictions assuming a tether length of 36 nm and a curl height, h = 20 nm. Gray shaded regions show predicted ranges for tether lengths ranging from 30 to 42 nm. (c) The total pulse energy, W, is independent of bead size. Horizontal dotted line in (c) shows global estimate of pulse energy, W = 304 ± 24 pN·nm, from a weighted fit of the wild-type data across all bead sizes. (d, e) Mean pulse risetimes as a function of bead size. Wild-type data in (d) are replotted in (e) with an expanded scale for comparison to the mutant, T238V.
Figure 4—figure supplement 1
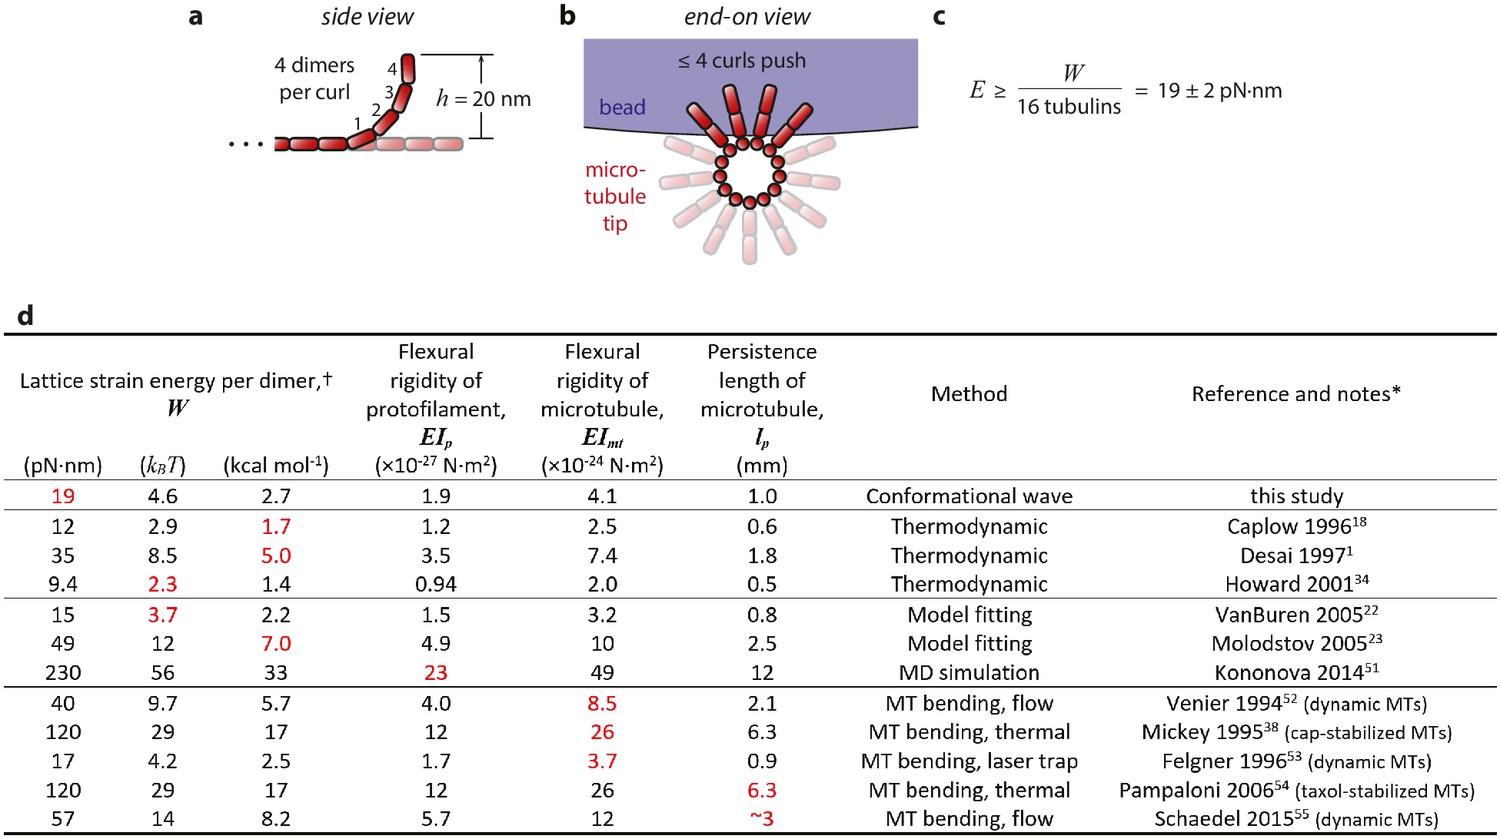
Estimation of strain energy per tubulin.
(a) Given the 23° curvature and 8 nm length of a tubulin dimer, a curl height of h = 20 nm implies that the curled segments are ~4 dimers in length. (b) A maximum of ~4 curls could push simultaneously against the bead. (c) Thus, the mechanical work output, W = 304 ± 24 pN·nm (Figure 4c), may derive from outward curling of as many as 16 tubulin dimers and the wave carries at least 19 pN·nm of energy per dimer. (d) Table of estimates of the mechanical strain energy stored after GTP hydrolysis in the microtubule lattice. Our estimate is based on the total mechanical work output of curling protofilaments, measured directly in the conformational wave assay, as explained above and in the text. The previously published estimates were inferred from thermodynamic considerations, (Desai and Mitchison, 1997; Caplow and Shanks, 1996; Howard, 2001) from fitting of computational models to microtubule dynamic rate data, (VanBuren et al., 2005; Molodtsov et al., 2005) from molecular dynamics (MD) simulations, (Kononova et al., 2014) and from measurements of the flexural rigidity of whole microtubules (Mickey and Howard, 1995; Venier et al., 1994; Felgner et al., 1996; Pampaloni et al., 2006; Schaedel et al., 2015). * Values shown in red were taken directly from the indicated references and used to calculate the values shown in black using the following relations (which have been previously explained in detail; see Mickey and Howard, 1995 and VanBuren et al. 2005): Lattice strain W and protofilament flexural rigidity EIp were related by W = ½· EIp·d·R−2 where d = 8 nm represents dimer length and R = 20 nm represents the radius of curvature for a relaxed protofilament. (R = 20 nm corresponds to 23° per dimer; Mandelkow et al., 1991). Microtubule and protofilament flexural rigidity, EImt and EIp respectively, were related by a factor of 2140, the ratio of their second moments (Mickey and Howard, 1995). Microtubule persistence length was defined as EImt divided by thermal energy, kBT = 4.1 pN·nm. † Estimates of stored lattice strain per tubulin dimer can be compared to the total free energy available from hydrolysis of GTP, which under typical cellular conditions is ~87 pN·nm (=21 kBT=13 kcal·mol−1; Desai and Mitchison, 1997).
Figure 5 with 1 supplement
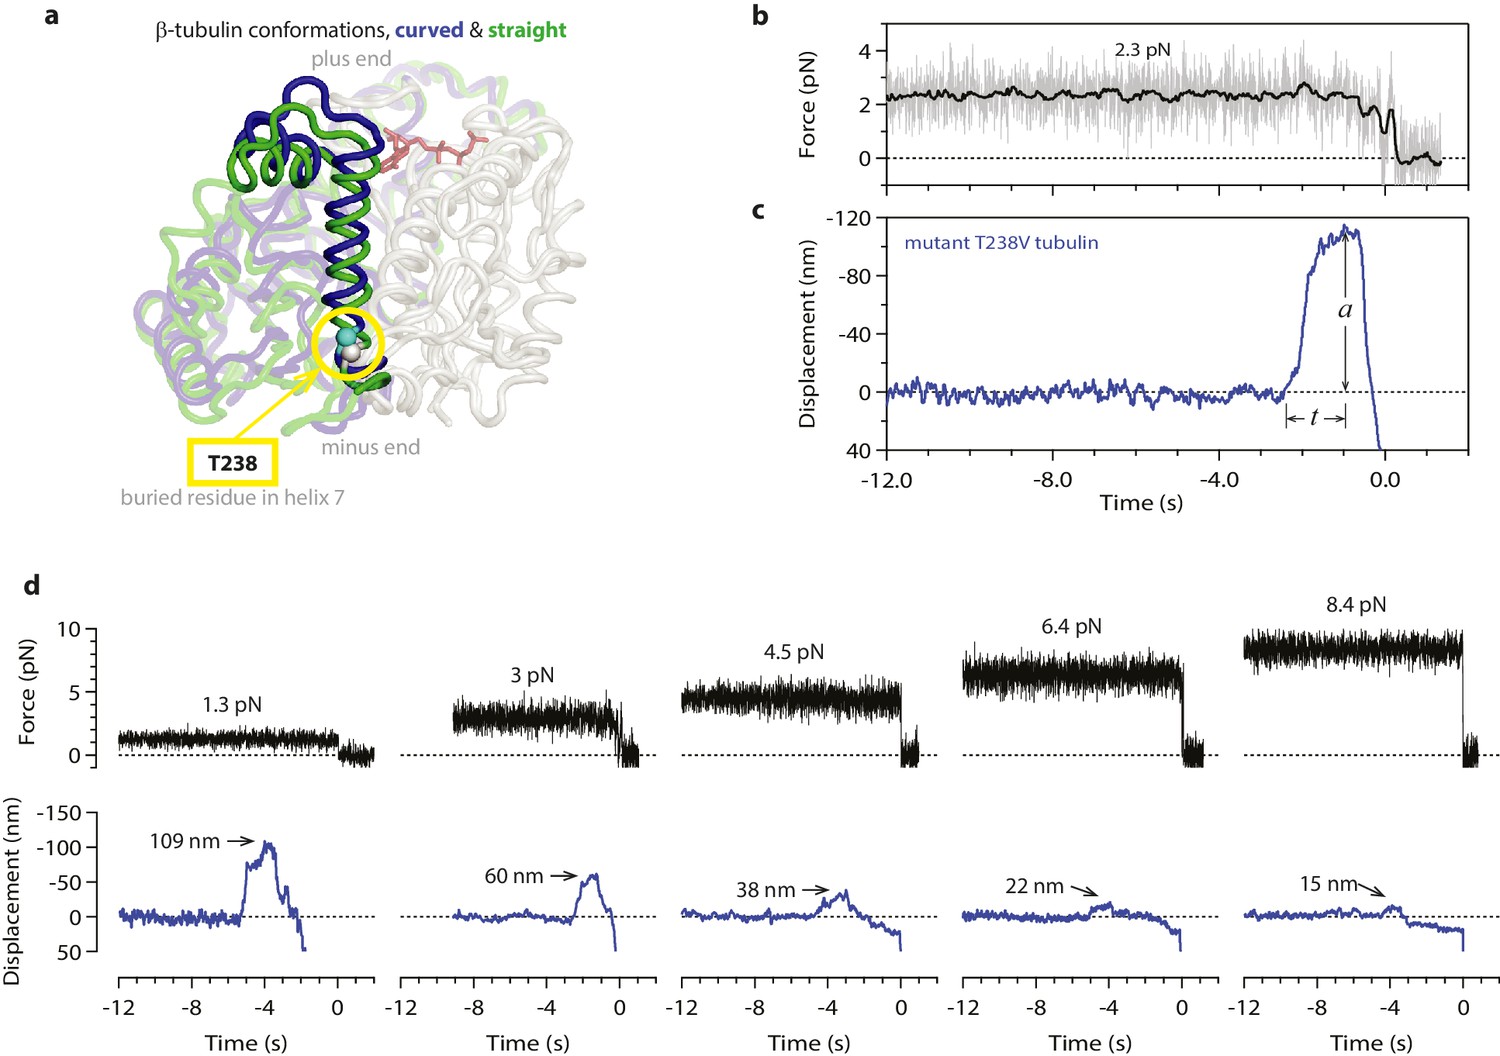
Hyperstable mutant microtubules produce slower pulses.
(a) Superposition of polymerized (’straight’, green) and unpolymerized (’curved’, blue) conformations of β-tubulin. Residue T238 is inaccessible to solvent and located on a helix (H7) that undergoes piston-like movement between the straight and curved conformations (which are represented by PDB entries 3JAT and 1SA0, respectively). GDP nucleotide is shown in red. (b, c) Example record showing trap force (b) and bead displacement (c) versus time for a mutant T238V microtubule. Grey trace shows raw bead-trap separation after converting to force by multiplying by the trap stiffness. Black trace shows same data after smoothing with a 250 ms median filter. The pulse amplitude, a, and risetime, t, are indicated. (d) Gallery of additional example records for mutant T238V microtubules, measured at the indicated levels of tension. Data in (b - d) were collected using 900 nm beads. Note the different time scales here in comparison to Figure 1c–e.
Figure 5—figure supplement 1
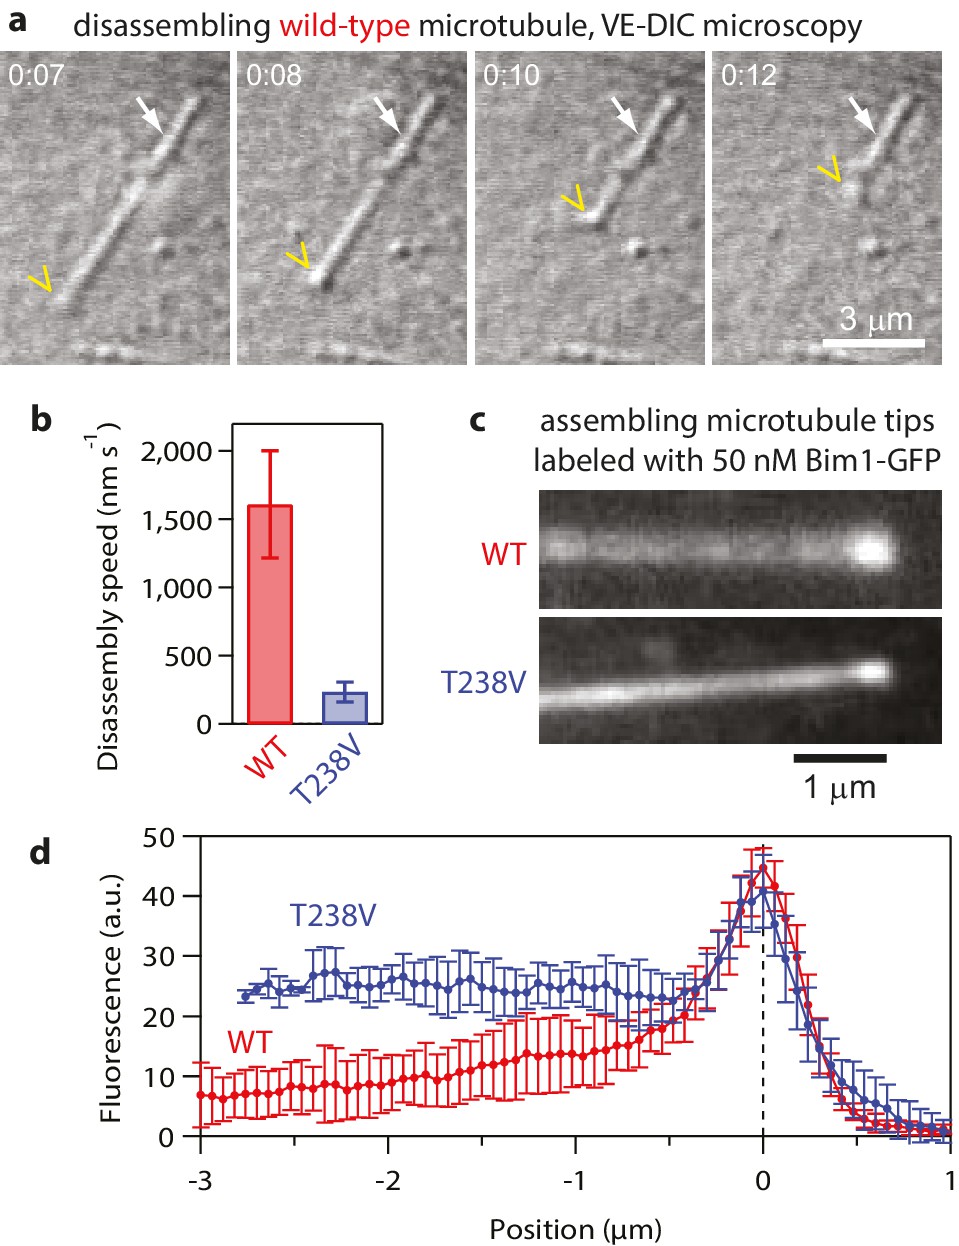
Hyperstable mutant T238V tubulin disassembles more slowly than wild-type.
(a) Selected images from a movie of an individual yeast microtubule dissembling in vitro, recorded by video-enhanced differential interference contrast (VE-DIC) microscopy. The white arrow marks the coverslip-anchored seed. The yellow chevron marks the disassembling plus end. (b) Mean disassembly speeds measured in vitro for wild-type and mutant T238V microtubules (by VE-DIC). Error bars show standard deviations (for N = 16 to 24 microtubules). (c) Fluorescence images of individual wild-type and mutant T238V microtubules assembling in the presence of 50 nM Bim-GFP, which binds preferentially near the growing ends but also decorates the body of the microtubules at lower intensity. (d) Average Bim1-GFP fluorescence intensity versus distance from tip (for N = 9 microtubules of each type).
Figure 6
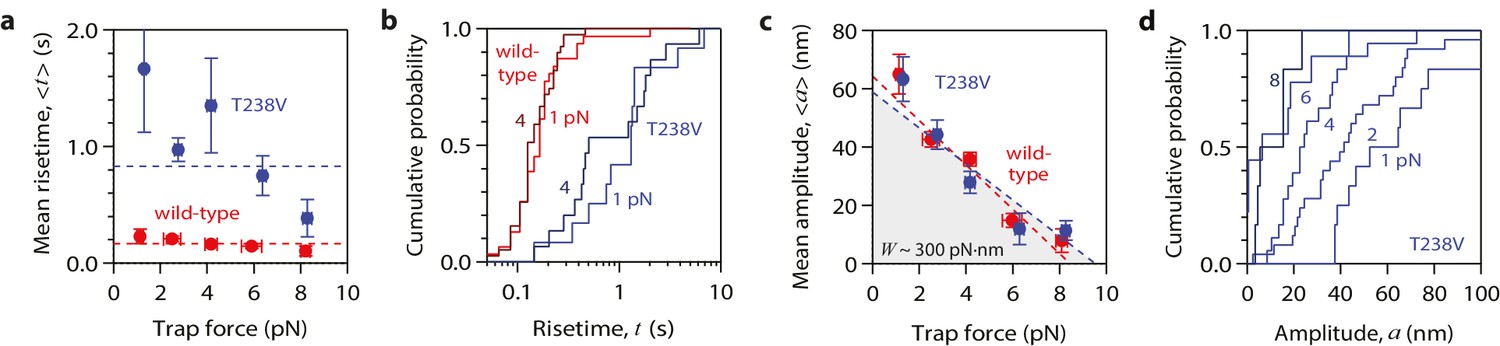
Hyperstable mutant microtubules produce pulses with identical energy.
(a) Mean pulse risetime versus force for mutant T238V microtubules. Wild-type data (from Figure 2a) is shown for comparison. The mean risetimes across all forces for T238V and wild-type microtubules are depicted by the dashed blue and red lines, respectively. Error bars show standard errors (for N = 6 to 25 amplitudes; N = 2 to 78 risetimes). (b) Distributions of risetime at indicated forces for wild-type and T238V microtubules. (c, d) Mean amplitude versus force (c) and distributions of amplitude at indicated forces (d) for pulses generated by mutant T238V microtubules. Wild-type data (from Figure 2c) is shown in (c) for comparison. Total pulse energy, W = 280 ± 50 pN·nm, estimated from the grey-shaded area under the line-fit, is similar for both types of microtubules. All data in (a - d) were measured with 900 nm beads.
Figure 7 with 1 supplement
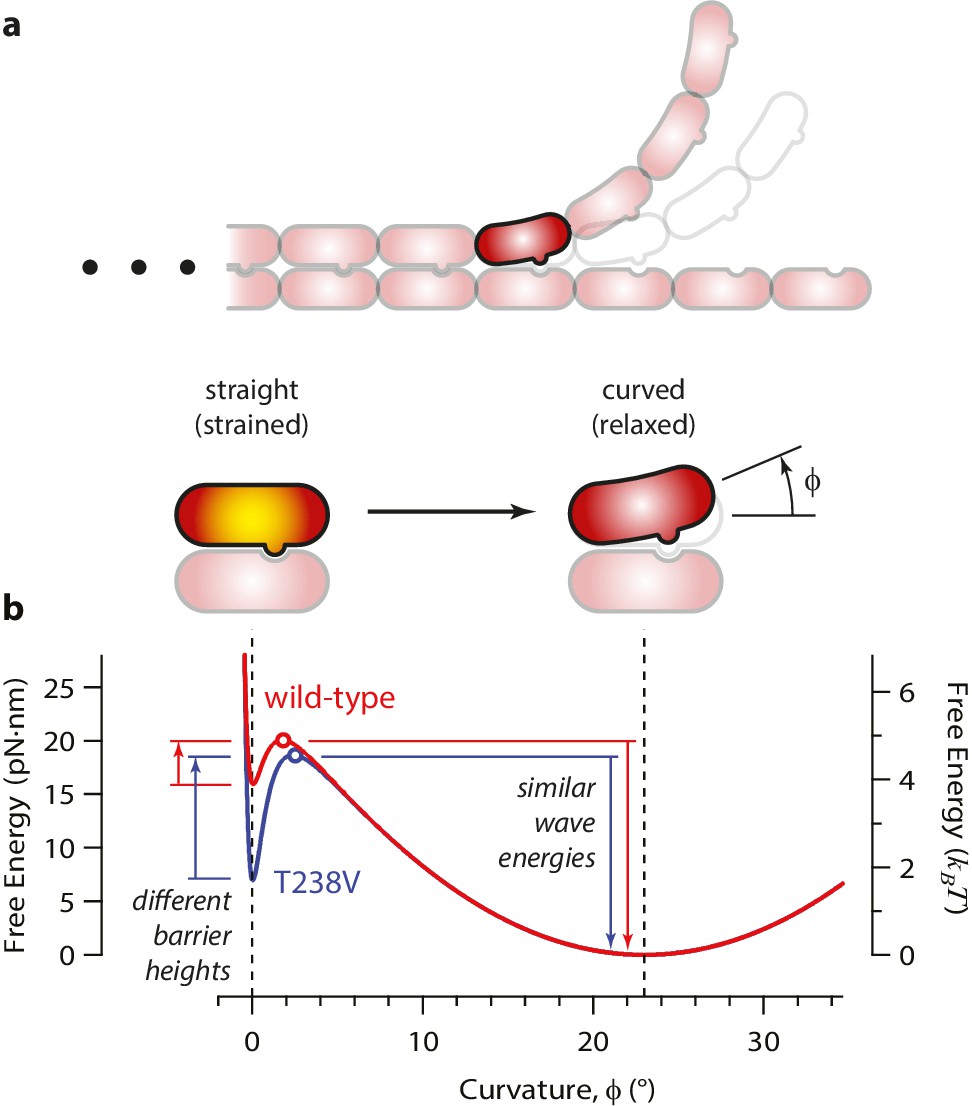
Free energy landscape for a curling αβ-tubulin.
(a) The model considers a single αβ-tubulin (highlighted) as it bends outward from a microtubule. For simplicity, only two protofilaments are depicted. The curling subunit is shown (arbitrarily) at the base of a previously formed protofilament curl. (b) Hypothetical free energy landscapes for wild-type (red curve) and mutant T238V tubulin (blue curve) as functions of subunit curvature, φ. Lateral bonding initially holds the tubulin in a straight conformation (strained, φ = 0°). Curling then proceeds via a high-energy transition state (open circles), which is reached without the development of much curvature (φ ~ 2°). Stronger lateral bonding in T238V increases the height of the transition energy barrier, reducing the rate of curling relative to wild-type. Relaxation from the highly strained transition state to the naturally curved ground state (at φ = 23°, with free energy arbitrarily set to zero) drives movement in the wave assay. Because T238V and wild-type have similar transition energies, they produce conformational waves with similar energy.
Figure 7—figure supplement 1

Free energy landscape for a single curling αβ-tubulin subunit, calculated by adding independent contributions from mechanical strain and lateral bonding.
(a) Mechanical strain energy, U, is calculated as a function of bend angle, φ, by assuming the αβ-tubulin subunit behaves like a slender elastic rod with a naturally bent shape, a bend angle of φ = 23° when fully relaxed, and a constant flexural rigidity, chosen such that the fully straightened dimer carries a strain energy similar to our estimated value (~19 pN·nm). Strain energy functions for wild-type and mutant T238V tubulin are assumed to be identical. Yellow shading in the cartoons indicates mechanical strain. (b) The energy of the lateral bond that the subunit makes with its neighbors in the microtubule lattice, G, follows a simple (Lennard-Jones) function of bend angle. Mutant T238V tubulin (blue curve) is proposed to form stronger lateral bonds than wild-type (red curve). (c) The total free energy, T, is the sum of mechanical strain and lateral bond energies (U + G). Stronger lateral bonding by T238V tubulin increases the height of the transition energy barrier, thereby slowing the rate of curling relative to wild-type. Provided the lateral bonds are highly localized, such that they break before much curling has developed, their contribution to the conformational wave energy is small (irrespective of the exact shapes of the energy functions). Thus, changes in curling rate can occur without necessarily changing the conformational wave energy.
Figure 8
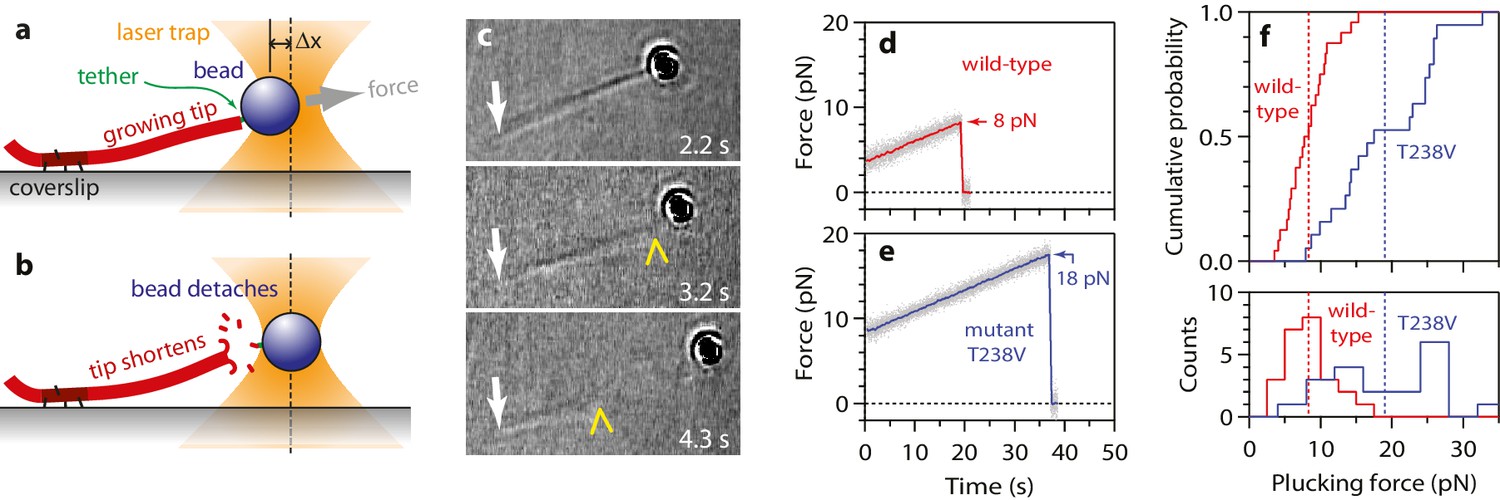
More force is required to pluck hyperstable mutant tubulin subunits from the microtubule end.
(a) A bead is tethered to the end of a growing microtubule via a single antibody bound to the β-tubulin C-terminus and then tested with a 0.25 pN·s−1 force ramp. (b) Usually, detaching the bead by force triggers immediate disassembly of the microtubule (43 of 57 detachments, ~75%), indicating that tubulin dimers were forcibly removed. (c) Selected frames from Video 3, showing an end-tethered bead under tension (2.2 s), detachment of the bead (3.2 s), and tip shortening (4.3 s). White arrows mark the coverslip-anchored segment of the microtubule. Yellow chevrons mark the plus end. (d, e) Example records of tensile force versus time for beads tethered to the ends of wild-type and hyperstable mutant T238V microtubules. Arrows mark plucking forces. Gray dots show raw data. Colored traces show same data after smoothing with a 500 ms boxcar average. (f) Distributions of plucking force for wild-type and mutant T238V tubulins. Dotted vertical lines indicate averages for wild-type tubulin, 8.3 ± 0.6 pN (mean ± SEM; N = 24), and for T238V, 19.0 ± 1.6 pN (N = 19).
Author response image 1
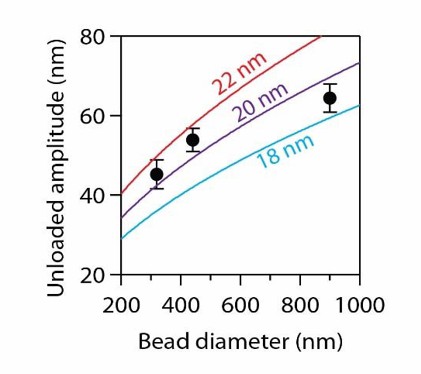
Data recopied from Figure 4B.
Curves show predictions assuming a tether of 36 nm and a curl height, h, as indicated.
Videos
Video 1
Example of wave assay.
A bead tethered to the side of a coverslip-anchored microtubule is initially held under laser trap tension (here, ~1 pN). The distal plus end of the microtubule is severed by laser scissors (at 0 s), triggering disassembly. When the disassembling end reaches the bead, it causes a brief pulse of motion (0.7 s) before the bead detaches (1.0 s). After bead detachment, the microtubule continues disassembling while the stage also moves rightward under feedback control. Red dashes mark the approximate location of the center of the laser trap.
Video 2
Second example of wave assay.
A bead tethered to the side of a coverslip-anchored microtubule is initially held in the laser trap, at low tension (<1 pN). Feedback control is initiated (at −5.6 s) to apply higher tension (4 pN), and then the distal plus end of the microtubule is severed (0 s). The bead detaches when it is reached by the disassembling end (1 s). After bead detachment, the microtubule continues disassembling while the stage moves rightward under feedback control. Red dashes mark the approximate location of the center of the laser trap.
Video 3
Example of plucking force assay.
A bead linked to the assembling plus end of a coverslip-anchored microtubule is subjected to increasing tension until the bead detaches. After bead detachment, the microtubule plus end disassembles, indicating that tubulin dimers were forcibly removed from the end. Two views of the same movie are shown. At right, the plus end and the coverslip-anchored portion of the microtubule are indicated by red and yellow markers, respectively.
Additional files
-
Supplementary file 1
All individual pulse measurements.
Individual amplitudes and risetimes for all recorded pulses, as well as the means and standard errors for each measurement condition, are given in the accompanying Excel spreadsheet. The spreadsheet also includes all the individual plucking force values.
- https://doi.org/10.7554/eLife.28433.019
-
Source code 1
Custom software for controlling the laser trap.
- https://doi.org/10.7554/eLife.28433.020
Download links
A two-part list of links to download the article, or parts of the article, in various formats.
Downloads (link to download the article as PDF)
Open citations (links to open the citations from this article in various online reference manager services)
Cite this article (links to download the citations from this article in formats compatible with various reference manager tools)
Direct measurement of conformational strain energy in protofilaments curling outward from disassembling microtubule tips
eLife 6:e28433.
https://doi.org/10.7554/eLife.28433


