Integration of Tmc1/2 into the mechanotransduction complex in zebrafish hair cells is regulated by Transmembrane O-methyltransferase (Tomt)
- Oregon Health and Science University, United States
- University of Sheffield, United States
- Wellcome Trust Sanger Institute, United Kingdom
Figures
Figure 1
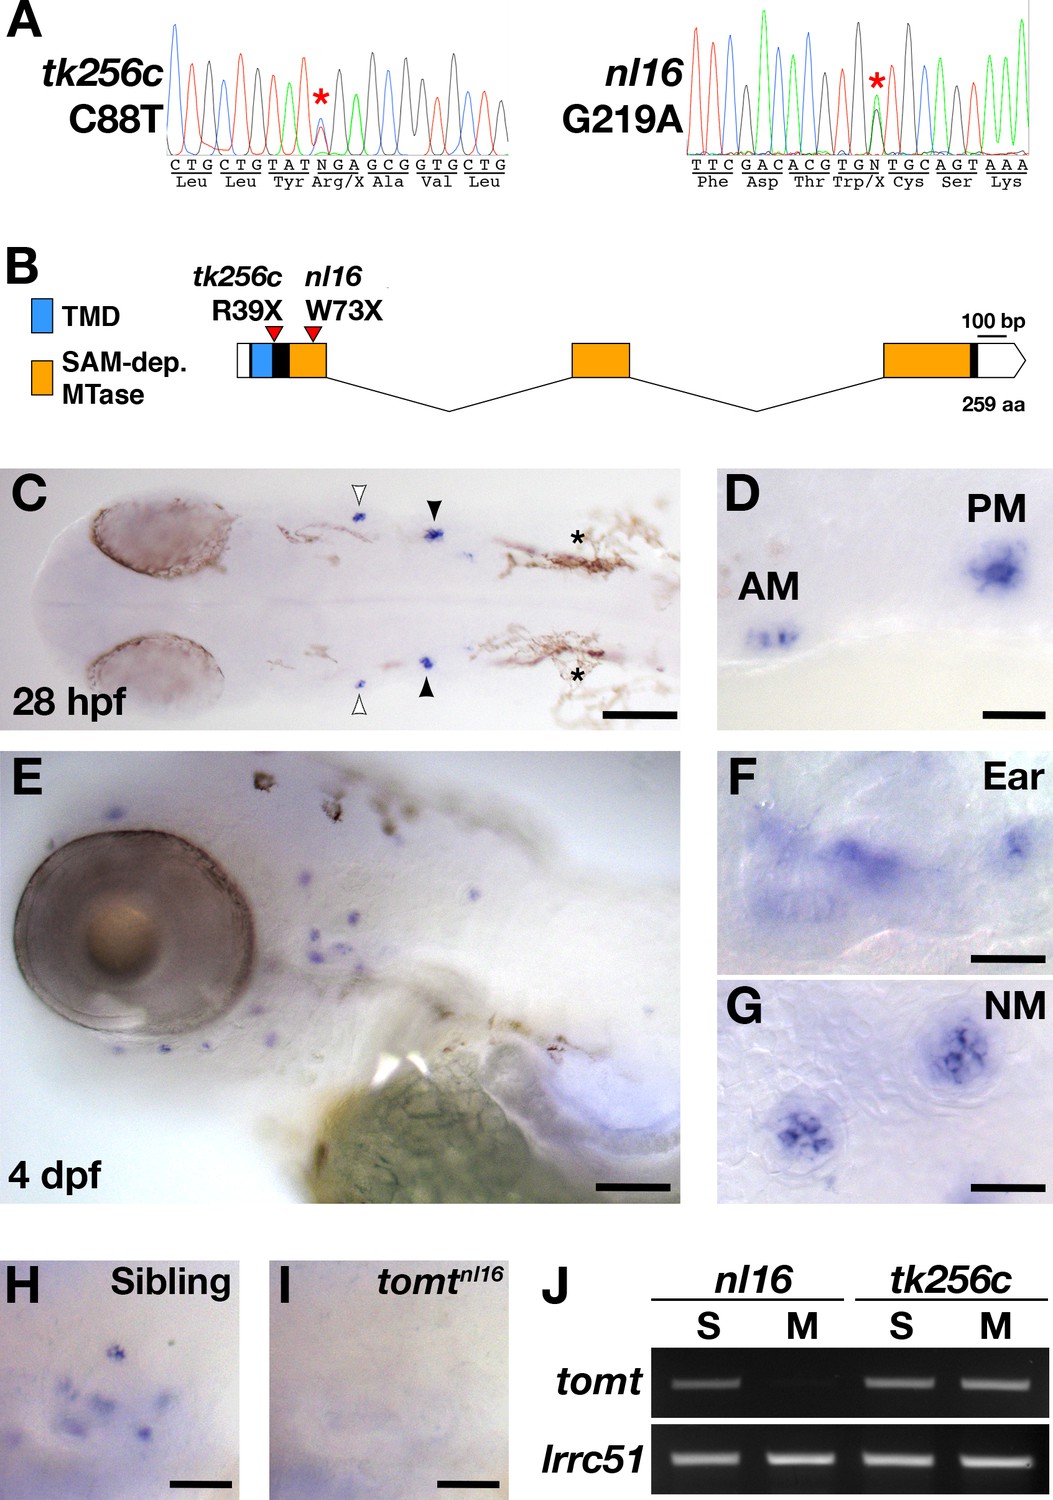
mercury mutations and tomt mRNA expression.
(A) Representative chromatograms from heterozygous mercury mutants showing the C88T and G219A mutations for the tk256c and nl16 alleles respectively. (B) Diagram of the predicted exon-intron structure for the tomt gene. Regions coding for the putative transmembrane domain (TMD, blue) and SAM-dependent O-methyltransferase domain (SAM-dep. MTase, orange) are shown, along with the positions of the tomttk256c R39X and tomtnl16 W73X mutations. (C–G) Whole mount mRNA in situ hybridization (ISH) for tomt in 28 hr post-fertilization (hpf) (C, D) and 4 days post-fertilization (dpf) (E-G) zebrafish larva. (C) At 28 hpf, tomt is expressed in exclusively in the presumptive anterior (AM) and posterior (PM) maculae of the developing ear, as indicated by the white and black arrow heads respectively. Pigment cells are indicated by asterisks (*). The embryo is shown in dorsal view with anterior to the left. (D) A close up of the AM and PM from the larva in C. (E–G) At 4 dpf, tomt is expressed exclusively in the hair cells of the inner ear (F) and lateral line neuromasts (G). Larva is shown in lateral view with anterior to the left and dorsal at the top. (H, I) ISH for tomt in a tomtnl16 WT sibling (H) and mutant (I) at 4 dpf. Inner ear sensory patches are shown. (J) RT-PCR for tomt and lrrc51 from total RNA isolated from 5 dpf tomtnl16 and tomttk256c siblings (S) and mutants (M). Scale bars: 100 µm in C and E, 25 µm in D, F and G, 50 µm in F and G.
Figure 2
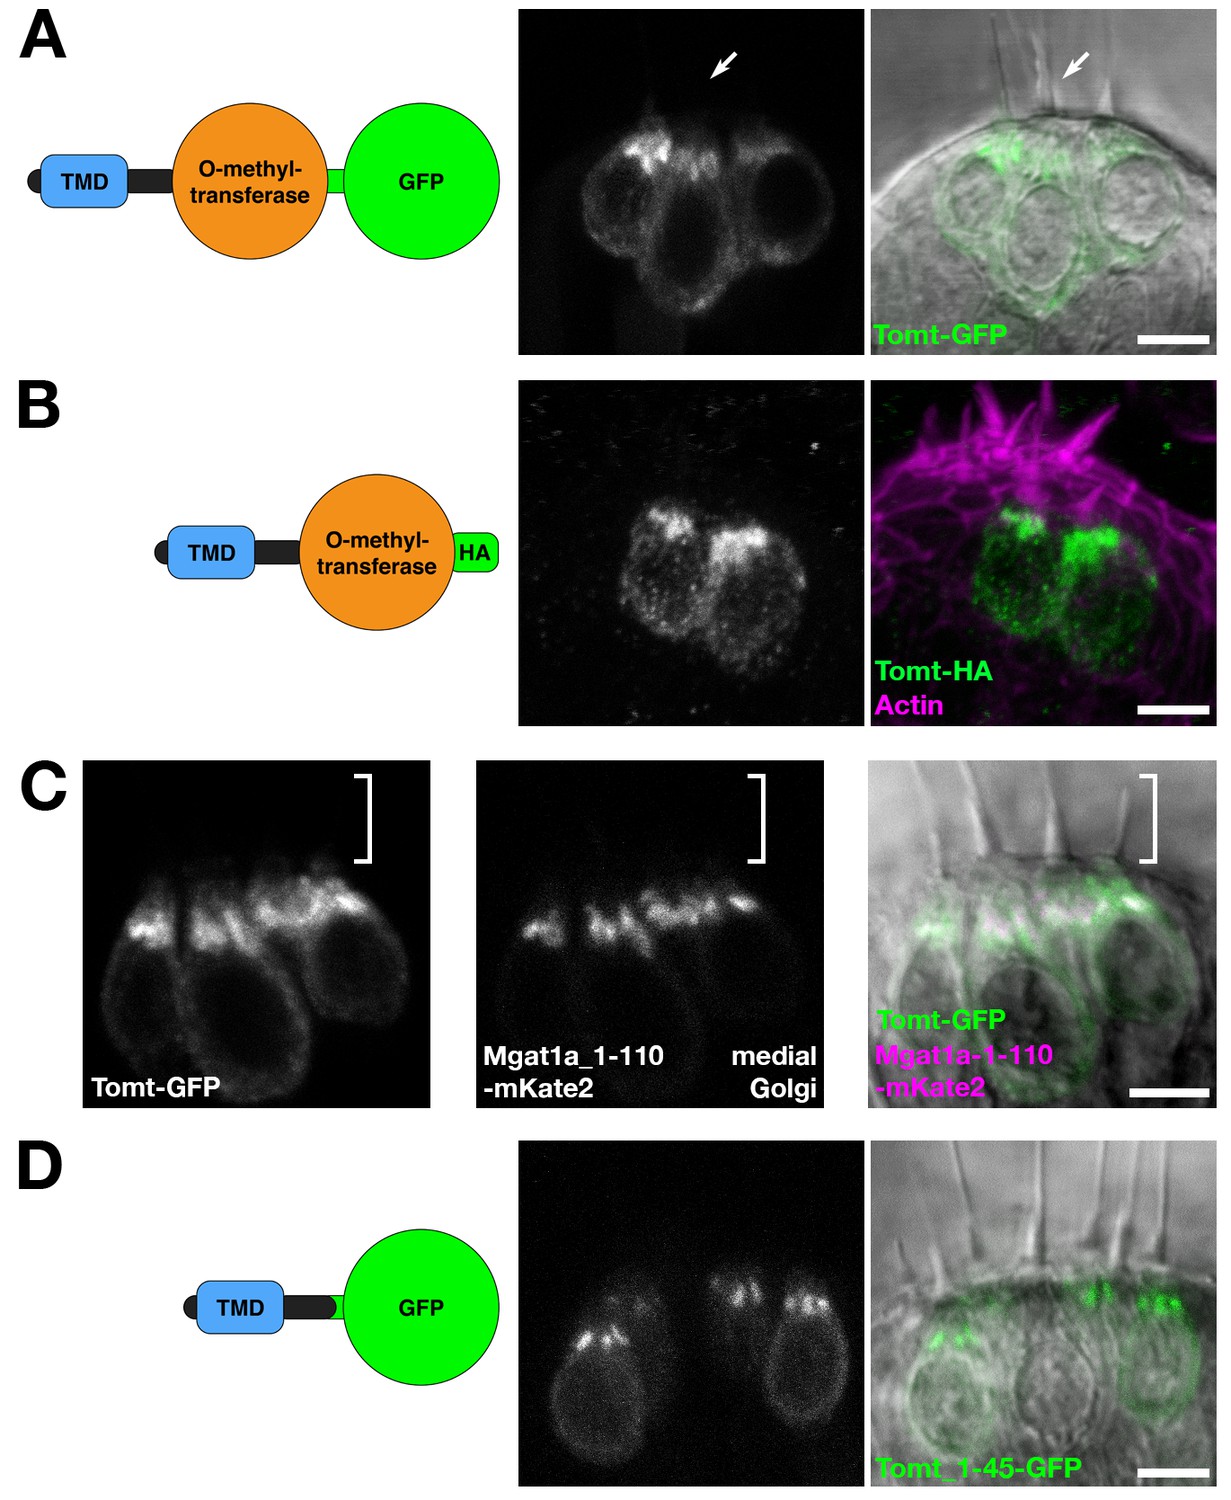
Tomt protein localization.
(A) Diagram of the protein made from the Tg(myo6b:tomt-GFP) transgene plus an image of Tomt-GFP localization in live hair cells of the anterior crista in the inner ear at 3 dpf. The arrow points to an apical hair bundle. (B) Diagram of the protein made from the Tg(myo6b:tomt-HA) transgene plus immunolabel for the HA epitope showing Tomt-HA localization in the hair cells of the anterior crista in the inner ear at 4 dpf. Phalloidin stain (magenta) marks F-Actin. (C) Co-localization between Tomt-GFP and a medial Golgi marker (Mgat1a_1–110-mKate2) in live hair cells of the lateral crista (3 dpf). The hair bundle region is indicated by the white bracket. (D) Diagram of the protein made from the Tg(myo6b:tomt_1–45-GFP) transgene plus an image of Tomt_1–45-GFP localization in live hair cells of the lateral crista at 4 dpf. Scale bars: 5 µm in A-D.
Figure 3

Auditory evoked behavior response (AEBR) in 6 dpf tomttk256c siblings and mutants, with or without the myo6b:tomt-GFP transgene.
The genotype of each group is labeled below, and the number of individuals analyzed for each genotype shown above. Each data point represents the percent of startle responses per trial of 12 stimuli for an individual larva. Error bars show the mean ± SD. Statistical comparisons were made by one-way ANOVA with Bonferroni's multiple comparison test.
Figure 4
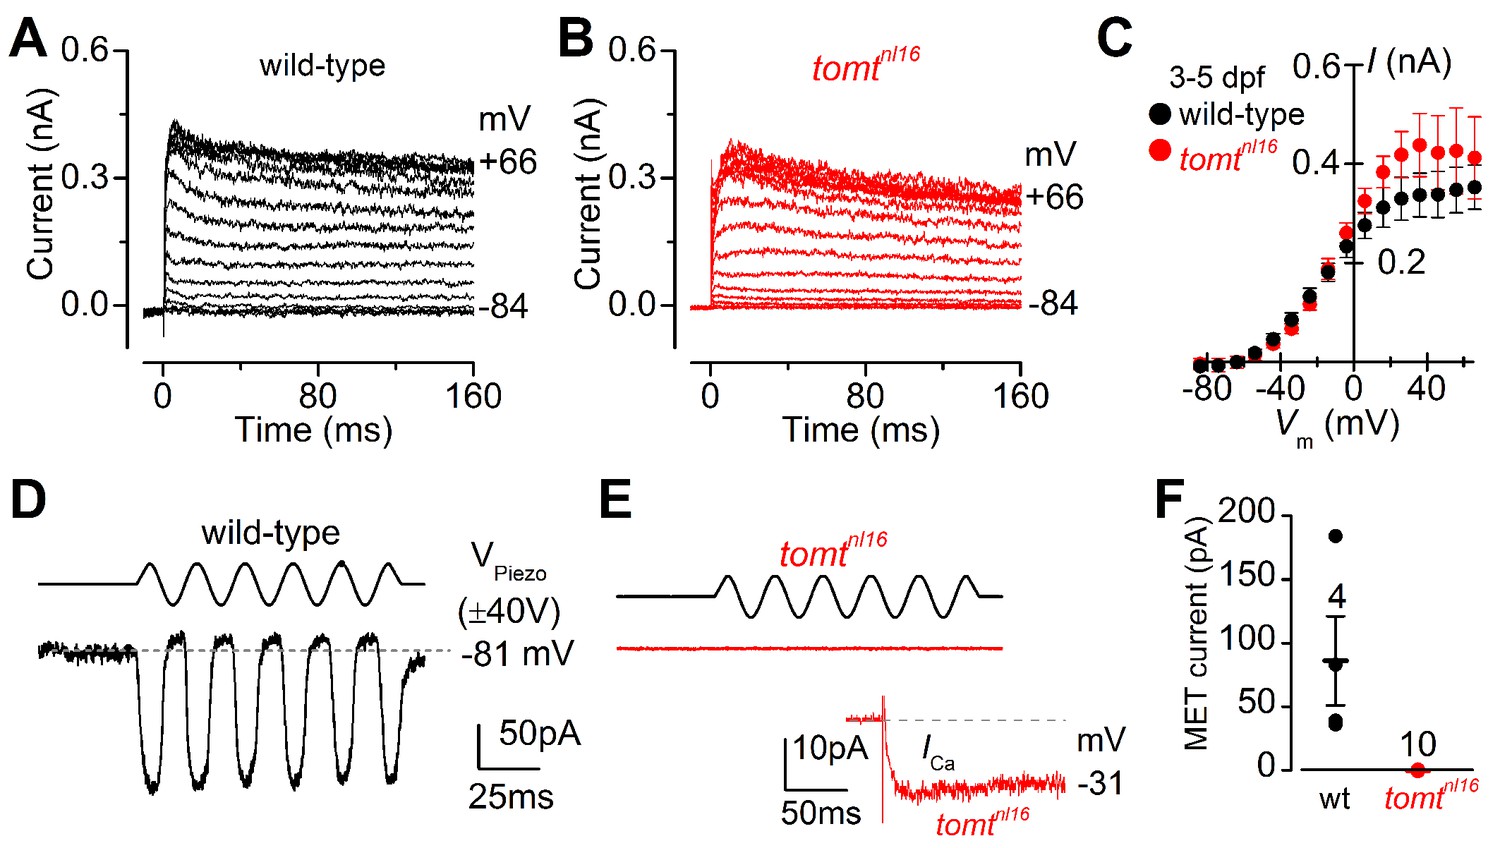
Tomt-deficient hair cells have no mechanotransduction (MET) current.
(A, B) Examples of K+ currents recorded from lateral line hair cells in wild-type sibling (A) and tomtnl16 mutant (B) zebrafish. Currents were elicited by depolarizing and hyperpolarizing voltage steps in 10 mV nominal increments from the holding potential of –84 mV. (C) Average peak current-voltage (I-V) curves from hair cells in wild-type (n = 4) and tomtnl16 mutant (n = 3) hair cells, including those in panels A and B. (D, E) Saturating MET currents in 4 dpf zebrafish recorded from wild-type (D) and tomtnl16 mutant (E) lateral line hair cells in response to a 50 Hz sinusoidal force stimulus to the hair bundles at the membrane potential of –81 mV, which is indicated by the dashed line (D). VPiezo indicates the driver voltage to the fluid jet, with positive deflections moving the hair bundles in the excitatory direction. Note the absence of the MET current in the tomtnl16 mutant hair cell (E). The inset in panel E shows the calcium current recorded from the same cell in response to 150 ms depolarizing voltage steps in 10 mV increments from the holding potential of –81 mV. For clarity, only the peak Ca2+ current trace at –31 mV is shown. (F) Average maximum MET current in both wild-type (wt) and mutant (tomtnl16) hair cells. Mean values in this Figure and text are quoted as means ± S.E.M.
Figure 5 with 2 supplements
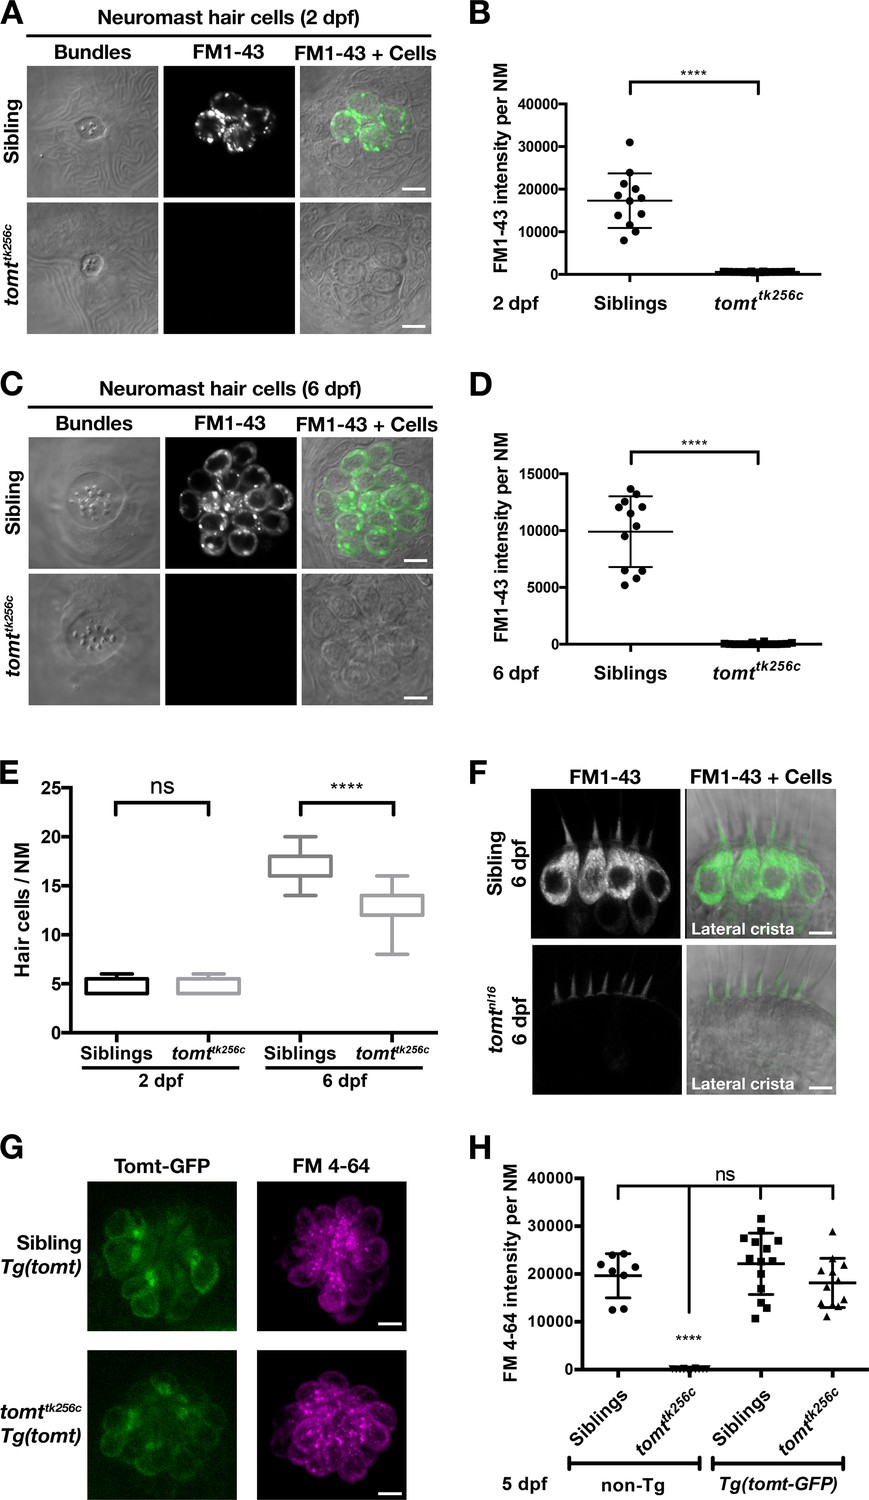
Tomt-deficient hair cells do not label with MET-channel permeant FM dyes.
(A–D) FM 1–43 dye label of lateral line hair cells in 2 dpf (A, B) and 6 dpf (C, D) wild-type siblings and tomttk256c mutants. (A, C) Representative DIC images of NM hair bundles (left), fluorescence images of FM 1–43 in the same NMs (middle), and a merge of the FM 1–43 images with DIC images of the hair cell bodies (right) from 2 dpf (A) and 6 dpf (C) wild-type siblings and tomttk256c mutants. (B, D) Quantification of FM 1–43 fluorescence intensity per NM of 2 dpf (B) and 6 dpf (D) wild-type siblings (n = 6 larvae; 2 NMs each) and tomttk256c mutants (n = 8 larvae; 2 NMs each). Error bars are the mean ± SD. Asterisks indicate p<0.0001 by unpaired, two-tailed t-test. (E) Quantification of hair cell number per neuromast in 2 dpf and 6 dpf tomttk256c mutants and wild-type siblings (same as those shown in panels A – D). The box plots cover the 25th to 75th percentiles, and the whiskers represent the minimum and maximum counts. ns = not significant, asterisks indicate p<0.0001 by unpaired, two-tailed t-test. (F) Representative images of FM 1–43 labeling of inner ear hair cells in 6 dpf wild-type siblings (n = 5 larvae) and tomtnl16 mutants (n = 7 larvae). (G) Rescue of FM dye labeling in mercury mutants by stably expressed Tomt-GFP. Representative images of Tomt-GFP (left panels) and FM 4–64 (right panels) in lateral line NMs of a Tg(myo6b:tomt-GFP) wild-type sibling and a Tg(myo6b:tomt-GFP);tomttk256c mutants at 5 dpf. Tomt-GFP and FM 4–64 images are from the same NM for each genotype. (H) Quantification of FM 4–64 fluorescence intensity per NM for 5 dpf non-transgenic wild-type siblings (n = 6 larvae, 8 NMs), non-transgenic tomttk256c mutants (n = 6 larvae, 12 NMs), Tg(myo6b:tomt-GFP) wild-type siblings (n = 7 larvae, 14 NMs), and Tg(myo6b:tomt-GFP);tomttk256c mutants (n = 6 larvae, 12 NMs), including those NMs shown in F. Error bars are the mean ± SD. ns = not significant. Asterisks indicate p<0.0001 by one-way ANOVA with Bonferroni's multiple comparison test. Scale bars: 5 µm in A, C, F, and G.
Figure 5—figure supplement 1
Hair bundle polarity and morphology in Tomt-deficient hair cells.
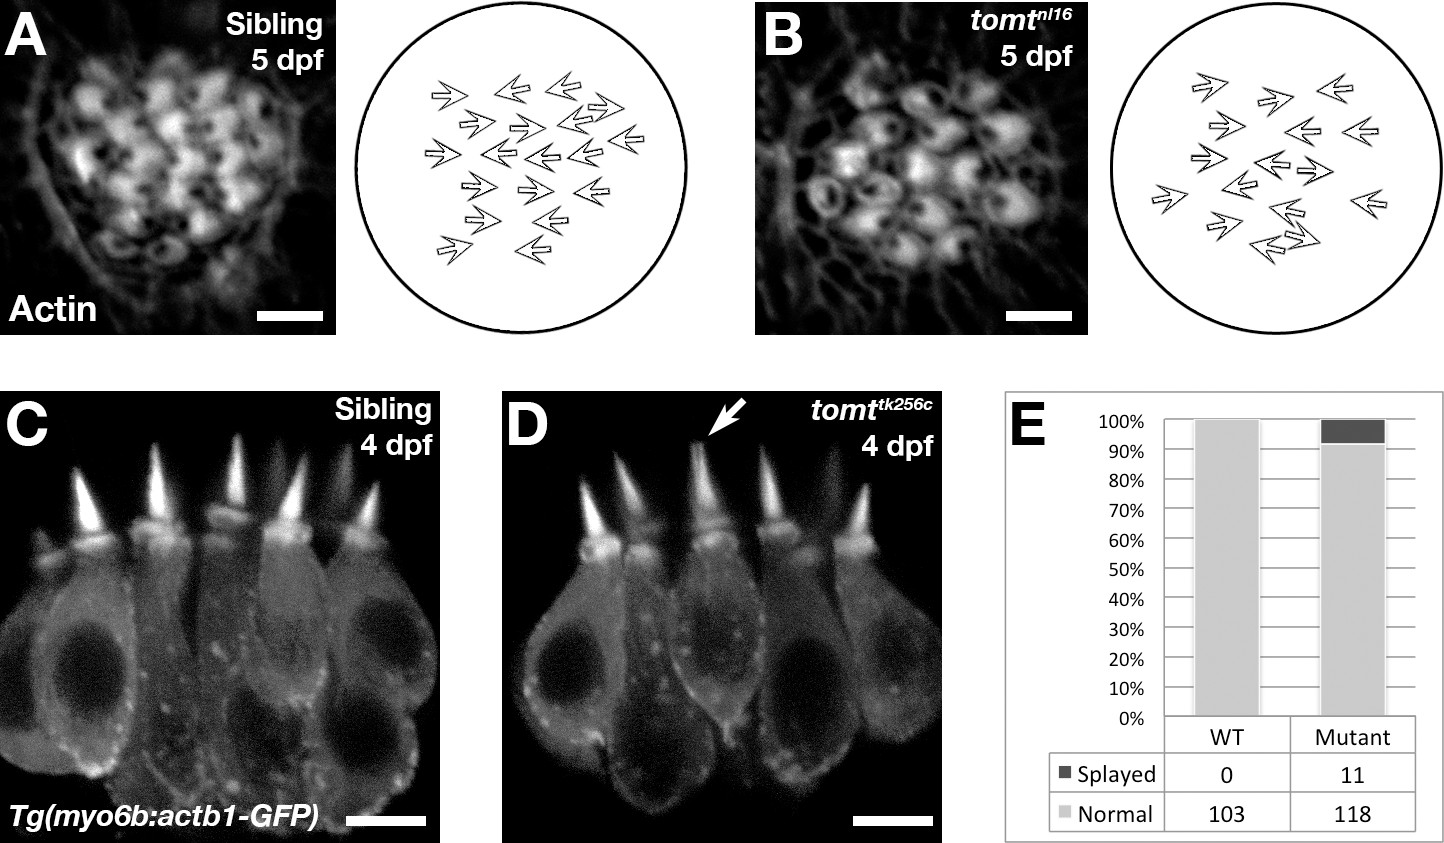
(A, B) Hair cell planar polarity in neuromasts of mercury mutants. Images of hair bundles from 5 dpf wild-type sibling (B) and tomtnl16 mutant (C) larvae stained with phalloidin-488 for F-Actin. Accompanying each image is a diagram of the planar polarity of each hair bundle. (C–E) Inner ear hair cell morphology in mercury mutants. (C, D) Representative images of hair cells in lateral cristae expressing βactin-GFP from Tg(myo6b:actb1-GFP) wild-type siblings (D) and tomttk256c mutants (E) at 4 dpf. White arrow indicates a splayed hair bundle sometimes observed in mercury mutants. (E) Quantification of the splayed bundle phenotype in wild-type siblings (n = 6 larvae, 103 lateral crista hair bundles), and tomttk256c mutants (n = 8 larvae, 129 lateral crista hair bundles). Scale bars = 3 µm in B and C, 5 µm in D and E.
Figure 5—figure supplement 2

Tomt function requires the putative transmembrane and enzymatic domains.
(A) Tomt-HA can restore basal MET channel activity to mercury mutant hair cells. Quantification of FM 1–43 fluorescence intensity per NM for 5 dpf Tg(myo6b:tomt-HA) siblings (n = 3 larvae, 9 NM) and tomtnl16 mutants (n = 5 larvae, 15 NM), as well as non-transgenic tomtnl16 mutants (n = 4 larvae, 12 NM). Error bars are the mean ± SD. ns = not significant. Asterisks indicate p<0.0001 by one-way ANOVA with Bonferroni's multiple comparison test. (B, C) Representative images of neuromasts from 4 dpf wild-type (B) and tomtnl16 larvae transiently expressing a cytoplasmic form of Tomt (HA-Tomt_45–259-GFP). Cytoplasmic Tomt fails to rescue FM 4–64 label in mercury mutants (n = 7 individuals). (D, E) Representative images of neuromasts from 4 dpf wild-type (B) and tomtnl16 larvae transiently expressing a form of Tomt lacking the putative enzymatic domain (Tomt_1–45-GFP). Transiently expressed Tomt_1–45-GFP fails to rescue FM 4–64 label in mercury mutants (n = 2). (F) Quantification of FM 4–64 fluorescence intensity per NM in 4 dpf stable Tg(myo6b:tomt_1–45-GFP) wild-type siblings (n = 6 larvae, 13 NM) and tomtnl16/tk256c compound mutants (n = 4 larvae, 10 NM), as well as non-transgenic wild-type siblings (n = 2 larvae, 6 NM). Error bars are the mean ± SD. ns = not significant, asterisks indicate p<0.0001 by one-way ANOVA with Bonferroni's multiple comparison test. Scale bars = 5 µm in B-E.
Figure 6

Restoration of MET channel activity in mercury mutant hair cells with heat shock-inducible Tomt-GFP.
(A) Workflow for the heat-shock inducible tomt-GFP transgene experiment. (B) Representative images of Tomt-GFP (left panels), FM 4–64 (middle panels) and merged GFP, FM 4–64 and DIC channels (right panels) in lateral line NMs of 5 dpf Tg(hsp70l:tomt-GFP); tomtnl16 larvae pre- and post-heat shock. (C, D) Quantification of GFP intensity (C) and FM 4–64 intensity (D) per NM of Tg(hsp70l:tomt-GFP); tomtnl16 larvae (n = 6) pre- and post-heat shock. Error bars are the mean ± SD. Asterisks indicate p<0.0001 by unpaired, two-tailed t-test. Scale bars: 5 µm in B.
Figure 7

Comta-GFP cannot restore basal MET channel activity in mercury mutant hair cells.
(A) Alignment between the putative enzymatic domains of human S-COMT (amino acids 2–221, Accession # NP_009294) and zebrafish Tomt (amino acids 43–259, Accession # ANO40802). Residues involved in Mg2+-binding (pink), S-adenosylmethionine (SAM) binding (blue), and catechol substrate binding (yellow) are indicated, as determined by the crystal structure for human S-COMT (PDB_3BWM). Alignment legend - star (*) = conserved; colon (:) = conservative change; period (.) = semi-conservative change. (B) Representative images of Comta-GFP (left panels), FM 4–64 (middle panels) and merged GFP and FM 4–64 channels (right panels) in lateral line NMs of Tg(myo6b:comta-GFP) wild-type siblings and tomtnl16 mutants at 6 dpf. (C) Quantification of FM 4–64 fluorescence intensity per NM for 6 dpf Tg(myo6b:comta-GFP) siblings (n = 5 larvae, 8 NMs) and tomtnl16 mutants (n = 3 larvae, 9 NMs). Error bars are the mean ± SD. Asterisks indicate p<0.0001 by unpaired, two-tailed t-test. Scale bars = 5 µm in B, C.
Figure 8
Mouse TOMT can restore basal MET channel activity to mercury mutant hair cells.
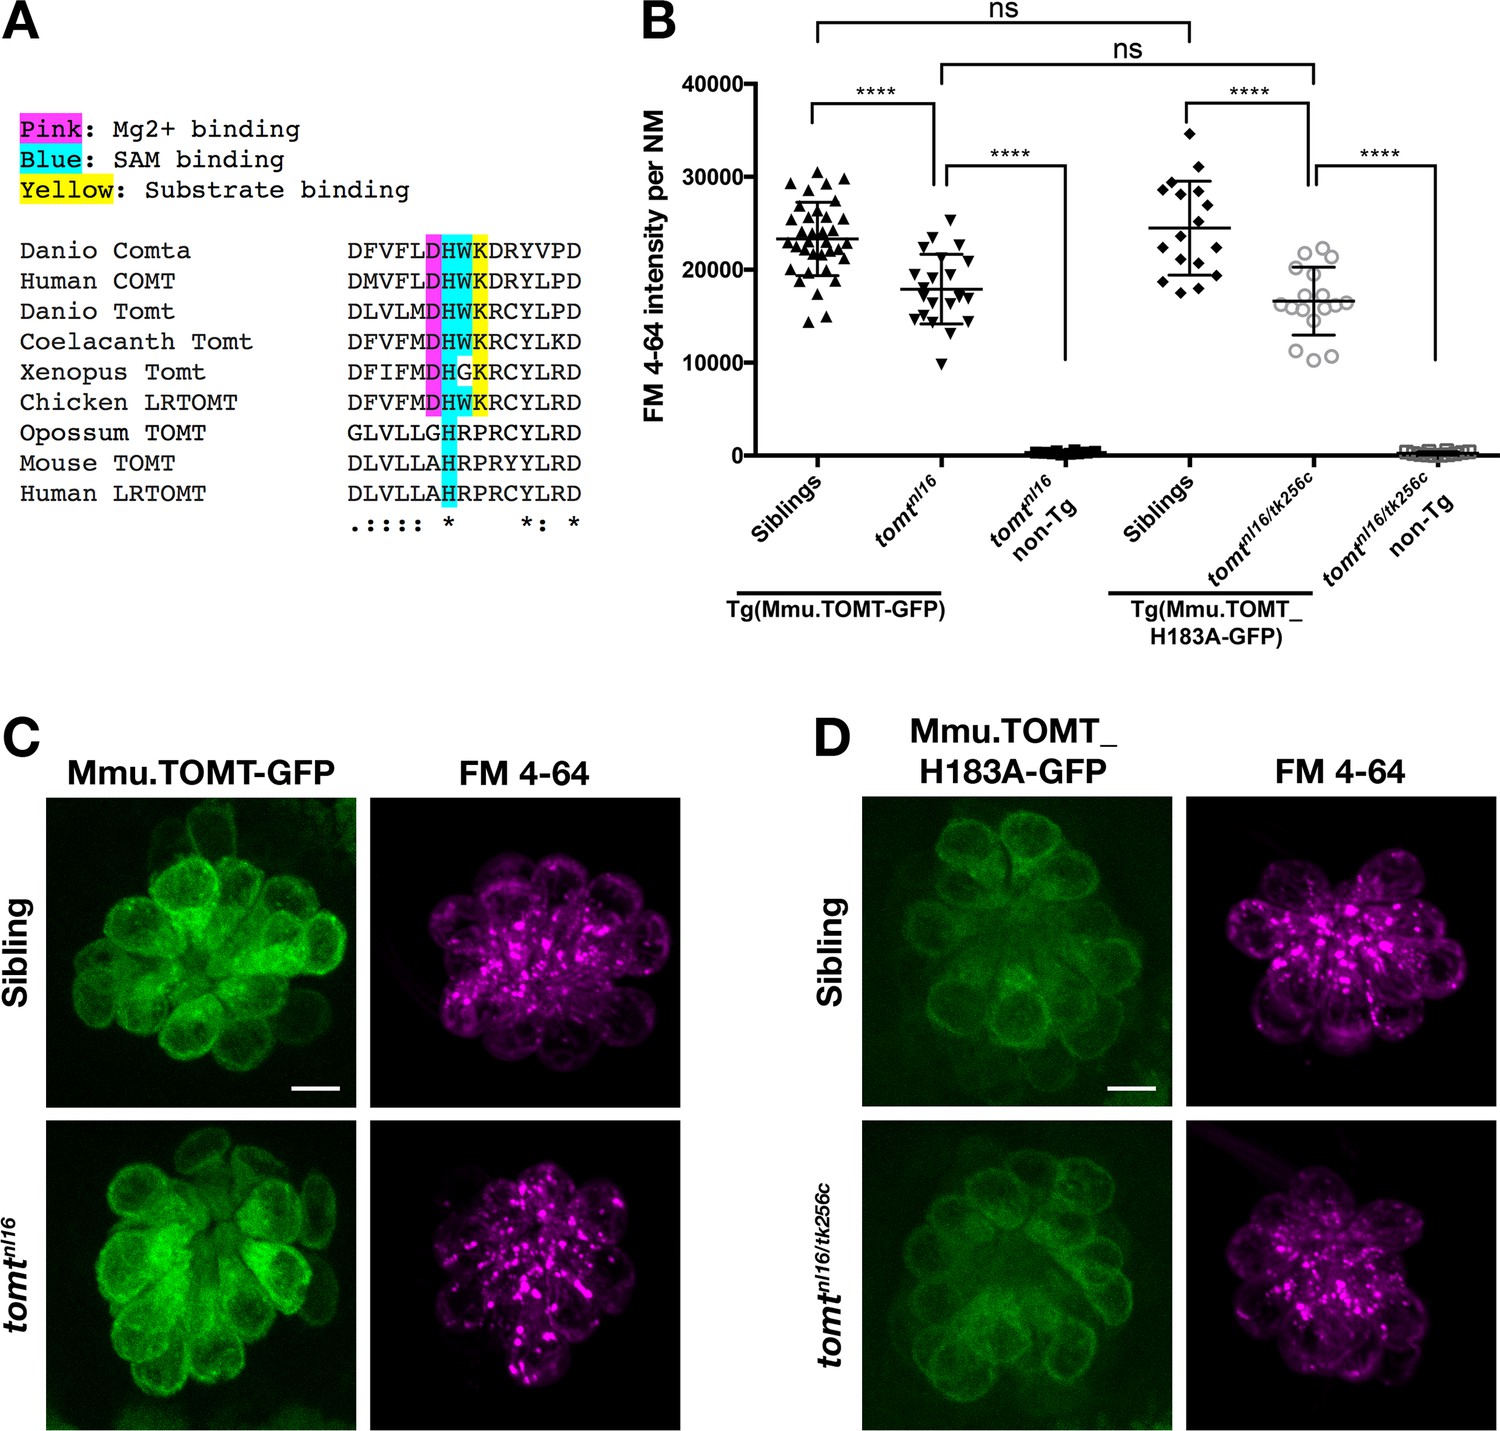
(A) Alignment between putative active site residues in Danio rerio Comta (Asp178-Asp192; NP_001025328), Human MB-COMT (Asp186-Asp200; NP_000745), and Tomt/LRTOMT proteins from Danio rerio (Asp178-Asp19; ANO40802), Coelacanth (Asp178-Asp192; XP_006003643), Xenopus tropicalis (Asp206-Asp220; XP_004920324), Chicken (Asp178-Asp192; NP_001269010), Opossum (Gly177-Asp191; XP_016277512), Mouse (Asp177-Asp191; NP_001269017), and Human (Asp200-Asp214; NP_001138781. The shaded residues and alignment legend are the same as for Figure 7. (B) Quantification of FM 4–64 fluorescence intensity per NM for tomt mutants stably expressing either mouse TOMT-GFP (myo6b:Mmu.Tomt-GFP; n = 8, 22 NMs) or mouse TOMT-H183A-GFP (myo6b:Mmu.Tomt_H183A-GFP; n = 7, 17 NMs). For comparison, FM 4–64 fluorescence values are included for transgenic siblings (TOMT-GFP: n = 12, 35 NMs; TOMT-H183A: n = 8, 17 NMs) and non-transgenic mutants (tomtnl16: n = 4; 10 NMs; tomtnl16/tk256c: n = 6, 12 NMs). Error bars are the mean ± SD. Asterisks indicate p<0.0001 by one-way ANOVA with Bonferroni's multiple comparison test. (C) Representative images of Mmu.TOMT-GFP (left) and FM 4–64 (right) in lateral line NMs of a 5 dpf Tg(myo6b:Mmu.Tomt-GFP) sibling (top) and a tomtnl16 mutant (bottom). (D) Representative images of Mmu.TOMT_H183A-GFP (left) and FM 4–64 (right) in lateral line NMs of a 4 dpf Tg(myo6b:Mmu.Tomt_H183A-GFP) sibling (top) and a tomtnl16/tk256c mutant (bottom). Images in C and D were near the mean of the FM 4–64 values shown in B. Scale bars = 5 µm in C, D.
Figure 9 with 2 supplements
Hair bundle localization of MET complex proteins Lhfpl5a, Pcdh15a, Tmie, Tmc1, and Tmc2b in mercury mutants.
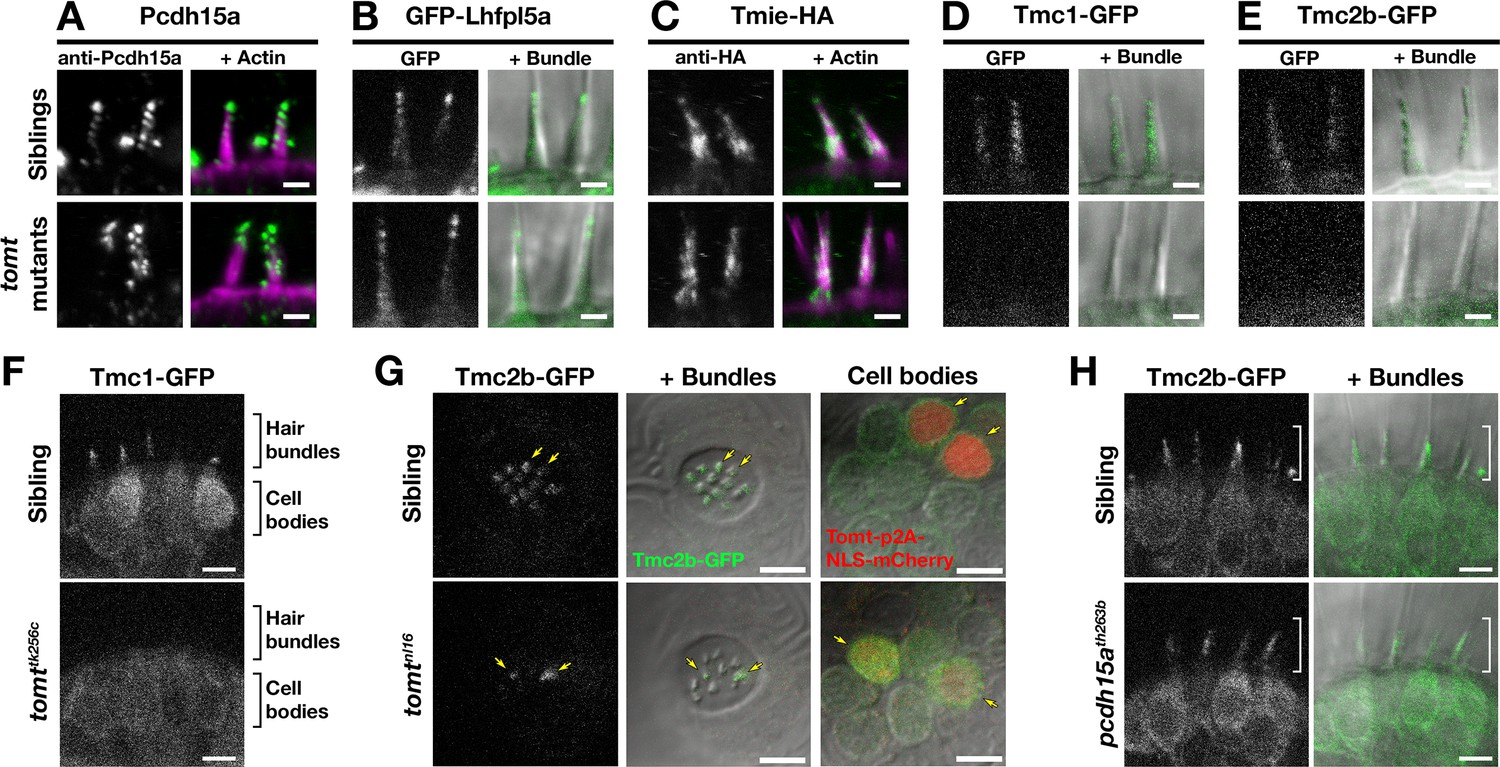
(A–E) Representative images of (A) anti-Pcdh15a (Sibs and tomtnl16n = 4 each), (B) GFP-Lhfpl5a (Sibs and tomttk256cn = 12 each), (C) Tmie-HA (Sibs and tomttk256cn = 15 each), (D) Tmc1-GFP (Sibs n = 17; tomttk256cn = 10), and (E) Tmc2b (Sibs n = 16; tomttk256cn = 12 in lateral cristae hair bundles at 4–5 dpf. Images in B, D, and E are from live larvae, while those in A and C are from immunolabeled, fixed specimens with phalloidin-labeled actin shown in magenta. (F) Optical sections through lateral cristae sensory patches showing the absence of Tmc1-GFP fluorescence specifically in the hair bundles of tomttk256c mutants, whereas GFP signal is present in the cells bodies. (G) Tomt can restore Tmc2b-GFP localization to the hair bundle of mercury mutant hair cells. Tmc2b-GFP fluorescence in neuromast hair cells of a 4 dpf Tg(myo6b:tmc2b-GFP) wild-type sibling (top) and tomtnl16 mutant (bottom) transiently expressing tomt-p2a-nls-mCherry. Note the presence of Tmc2b-GFP only in the Tomt-P2A-nls-mCherry expressing cells of the tomtnl16 mutant (yellow arrows, n = 3 individuals; 12 cells). (H) Representative images of Tmc2b-GFP (left panels) and merged GFP and DIC channels (right panels) in the lateral cristae of 4 dpf siblings (n = 6; top) and pcdh15ath263b mutants (n = 6; bottom). White brackets indicated the hair bundle region of the hair cells. Scale bars = 2 µm in A-E, 5 µm in F-H.
Figure 9—figure supplement 1
Tmc2b-GFP can restore basal MET channel activity to tmc2bsa8817 mutants.
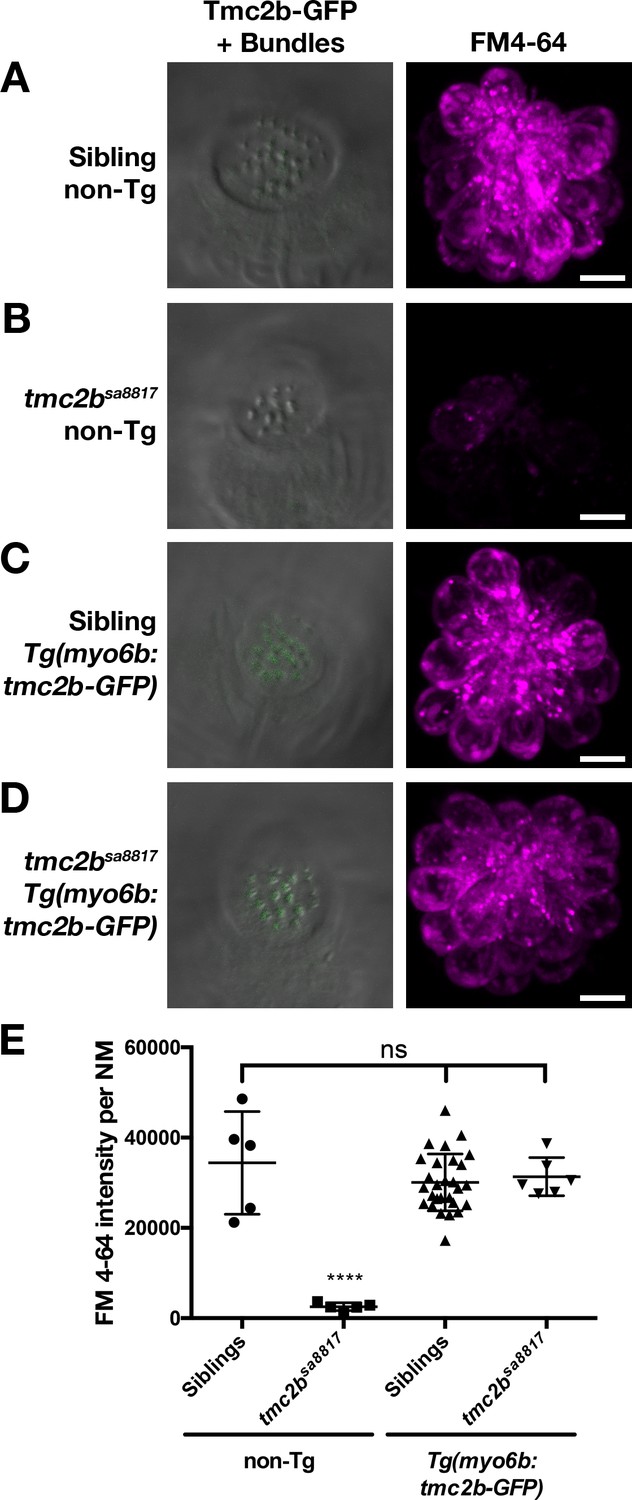
(A–D) Representative, merged GFP-DIC images of neuromast hair bundles (left) and FM 4–64 label (right) in 6 dpf non-transgenic, wild-type siblings (A), non-transgenic, tmc2bsa8817 mutants (B), Tg(myo6b:tmc2b-GFP), wild-type siblings (C), and Tg(myo6b:tmc2b-GFP), tmc2bsa8817 mutants (D). (E) Quantification of FM 4–64 fluorescence intensity per NM for the genotypes shown in A-D. Non-transgenic siblings: n = 3 larvae, 5 NM. Non-transgenic tmc2bsa8817: n = 3 larvae, 5 NM. Tg(tmc2b-GFP) siblings: n = 10 larvae, 28 NM. Tg(tmc2b-GFP) / tmc2bsa8817: n = 2 larvae, 6 NM. Error bars are the mean ± SD. ns = not significant. Asterisks indicate p<0.0001 by one-way ANOVA with Bonferroni's multiple comparison test. Scale bars = 5 µm in A-D.
Figure 9—figure supplement 2
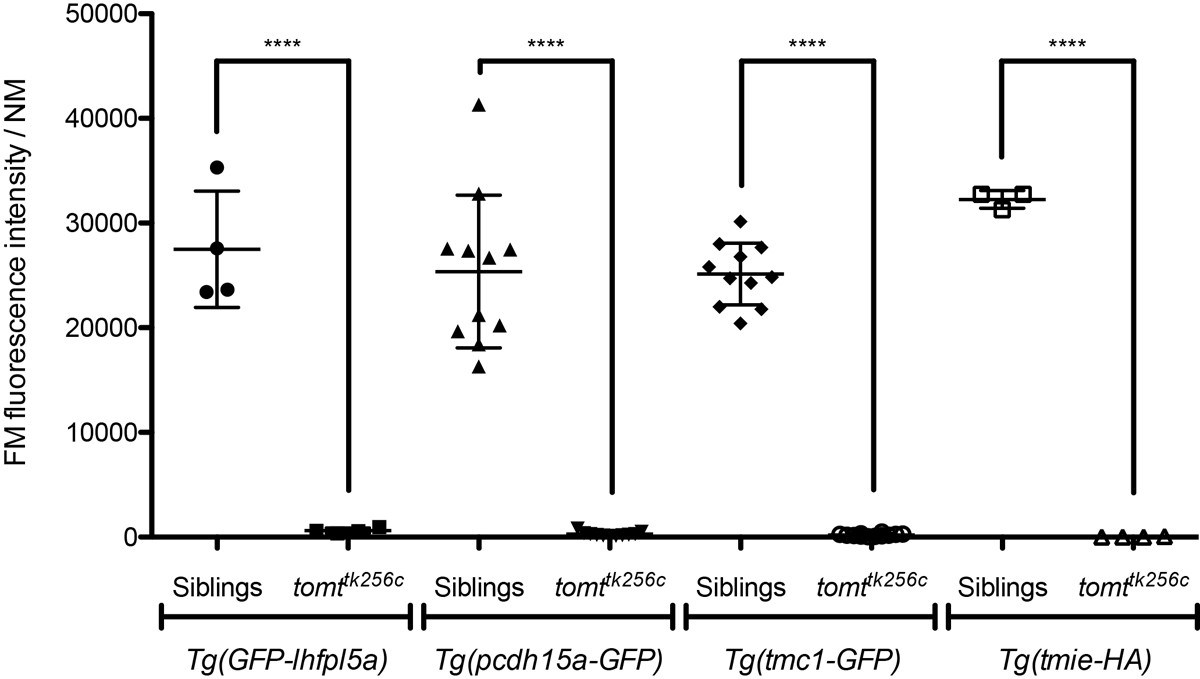
Transgenic expression of GFP-Lhfpl5a, Pcdh15aCD3-GFP, Tmc1-GFP, or Tmie-HA cannot restore basal MET channel activity to mercury mutant hair cells.
Tg(myo6b:GFP-lhfpl5a) 4 dpf: siblings n = 2 larvae, 4 NM; tomttk256cn = 2 larvae, 4 NM. Tg(myo6b:pcdh15aCD3-GFP) 5 dpf: siblings n = 5 larvae, 11 NM; tomttk256cn = 4 larvae, 11 NM. Tg(myo6b:tmc1-GFP) 5 dpf: siblings n = 4 larvae, 11 NM; tomttk256cn = 4 larvae, 12 NM. Tg(myo6b:tmie-HA) 5 dpf: siblings n = 2 larvae, 3 NM; tomttk256cn = 2 larvae, 4 NM. Error bars are the mean ± SD. Asterisks indicate p<0.0001 by unpaired, two-tailed t-tests.
Figure 10 with 1 supplement
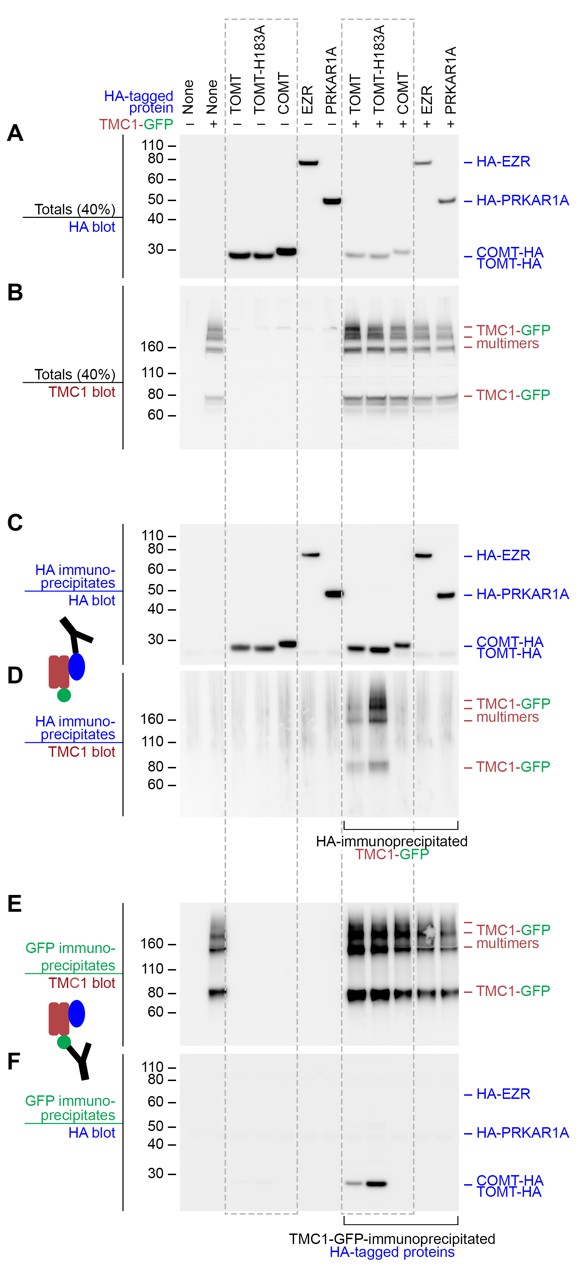
Mouse TOMT and TMC1 can interact in HEK 293 cells.
Top labels: transfected proteins for all blots. Blue labels: HA-tagged proteins; Burgundy: TMC1; Green: GFP. (A) Anti-HA blot of totals (40% loaded relative to immunoprecipitates). (B) Anti-TMC1 blot of totals. (C) Anti-HA blot of HA immunoprecipitates. (D) TMC1 blot of HA immunoprecipitates. (E) TMC1 blot of GFP immunoprecipitates (immunoprecipitating GFP-TMC1). (F) HA blot of GFP immunoprecipitates. In both HA and GFP immunoprecipitation experiments, a robust interaction was detected between TOMT and TMC1; the H183A change in TOMT enhances this interaction. The HA-tagged controls COMT, EZR, and PRKAR1A did not interact with TMC1-GFP.
Figure 10—figure supplement 1
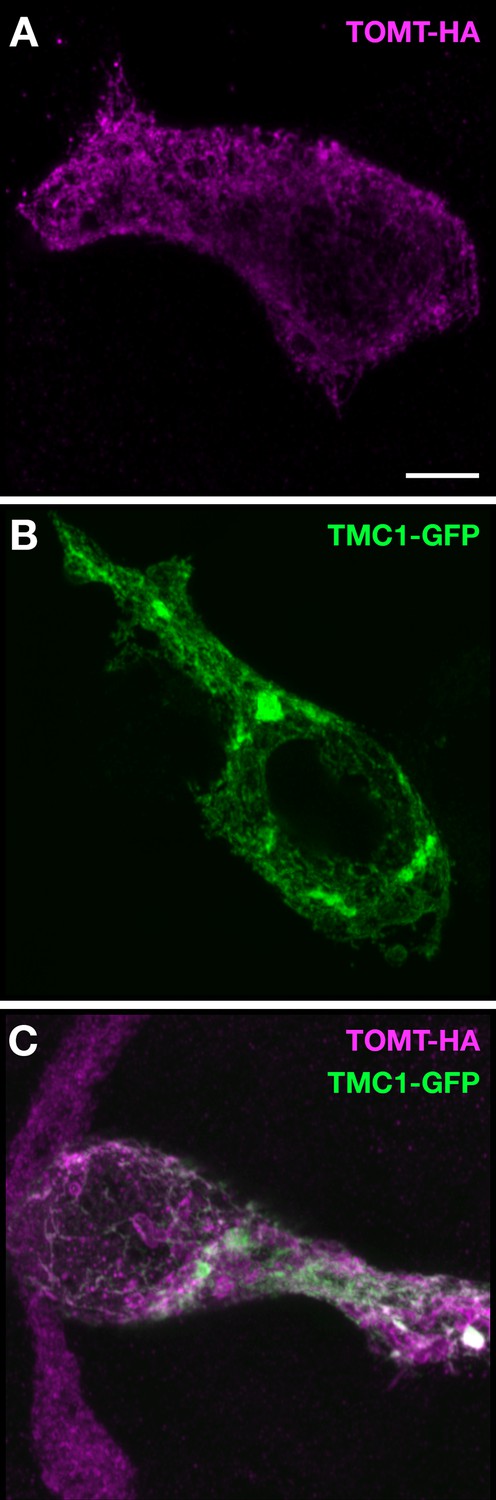
TOMT-HA and TMC1-GFP in HEK 293 cells.
(A) TOMT-HA only; (B) TMC1-GFP only; (C) TOMT-HA (magenta) and TMC1-GFP (green) co-expressed. Both TOMT and TMC1 were confined to intracellular membranes. Scale bar = 5 µm, applies to A-C.
Tables
Table 1
Sanger AB and Tuebingen de novo genomic assembly contigs containing tomt coding sequence (GenBank: KX066099).
| AB strain (DHAB) Illumina de novo assembly | ||
|---|---|---|
| Contig Name | Exon | Region of tomt CDS |
| Contig_000336392 | 1 | 1–262 |
| Contig_000381119 | 2 | 263–459 |
| Contig_000235950 | 3 | 460–780 |
| Tuebingen strain (DHTu2) Illumina de novo assembly | ||
| Contig Name | Exon | Region of tomt CDS |
| c306000518.Contig1 | 1 | 1–60 |
| c279701478.Contig1 | 1 | 1–258 |
| c280900030.Contig1 | 1 | 141–262 |
| c301500577.Contig1 | 2 | 263–459 |
| c282600514.Contig1 | 3 | 730–780 |
| c282201256.Contig1 | 3 | 460–780 |
| c008000433.Contig1 | 3 | 460–599 |
Additional files
-
Supplementary file 1
Primers (A), expression constructs (B) and transgenic fish lines (C) used in this study.
- https://doi.org/10.7554/eLife.28474.018
Download links
A two-part list of links to download the article, or parts of the article, in various formats.
Downloads (link to download the article as PDF)
Open citations (links to open the citations from this article in various online reference manager services)
Cite this article (links to download the citations from this article in formats compatible with various reference manager tools)
Integration of Tmc1/2 into the mechanotransduction complex in zebrafish hair cells is regulated by Transmembrane O-methyltransferase (Tomt)
eLife 6:e28474.
https://doi.org/10.7554/eLife.28474


