Ligand modulation of sidechain dynamics in a wild-type human GPCR
- The University of Texas Southwestern Medical Center, United States
- CUNY Advanced Science Research Center, United States
- University of Copenhagen, Denmark
- Weill Cornell Medical College, United States
- City College of New York, United States
- City University of New York, United States
Figures
Figure 1 with 2 supplements
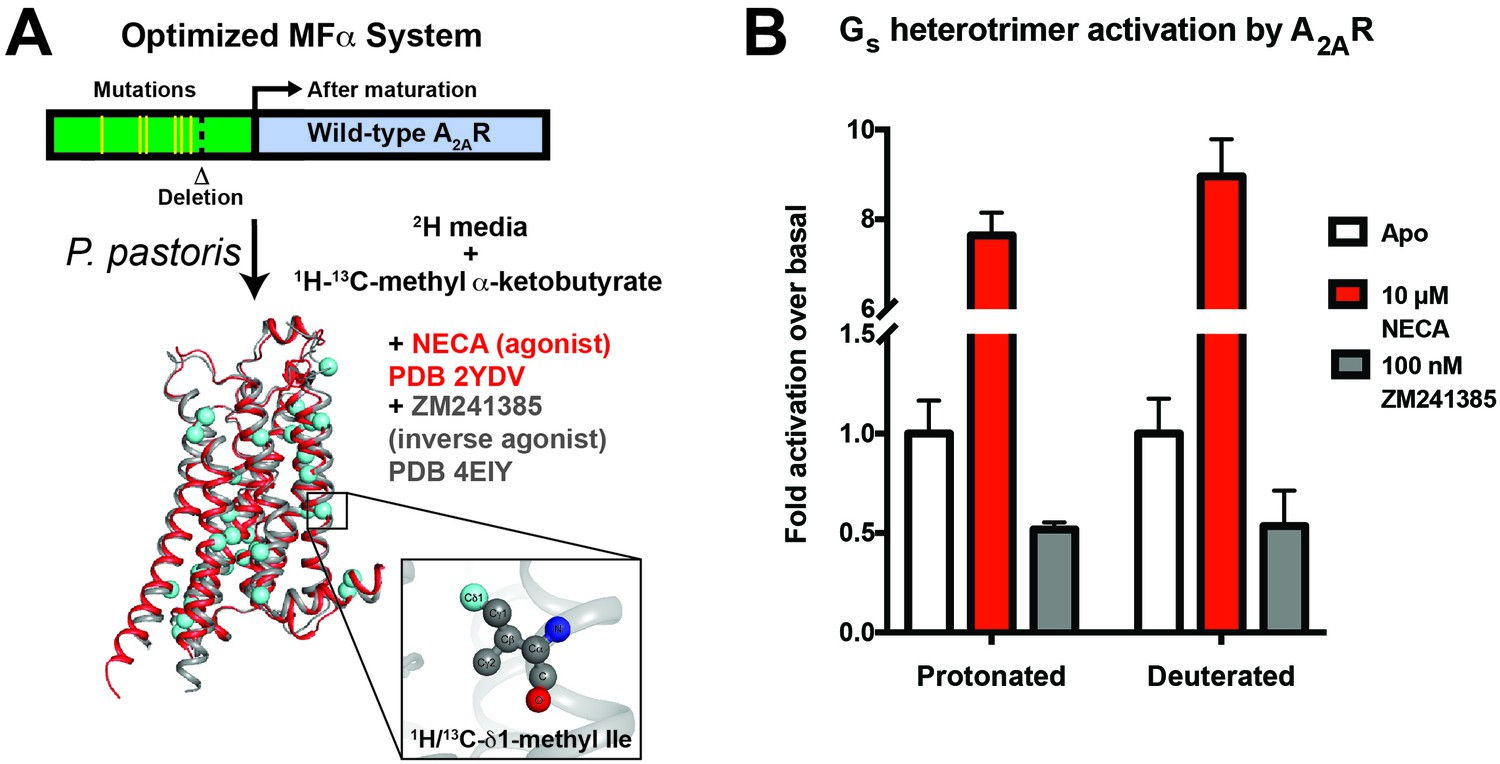
A2AR expression and Gs activation.
(A) Wild-type A2AR was expressed in P. pastoris as a fusion with an optimized version of the α-mating factor (MFα) signal sequence that contains mutations and a deletion that increase receptor trafficking to the plasma membrane. For NMR experiments, Pichia cultures were grown in deuterated media supplemented with (1H/13C-methyl) α-ketobutyrate to facilitate 1H/13C labeling of Ile δ1 methyl groups in a deuterated background as previously described (Clark et al., 2015). Crystal structures of A2AR are shown complexed with agonist NECA (red, 2YDV (Lebon et al., 2011)) and inverse agonist ZM241385 (gray, 4EIY (Liu et al., 2012b), with isoleucine residues displayed as spheres. Labeled Ile δ1 carbon atoms are shown in cyan (see inset). (B) [35S]GTPγS binding to purified, protonated or perdeuterated A2AR reconstituted with purified Gs heterotrimer. Agonist NECA stimulates [35S]GTPγS binding, while inverse agonist ZM241385 inhibits basal levels of binding.
Figure 1—figure supplement 1
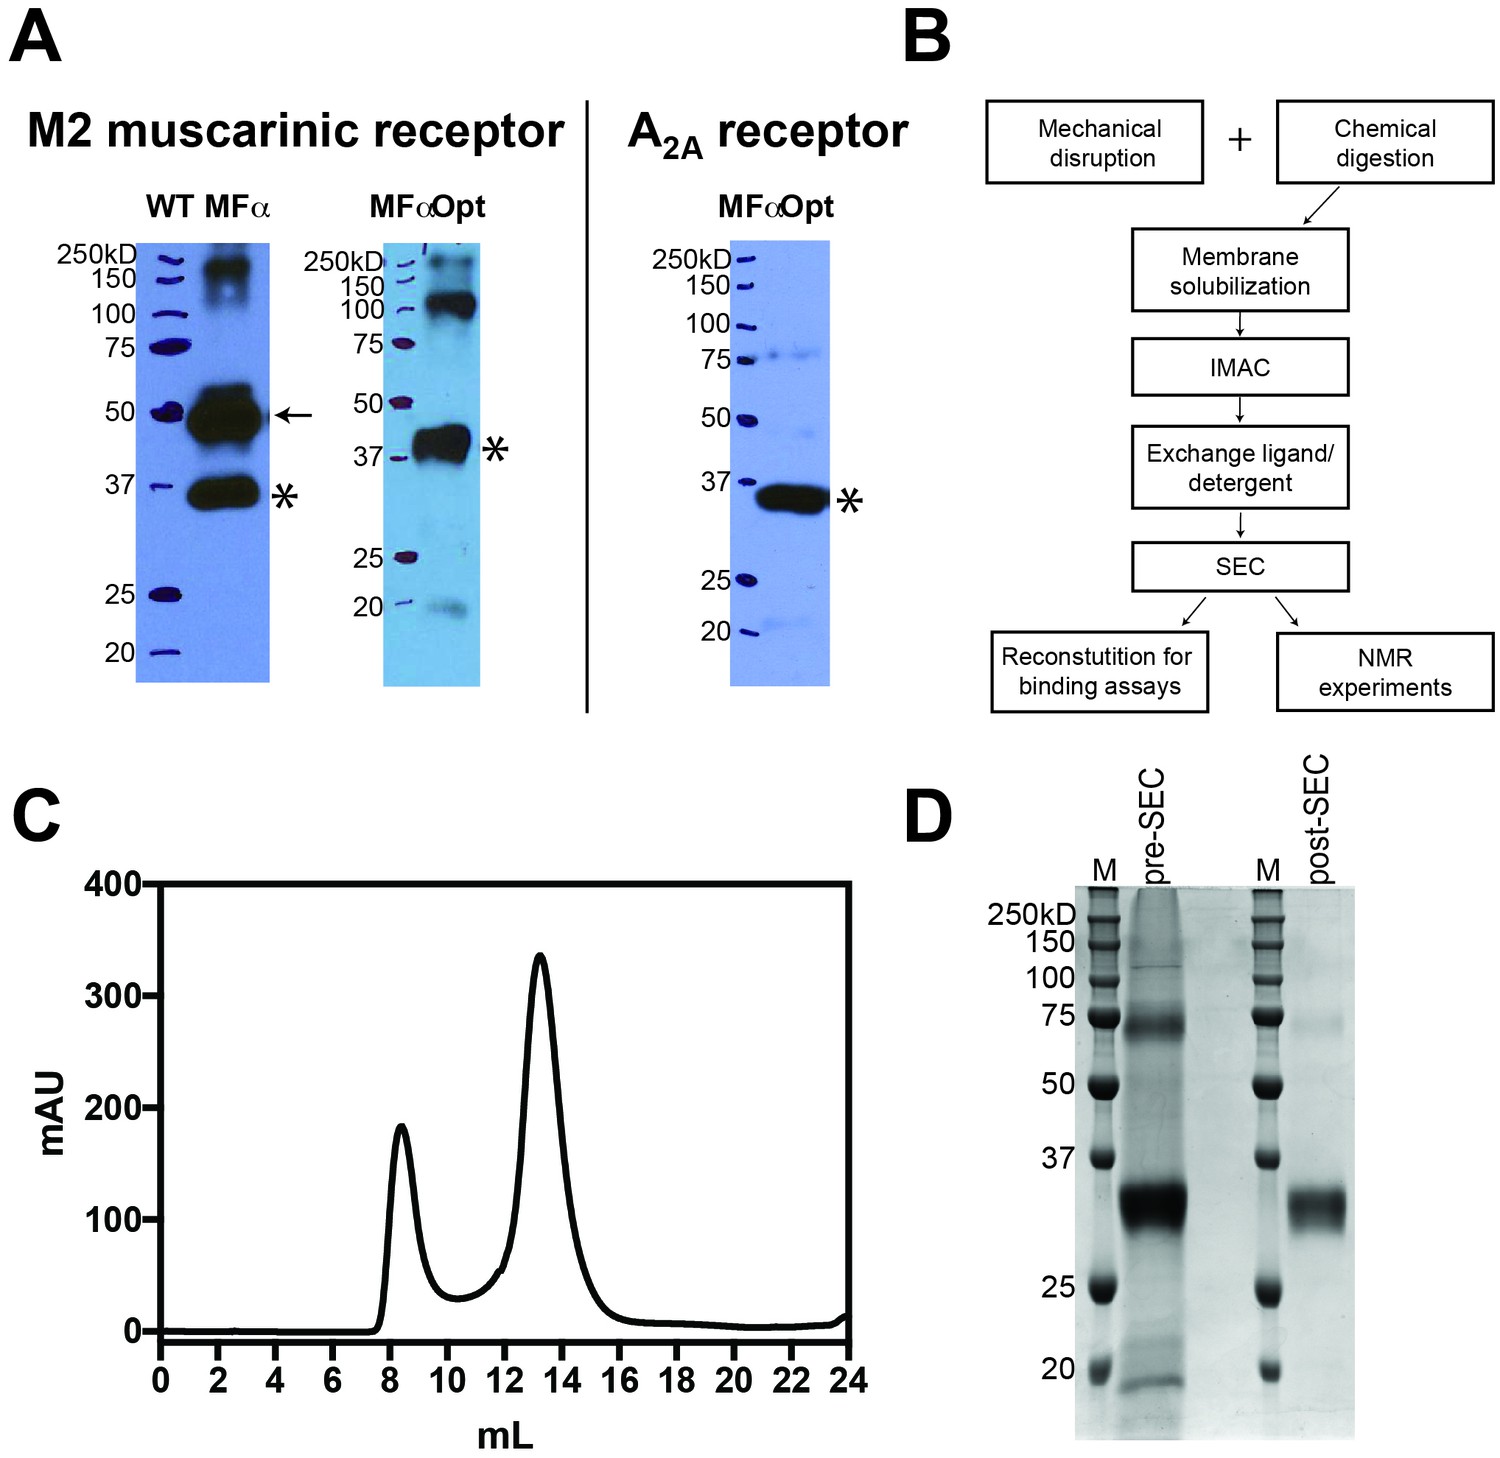
A2AR processing and purification.
(A) Anti-His6 Western blots of wild-type GPCRs expressed in Pichia as a fusion with the wild-type (WT) and optimized (MFαOpt) α-mating factor secretion signal. Receptor that has not been fully processed and trafficked to the plasma membrane is marked with an arrow. Fully processed, mature receptor is marked with an asterisk. (B) Purification scheme of A2AR from Pichia cultures. (C) Gel filtration trace of IMAC-purified A2AR injected on a Superdex200 10/300 column. The void volume is 8.3 mL and monomer A2AR elutes at approximately 13.7 mL. (D) SDS-PAGE of IMAC-purified A2AR before and after size exclusion chromatography shown in C).
Figure 1—figure supplement 2
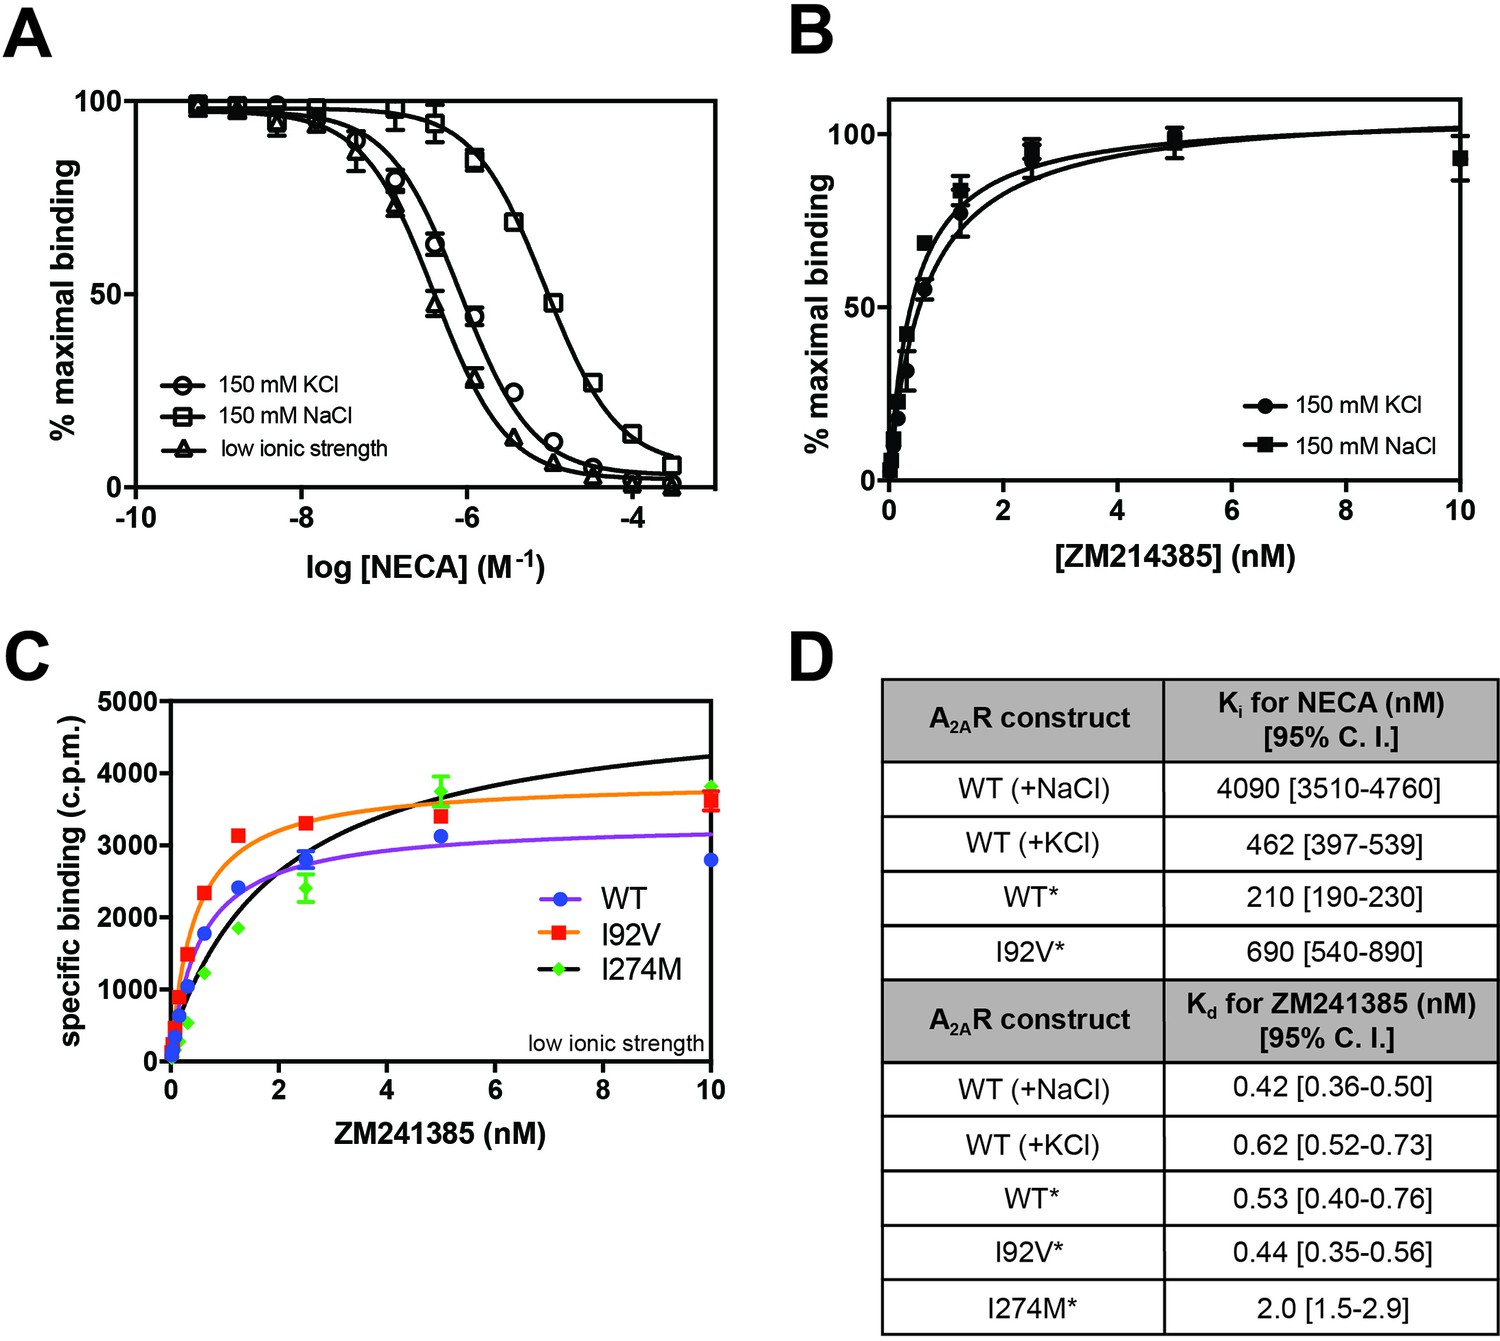
Ligand binding assays on A2AR yeast membranes.
(A) Competition binding curve of WT A2AR membranes incubated with [3H]-ZM241385 and increasing amounts of unlabeled NECA in low ionic strength assay buffer (50 mM Tris pH 7.4, 10 mM MgCl2, 1 mM EDTA) alone or supplemented with 150 mM NaCl or KCl. (B) Saturation curve of WT A2AR membranes incubated with increasing amounts of [3H]-ZM241385 in assay buffer containing 150 mM NaCl or KCl. Error bars in A) and B) represent standard deviation for three separate experiments, each performed in duplicate. (C) [3H]-ZM241385 saturation binding of two mutants that showed spectral differences. Binding experiments were carried out in assay buffer without additional NaCl or KCl added. (D) Table of Ki and Kd values of WT and mutant constructs tested in A-C with 95% confidence interval indicated. Additional buffer components in each assay are notated in parentheses, with an asterisk indicating low ionic strength buffer with no additional salt added.
Figure 2 with 3 supplements
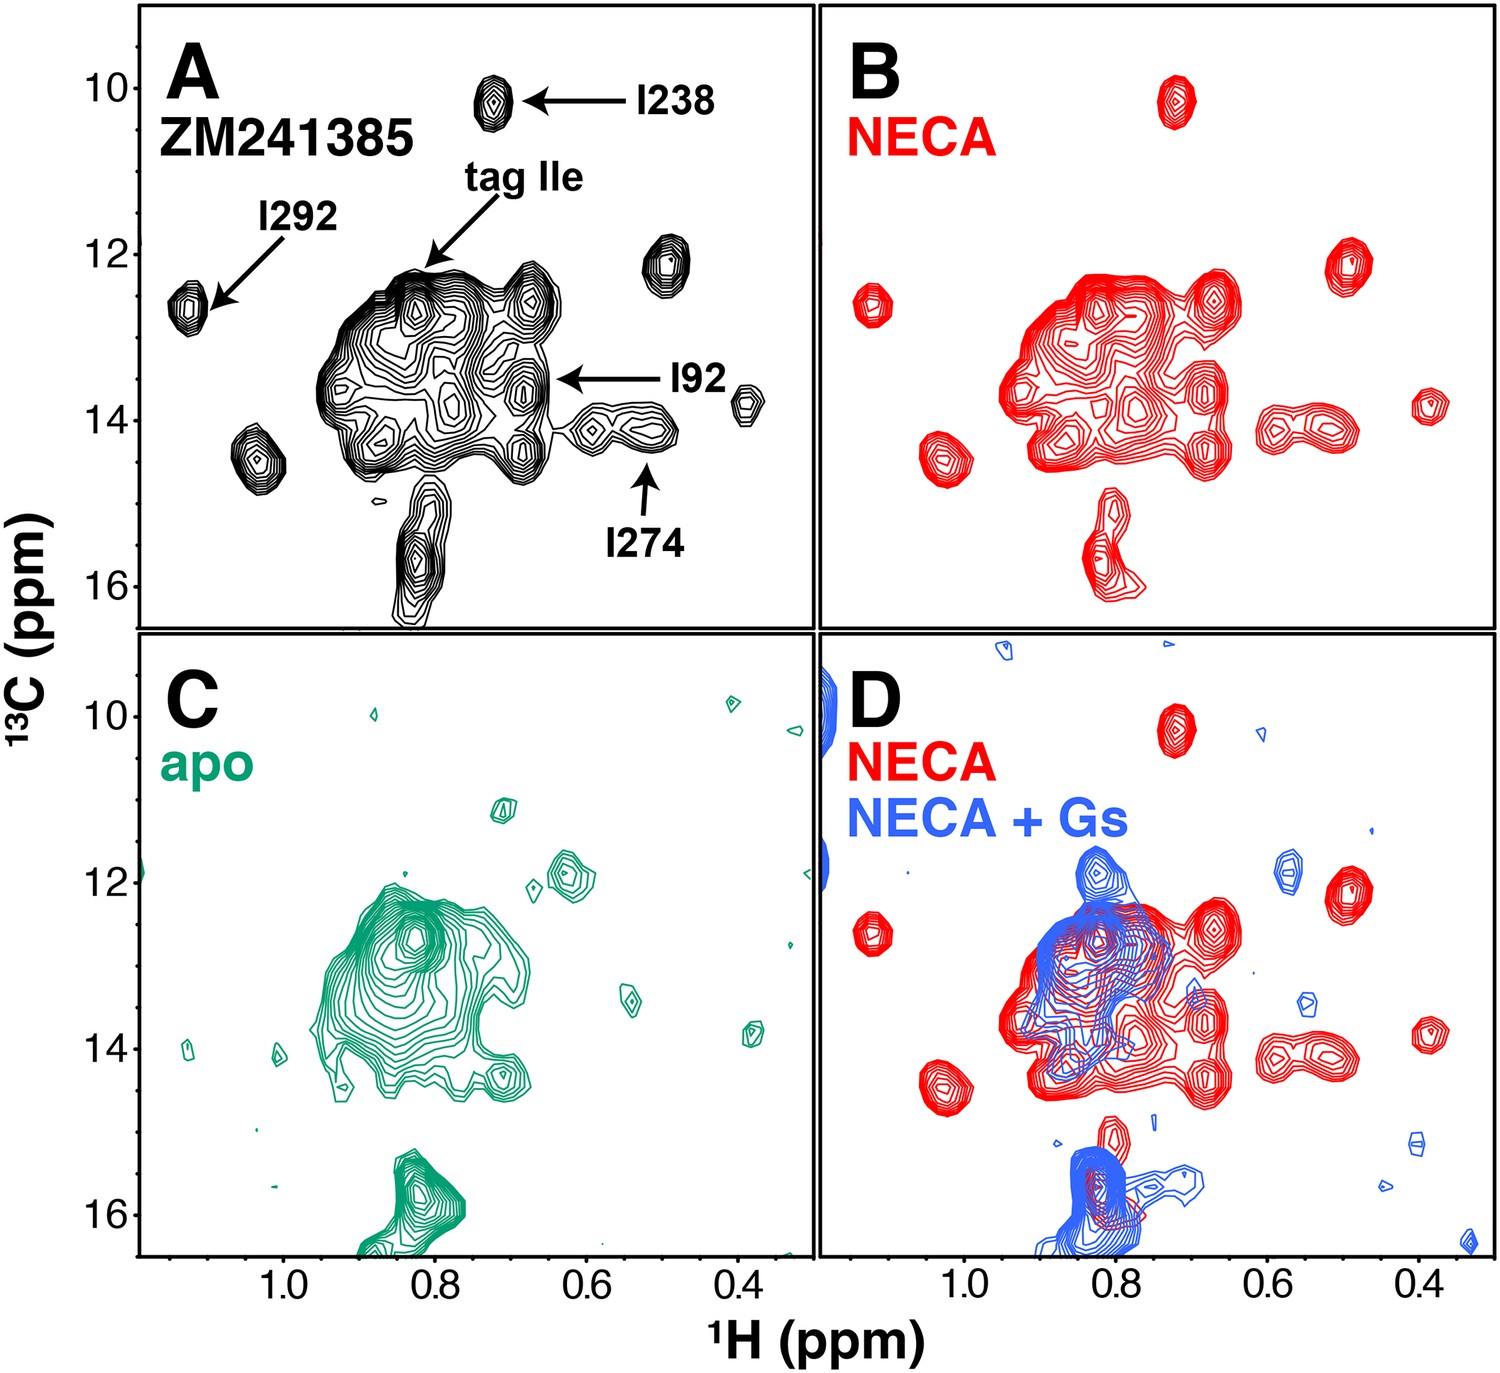
NMR spectra of A2AR in different liganded states with NaCl.
(A) 1H/13C HMQC spectrum of Ile δ1-labeled WT A2AR in DDM micelles and 150 mM NaCl with inverse agonist ZM241385 (black). Resonances assigned in this work (I923.40, I2386.40, I2747.39, I292, and the isoleucine residue in the protein C tag) are indicated with arrows. (B) 1H/13C HMQC spectrum of Ile δ1-labeled WT A2AR in DDM micelles and 150 mM NaCl with agonist NECA (red). See Figure 2—figure supplement 3 for comparison of initial NECA spectrum with spectrum after 7.5 hr acquisition. (C) 1H/13C HMQC spectrum of Ile δ1-labeled WT A2AR in DDM micelles and 150 mM NaCl without ligand (green). (D) 1H/13C HMQC spectra of Ile δ1-labeled WT A2AR in DDM micelles and 150 mM NaCl with agonist NECA (red) and with agonist NECA and Gs heterotrimer (blue).
Figure 2—figure supplement 1
A2AR and Gs complex formation.
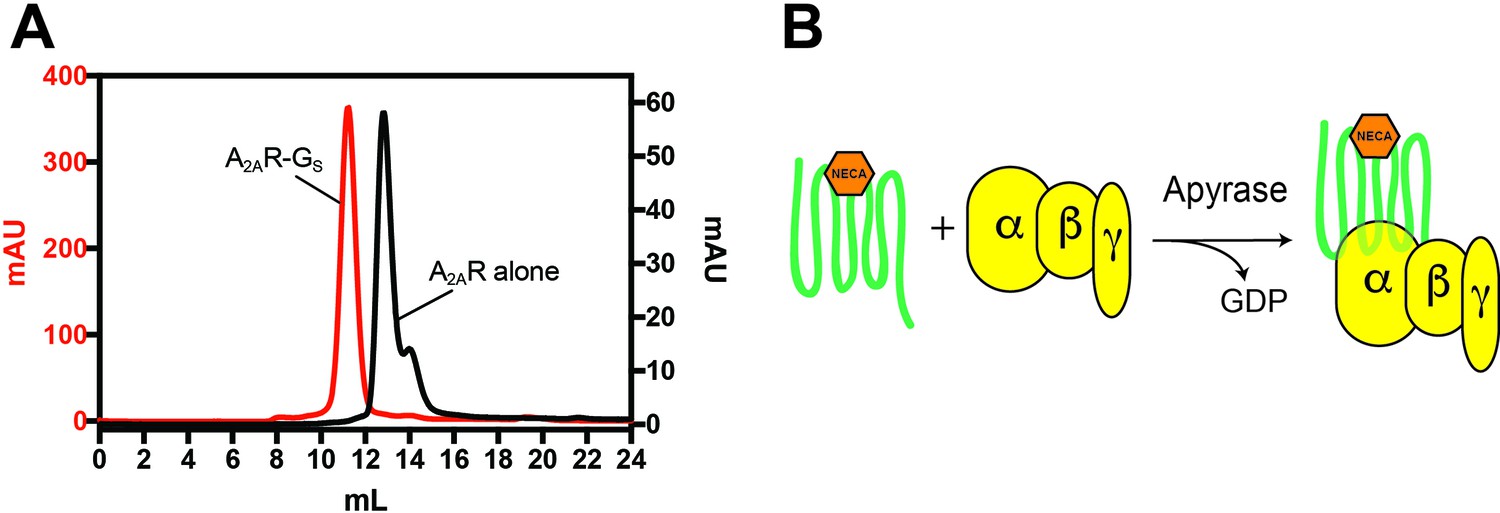
(A) Gel filtration trace of purified NECA-bound A2AR alone (black) and A2AR complexed with Gs heterotrimer (red) injected on a Superdex200 10/300 column. Total protein inputs were 360 μg and 833 μg, respectively. No free A2AR is detectable in the complex (red), demonstrating that the NECA-bound receptor is functional and the A2AR-Gs complex is stable. (B) Simplified schematic of A2AR-Gs complex formation. After incubation, apyrase is added which hydrolyzes nucleotide released during complex formation. Free nucleotide can cause dissociation of the A2AR-Gs complex.
Figure 2—figure supplement 2
Assignments of select Ile-δ1 methyl resonances in A2AR.
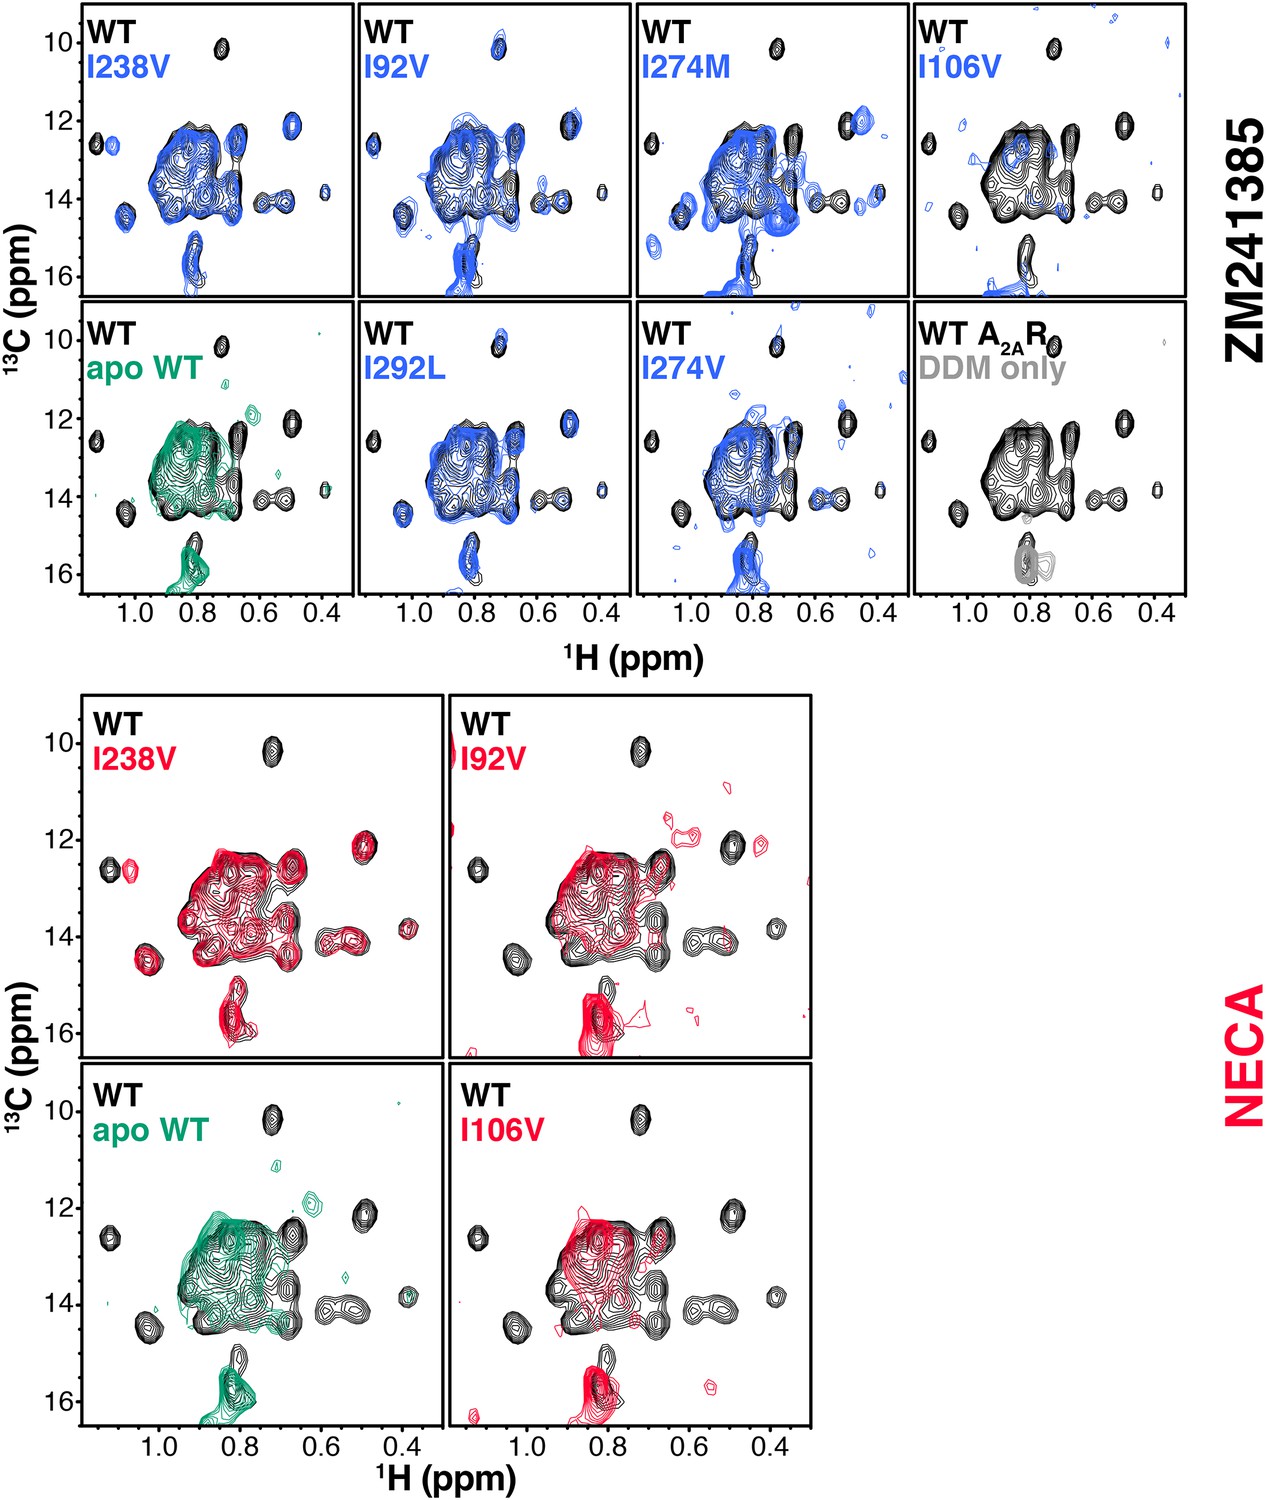
top - 1H/13C HMQC spectra of Ile δ1-labeled mutants (blue) of A2AR in DDM micelles with inverse agonist ZM241385 collected to make the assignments shown in Figure 2A, compared to the WT spectrum (black). The lower left panel shows the spectrum of apo WT (green) A2AR in DDM micelles compared to the spectrum in the presence of ZM241385 (black). The lower right panel shows the spectrum of DDM alone (gray) to demonstrate the non-protein origin of the peak at ~0.82 ppm 1H and 15–16 ppm 13C. bottom - 1H/13C HMQC spectra of Ile δ1-labeled mutants (red) of A2AR in DDM micelles with agonist NECA collected, compared to the WT spectrum (black). The bottom-left panel shows the spectrum of apo WT (green) A2AR in DDM micelles compared to the spectrum in the presence of NECA (black).
Figure 2—figure supplement 3

Lifetime of A2AR NMR sample.
(A) 1H/13C HMQC spectrum of Ile δ1-labeled WT A2AR in DDM micelles with agonist NECA collected immediately after final SEC column. (B) 1H/13C HMQC spectrum of the same Ile δ1-labeled WT A2AR in DDM micelles with agonist NECA collected after 7.5 hr of NMR experiment acquisition, showing loss of peak intensity but no major chemical shift changes.
Figure 3 with 1 supplement

Ligand- and cation-dependent chemical shift changes in A2AR.
(A) 1H/13C HMQC spectrum of Ile δ1-labeled WT A2AR in DDM micelles and 150 mM NaCl with inverse agonist ZM241385 (black). Residue numbers of assigned peaks and peak IDs of unassigned peaks are indicated in black. (B) 1H/13C HMQC spectrum of Ile δ1-labeled WT A2AR in DDM micelles and 150 mM NaCl with agonist NECA (red). (C) 1H/13C HMQC spectrum of Ile δ1-labeled WT A2AR in DDM micelles and 150 mM KCl with inverse agonist ZM241385 (brown). (D) 1H/13C HMQC spectrum of Ile δ1-labeled WT A2AR in DDM micelles and 150 mM KCl with agonist NECA (purple).
Figure 3—figure supplement 1
Overlays of ligand- and cation-dependent chemical shift changes in A2AR.
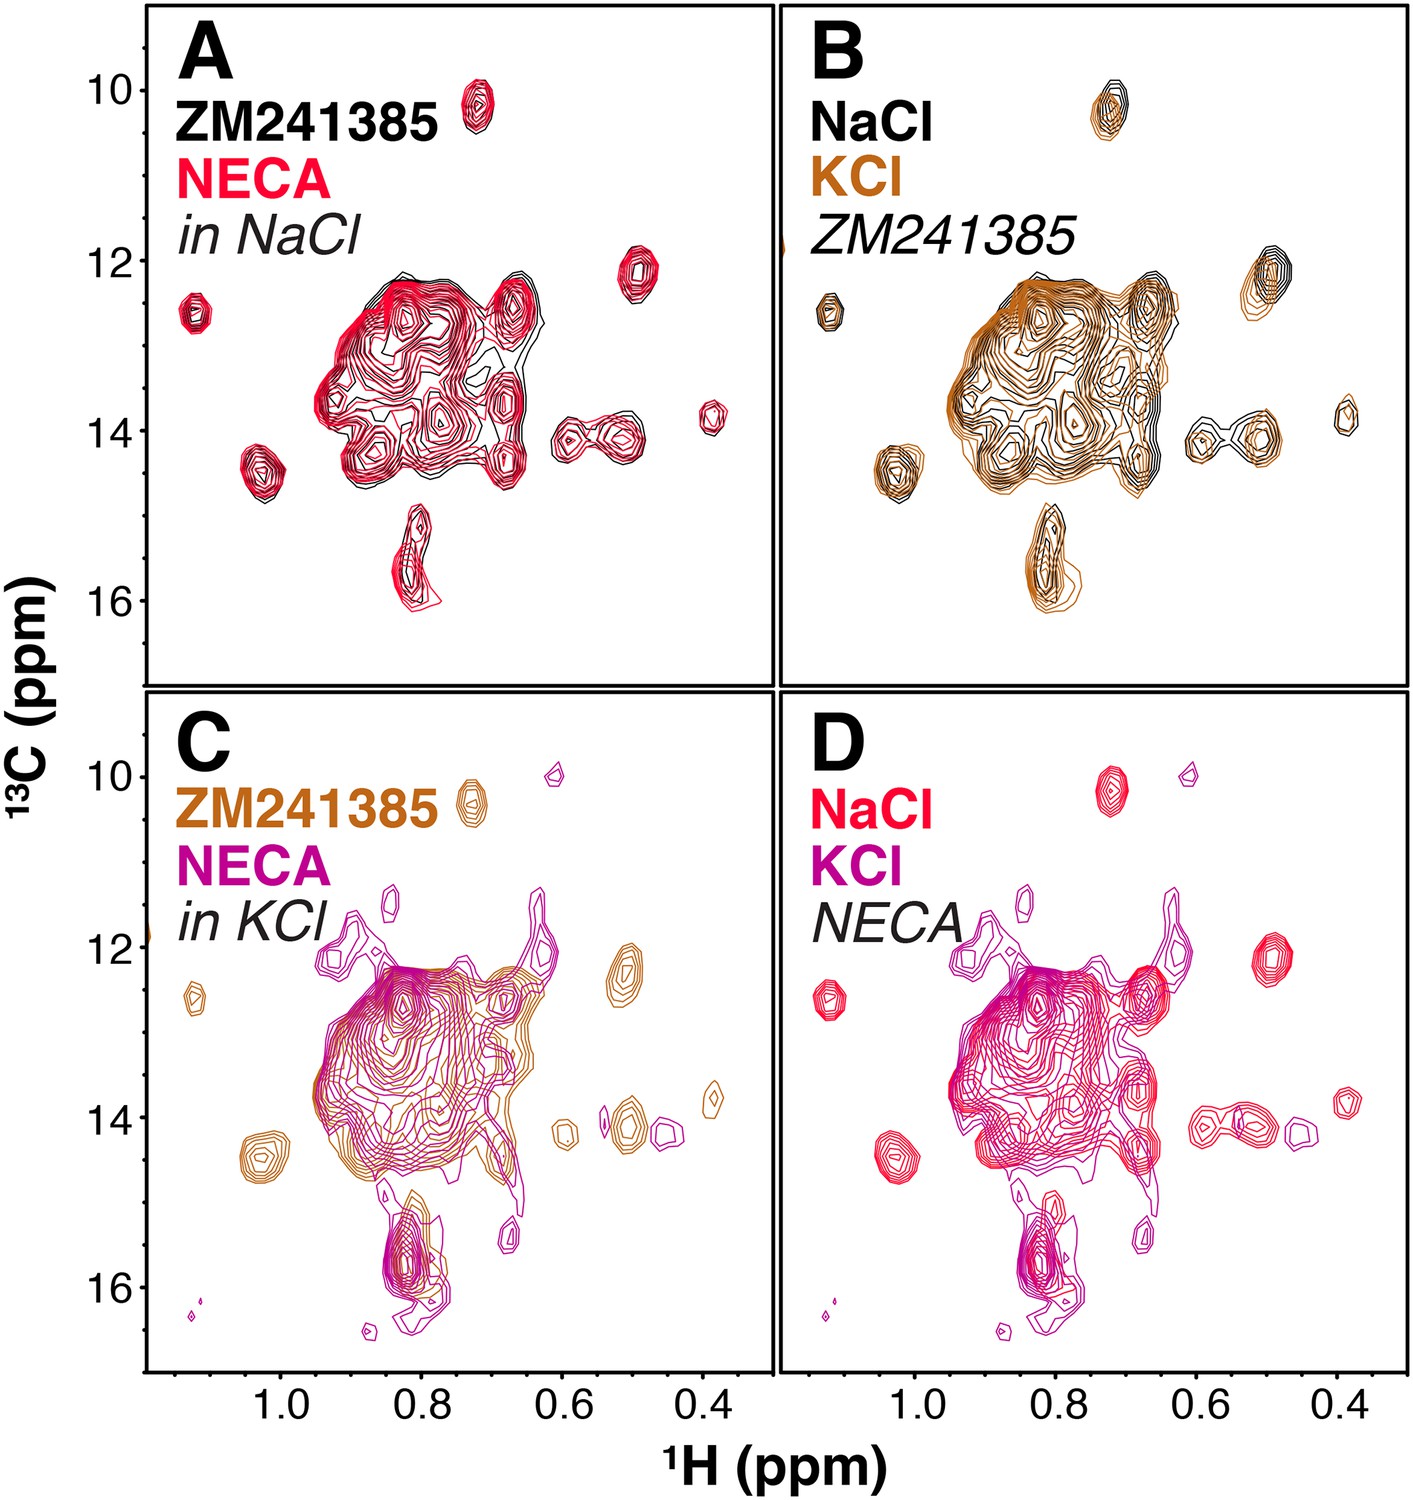
Overlays of pairs of spectra in Figure 3. (A) 1H/13C HMQC spectra of Ile δ1-labeled WT A2AR in DDM micelles and 150 mM NaCl with inverse agonist ZM241385 (black) and agonist NECA (red). (B) 1H/13C HMQC spectra of Ile δ1-labeled WT A2AR in DDM micelles and 150 mM NaCl (black) or 150 mM KCl (brown) with inverse agonist ZM241385. (C) 1H/13C HMQC spectra of Ile δ1-labeled WT A2AR in DDM micelles and 150 mM KCl with inverse agonist ZM241385 (burnt orange) and agonist NECA (purple). (D) 1H/13C HMQC spectra of Ile δ1-labeled WT A2AR in DDM micelles and 150 mM NaCl (red) or 150 mM KCl (purple) with agonist NECA.
Figure 4
Solvent PRE analysis of A2AR.
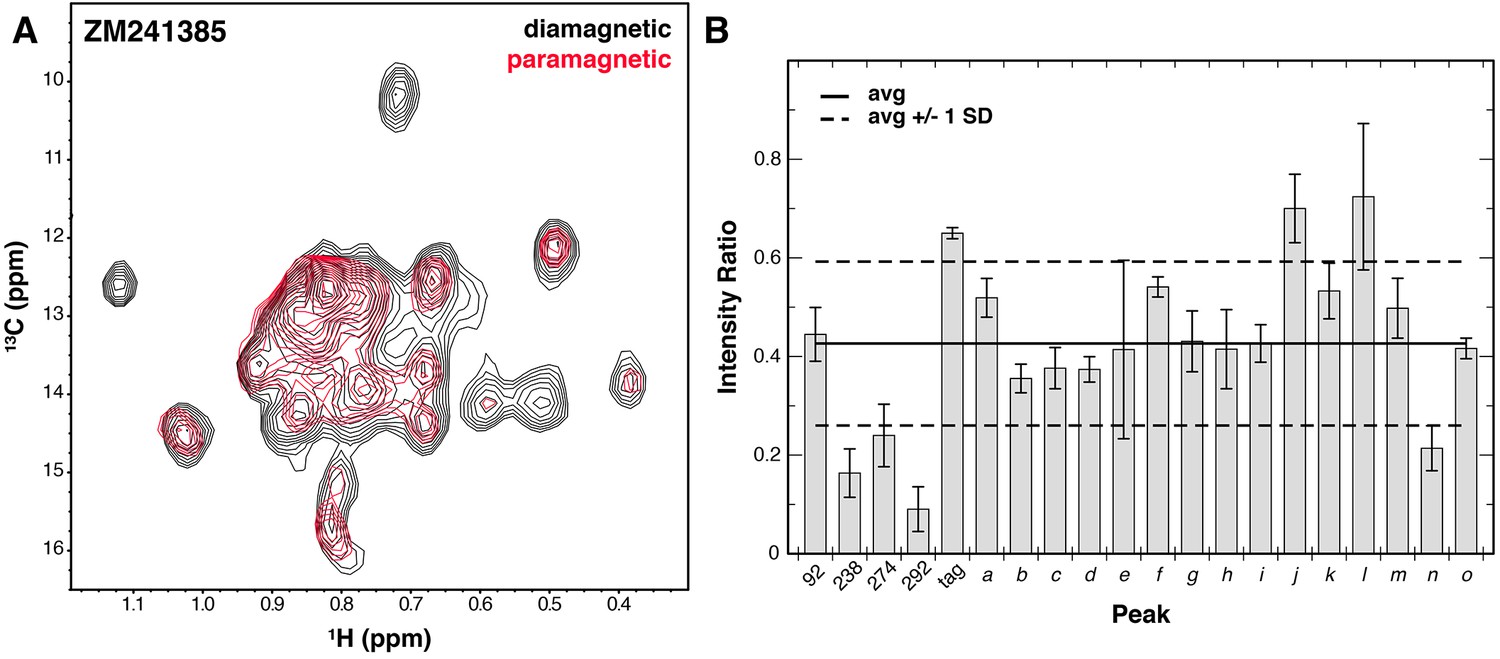
(A) Solvent PRE 1H/13C HMQC spectra of Ile δ1-labeled WT A2AR in DDM micelles with inverse agonist ZM241385 in the presence (red) and absence (black) of paramagnetic Gd3+-DTPA. Disappearance of peaks suggests solvent exposure. (B) Plot of intensity ratios between paramagnetic and diamagnetic samples for 20 peaks in the Ile δ1 region of the HMQC for A2AR complexed with inverse agonist ZM241385. The average (± 1 standard deviation) intensity ratio is shown as solid (dashed) black lines. Error bars show errors propagated from the noise of the NMR spectra. Assigned peaks are on the left of the plot, unassigned on the right. Peak IDs correspond to those in Figure 3A.
Figure 5 with 1 supplement
Modified 3Q relaxation for MBP.
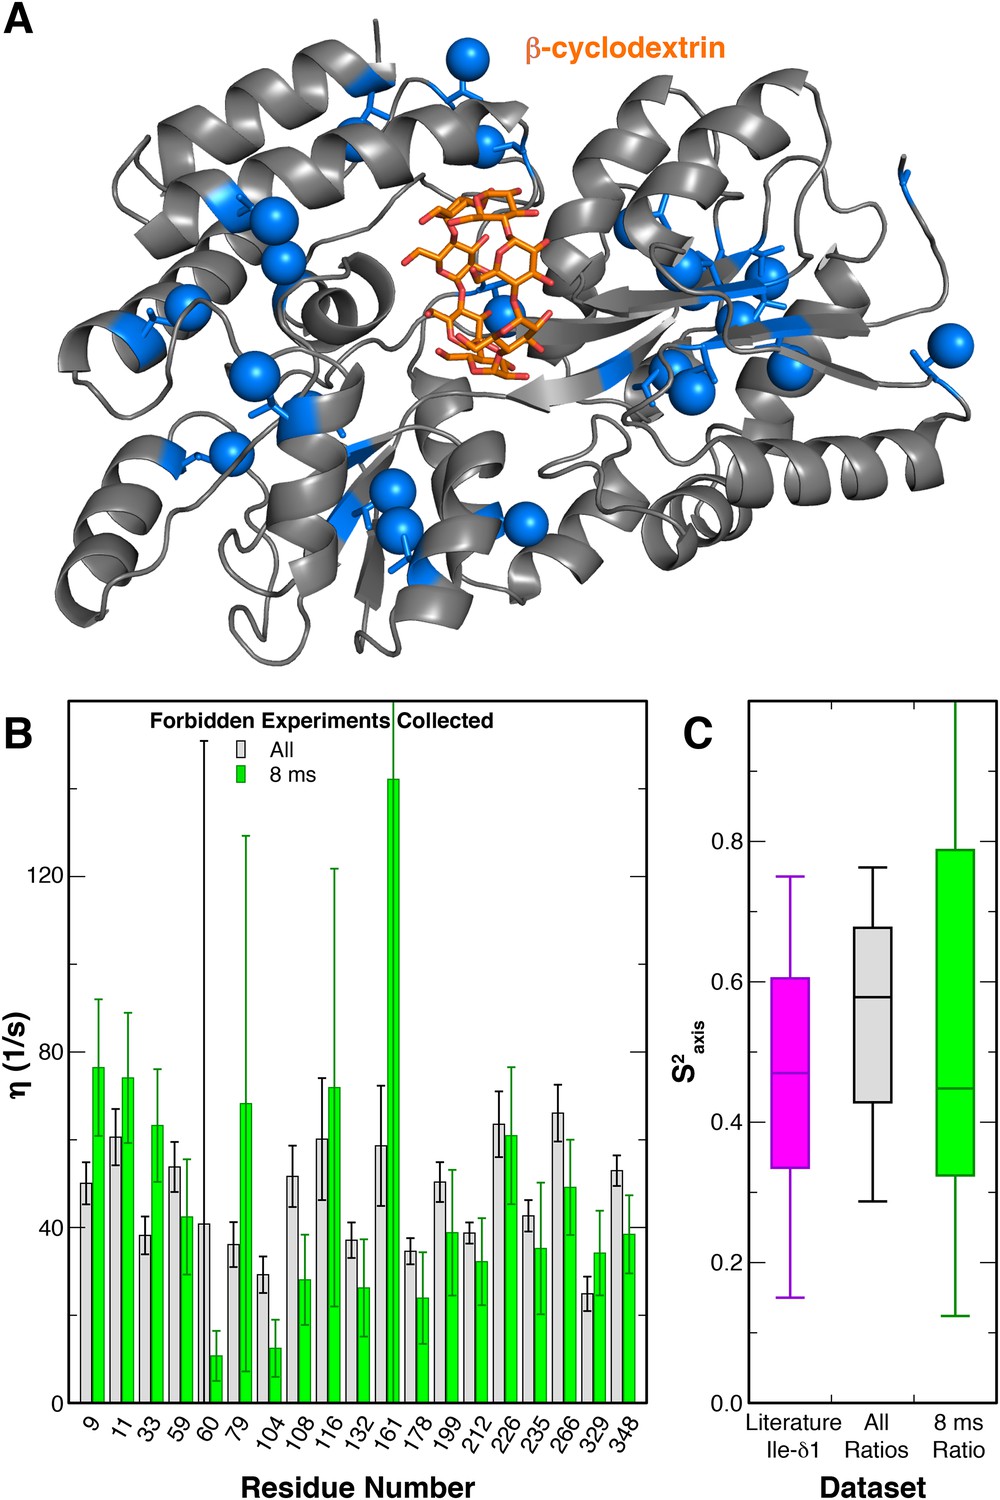
(A) Crystal structure of MBP complexed with β-cyclodextrin (PDB 1DMB[Sharff et al., 1993]). The β-cyclodextrin ligand is shown as orange sticks, while protein isoleucine residues are shown as blue sticks, with δ1 carbon atoms as spheres. (B) Plot of η values for each peak in MBP obtained from forbidden:allowed ratios at all five time points (gray) and the single 8 ms time point (green). Values calculated using the ratio at the single 8 ms time point show good agreement with those calculated using ratios at all five time points. (C) Box-and-whisker plot showing Ile δ1 S2axis values from a set of globular proteins (Mittermaier et al., 1999) (purple) and the S2axis values calculated from the η values using ratios at all time points (gray) and the single 8 ms time point (green).
Figure 5—figure supplement 1
Adaptation of 3Q methyl relaxation experiment to A2AR samples.
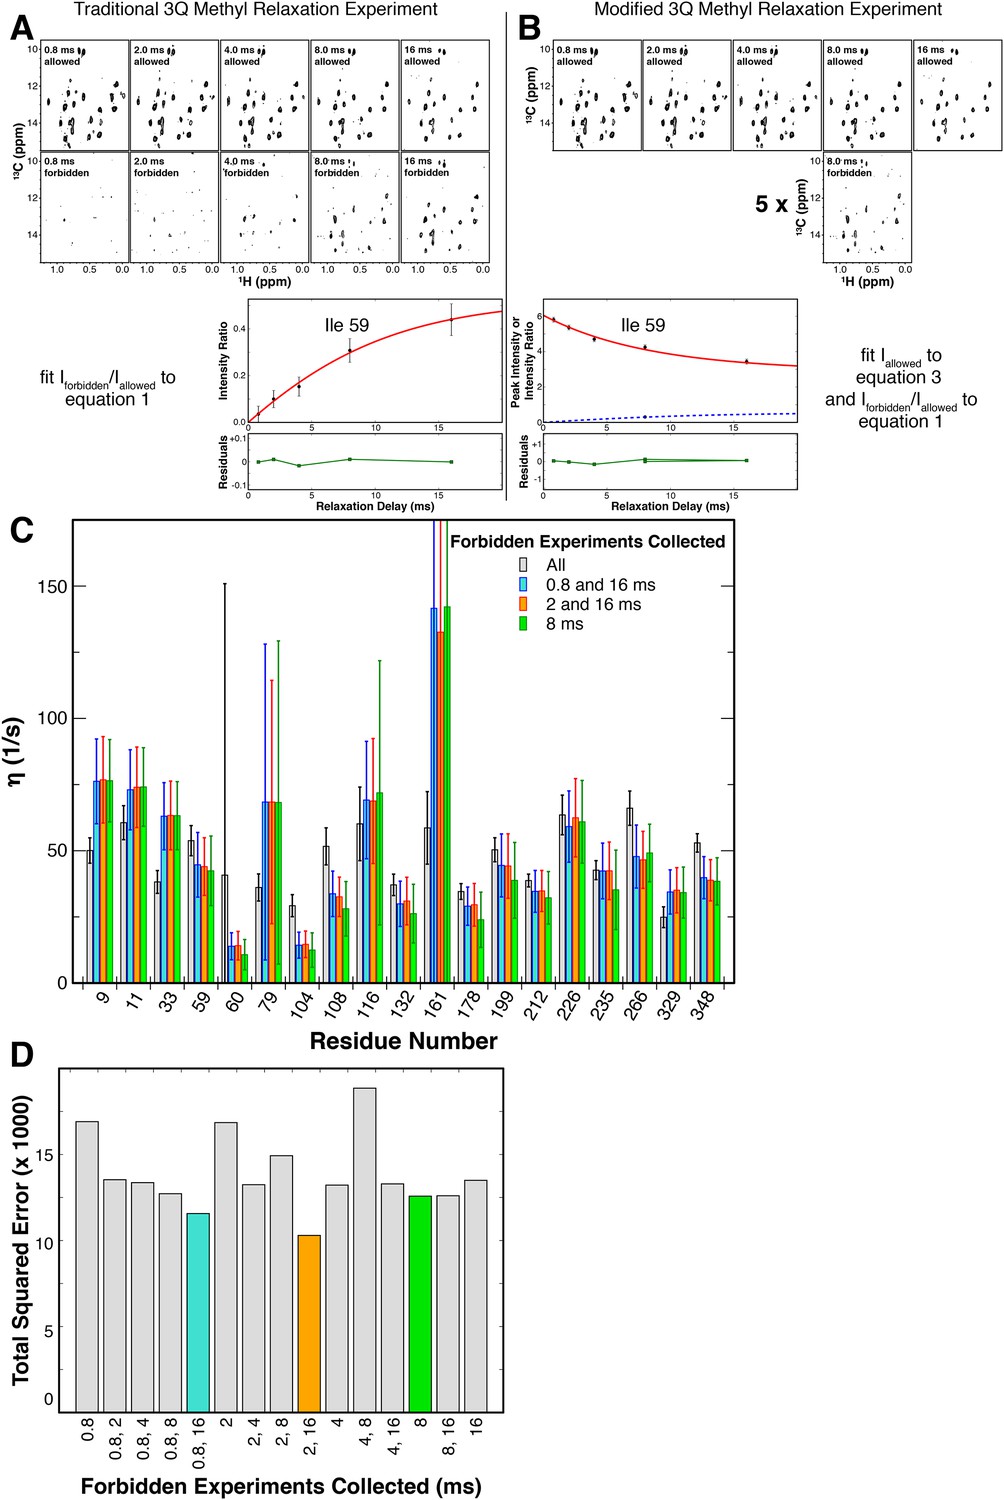
(A) Traditional 3Q methyl relaxation experiments (Sun et al., 2011) involve collecting matched pairs of allowed (SQ) and forbidden (MQ) spectra at several relaxation delay times, calculating the ratio of peak intensities, and fitting the buildup to a function of η, the difference between fast and slow R2 relaxation rates. (B) Due to short lifetime of A2AR samples (~12–14 hr at 30°C), the experiment was modified to reduce number of forbidden experiments, which have very low signal-to-noise and accordingly require long collection times. To do so, we evaluated alternatives requiring the collection of fewer forbidden spectra (down to the limiting case of a single spectrum), allowing for more scans for that time point. The decay in allowed spectra intensities was fit to a function of the fast and slow R2 rates, and the one calculated forbidden:allowed ratio to the same function of η. (C) A relaxation experiment with allowed and forbidden spectra at five relaxation delays was collected on MBP andη values were fit from forbidden:allowed ratios at all time points. The plot showsη values for each peak in MBP fit from forbidden:allowed ratios at all time points and three selected combinations of limited timepoints. η values calculated using the ratio at the single 8 ms time point show good agreement with the comparable values collected using other strategies, but can be collected in less time than the ones requiring two timepoints. (D) Plot of the sum of squared differences between η values calculated using ratios at all timepoints and each combination of limited timepoints. The two combinations of 2 time points giving the lowest error, and the one single time point giving the lowest error are shown in blue, orange, and green respectively.
Figure 6 with 1 supplement
Changes in dynamics of methyl groups of A2AR in the presence of different ligands.
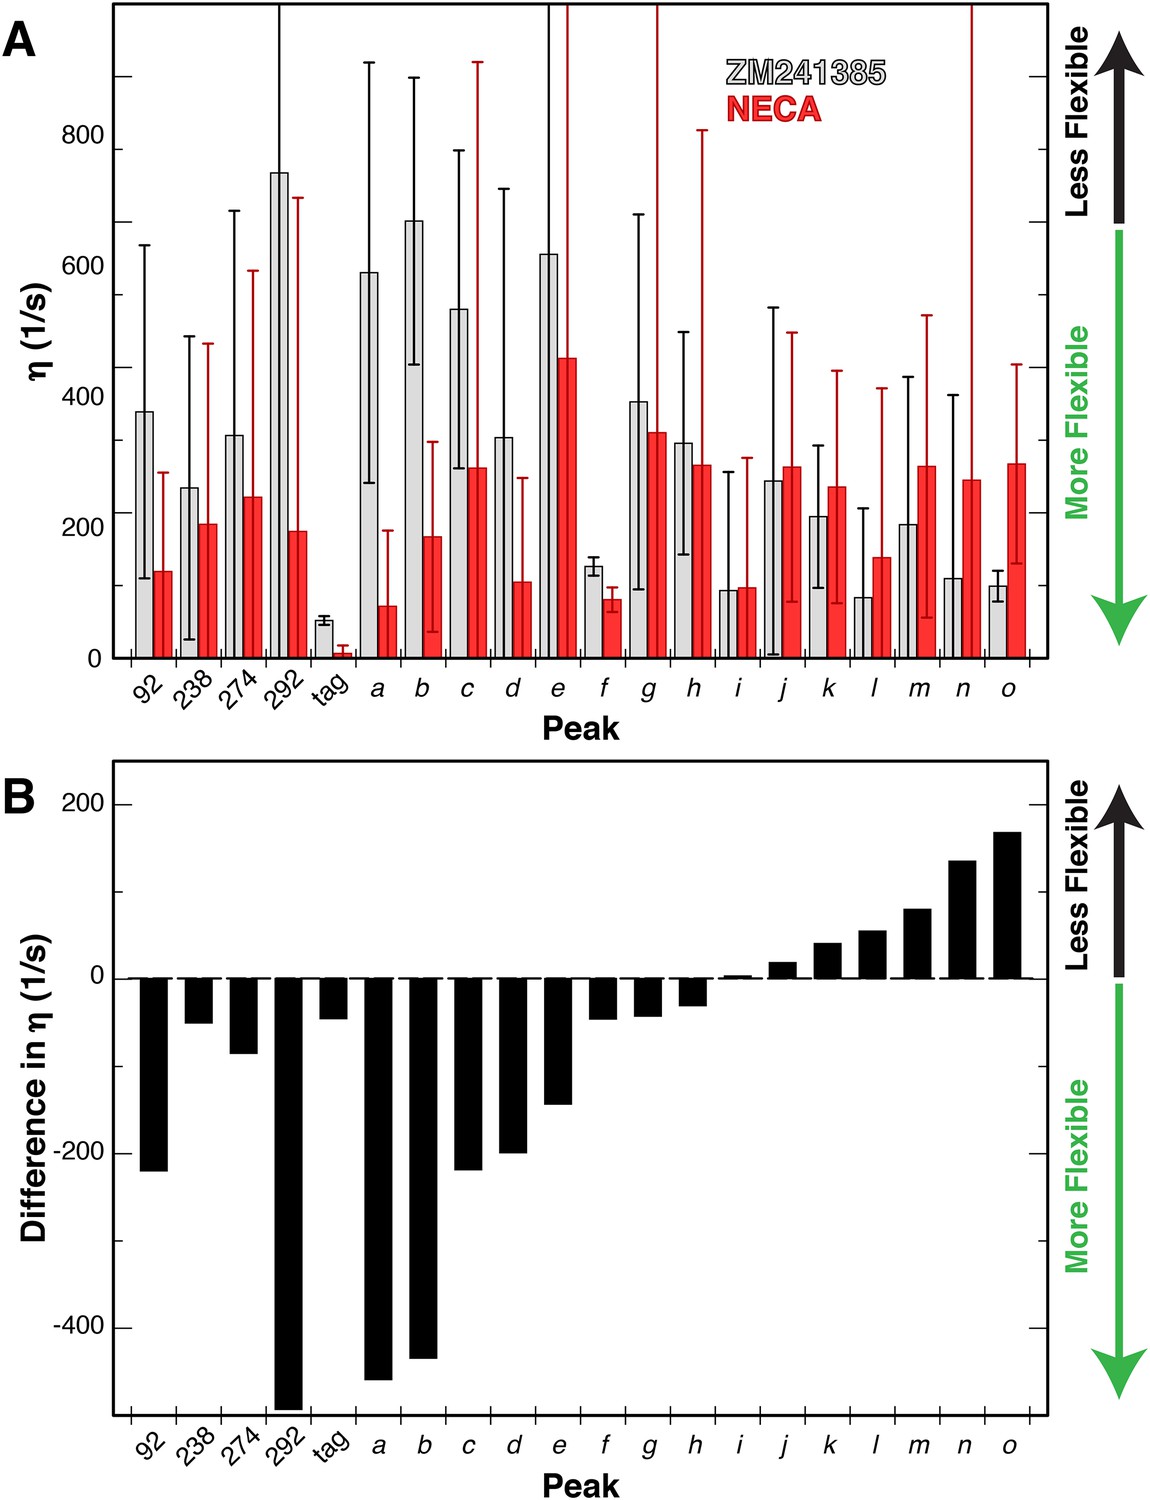
(A) Plot of the 1H-1H dipolar cross-correlation rateη, which is proportional to the S2axis order parameter, for 20 peaks in the Ile δ1 region for A2AR in DDM micelles with agonist NECA (red) and inverse agonist ZM241385 (grey). A higher η value corresponds to more rigid methyl groups. Error bars show bootstrap errors of the fit parameters, propagated from the noise of the NMR spectra. Assigned peaks are on the left of the plot, unassigned on the right. Peak IDs correspond to those in Figure 3A. (B) Plot of the ligand-induced differences (Δη = η[NECA] – η[ZM241385]) for 20 peaks in the Ile δ1 region for A2AR in DDM micelles. Negative Δη values, which are observed for the majority of peaks, indicate increased motions in the presence of agonist. Assigned peaks are on the left of the plot, unassigned on the right. Peak IDs correspond to those in Figure 3A.
Figure 6—figure supplement 1
Changes in dynamics of methyl groups of A2AR in the presence of different ligands from MD trajectories.
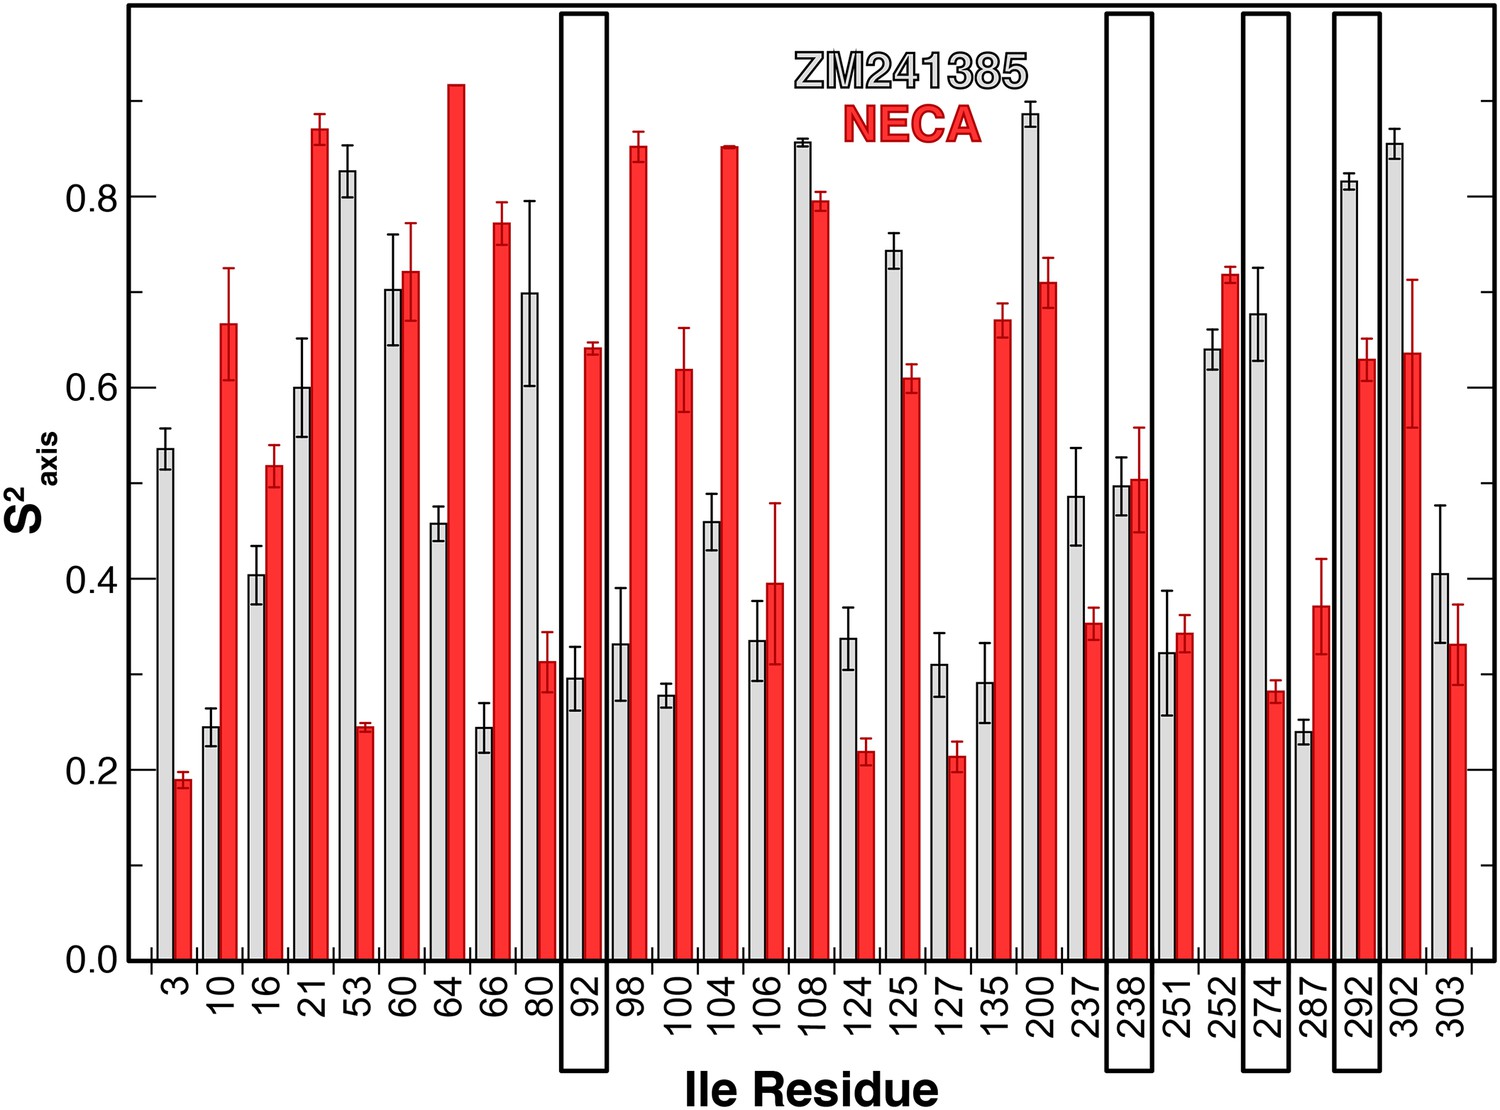
Plot of the S2axis order parameter for all 29 Ile δ1 methyl groups extracted from two ~ 100 ns MD simulations of A2AR in DDM micelles with agonist NECA (red) and inverse agonist ZM241385 (grey). A higher S2axis value corresponds to more rigid methyl groups. Order parameters were extracted from overlapping 40-ns windows after simulations converged; bars show the average of these values ± SD. Residues corresponding to assigned peaks are boxed.
Figure 7
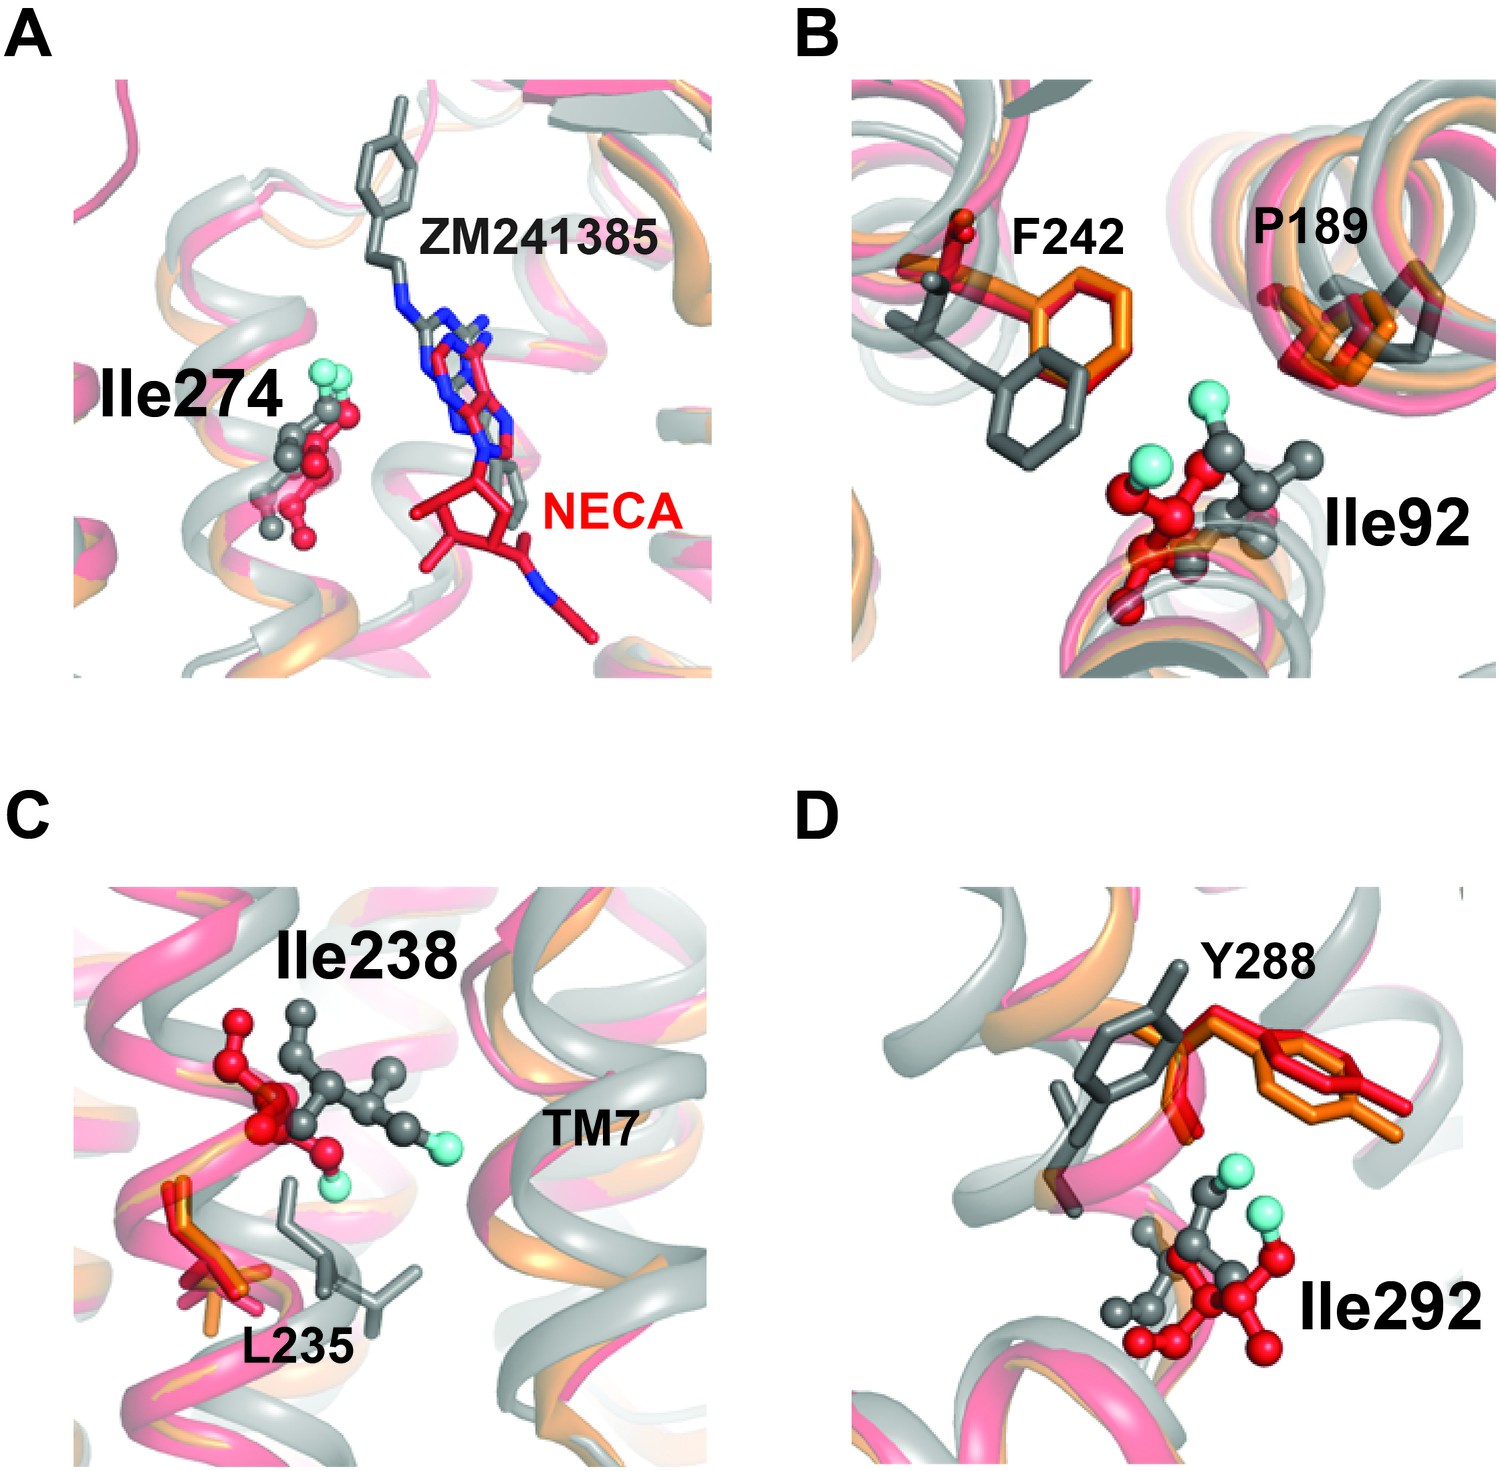
Structural contexts of isoleucine peak assignments.
A2AR ribbon diagrams are shown for structures solved in complex with inverse agonist ZM241385 (gray; PDB 4EIY[Liu et al., 2012b]), agonist NECA (red; PDB 2YDV[Lebon et al., 2011]), and agonist UK432097 (orange; 3QAK[Xu et al., 2011]). Assigned isoleucine residues are shown as spheres for the ZM241385- and NECA-bound structures using the same coloring scheme as in Figure 1A. Additional highlighted residues are shown as sticks in B-D. (A) Isoleucine 274 is part of the orthosteric binding pocket and makes direct contact with the adenine analogue and adenine rings in ligands ZM241385 and NECA, respectively (shown as sticks). (B) Isoleucine 92 sits below the binding pocket and interacts with nearby residues Pro189 and Phe242. Ile92, Pro189, and Phe242 all make structural rearrangements upon receptor activation. (C) On TM6, assigned peak Ile238 is one helical turn above Leu235. Leu235 is part of a conserved microswitch region that that undergoes outward motion during the transition to the active state. (D) Isoleucine 292 is at the cytoplasmic end of TM7 where it interacts with Tyr288, also part of the conserved NPXXY motif.
Additional files
-
Transparent reporting form
- https://doi.org/10.7554/eLife.28505.018
Download links
A two-part list of links to download the article, or parts of the article, in various formats.
Downloads (link to download the article as PDF)
Open citations (links to open the citations from this article in various online reference manager services)
Cite this article (links to download the citations from this article in formats compatible with various reference manager tools)
Ligand modulation of sidechain dynamics in a wild-type human GPCR
eLife 6:e28505.
https://doi.org/10.7554/eLife.28505


