Biochemical adaptations of the retina and retinal pigment epithelium support a metabolic ecosystem in the vertebrate eye
- University of Washington, United States
- West Virginia University, United States
- Fred Hutchinson Cancer Research Center, United States
Figures
Figure 1

Distribution of GLUT1 in retina.
(A) Immunoblot analysis of mouse tissue homogenates confirms GLUT1 is a major glucose transporter in mouse retina and RPE. 1 μg protein was loaded in each lane. No antibodies that we could validate were available for GLUT2. The Human Protein Atlas reports no expression of GLUT2 in retina (Uhlén et al., 2015). The blot shown is representative of 3 experiments. (B) Evidence that the protein immunoreactive with the GLUT1 antibody is membrane associated. Homogenates were centrifuged and equivalent percentages of total supernatant (S) and total pellet (P) were probed with the GLUT1 antibody. (C) GLUT1 immunoreactivity in mouse retina. Rod inner segments are identified by the unique morphology of their mitochondria labeled with mitochondrial cytochrome oxidase one antibody (MT-COX1). White arrowhead indicates the layer of MGC mitochondria. (D) Müller cells are identified by glutamine synthetase (GS) immunoreactivity. (E) Serial block face scanning electron microscopy of mouse retina. The inner segment of one rod cell is shown in blue with its mitochondria shown as multi-colored. The green structures are apical processes of MGCs. (F) Differences in location and morphology between rod mitochondria and MGC mitochondria in mouse retina. For clarity not all of the mitochondria are shown. MGC mitochondria are located just below the outer limiting membrane. (G) Distributions of rod arrestin and GLUT1 in a partially light-adapted mouse retina. (H) Distribution of GLUT1 and distribution of GFP expressed from the rod-specific Nrl promoter. PR OS, photoreceptor outer segment; PR IS photoreceptor inner segment; ONL, outer nuclear layer; OPL, outer plexiform layer; INL inner nuclear layer; IPL inner plexiform layer; GCL, ganglion cell layer. Scale bars in C, D and G represent 20 μm.
Figure 2

Fluorescent glucose (2-NBDG) accumulates in photoreceptors after oral gavage.
(A) 2-NBDG (green) accumulation in a mouse retina 20 min after oral gavage. MGCs are identified by tdTomato expression in cells in which the Rlbp1 promoter is active. (B) 2-NBDG accumulation in a zebrafish retina 30 min after oral gavage. MGCs are identified by tdTomato expressed from the GFAP promoter. Labels on the right of panels A and B represent approximate positions of the retinal layers, (C) Quantification of 2-NBDG fluorescence from mouse retinas (n = 5 animals, 17 slices for 20 min 2-NBDG; three animals, 8 slices for 1 hr 2-NBDG; three animals, eight slices for saline). FNBDG/Fsaline compares fluorescence from retinas of mice gavaged with 2-NBDG vs. with saline. Error bars report SEM. (D) Quantification of 2-NBDG fluorescence from zebrafish retinas (three animals, 8 slices for 30 min 2-NBDG; two animals, three slices for saline). PR OS, photoreceptor outer segments; PR IS, photoreceptor inner segments; ONL, outer nuclear layer; OPL, outer plexiform layer; INL, inner nuclear layer; IPL, inner plexiform layer; GCL, ganglion cell layer. Scale bars represent 20 μm. * indicates p<0.05 and ** indicates p<0.01 for the comparison of FNBDG to Fsaline.
Figure 3

Differences in metabolic flux in retina and RPE.
(A) Total metabolite levels (pmoles per μg protein) in mRetina (red) and hfRPE (black). (n = 11) Note the different scales for the left and right panels. *p<0.05 and **p<0.01. (B) Incorporation of 13C from [1,2] 13C glucose into metabolites in mRetina and hfRPE cells (pmoles per μg protein). Each of the isotopomers shown is derived from glucose metabolized by glycolysis. Note the different scales for the top, middle and bottom panels. (n = 3 for each time point; error bars represent standard deviation). (C) Incorporation in mRetina and hfRPE cells of 13C from 5 mM U-13C glucose into metabolites after 5 min. The % of total isotopomers that are m2 and m3 are shown.
Figure 4
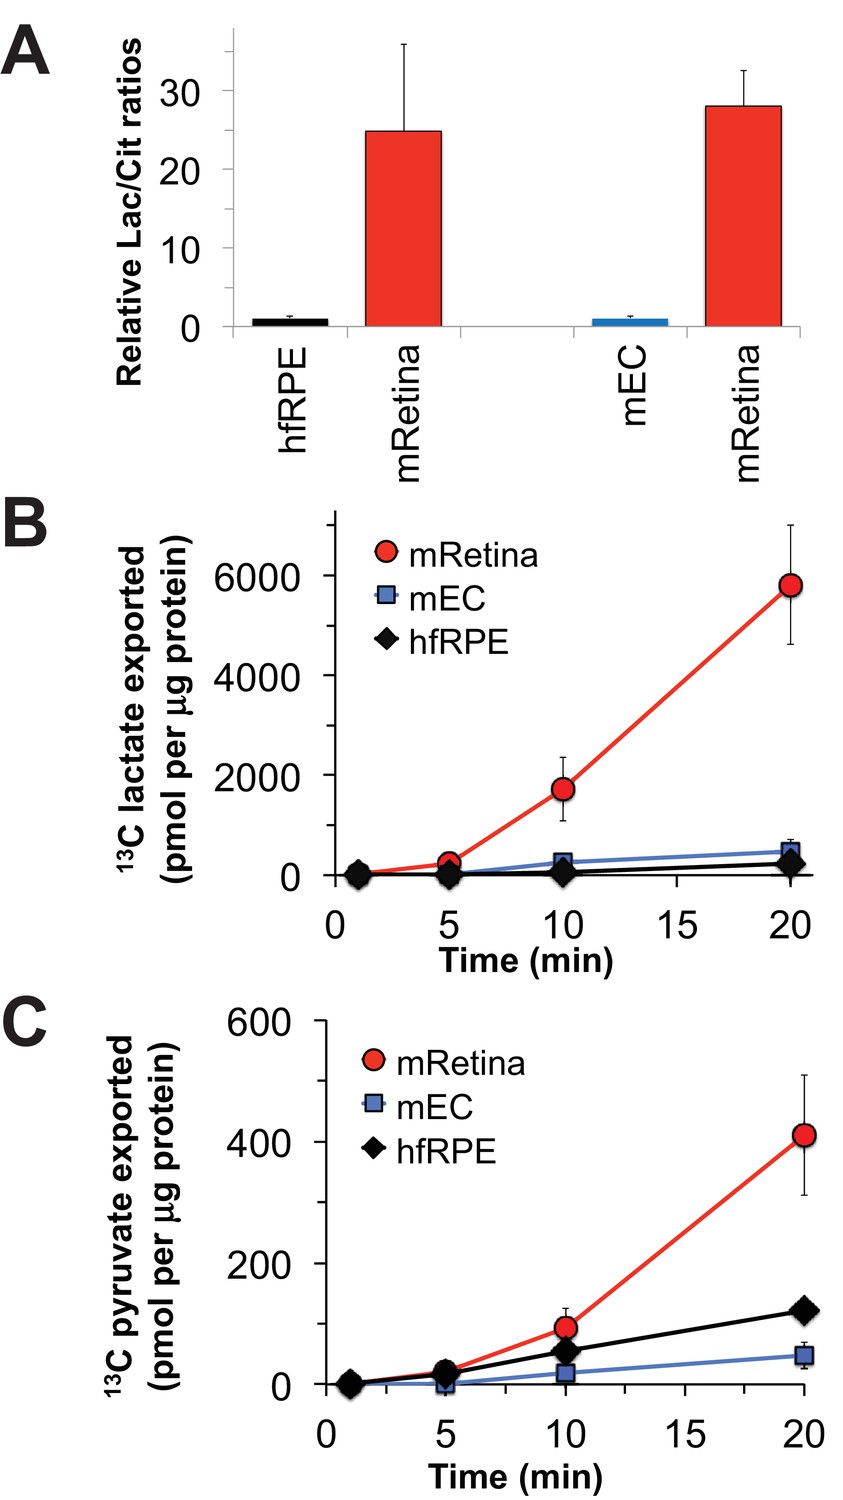
Comparisons of metabolic flux in mouse retina (mRetina), mouse eyecup (mEC), and human fetal RPE (hfRPE).
(A) Ratios of total intracellular lactate/citrate in both hfRPE and mEC are about 1/25 of the lactate/citrate ratio in mRet. (B) Accumulation of m3 13C lactate in the medium in which either mRetina (n = 4), mEC (n = 4) or hfRPE (n = 3) were incubated with 5 mM U-13C glucose. (C) Accumulation of m3 13C pyruvate in the media in which either mRetina (n = 4), mEC (n = 4) or hfRPE (n = 3) were incubated with 5 mM U-13C glucose. Error bars report standard error of the mean.
Figure 5
Incorporation of 13C from lactate into metabolic intermediates in hfRPE cells.
(A) Comparison of initial rates of labeling (at 5 and 10 min after introduction of labeled fuel) from 5 mM U-13C glucose vs. from 10 mM U-13C lactate (with 1 mM unlabeled glucose also present). Citrate and malate take up label faster from lactate than from glucose. (B) Time courses of incorporation of 13C from 10 mM U-13C lactate (with 1 mM unlabeled glucose also present) into hfRPE metabolites accompanied by schematic illustrations of the labeled species in the context of the TCA cycle. (n = 2–3 for each time point; error bars represent range or standard deviation).
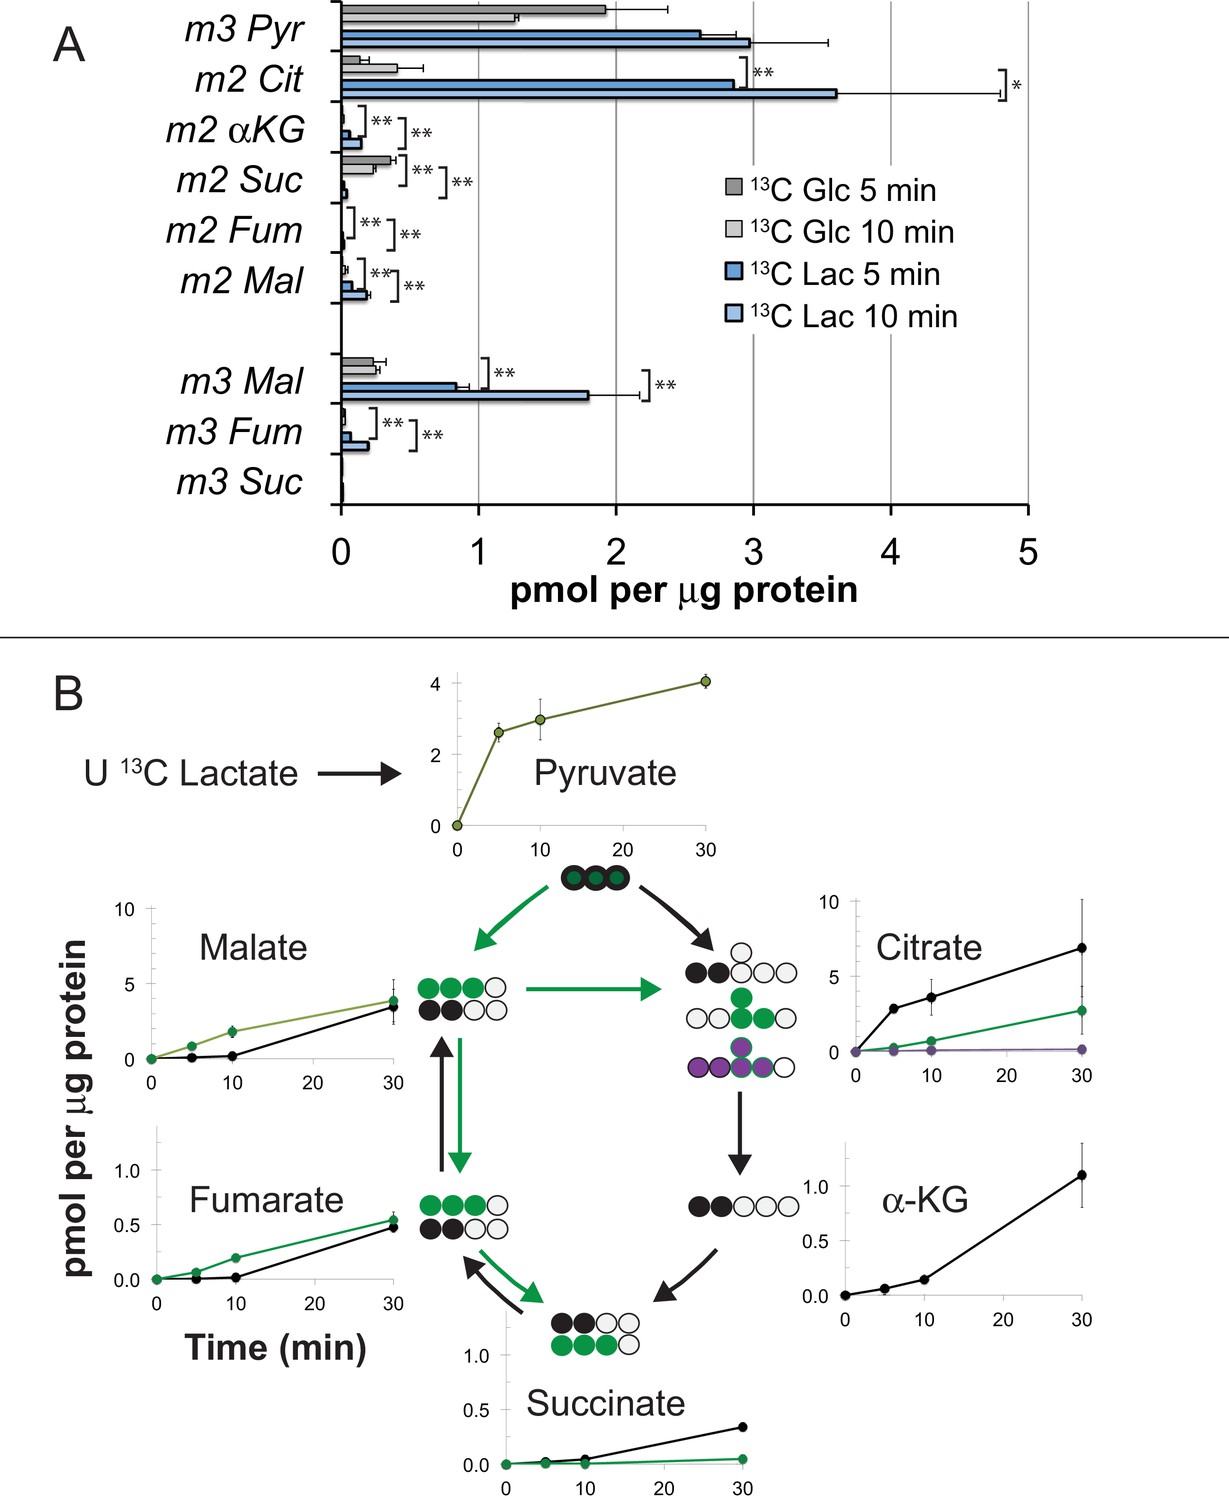
Figure 6

Comparison of lactate metabolism in hfRPE with lactate metabolism in mouse retinas and mouse eyecups with retinas removed.
The high relative abundance of m3 metabolites derived from carboxylation reactions and the high abundance of fumarate, malate and aspartate in hfRPE cells resemble the metabolite distributions in the RPE enriched eyecup more than the distributions in retina. Each preparation was incubated with 10 mM U-13C lactate for the specified times and metabolites were extracted, derivatized and quantified by GC-MS. (n = 2 for hfRPE, n = 3 for mEyecup and n = 4 for mRetina; error bars represent range or standard deviations.).
Figure 7
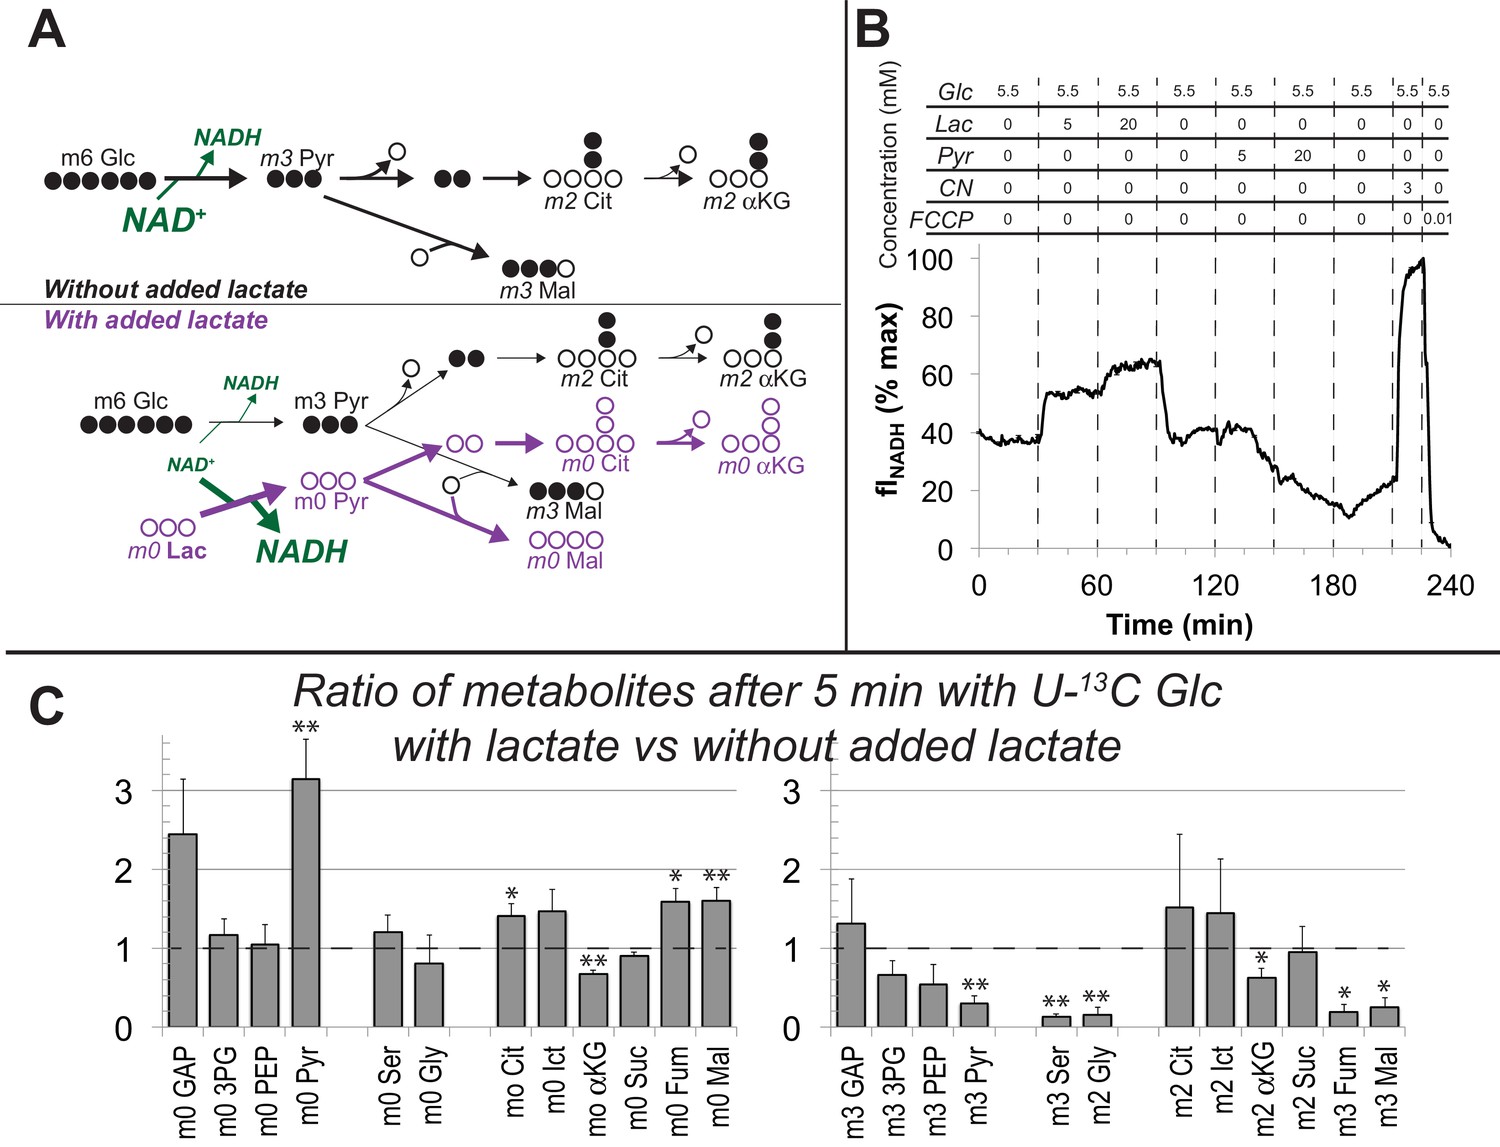
Lactate suppresses oxidation of glucose by hfRPE cells.
(A) Schematic prediction of how U-13C Glc (‘m6 Glc’) would be metabolized without lactate (top) vs. with lactate (bottom). We hypothesized that lactate would suppress glycolysis of m6 Glc by depleting NAD+. The model also predicts that unlabeled (m0) pyruvate and TCA cycle intermediates become more abundant. (B) Effect of lactate and pyruvate on total cellular NADH measured by fluorescence in a monolayer of hfRPE cells as described in methods. The graph shows the average from 3 individual cells and is representative of 3 similar experiments. (C) Ratios of metabolites after 5 min with U-13C Glc with unlabeled lactate (20 mM) vs. without added lactate. Lactate substantially increases the total amounts of unlabeled (m0) GAP, pyruvate, citrate, isocitrate, fumarate and malate (left panel) in hfRPE cells. The right panel shows that lactate suppresses the incorporation of 13C from 5 mM 13C Glc into glycolytic and TCA intermediates. (n = 3; error bars represent SEM, * indicates p<0.05 and ** indicates p<0.01 for the comparison of with vs. without added unlabeled lactate.
Figure 8
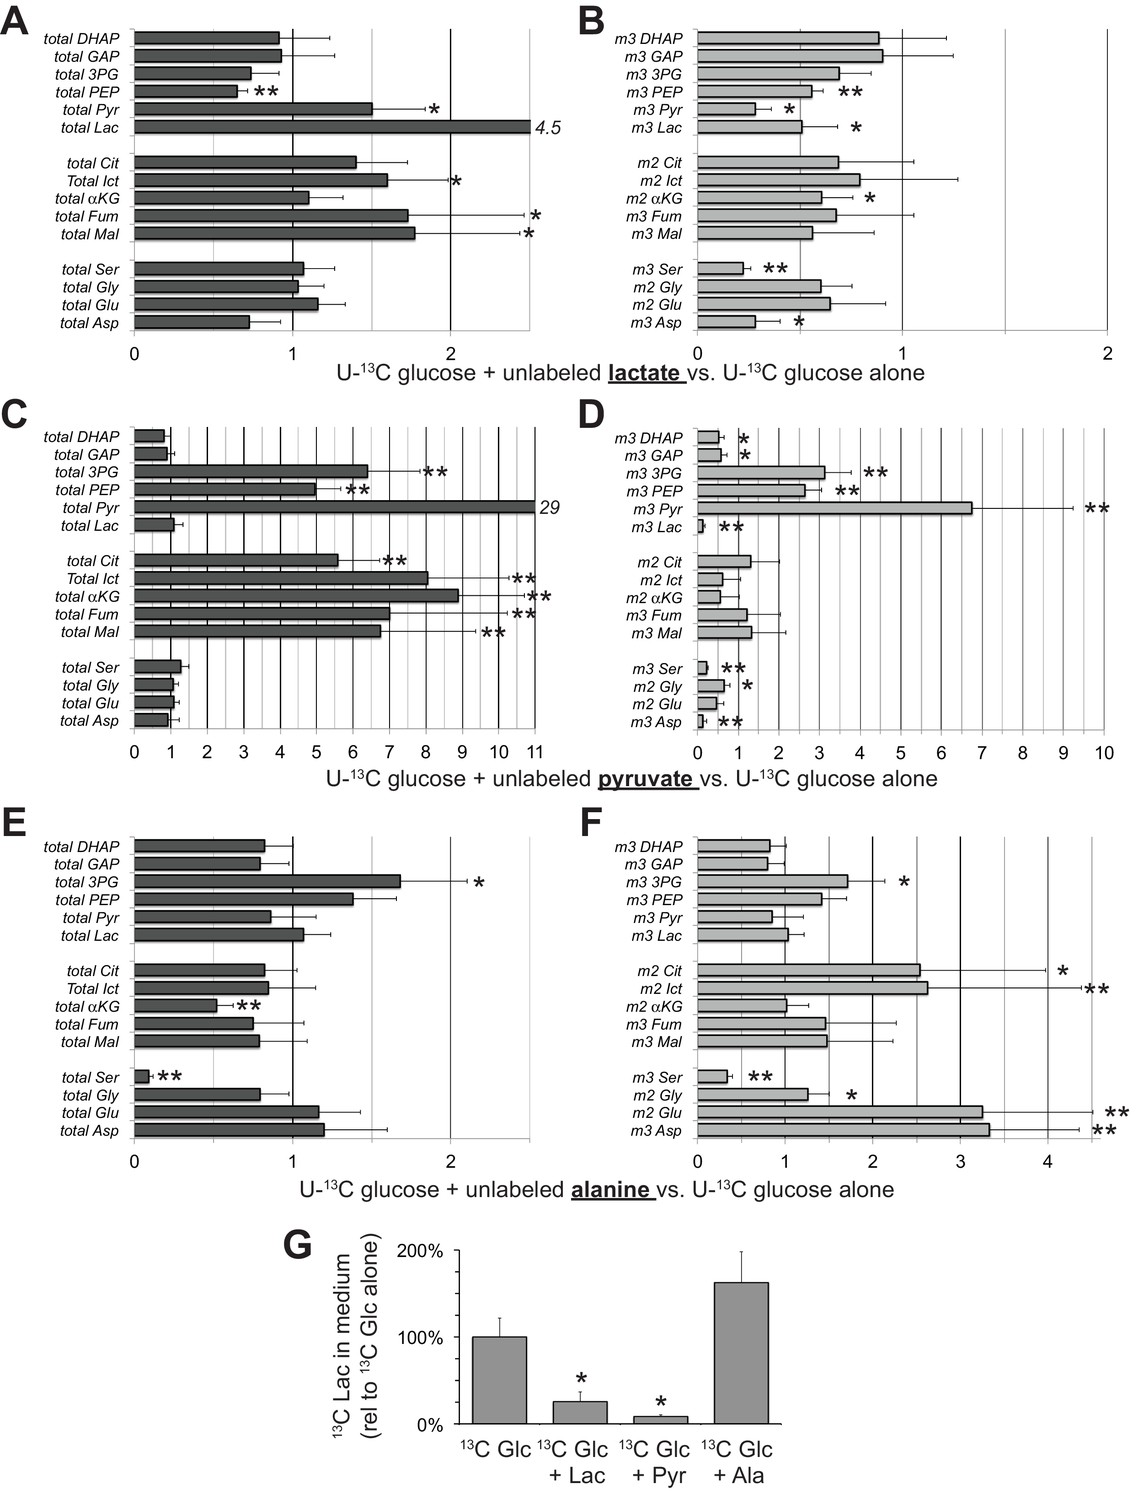
Effects of lactate, pyruvate and alanine on metabolic flux from U-13C glucose in hfRPE cells.
Each bar graph compares the ratio of metabolites with vs. without the addition of 10 mM of either unlabeled lactate (A,B) pyruvate (C,D) or alanine (E,F). A, C, and E report the ratios for the total of all isotopomers of each metabolite and B, D and F report the ratios for specific labeled metabolites (m2 or m3). Panel G shows the effects of adding unlabeled lactate, pyruvate or alanine on the release of 13C lactate generated by glycolysis of U-13C glucose. Metabolites were extracted, derivatized and quantified after 5 min incubation with 5 mM U-13C glucose (n = 3) or 5 mM U-13C glucose plus 10 mM unlabeled lactate (n = 3), pyruvate (n = 3) or alanine (n = 3). Error bars report StDev. *p<0.05; **p<0.01.
Figure 9
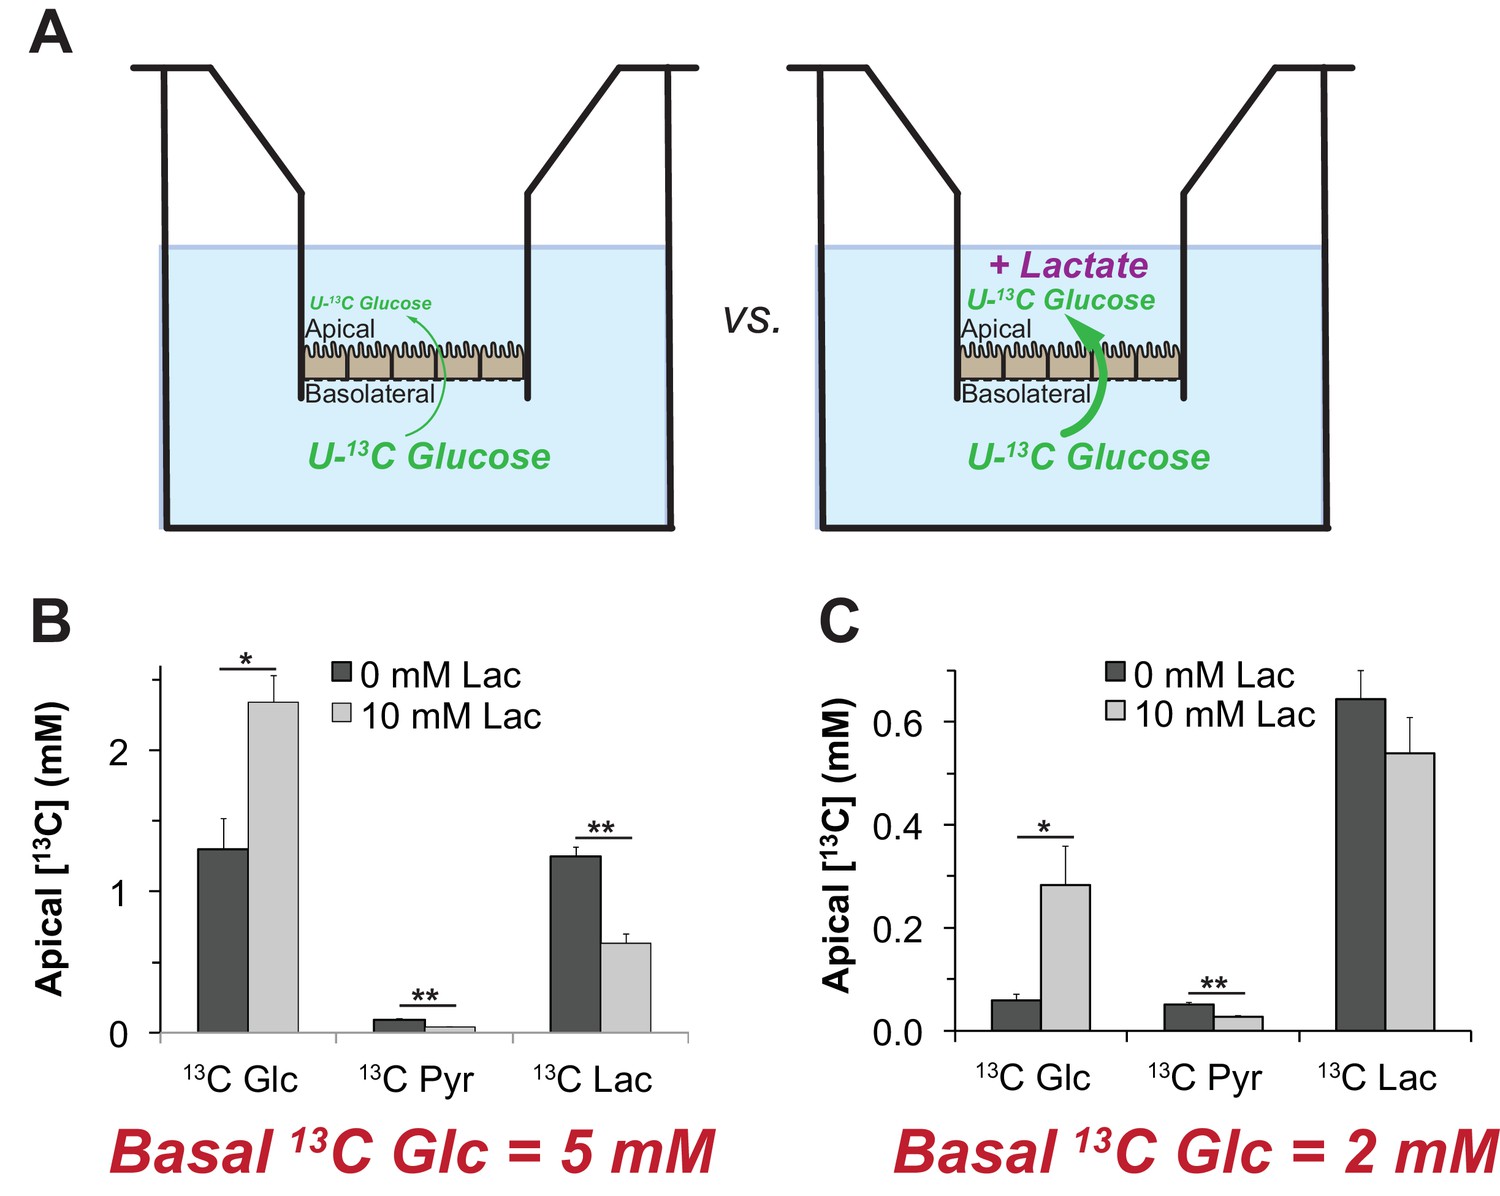
Lactate can enhance transport of glucose across a monolayer of RPE cells.
(A) Strategy to evaluate the effect of lactate on transport of glucose across a monolayer of RPE cells. We hypothesized that without lactate (left) glycolysis consumes glucose before it can cross the RPE cell monolayer. With lactate on the apical side (right) glycolysis would be partially suppressed so more glucose can cross the monolayer without being consumed by glycolysis.). (B,C) Glucose on the apical side after 8 hr. These panels compare the concentrations of 13C Glc, 13C Pyr and 13C Lac in the apical chamber 8 hr after 5 mM (B) or 2 mM (C) 13C Glc was added to the basolateral chamber (n = 3).
Figure 10
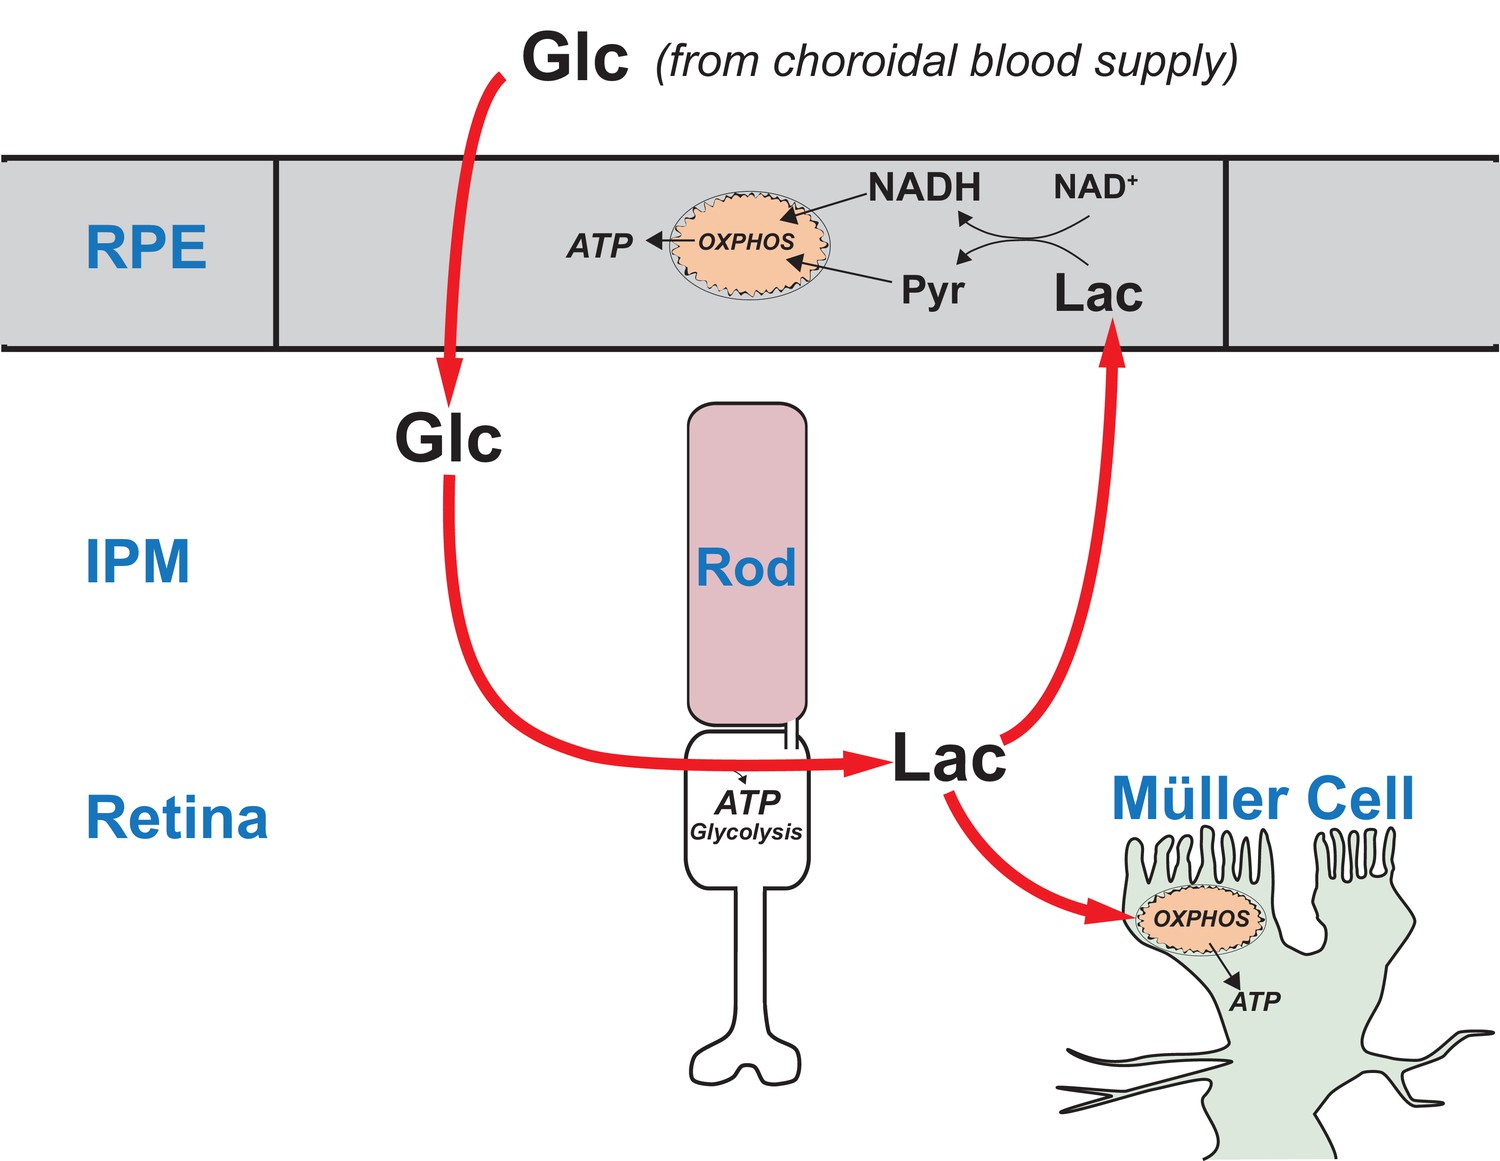
A working model that describes the flow of metabolic energy in the retina-RPE ecosystem.
Photoreceptors convert glucose into lactate and release the lactate into the interphotoreceptor matrix. Lactate suppresses glycolysis in RPE cells by depleting NAD+. Lactate also fuels metabolic activity in Müller cells, which lack key enzymes that would be required for glycolysis.
Additional files
-
Transparent reporting form
- https://doi.org/10.7554/eLife.28899.012
Download links
A two-part list of links to download the article, or parts of the article, in various formats.
Downloads (link to download the article as PDF)
Open citations (links to open the citations from this article in various online reference manager services)
Cite this article (links to download the citations from this article in formats compatible with various reference manager tools)
Biochemical adaptations of the retina and retinal pigment epithelium support a metabolic ecosystem in the vertebrate eye
eLife 6:e28899.
https://doi.org/10.7554/eLife.28899


