Computational design of environmental sensors for the potent opioid fentanyl
- University of Washington, United States
- Colorado State University, United States
- Lawrence Berkeley National Laboratory, United States
- Institute of Chemical Sciences and Engineering, Switzerland
- Max-Planck-Institute for Medical Research, Germany
Figures
Figure 1 with 1 supplement
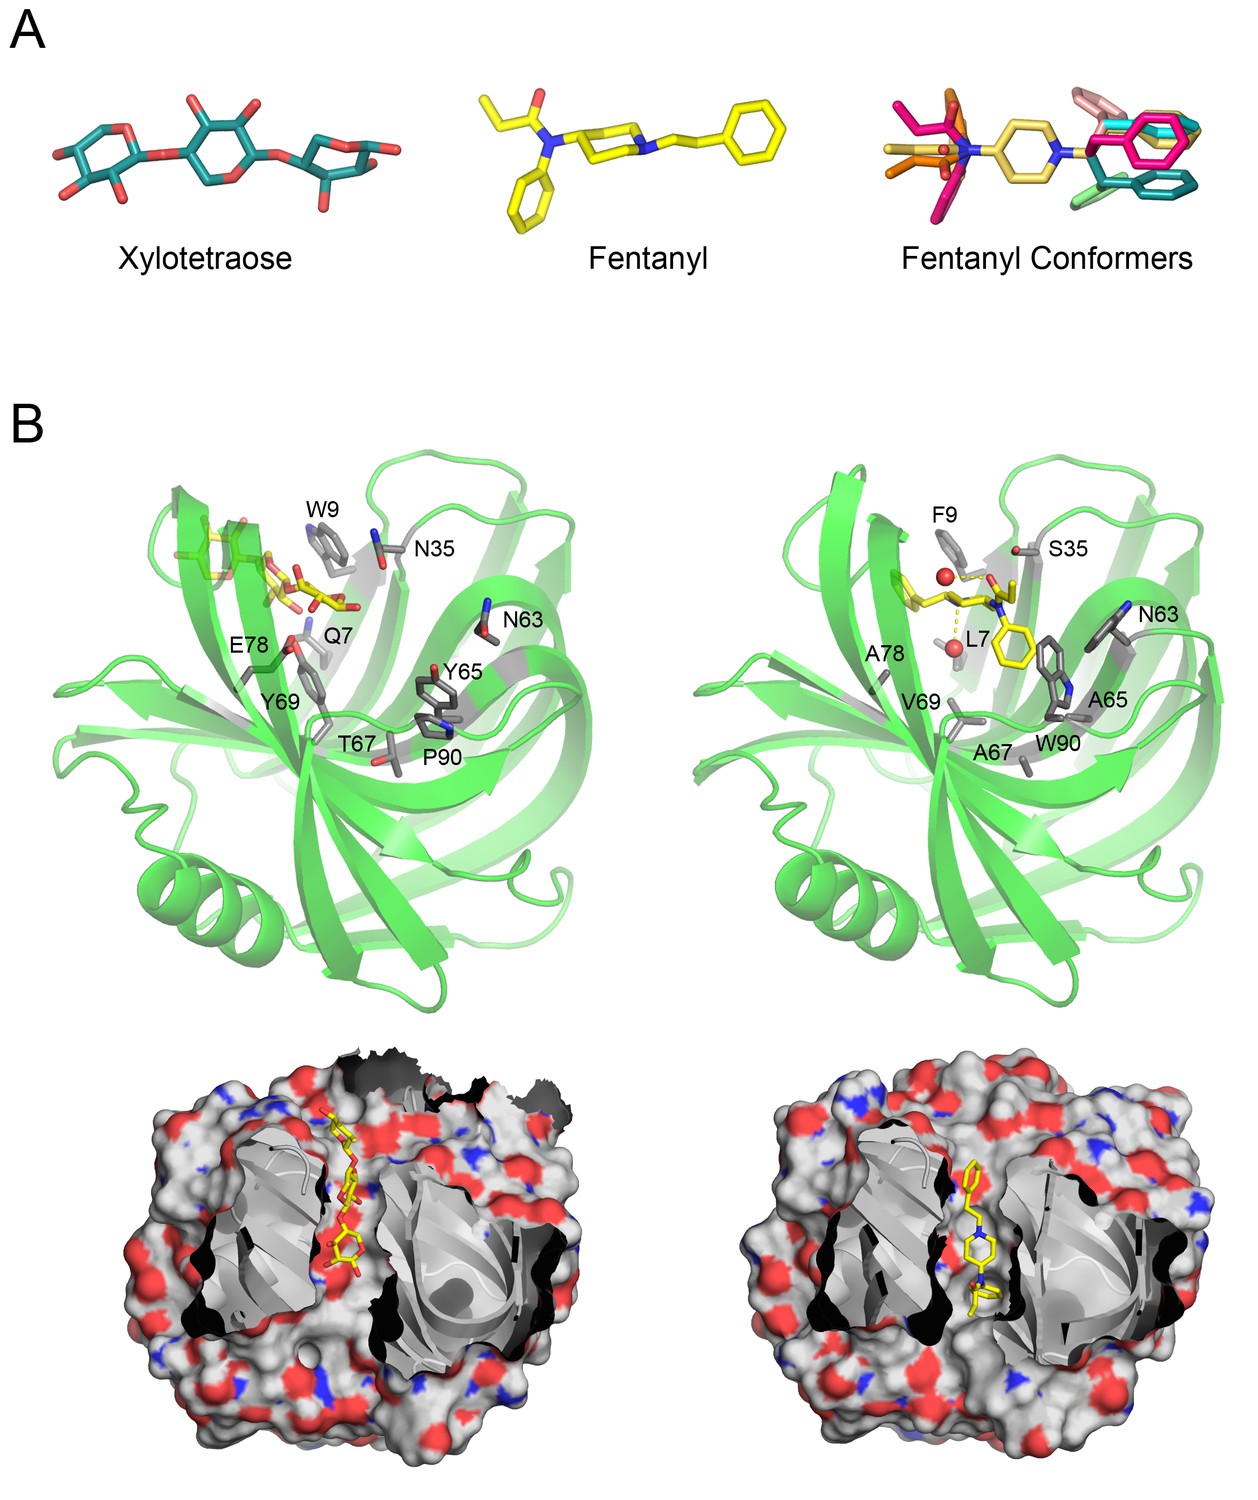
Overview of Fen49 and a comparison with the parent scaffold.
(a) The sugar bound to the native scaffold (2QZ3), xylotetraose (left), is much more polar than fentanyl (middle), a predominantly hydrophobic compound. The right panel shows the 11 non-solvated fentanyl conformers used in design. (b) Cartoon representation of the 2QZ3 crystal structure (left) and the Fen49 computational model (right). Amino acid side chains colored grey represent the computationally introduced mutations in Fen49, and their native counterparts in 2QZ3. Designed fentanyl-associated waters are shown as red spheres, connected by yellow dashed lines. The corresponding surface representations of 2QZ3 and Fen49 (below) highlight the difference in charge distribution within the binding cavities and the shape complementarity between Fen49 and fentanyl.
Figure 1—figure supplement 1
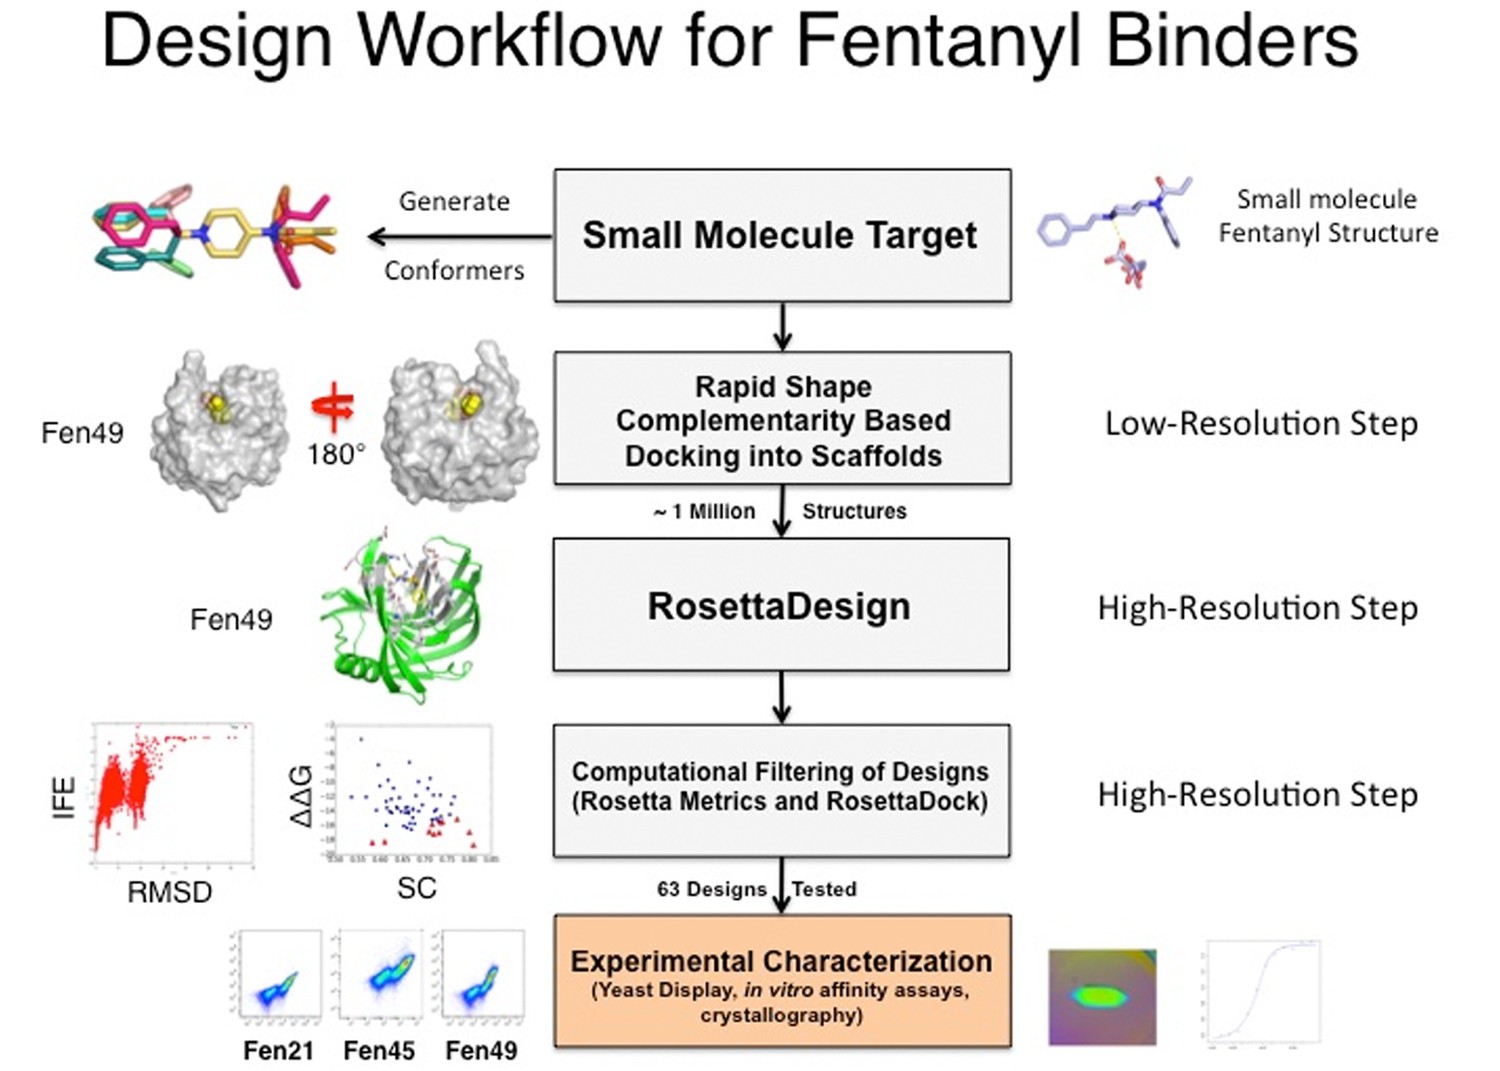
Computational and experimental flowchart.
https://doi.org/10.7554/eLife.28909.004
Figure 2 with 2 supplements

Experimental characterization of Fen49 binding and affinity enhancement.
(a) left, Expression of Fen49 (FITC coupled anti-C-myc, x-axis) and binding of Fen-BSA (phycoerythrin (PE)-conjugated streptavidin, y-axis) on yeast. The Fen49 parent scaffold, 2QZ3, expresses well but does not bind Fen-BSA. (a) right, Mean PE fluorescence of individual Fen49 point mutants, Fen49* (Y88A), Fen49.1 (A78V A172I) and 2QZ3. (b) Enrichment map from 4 rounds of affinity maturation following site-saturation mutagenesis of the full Fen49 coding sequence. Binding site residues are highlighted (full SSM results are given in Figure 2—figure supplement 1). Green and red represent depletion and enrichment, respectively. Positions for which insufficient data were obtained in the naive library to make a comparison are colored grey. Fen49 design amino acid identities are colored yellow. Binding site side-chains are represented by sticks in the accompanying cartoon model of the Fen49*-complex structure, and colored according to enrichment (green = no enrichment away from the designed residue; red = strong enrichment away from the designed residue; olive = enrichment in early rounds of selection with depletion in later rounds. (c) Binding affinities (Kd) determined by equilibrium fluorescence anisotropy, using Fen-PEG-Alexa488 and Fen49 (left), Fen49* (middle) or Fen49.1 (right).
Figure 2—figure supplement 1
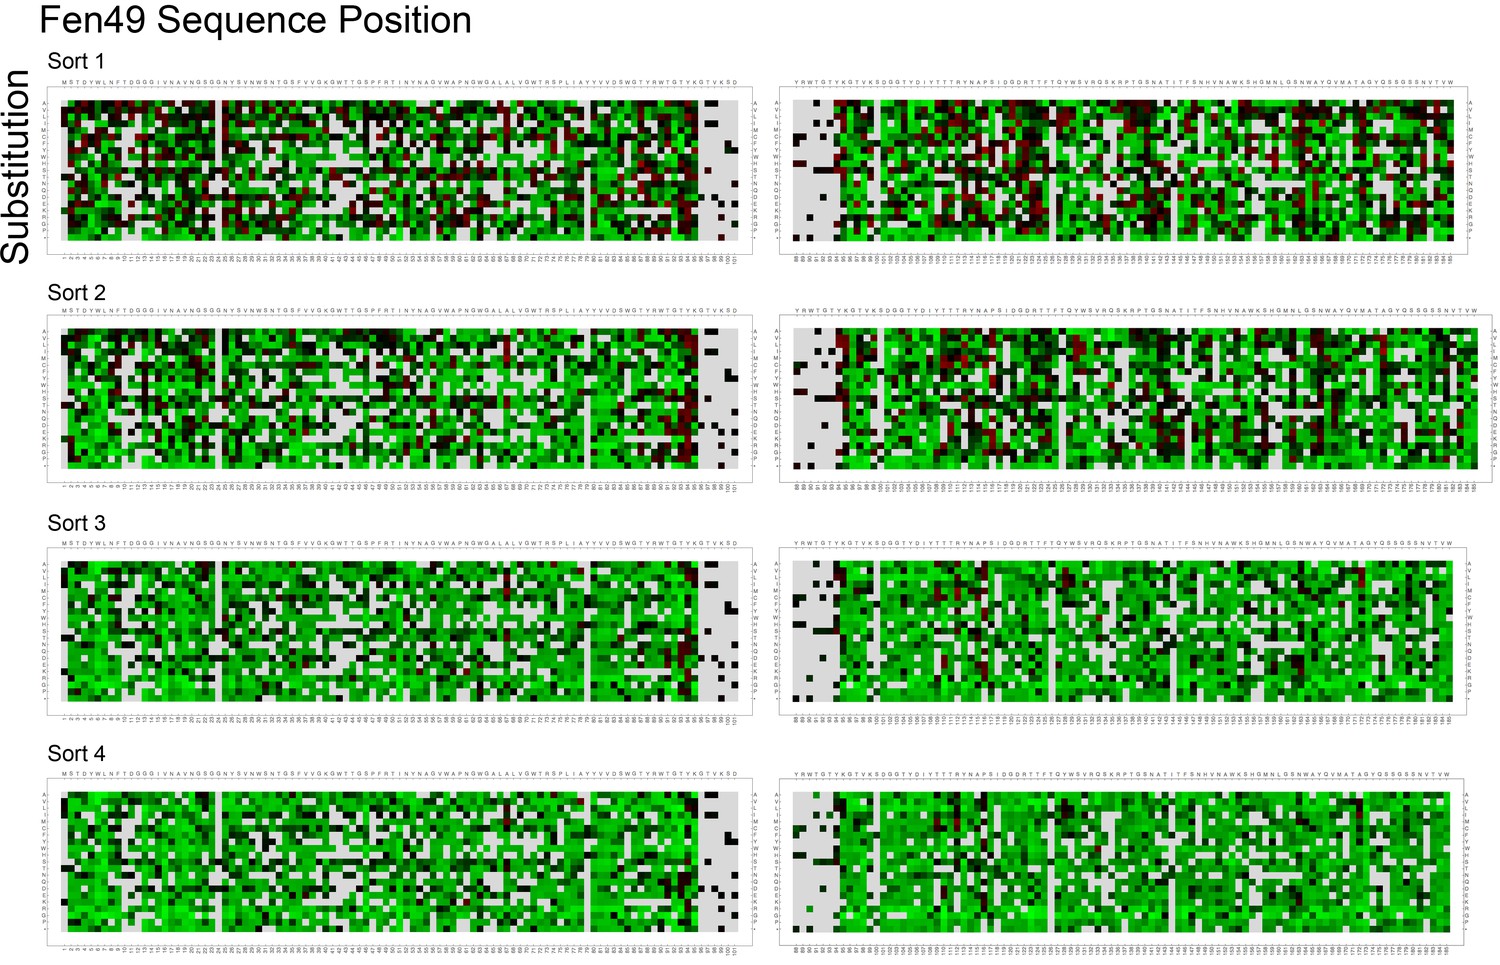
Enrichment results for the full Fen49 coding sequence after SSM and affinity maturation.
A fentanyl-streptavidin tetramer (4-fold avidity) was used as the affinity reagent, with decreasing concentrations of 4 μM, 2 μM, 1 μM and 500 nM in subsequent rounds of selection. Enhancement and depletion are colored red and green, respectively. Positions with insufficient data in the naive library to make a comparison are colored grey.
Figure 2—figure supplement 2
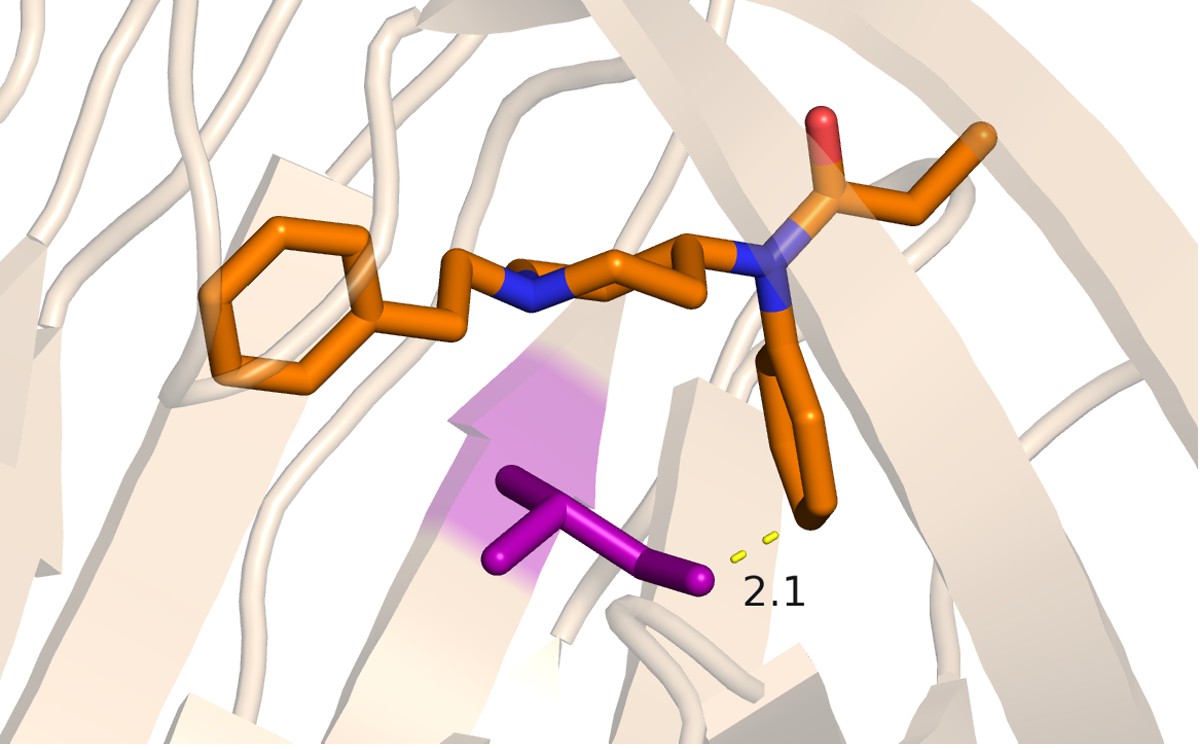
Fen49*-complex with isoleucine modeled at residue 172, an affinity-enriching mutation identified from SSM selection.
Given the coordinates of fentanyl in the crystal structure, an isoleucine at position 172 would result in overlapping Van der Waals radii with fentanyl, suggesting that a slight shift in the position of fentanyl in Fen49.1 relative to Fen49* is likely. Shown is the typical C-C distance between I172 and fentanyl obtained from modeling different Ile rotamers. The fentanyl-associated chloride has been removed for clarity. Distance is in Å.
Figure 3 with 9 supplements
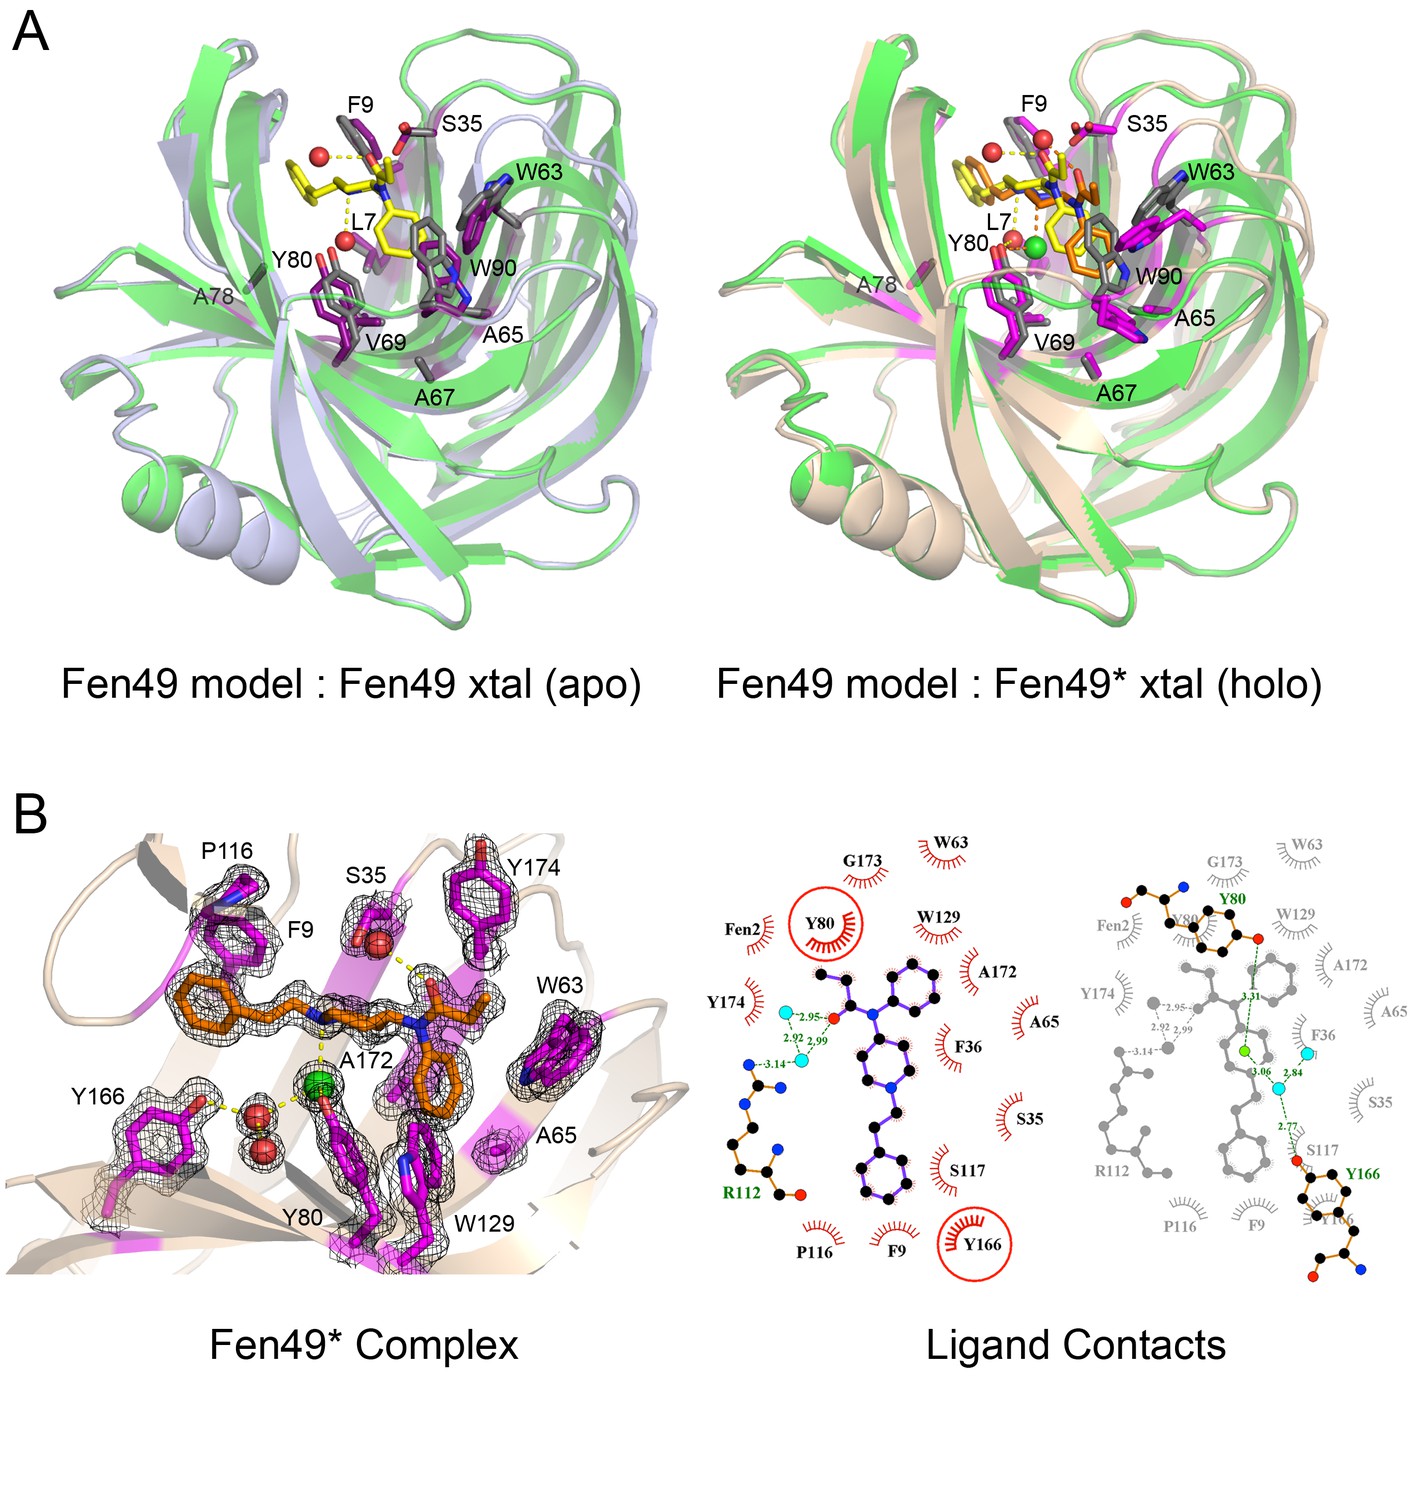
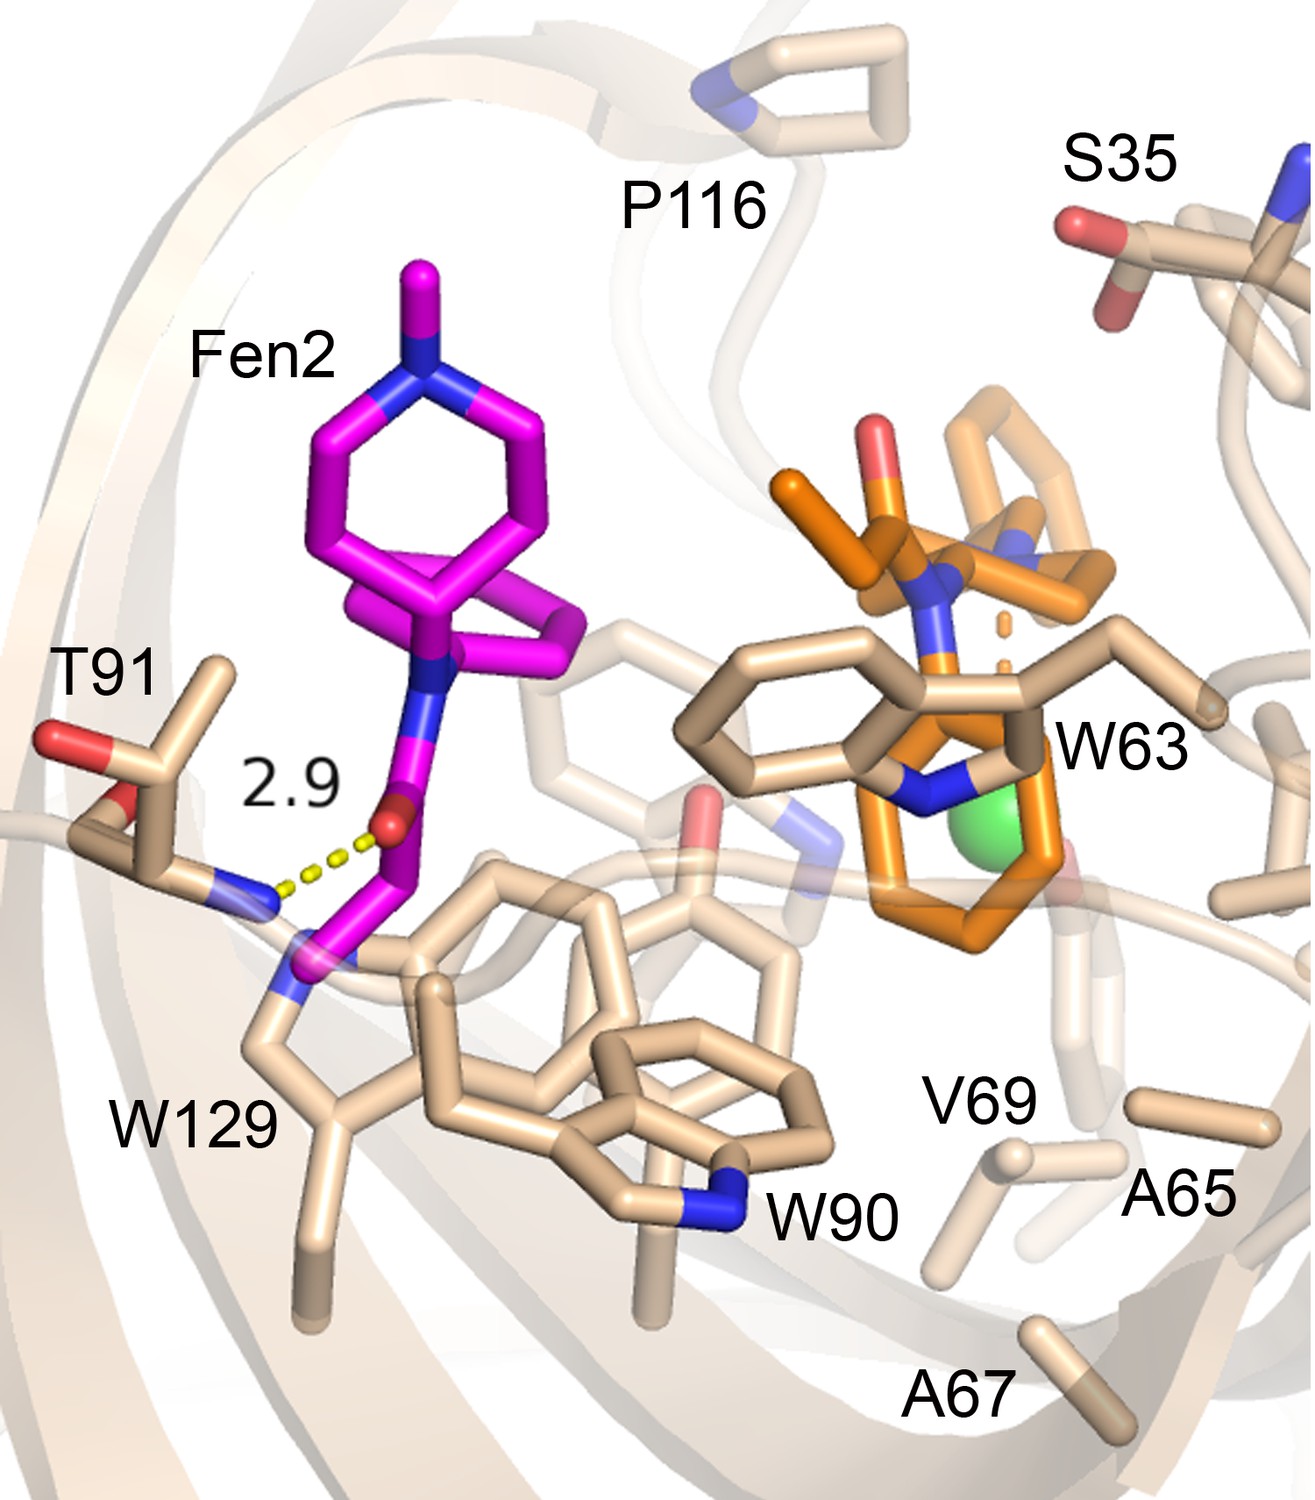
Structural characterization of Fen49.
(a) left, Comparison of the Fen49 computational model (green, grey side-chains, yellow fentanyl) with the apo Fen49 crystal structure (light blue, purple side-chains). For clarity, the molecule of PEG observed in the crystal structure has been omitted. Computationally designed side-chains, plus Y80, are shown as sticks. Fentanyl-associated water molecules are shown as red spheres and connected with yellow dashed lines. (a) right, Fen49 model aligned with the Fen49*-fentanyl complex crystal structure (wheat, magenta side-chains, orange fentanyl). The fentanyl tertiary amine-associated chloride and carbonyl water are shown as green and red spheres, respectively. (b) left, The Fen49*-complex binding site, colored as in Figure 3a. Side-chains involved in binding fentanyl are shown, with the corresponding 2Fo-Fc electron density from the refined maps, contoured at 1.0 σ (Figure 3—figure supplement 8). (b) right, Ligplot (Laskowski and Swindells, 2011) 2D representation of all residues contacting fentanyl. Two superimposed layers are shown, keeping Y80 and Y166 fixed for orientation. Residues making hydrophobic and polar contacts are labeled with black and green font, respectively. Water molecules and the chloride ion are shown as blue circles and green circles, respectively. Green dashed lines represent hydrogen bonds (distances in Å). A second molecule of fentanyl was observed on the periphery of the binding cavity (Figure 3—figure supplement 9).
Figure 3—figure supplement 1

Fen49 binding site, showing a well-ordered portion of PEG 3350 from the crystallization solution.
2Fo-Fc map contoured at 1.0 σ. Image taken from Coot (Emsley et al., 2010).
Figure 3—figure supplement 2

The Thr87 - Thr93 loop.
containing the Y88A mutation displays a high degree of structural variability between Fen49 and Fen49*, which allows an exchange of the designed Trp90-fentanyl stacking interaction with a Trp63-fentanyl dipole-quadrupole. Fen49 (light blue) and Fen49*-complex (wheat) residues are labeled without and with an *, respectively.
Figure 3—figure supplement 3
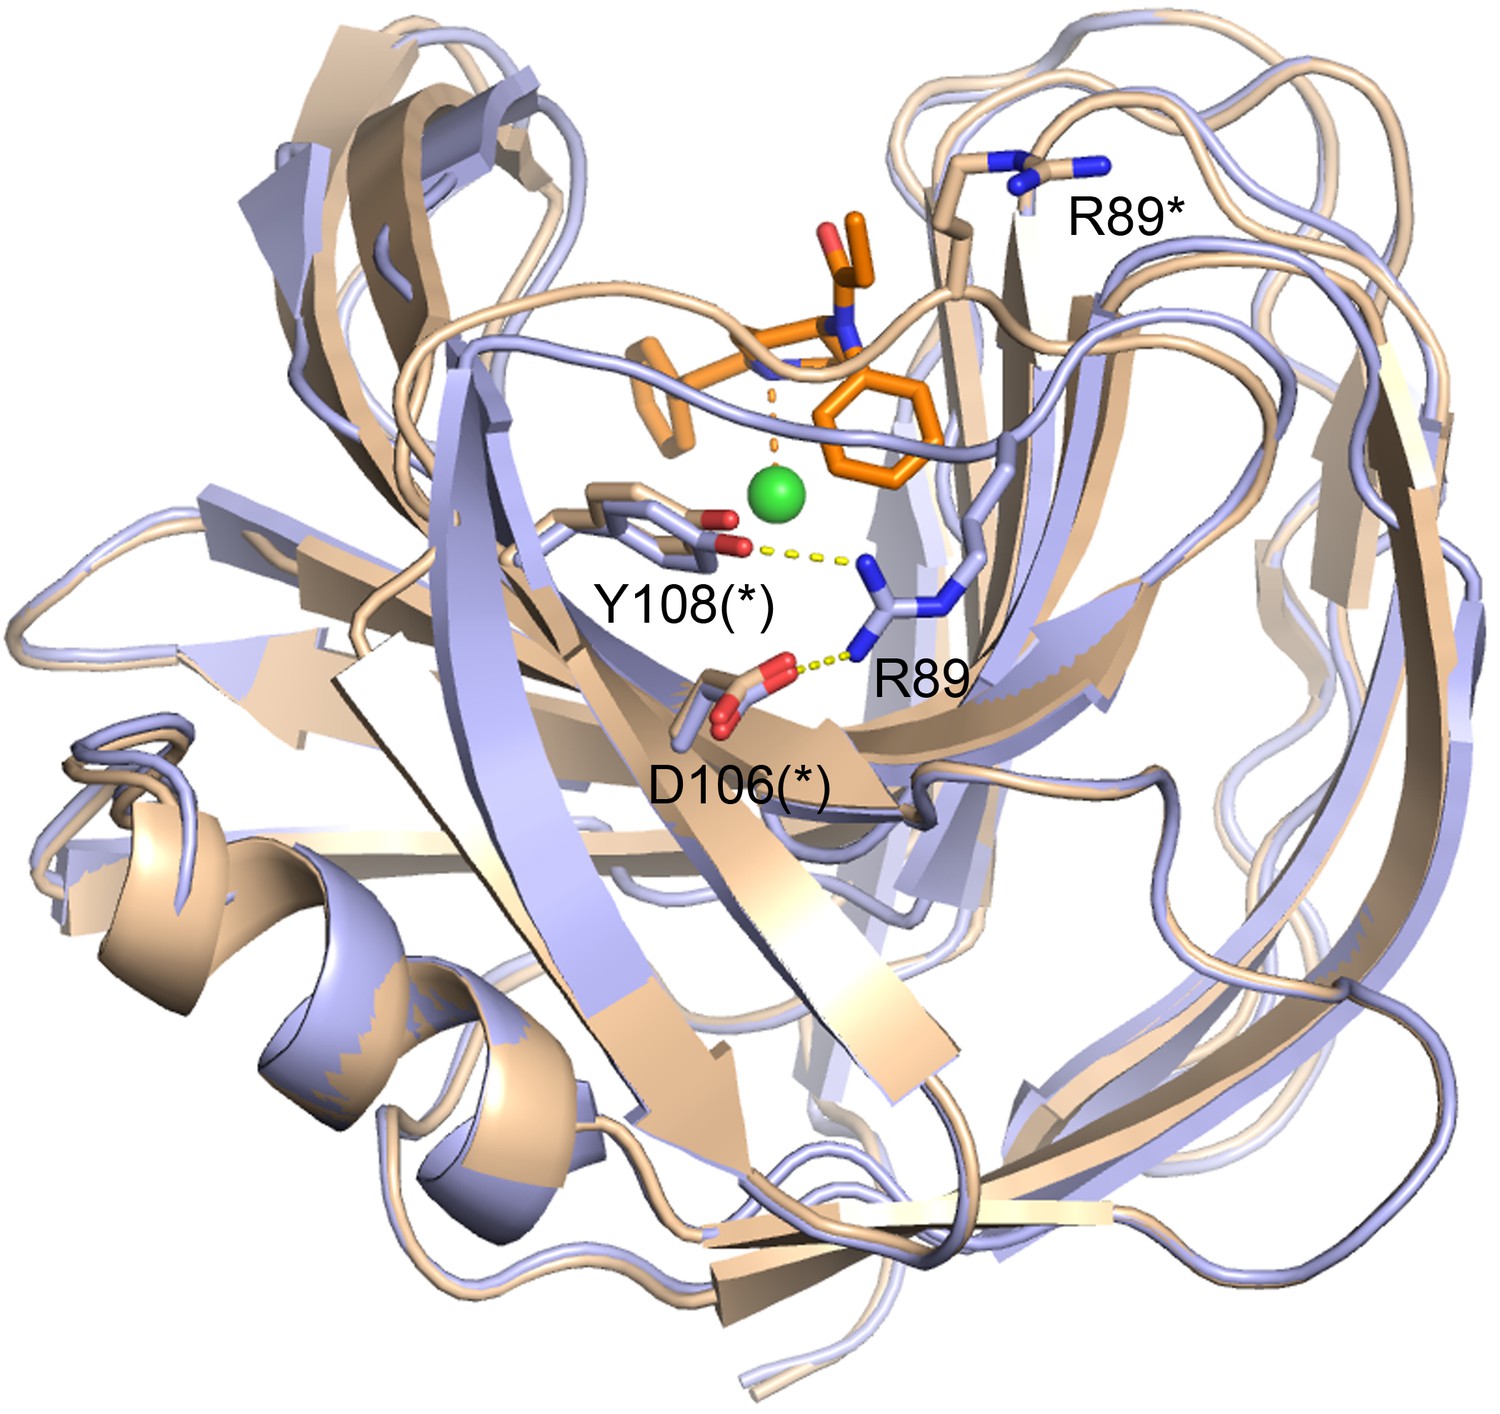
Disruption of the R89-D106-Y108 polar network on the back side of the binding cavity as a result of the altered Thr87 - Thr93 loop in Fen49* (wheat).
Fen49 is colored light blue.
Figure 3—figure supplement 4
The W90-stacking interaction from the Fen49 design model (green) is replaced with a W63-fentanyl dipole-quadrupole (wheat).
https://doi.org/10.7554/eLife.28909.012
Figure 3—figure supplement 5
Difference between the Fen49*-apo (ruby) and Fen49*-complex (wheat) Trp63 side-chain rotamers.
Also highlighted is the backbone of the Thr87 - Thr93 loop, which adopts the same conformation in both structures.
Figure 3—figure supplement 6

Chain A from the Fen49* crystal structures colored by B factor (Å2) of the C-alpha atoms, plus all fentanyl non-hydrogen atoms and the single molecule of chloride.
B factors ranged from 10.86 to 57.18 (average B = 21.86) and 8.30–50.05 (average B = 15.89) for the apo and complex structures, respectively. Binding of fentanyl appears to stabilize the overall protein structure.
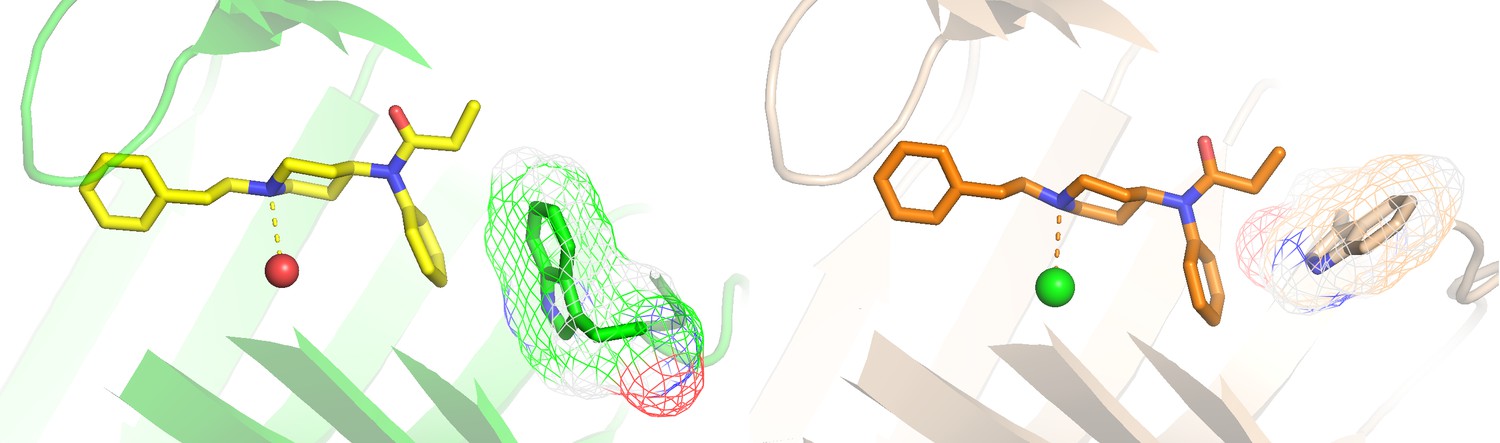
Figure 3—figure supplement 7

Trigonal planar coordination of chloride with fentanyl, Tyr80 and water in the binding cavity.
2Fo-Fc map contoured at 1.0 σ.
Figure 3—figure supplement 8

Positive density (Fo-Fc map colored green and contoured at 3.0 σ) corresponding to fentanyl and the associated chloride following molecular replacement and a single round of refinement with simulated annealing.
Also shown is the 2Fo-Fc map colored blue and contoured at 1.0 σ.
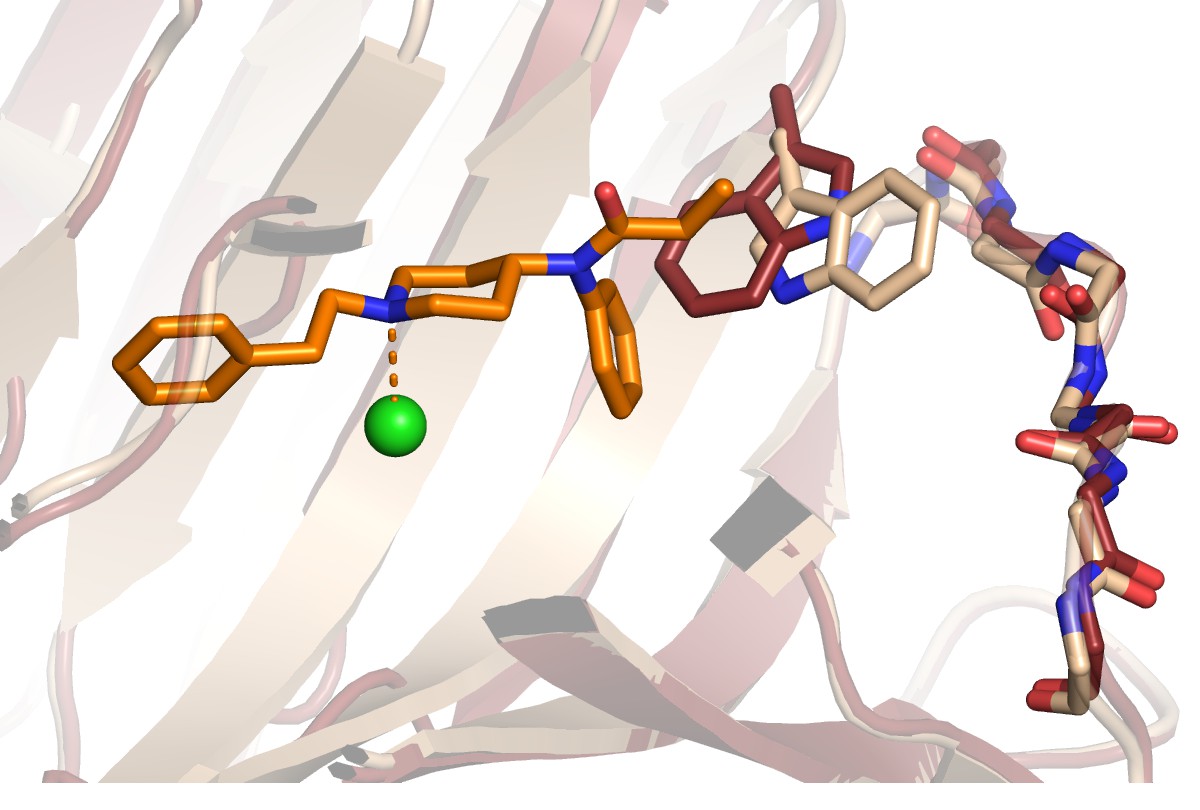
Figure 3—figure supplement 9
A second molecule of fentanyl was observed on the periphery of the Fen49 binding site.
The phenylethyl moiety points towards the solvent and could not be modeled in 2 of the 3 copies in the asymmetric unit due to disorder. The second fentanyl makes a hydrogen bond to the backbone amide of Thr91 via its carbonyl oxygen.
Figure 4
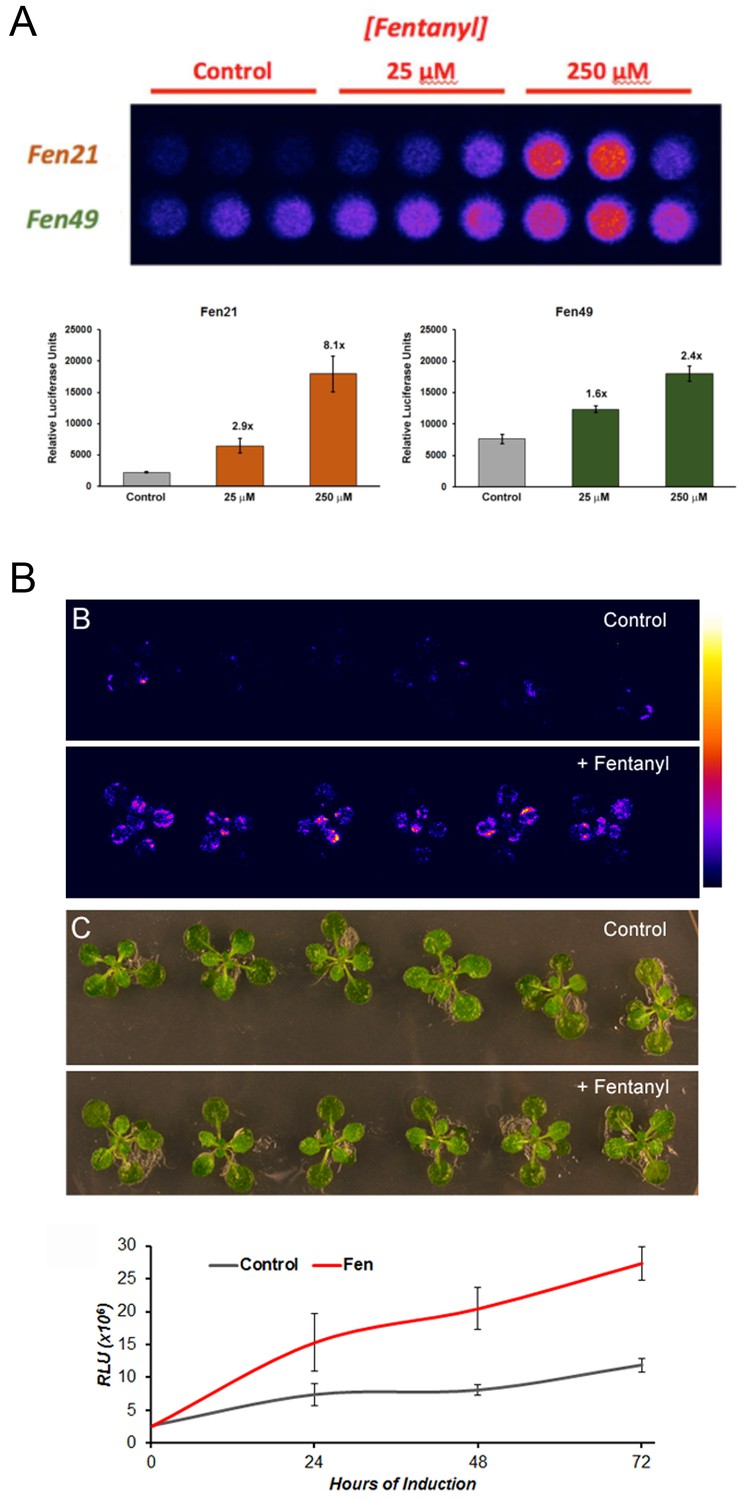
Fentanyl-dependent transcriptional activation in Arabidopsis thaliana.
(a) Protoplasts expressing a conditionally stable transcription-factor (TF) firefly luciferase construct respond to treatment with fentanyl. Control cells did not receive fentanyl. Fen21 (~8 fold luciferase expression over background) was found to be more responsive to fentanyl compared with Fen49, and was used to generate intact transgenic plants shown in (b). Fen21 was refractory to crystallization, and therefore we were unable to obtain structural information for this design. (b) Fentanyl-dependent induction of luciferase activity in transgenic Arabidopsis plants expressing the Fen21 TF. Plants were incubated for up to 72 hr in liquid plant media containing no fentanyl (Control) or 100 µM fentanyl (+Fentanyl). Top panels, false-colored image depicting luciferase activity, according to the scale shown; middle panels, bright field photographs of plants; bottom panel, quantification of luciferase activity over 72 hr. Luciferase activity shown as Relative Luciferase Units (RLU).
Chemical structure 1
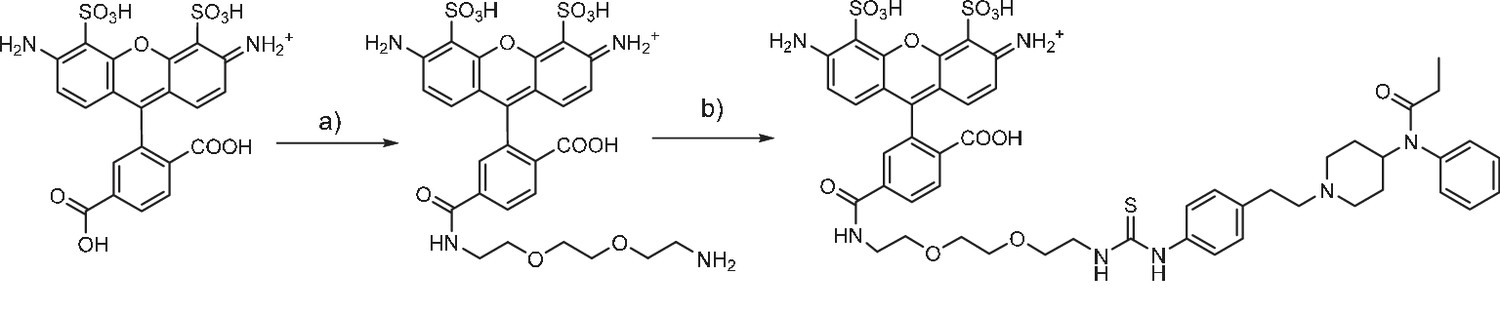
Fentanyl-PEG-Alexa488 synthesis
(a) TSTU, 1,8-diamino-3,6-dioxaoctane, DIPEA, DMSO, r.t. (b) fentanyl isothiocyanate, DIPEA, DMSO, r.t.
Chemical structure 2

Fentanyl-PEG-biotin synthesis
(a) fentanyl isothiocyanate, DIPEA, DMSO, r.t.
Additional files
-
Supplementary file 1
List of PDBs used as scaffold proteins.
- https://doi.org/10.7554/eLife.28909.021
-
Supplementary file 2
Overview of the 62 Fentanyl binder designs.
- https://doi.org/10.7554/eLife.28909.022
-
Supplementary file 3
Fen49 mutagenic primers.
- https://doi.org/10.7554/eLife.28909.023
-
Supplementary file 4
Fen49 site saturation mutagenesis (SSM) primers.
- https://doi.org/10.7554/eLife.28909.024
-
Supplementary file 5
Next-generation sequencing statistics for Fen49 library sorts.
- https://doi.org/10.7554/eLife.28909.025
-
Supplementary file 6
Crystallographic data collection and refinement statistics.
- https://doi.org/10.7554/eLife.28909.026
-
Transparent reporting form
- https://doi.org/10.7554/eLife.28909.027
Download links
A two-part list of links to download the article, or parts of the article, in various formats.
Downloads (link to download the article as PDF)
Open citations (links to open the citations from this article in various online reference manager services)
Cite this article (links to download the citations from this article in formats compatible with various reference manager tools)
Computational design of environmental sensors for the potent opioid fentanyl
eLife 6:e28909.
https://doi.org/10.7554/eLife.28909


