Nuclear microenvironments modulate transcription from low-affinity enhancers
- Janelia Research Campus, Howard Hughes Medical Institute, United States
- European Molecular Biology Laboratory, Germany
- Albert Einstein College of Medicine, United States
Figures
Figure 1 with 7 supplements

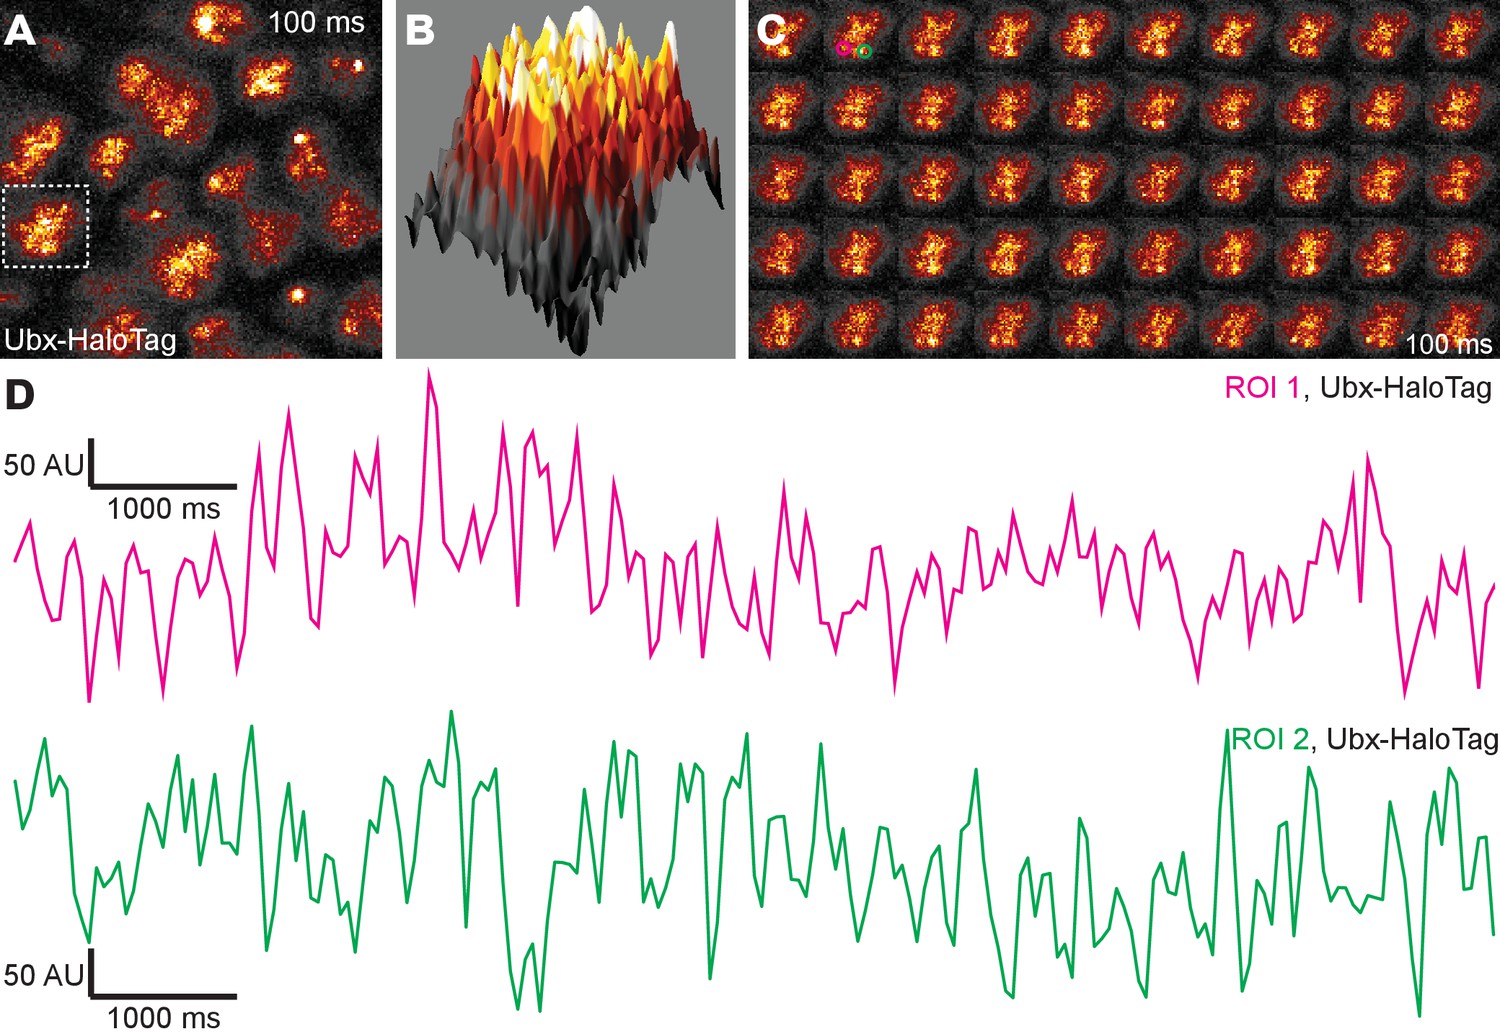
Ubx is present in microenvironments with varying local concentrations.
(A) Stage 15 embryos stained for Ubx protein with a bounding box indicating a ventral region of abdominal segment one (A1). (B) Higher magnification, Airyscan image of the region indicated in panel (A). (C) Stage 15 embryo pre- and post-expansion. (D, E) Expanded stage 15 embryos stained for Ubx protein. The dashed line encircles a single nucleus in (E). (F, I) Projections of summed pixel intensity over 100 s from videos of nos::GAL4, UAS::HaloTag-Ubx for either a wild-type Ubx (F) or a binding deficient Ubx (I), imaged with JF635 dye. (G) Sixteen individual, 100 millisecond video frames of the nucleus surrounded by a dashed box in panel (F). (H, J) Temporal traces of the signal intensity of the regions noted in panel (G) or (I). The color of each trace in (H) and (J) corresponds to the colors of the circles in panels (G) and (I), respectively. AU indicates Arbitrary Units of fluorescence intensity.
Figure 1—figure supplement 1
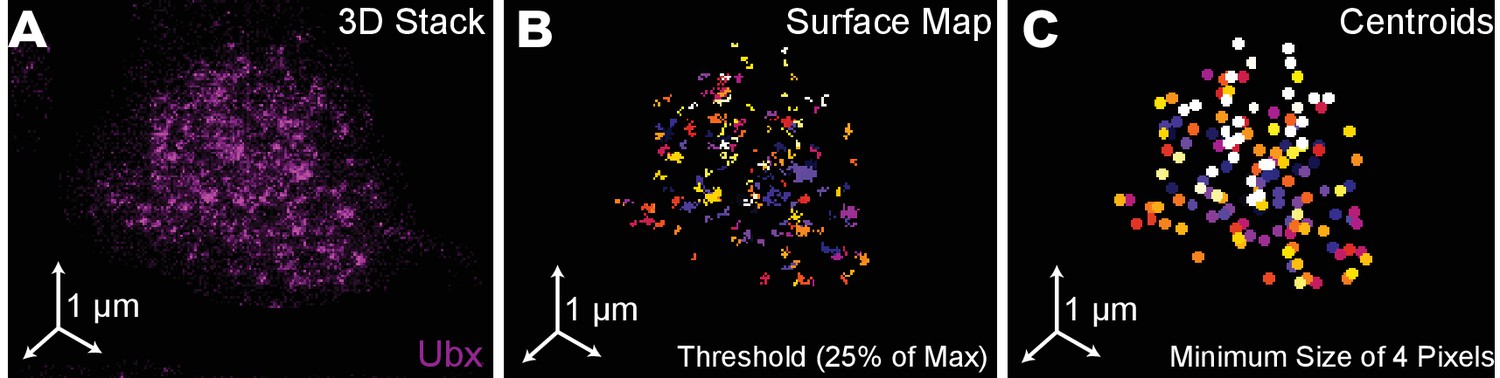
Quantification of Ubx microenvironments in single nuclei.
(A) 3D projection of a single nucleus stained for Ubx protein. (B) Surface plot of contiguous Ubx regions containing a minimum of four pixels with signal intensity greater than 25% of the maximum intensity. (C) Centroids of the Ubx regions found in panel (B). Colors denote different segmented regions.
Figure 1—figure supplement 2
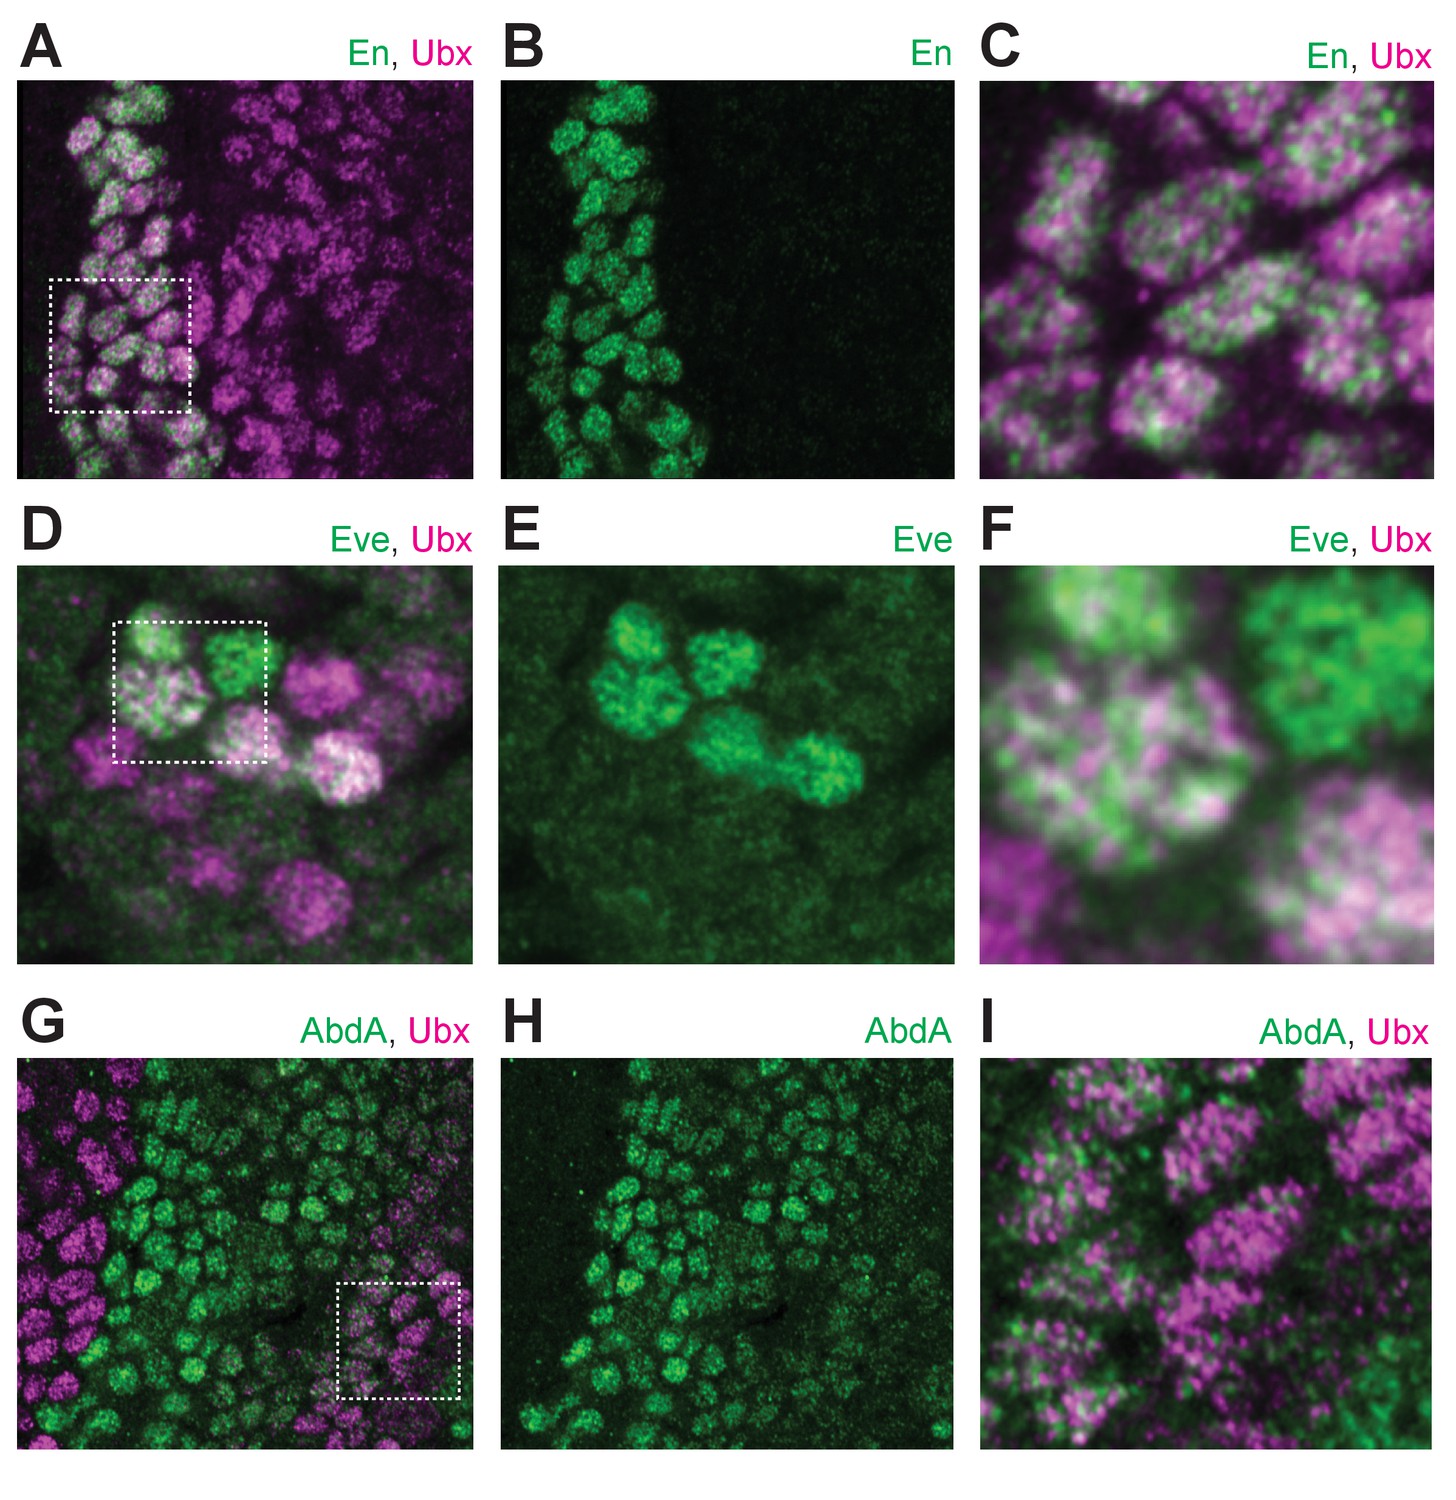
Ubx distribution compared to other transcription factors.
(A) Stage 15 embryo stained with an antibody against Engrailed (En) and Ubx protein. (B) Same image as (A) with only En shown. (C) A higher magnification of the area in the bounding box of panel (A). (D) Stage 15 embryo stained with an antibody against Eve and Ubx protein. (E) Same image as (D) with only Eve shown. (F) A higher magnification of the area in the bounding box of panel (D). (G) Stage 15 embryo stained with an antibody against AbdA and Ubx protein. (H) Same image as (G) with only AbdA shown. (I) A higher magnification of the area in the bounding box of panel (G).
Figure 1—figure supplement 3
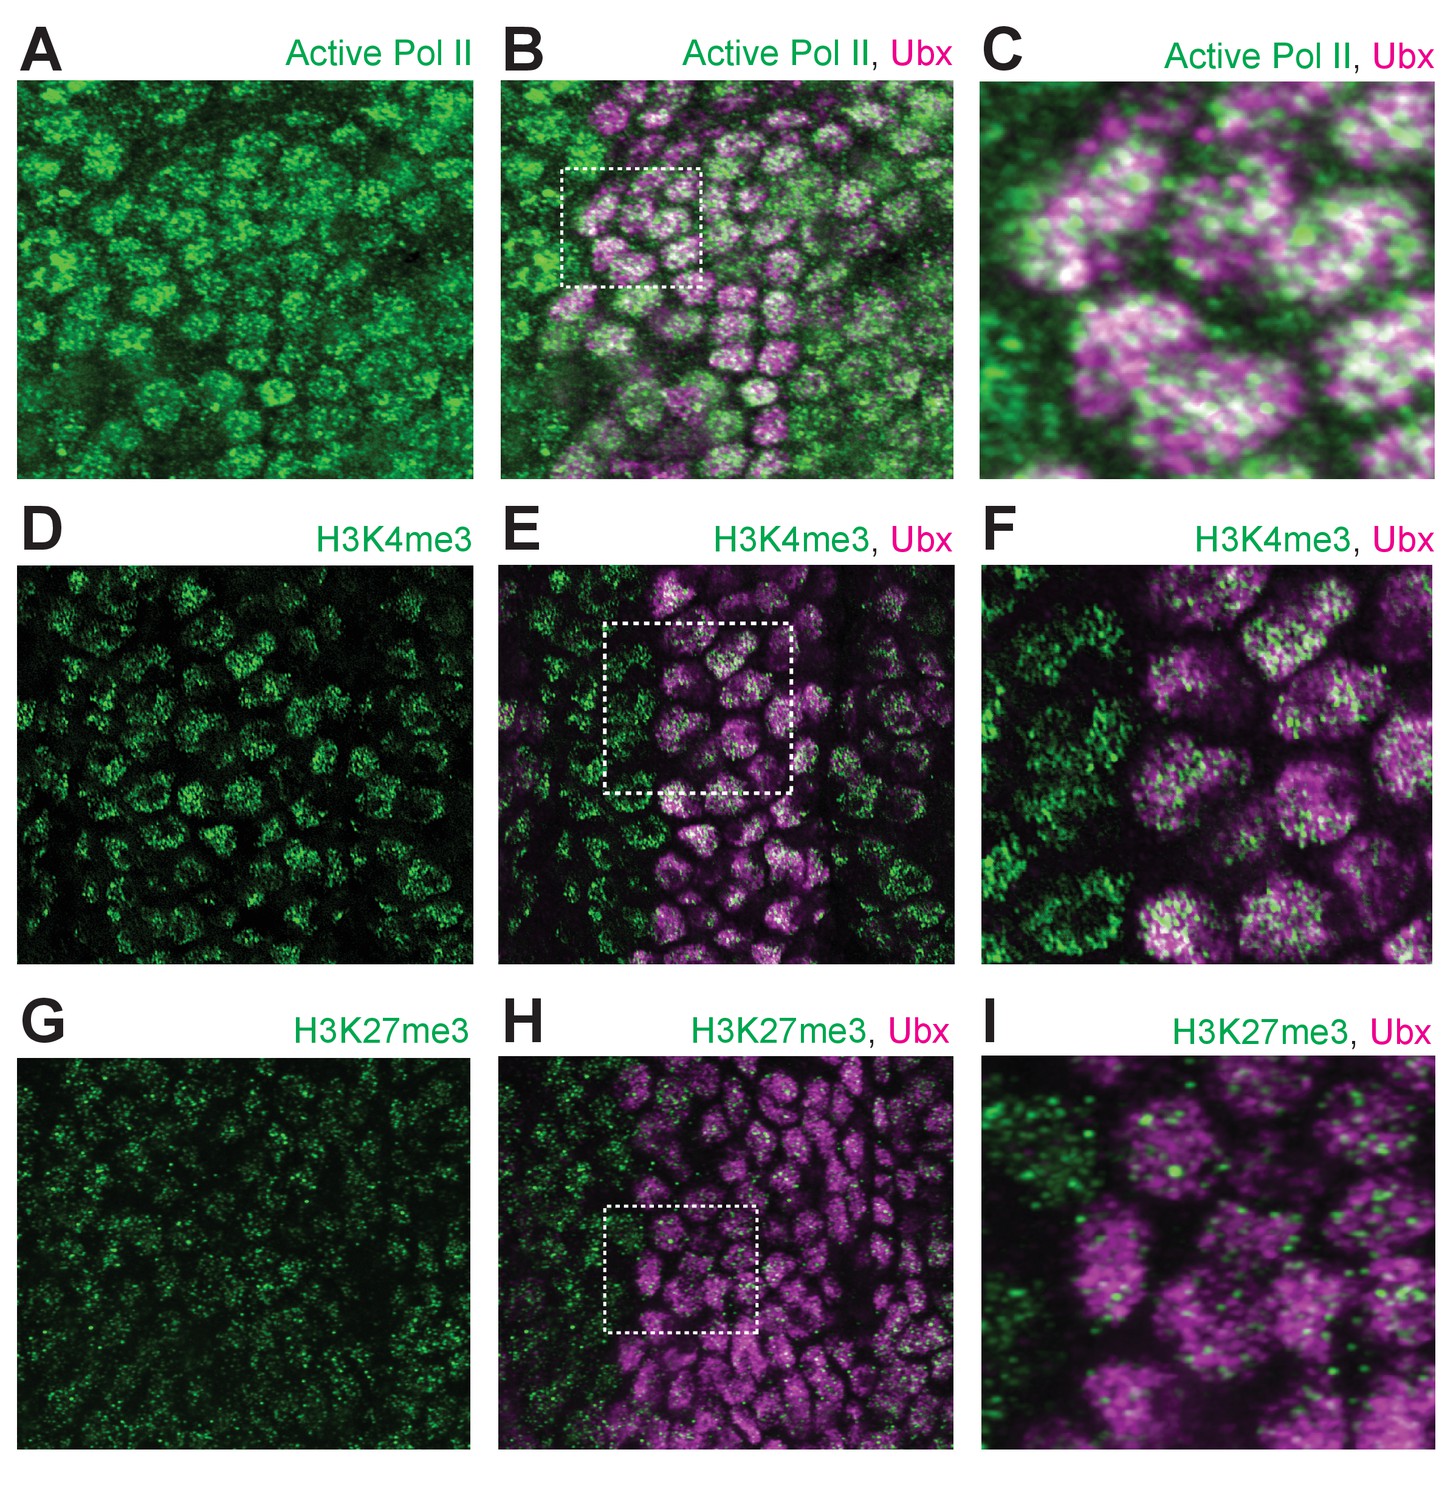
Ubx distribution compared to general markers for transcriptional activity.
(A) Stage 15 embryo stained with an antibody against transcriptionally active RNA Polymerase II RPB1 (Ser5 phosphorylated) and Ubx protein, with only active Pol II shown. (B) Same image as (A) with both active Pol II and Ubx shown. (C) A higher magnification of the area in the bounding box of panel (B). (D) Stage 15 embryo stained with an antibody against histone H3K4me3 and Ubx protein, with only H3K4me3 shown. (E) Same image as (D) with both H3K4me3 and UBx shown. (F) A higher magnification of the area in the bounding box of panel (E). (G) Stage 15 embryo stained with an antibody against histone H3K27me3 and Ubx protein, with only H3K27me3 shown. (H) Same image as (G) with both H3K27me3 and Ubx shown. (I) A higher magnification of the area in the bounding box of panel (H).
Figure 1—figure supplement 4
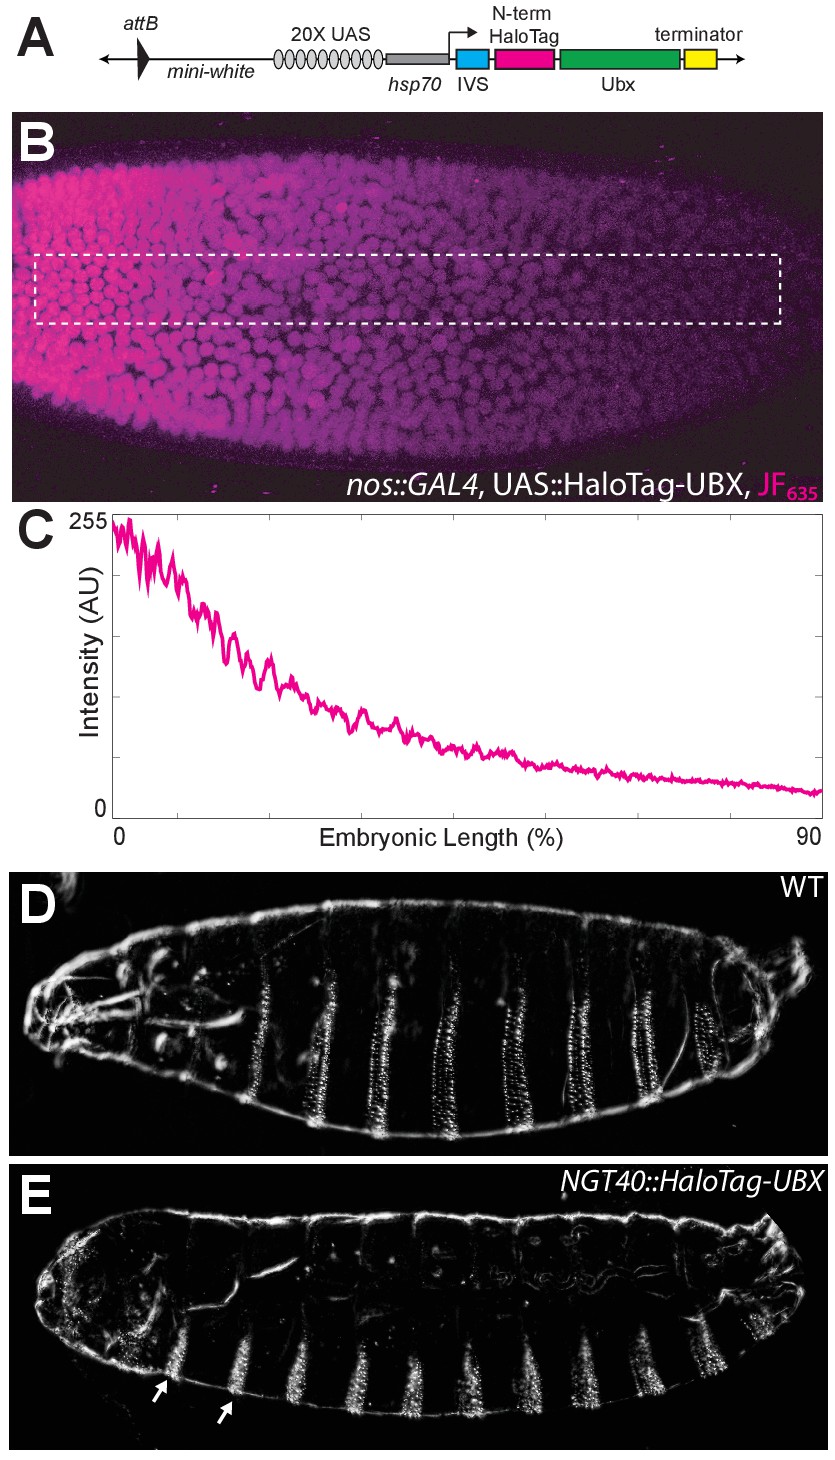
Control experiments for HaloTag-Ubx.
(A) Schematic of the N-terminal HaloTag construct with HaloTag-Ubx under the control of 20x UAS (responsive to GAL4) and the hsp70 prometer. Ubx is inserted at the MCS. (B) Stage 5 embryo resulting from a cross of a homozygous nos::GAL4 line with a homozygous 20x UAS::HaloTag-Ubx line. The embryo was injected with JF635 dye (magenta) at the anterior end. (C) Quantification of the signal intensity of the bounded region in panel (B) along the embryonic axis. A.U. indicates Arbitrary Units of fluorescence intensity. (D, E) Cuticle preps of first instar larva from either a wild-type (WT) (D) or nos::GAL4, UAS::HaloTag-Ubx embryo. (E) Arrows point to the nos::GAL4, UAS::HaloTag-Ubx induced transformation of anterior segments.
Figure 1—figure supplement 5
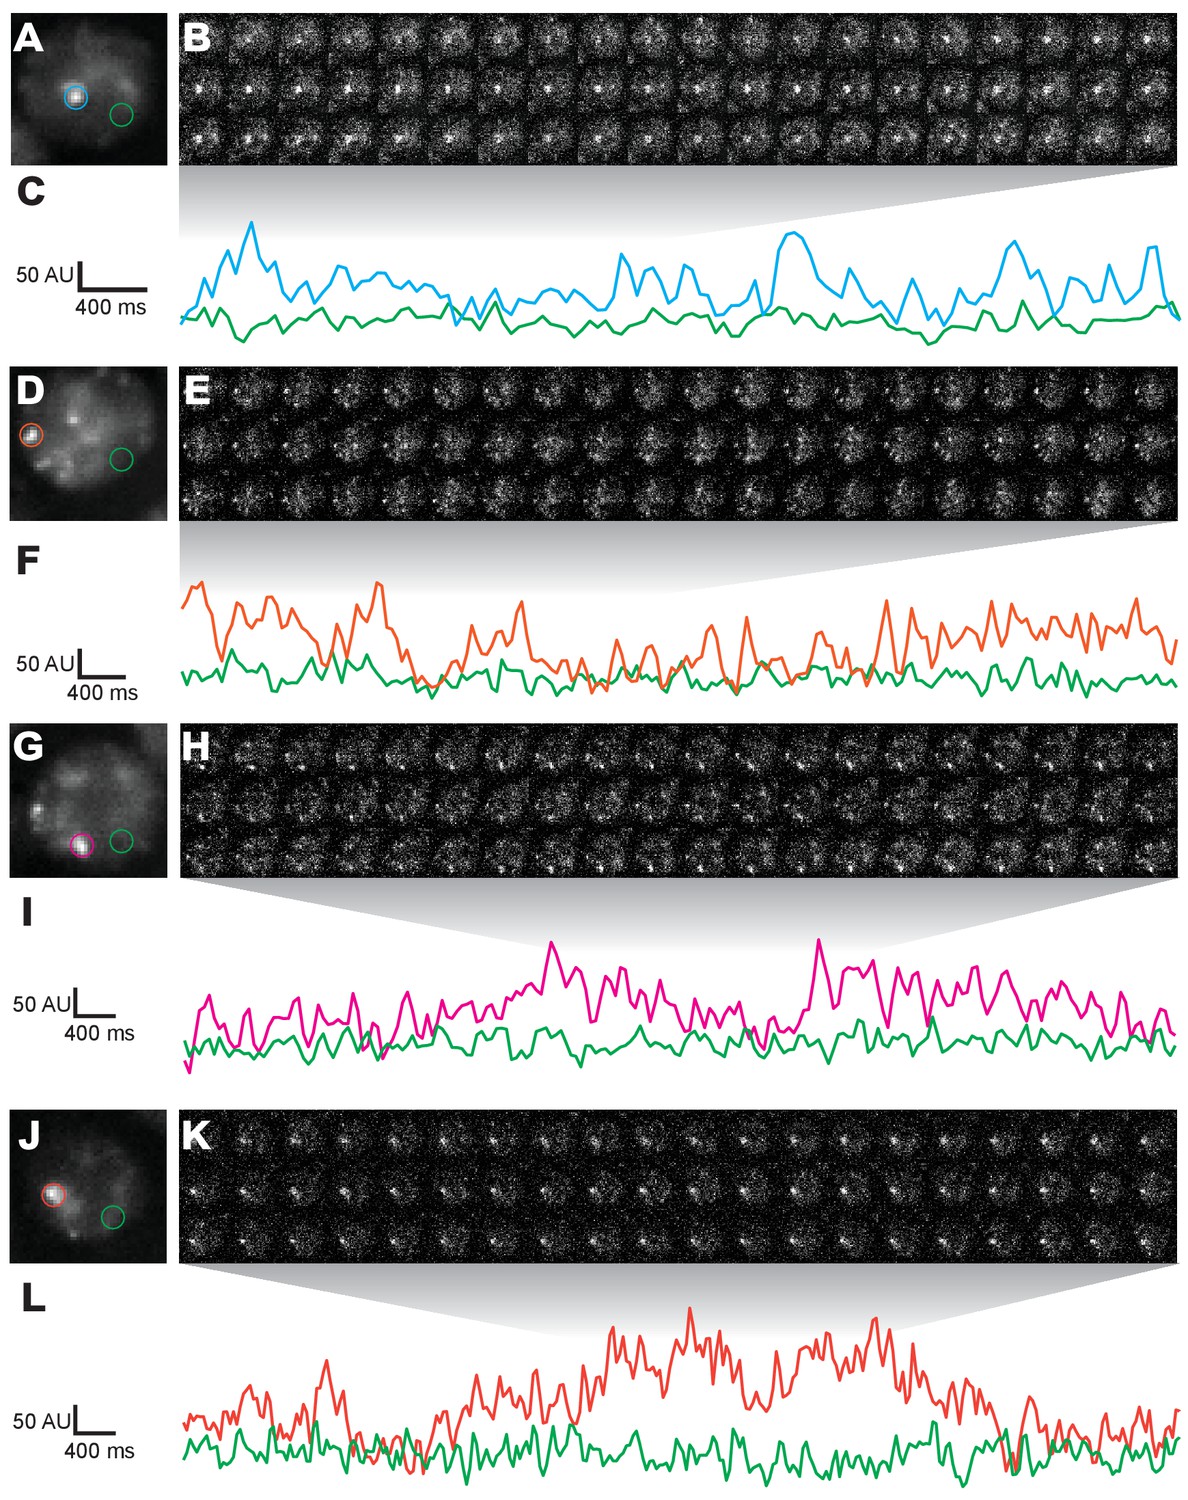
Additional nuclei from live imaging of Halo-Ubx.
(A, D, G, J) Projections of summed pixel intensities over 100 s of nos::GAL4, UAS::HaloTag-Ubx nuclei imaged with JF635 dye. (B, E, H, K) Individual 100 millisecond video frames of the nuclei in panels (A, D, G, J). (C, F, I, L) Signal traces of the signal intensity of the regions noted in panels (A, D, G, J), where color of trace corresponds to color of circle. AU indicates Arbitrary Units of fluorescence intensity.
Figure 1—figure supplement 6
Live imaging at higher concentrations of HaloTag-Ubx in late stage 6 embryos.
(A) One hundred millisecond video frame from video of nos::GAL4, UAS::HaloTag-Ubx in late stage 6 embryos with higher overall nuclear concentrations of HaloTag-Ubx molecules compared to stage 5 embryos Figure 1, imaged with JF635 dye. (B) 3D surface plot of the nucleus indicated in panel (A). (C) Individual, 100 millisecond video frames of the nucleus from panel (A). (D) Signal traces of the signal intensity of the regions noted with red and green circles in panel (C). AU indicates Arbitrary Units of fluorescence intensity.
Figure 1—figure supplement 7
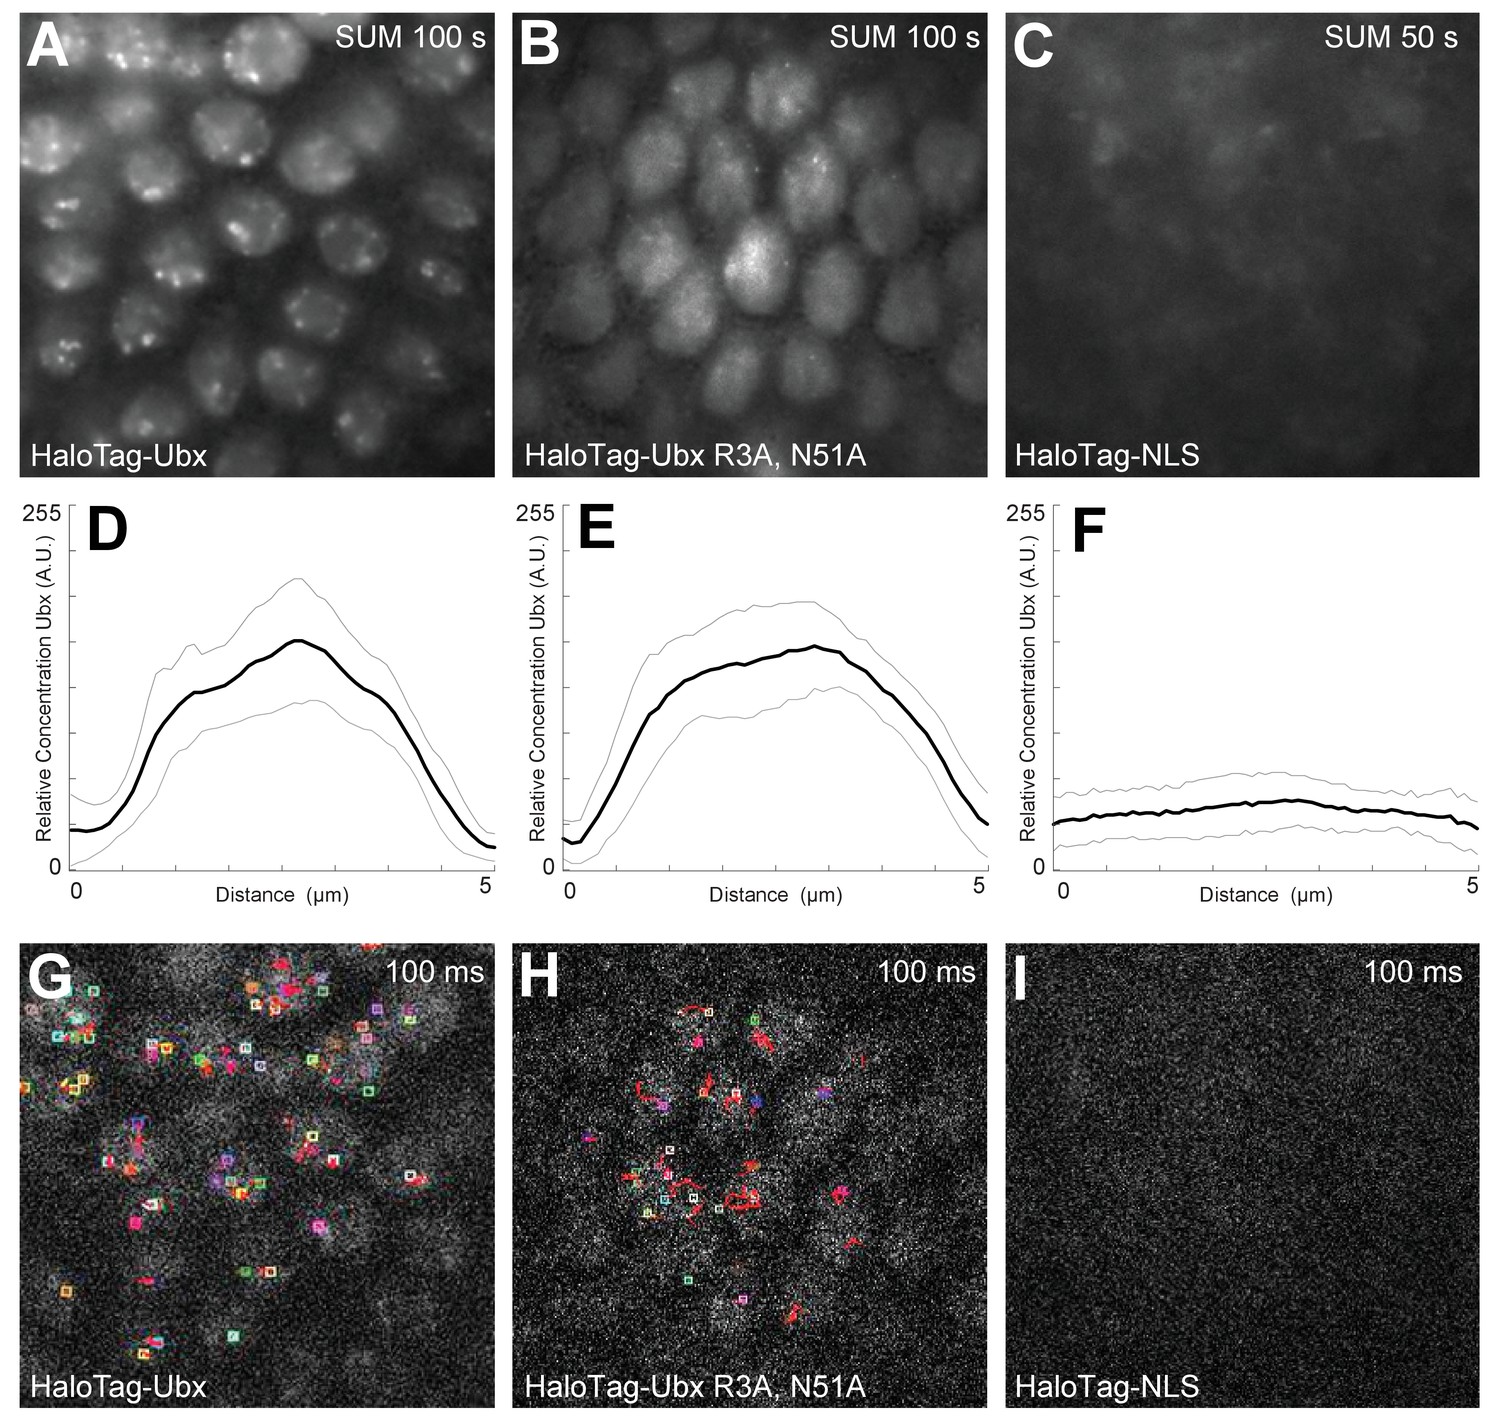
DNA-binding deficient Ubx is stable and localized in the nucleus.
(A, B, C) Projections of summed pixel intensity over 100 or 50 seconds (as indicated in the top right corner of the panels) from videos of (A) HaloTag-Ubx, (B) HaloTag-Ubx(R3A, N51A), and (C) HaloTag-NLS (from H2B). (D, E, F) Average intensity profiles across the nuclei in the field of view of the previous panels, showing nuclear enrichment for both variants of HaloTag-Ubx fusion proteins but no enrichment for the NLS-HaloTag construct, which is unstable. The light grey lines show the variance. (G, H, I) Sample frame from single-molecule localization using Fiji, showing (G) short but localized binding of HaloTag-Ubx, (H) very short and fast moving single-molecule traces from DNA-binding deficient HaloTag-Ubx, and (I) no localization at all for the unstable HaloTag-NLS.
Figure 2 with 1 supplement
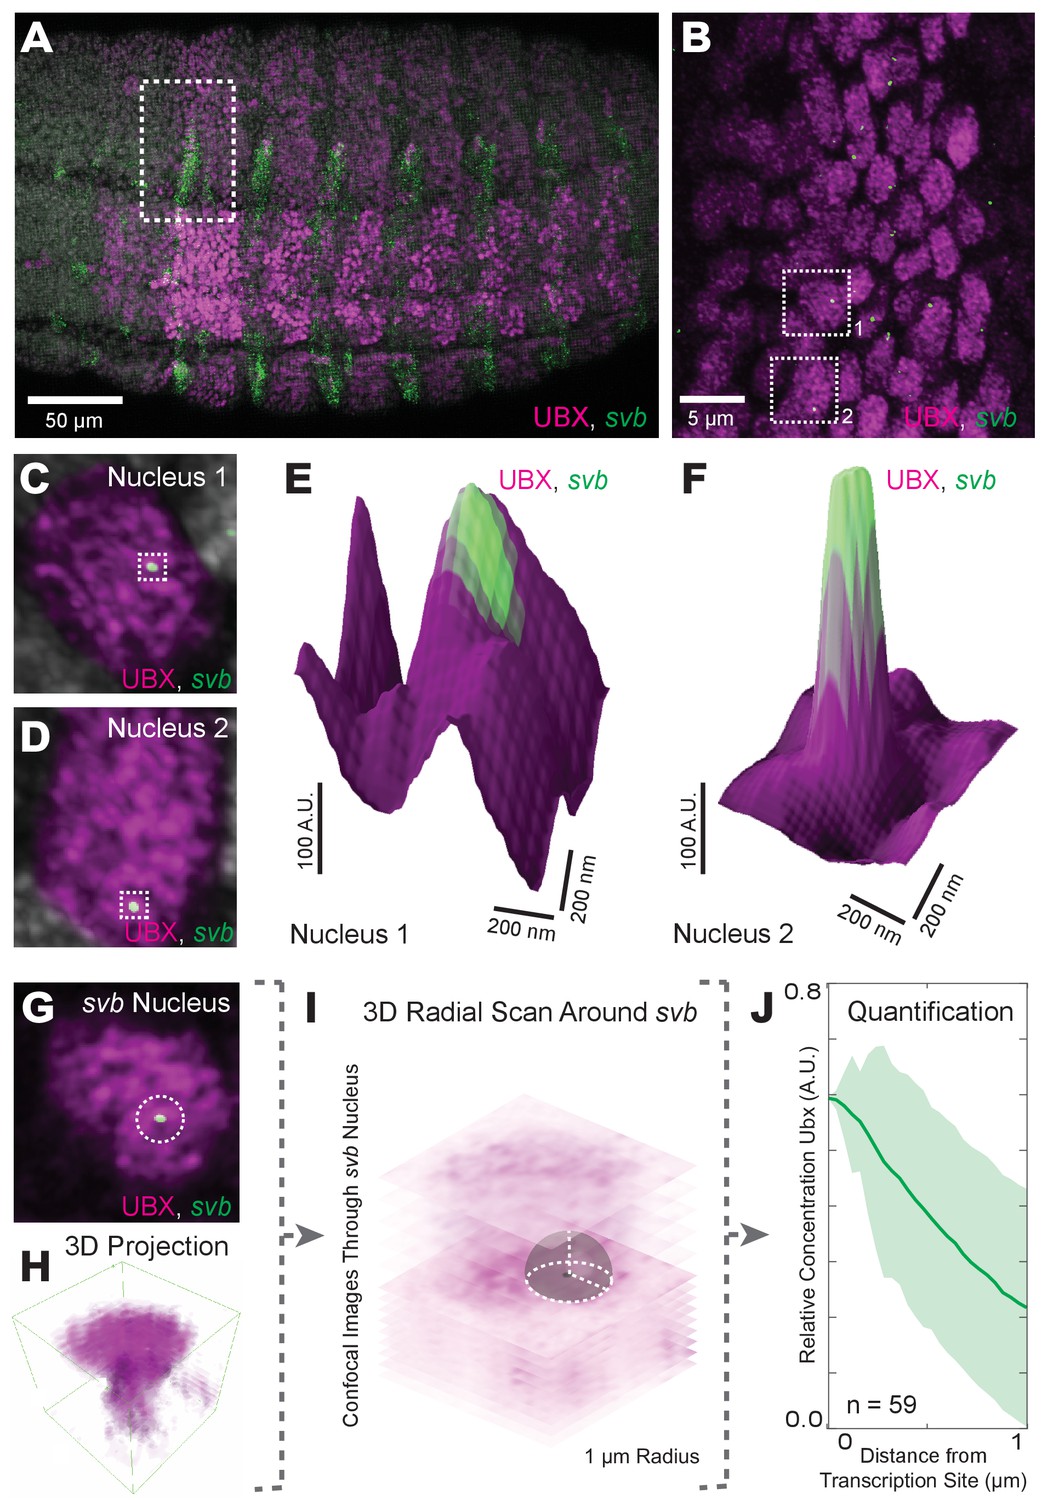
Transcriptionally active svb loci reside in regions of high Ubx concentration.
(A) Embryos co-stained for both Ubx protein (magenta) and shavenbaby (svb) intronic mRNA (green). Bright spots of svb intronic nascent mRNA mark actively transcribed svb loci. Regions with high levels of both svb transcription and Ubx appear white (the sum of the two colors). (B) Higher magnification, Airyscan image of the region noted in panel (A), revealing sites of svb transcription (green). (C, D) Higher magnification, Airyscan images of the nuclei noted in panel (B). (E, F) 3D surface plots of the images in panels (C) and (D), centered on the sites of svb transcription (green), where height represents Ubx intensity. (G) A representative nucleus used for quantifying Ubx distribution around a svb transcription site. (H) 3D view of the confocal stack from the nuclei in panel (G). (I) Schematic outlining the method of Ubx quantification surrounding svb transcriptional sites. A 3D radial distribution of the average Ubx intensity on the surface of a sphere centered at the site of svb transcription was calculated. The gray sphere and white outlines is an example of the sphere with a radius r = 1 μm. (J) Quantification of the average relative concentration of Ubx and the distance from svb transcription sites (n = 59, see method supplements ‘settings for extracting radially averaged distributions’ for how relative concentration is computed). The shaded region indicates the variance. A.U. indicates Arbitrary Units of fluorescence intensity.
Figure 2—figure supplement 1
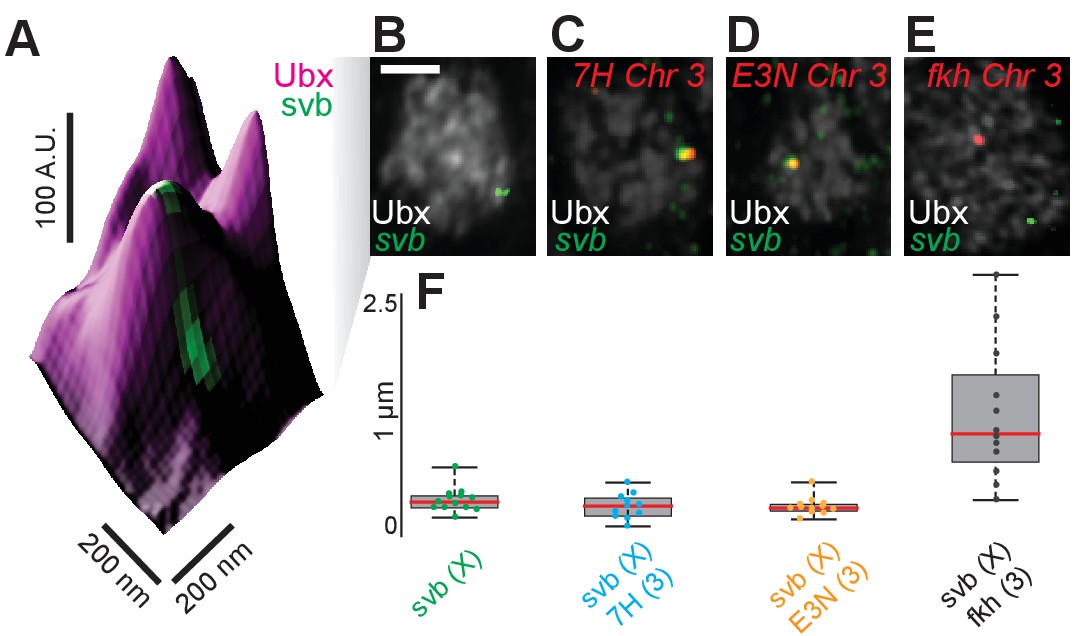
Transcription sites of minimal svb enhancers and the endogenous svb locus localize close to each other.
(A) 3D surface plot of a nuclear region showing two transcriptionally active svb loci close by and possibly within the same Ubx environment. The embryo is co-stained for Ubx (magenta) and the introns of nascent svb mRNA (green). The height of the plot indicates the Ubx intensity. A.U. indicates Arbitrary Units of fluorescence intensity. (B) The whole nucleus shown in (A), with Ubx in white and svb intronic mRNA in green. The svb locus is on the X chromosome. The scale bar is 2 µm. (C, D, E) The same plot as (B) stained additionally for either a reporter mRNA (lacZ) under the control of 7H (C) or E3N (D) minimal enhancers derived from svb or introns of the nascent mRNA of the endogenous forkhead locus (fkh, E). All are on chromosome 3. (F) Quantification of the distance between pairs of transcription sites. The red line is the mean, the grey box is the standard error, and the black bars are the maxima and minima of the distribution. The number of transcription site pairs are: n = 13 (svb only), n = 11 (svb & 7H), n = 12 (svb & E3N), and n = 12 (svb & fkh).
Figure 3 with 1 supplement
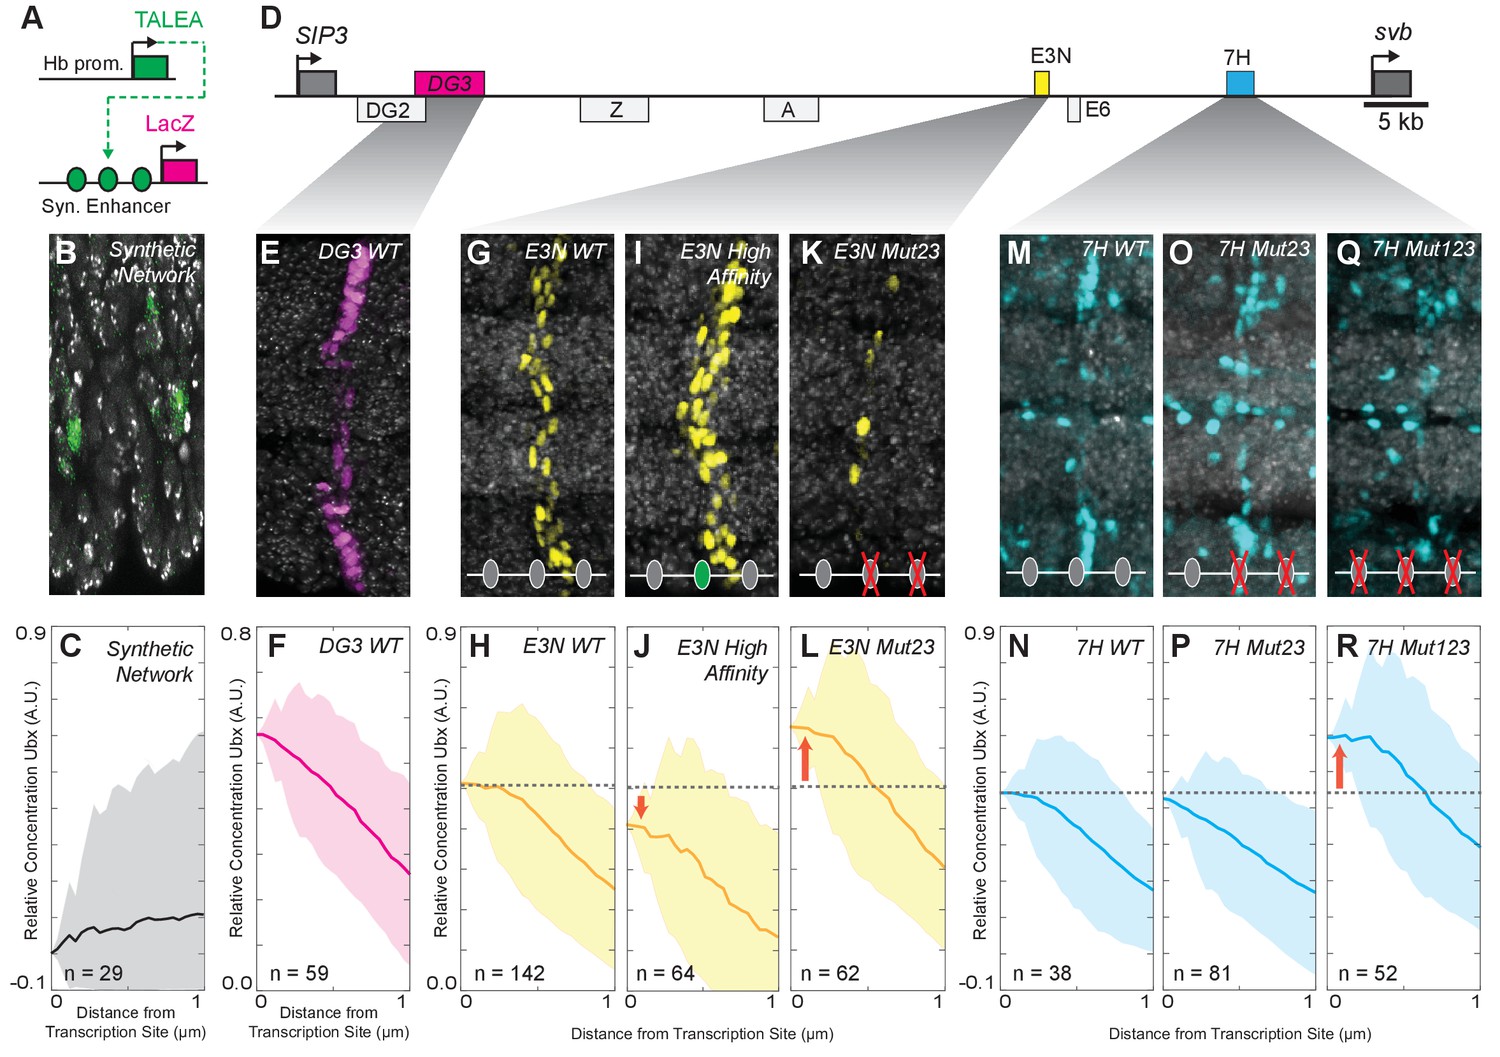
Manipulation of Ubx-binding site number and affinity alters the level of Ubx enrichment around svb enhancers.
(A) Schematic of the synthetic TALEA transcription network driven by the Hunchback (Hb) promoter, indicating TALEA-binding sites with green circles. (B) Early stage 15 embryos carrying the TALEA synthetic network stained with an antibody against ß-Galactosidase. (C) Quantification of the relative concentration of Ubx based on the distance from synthetic network transcription sites. (D) Schematic of the shavenbaby locus, indicating embryonic cis-regulatory enhancers in boxes. The ventral embryonic enhancers DG3, E3N and 7H are highlighted in magenta, yellow and blue boxes, respectively. (E, G, I, K, M, O, Q) Early stage 15 embryos carrying the reporter constructs DG3-lacZ (E), E3N-lacZ (G, I, K), or 7H-lacZ (M, O, Q) stained with an antibody against ß-Galactosidase, with Ubx-Exd sites altered as indicated. (F, H, J, L, N, P, R) Quantification of the relative concentration of Ubx versus the distance from svb transcription sites. The shaded regions in panels (C, F, H, J, L, N, P, R) indicate the variance. A.U. indicates Arbitrary Units of fluorescence intensity.
Figure 3—figure supplement 1
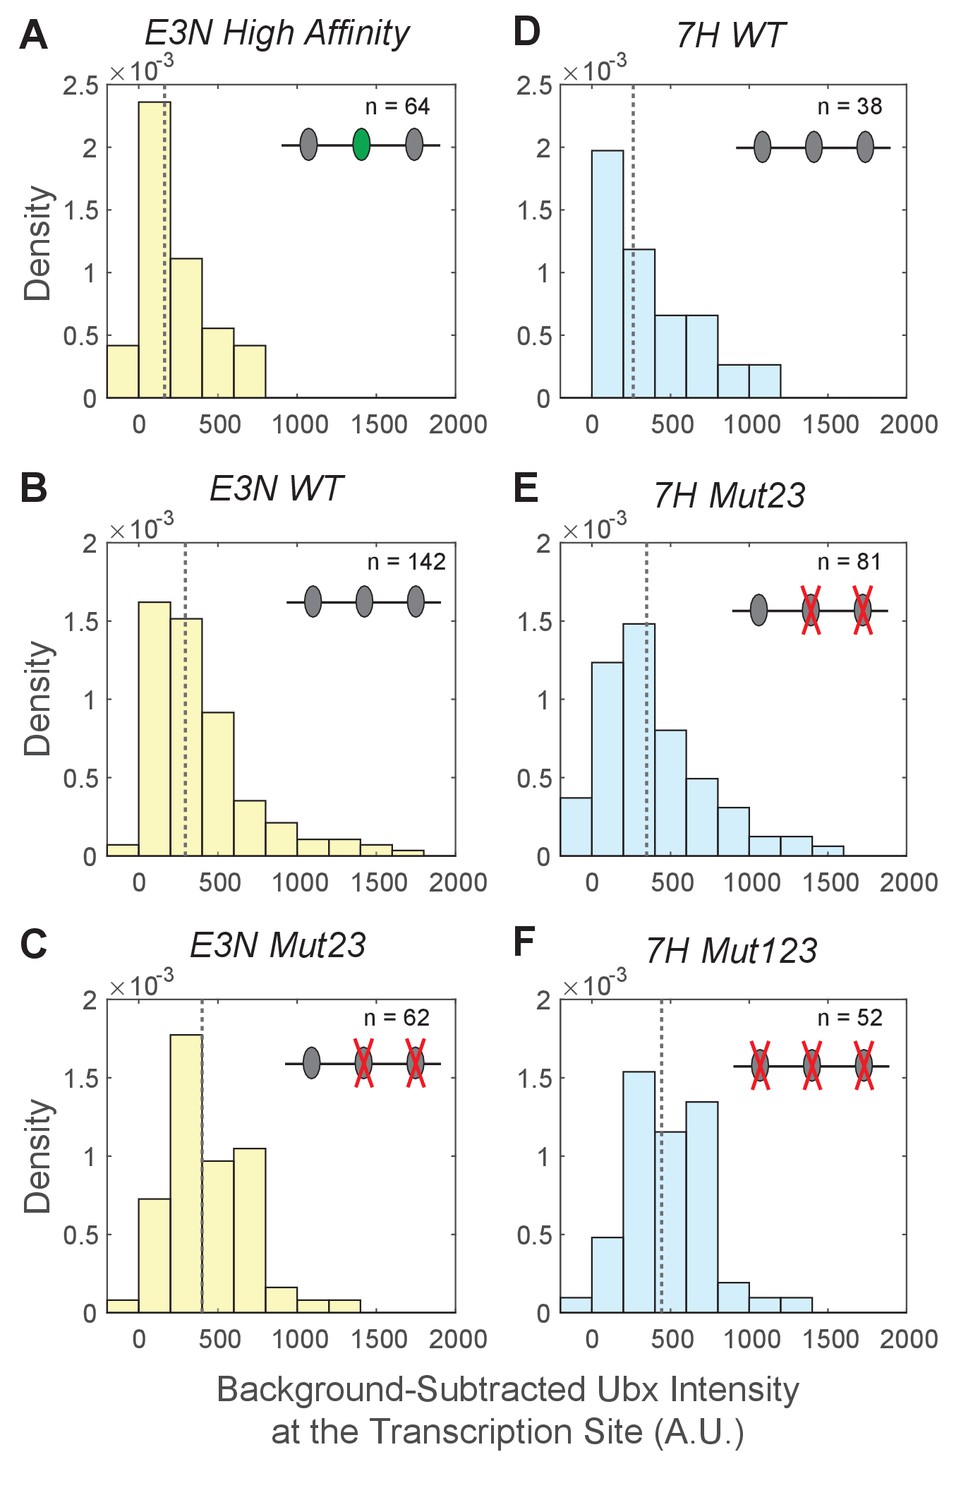
Background-subtracted Ubx intensity distributions at the transcription sites for E3N and 7H enhancers.
The Ubx intensity distributions at transcription sites were plotted for the E3N and 7 hr enhancers after subtraction of background fluorescence from raw Ubx intensities. The naming convention of the enhancers follows that of Figure 3. The density (y-axis) for each distribution is calculated by the count per bin divided by a normalization factor. The normalization factor is the bin size multiplied by the number of transcription sites (n) in the dataset. The dotted gray line is the median of the distributions, which are: (A) 160 for E3N High Affinity, (B) 290 for E3N WT, (C) 400 for E3N Mut23, (D) 260 for 7H WT, (E) 350 for 7H Mut23, and (F) 440 for 7H Mut123.
Figure 4
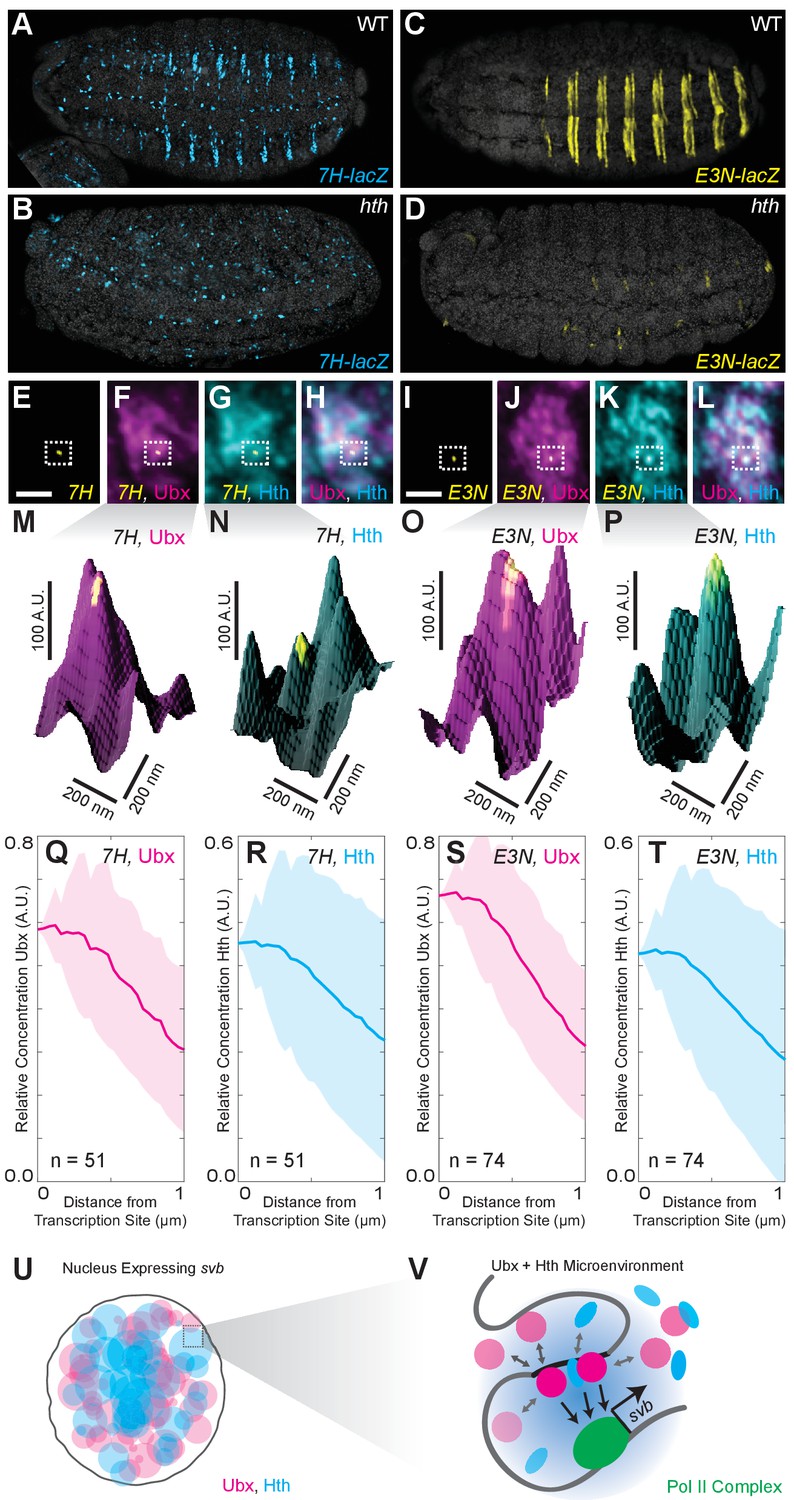
Ubx and its cofactor Hth are co-enriched around transcription sites.
(A–D) Early stage 15 embryos with 7H-lacz (A–B) or E3N-lacZ reporter constructs (C–D) stained with an antibody against ß-Galactosidase in either wild-type (WT) (A and C) or hthP2 mutant embryos (B and D). (E–H) A nucleus displaying active transcription of the 7H-lacZ reporter construct denoted by a bounding box (E–H) and co-stained for Ubx protein (F), Hth protein (G), or both Ubx and Hth proteins (H). (I–L) A nucleus displaying active transcription of the E3N-lacZ reporter construct denoted by a bounding box (I–L) and co-stained for Ubx protein (J), Hth protein (K), or both Ubx and Hth proteins (L). (M–P) 3D surface plots of the images in panels (F, G, J, K), centered on the sites of enhancer activity (yellow). The height of the plot is Ubx intensity in panels (M) and (O) and Hth intensity in panels (N) and (P). (Q–T) Quantification of the relative concentration of Ubx (Q, S) and Hth (R, T) versus distance from active enhancer sites. The shaded regions indicate the variance. A.U. indicates Arbitrary Units of fluorescence intensity. (U, V) A conceptual model showing nuclei with multiple regions of high local concentrations of Ubx or Hth (U) and high local concentrations of both Ubx and Hth that allow rapid ON rates (V, grey arrows) and collectively may recruit RNA pol II complexes.
Additional files
-
Source code 1
Matlab script to average radially averaged intensity distributions from individual transcription sites and offset background fluorescence.
- https://doi.org/10.7554/eLife.28975.015
-
Transparent reporting form
- https://doi.org/10.7554/eLife.28975.016
Download links
A two-part list of links to download the article, or parts of the article, in various formats.
Downloads (link to download the article as PDF)
Open citations (links to open the citations from this article in various online reference manager services)
Cite this article (links to download the citations from this article in formats compatible with various reference manager tools)
Nuclear microenvironments modulate transcription from low-affinity enhancers
eLife 6:e28975.
https://doi.org/10.7554/eLife.28975


