Bacterial colonization stimulates a complex physiological response in the immature human intestinal epithelium
- University of Michigan, United States
- Montana State University, United States
Figures
Figure 1 with 3 supplements
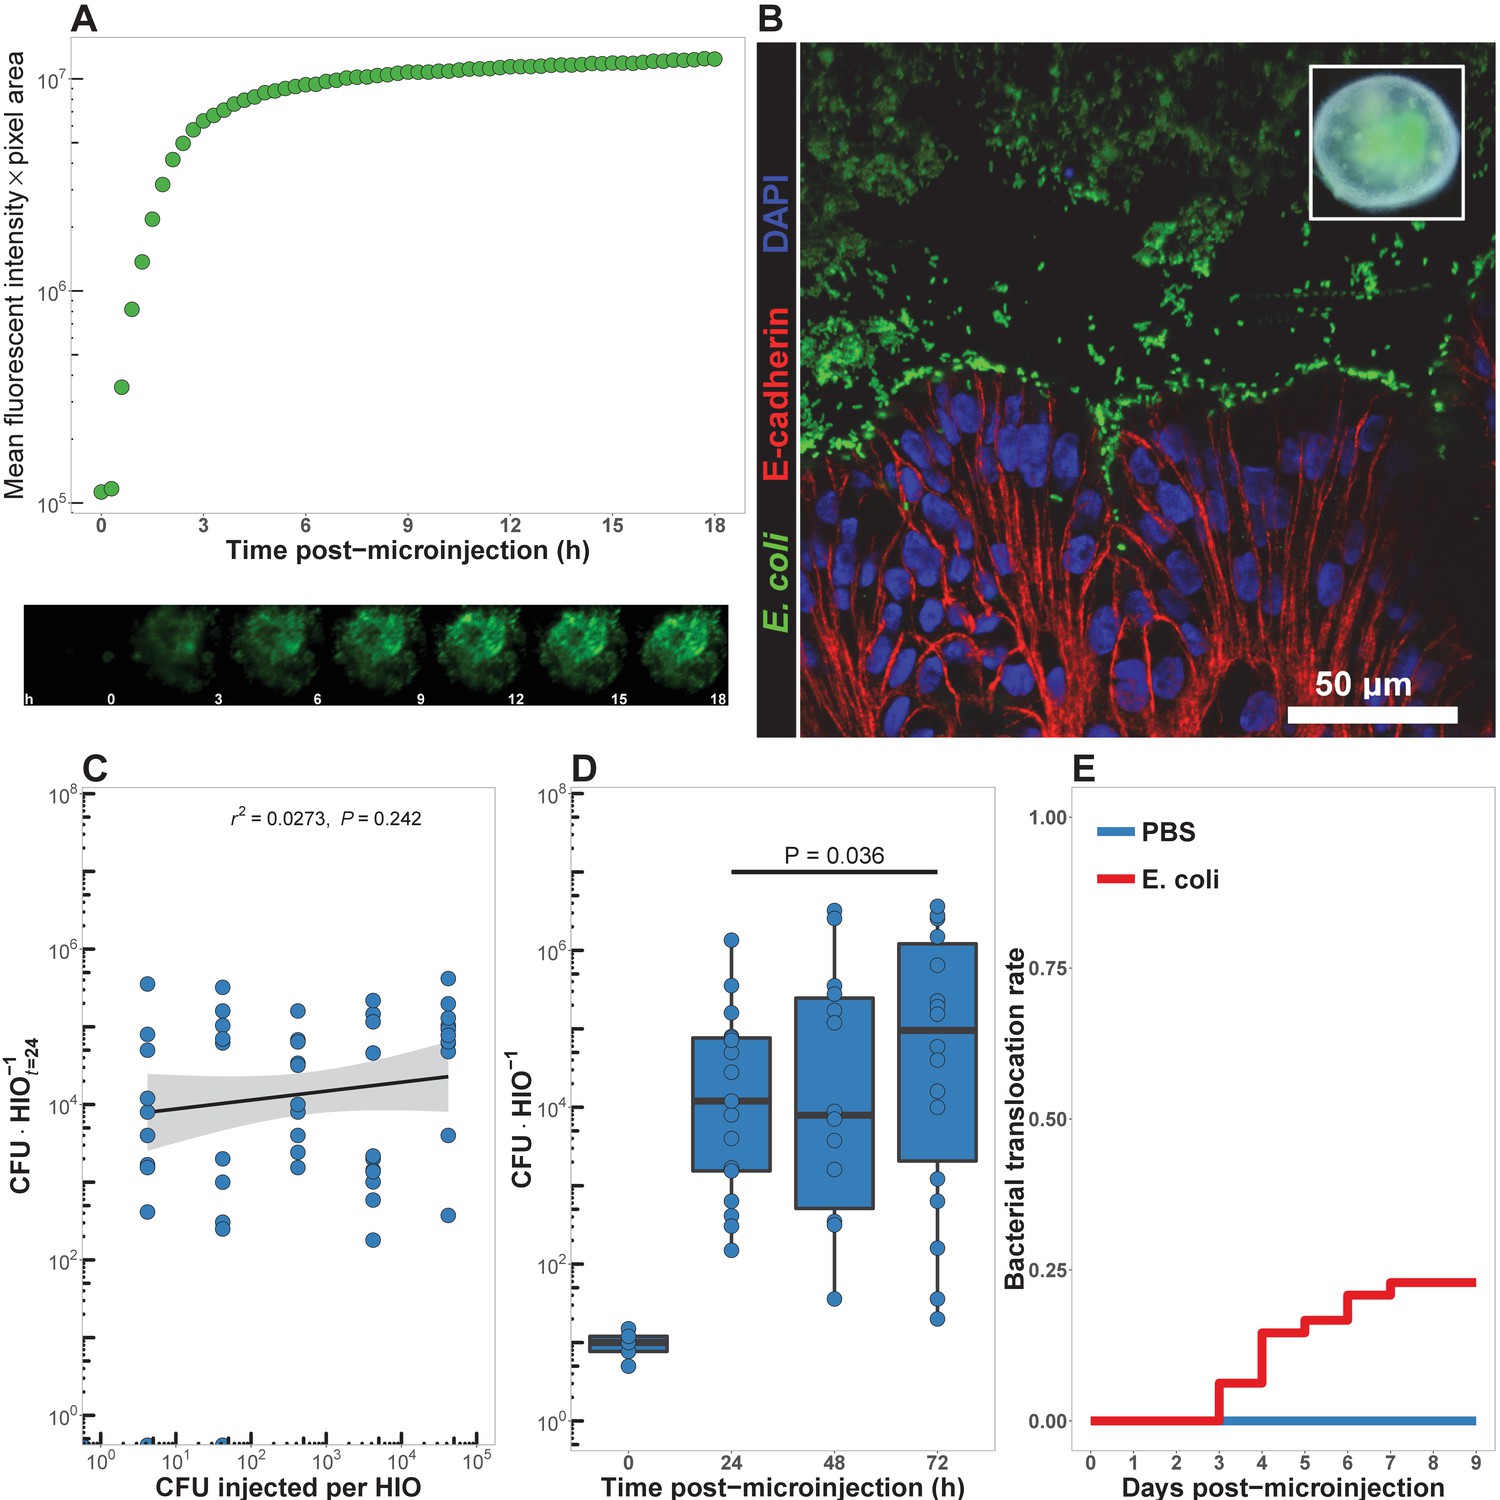
HIOs can be stably associated with non-pathogenic E. coli.
(A) Mean fluorescent intensity of a human intestinal organoid (HIO) containing live GFPE. coli str. ECOR2. The lower panels show representative images from the time series. Representative of three independent experiments. Video 1 is an animation corresponding to this dataset. (B) Confocal micrograph of the HIO epithelium (E-cadherin) in direct association with GFP+ E. coli at 48 hr post-microinjection with 104 live E. coli. 60X magnification. (C) Luminal CFU per HIO E. coli at 24 hr post-microinjection relative to the injected concentration of 5 × 10⁻¹ to 5 × 10⁵ CFU per HIO at the start of the experiment. N = 10 biological replicates per E. coli dose. The r and P value shown in the figure represent the results of a linear regression analysis of the relationship between the 24 hr change in CFU/HIO and the initial number of CFU injected. (D) Luminal CFU per HIO at 0–72 hr following microinjection with 10 CFU E. coli per HIO. N = 13–17 replicate HIOs per time point. The p-value represents the results of a two-tailed Student’s t-test comparing the two conditions indicated. (E) Daily proportion of HIO cultures with no culturable E. coli in the external media following E. coli microinjection (N = 48) or PBS microinjection (N = 8).
Figure 1—figure supplement 1
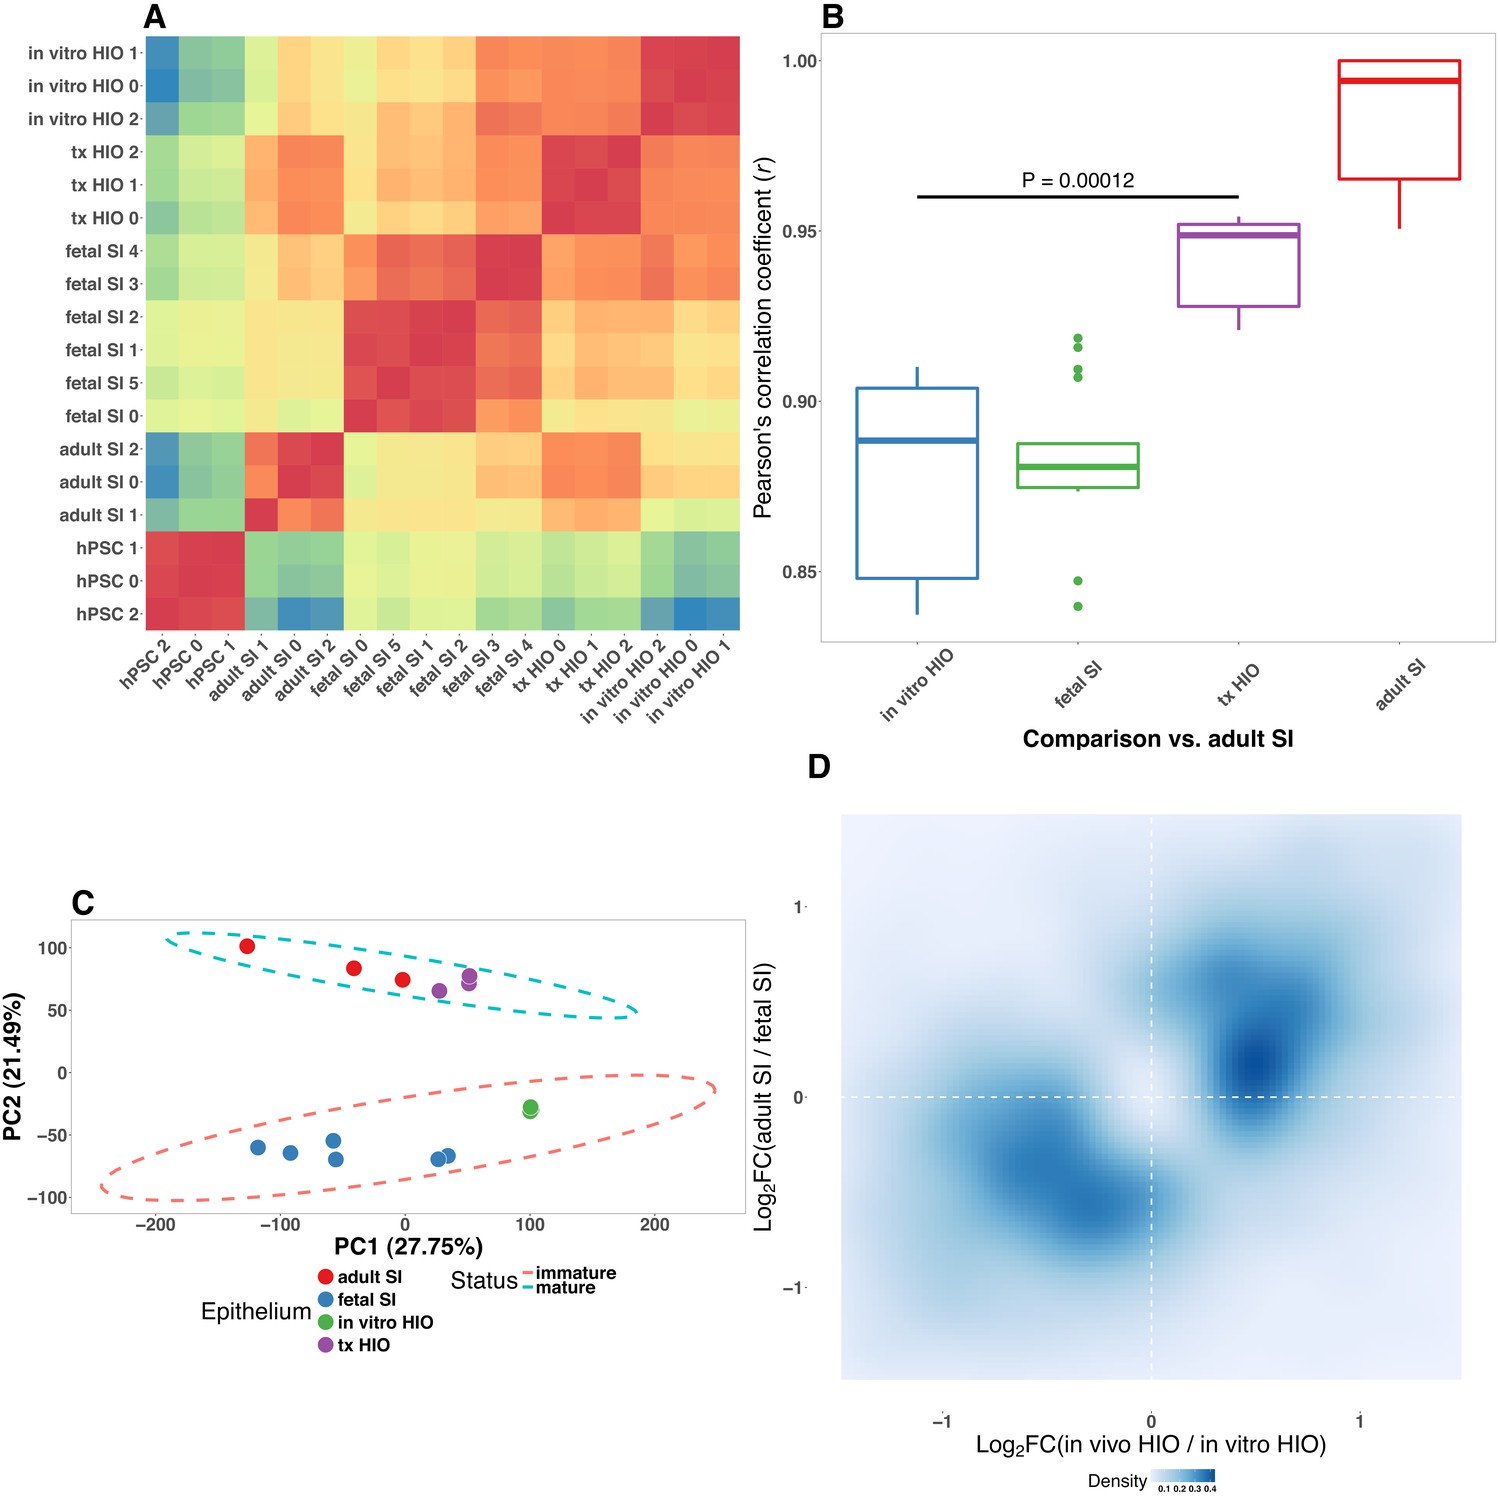
Pluripotent stem-cell-derived intestinal epithelium transcriptionally resembles the immature human intestinal epithelium.
(A) Pearson’s correlation matrix with heirarchical clustering forwhole-transcriptome normalized RNA-seq gene counts from epithelium isolated from the tissuesindicated on the axes. (B) Pearson’s correlation coefficient for the comparison of whole-transcriptome normalized RNA-seq gene counts between each of the sample types listed onthe x-axis and adult small intestinal epithelium. p-Value indicates the results of an unpaired two-sided Student’s t-test. (C) Principle component analysis of whole-transcriptome RNA-seq normalized gene counts. Cumulative explained variance for PC1 and PC2 is indicated as a percentage on the x- and y-axes, respectively. (D) Density plot of the Log2 -transformed Fold change in gene expression in epithelium from transplanted HIOs over epithelium from HIOs cultured in vitro plotted against the Log 2 -transformed Fold change in gene expression in adult small intestinal epithelium over fetal small intestinal epithelium. The intensity of the blue color indicates the density of points in 2-dimensional space. SI, small intestine; tx, transplanted tissue; hPSC, human pluripotent stem cell; HIO, human intestinal organoid.
Figure 1—figure supplement 2
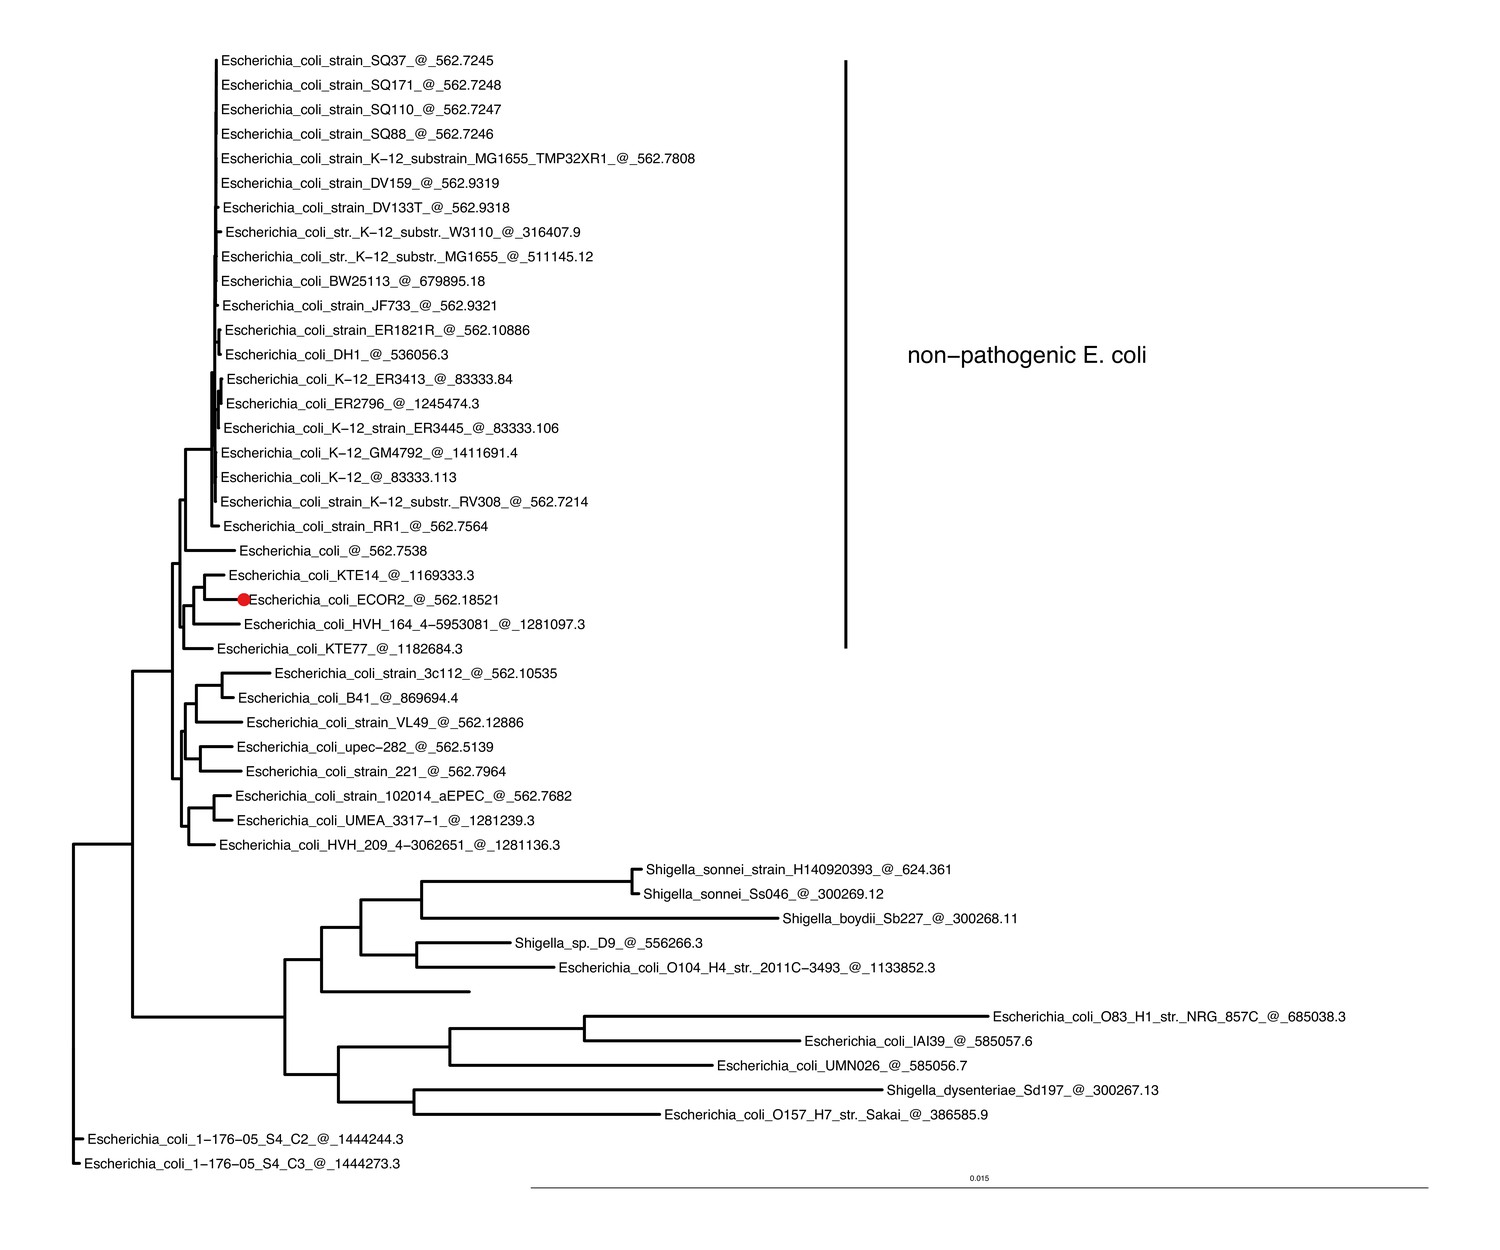
Phylogenetic tree based on maximum liklihood genomic distance among E.coli str.
ECOR2 (Ochman and Selander, 1984), the strain used in the HIO colonization experiments, closely related E. coli isolates available on the PATRIC (Wattam et al., 2017) database, and pathogenic type strains from the genera Esherichia, Shigella, and Salmonella. A PATRIC genome reference number follows name of each taxa.
Figure 1—figure supplement 3
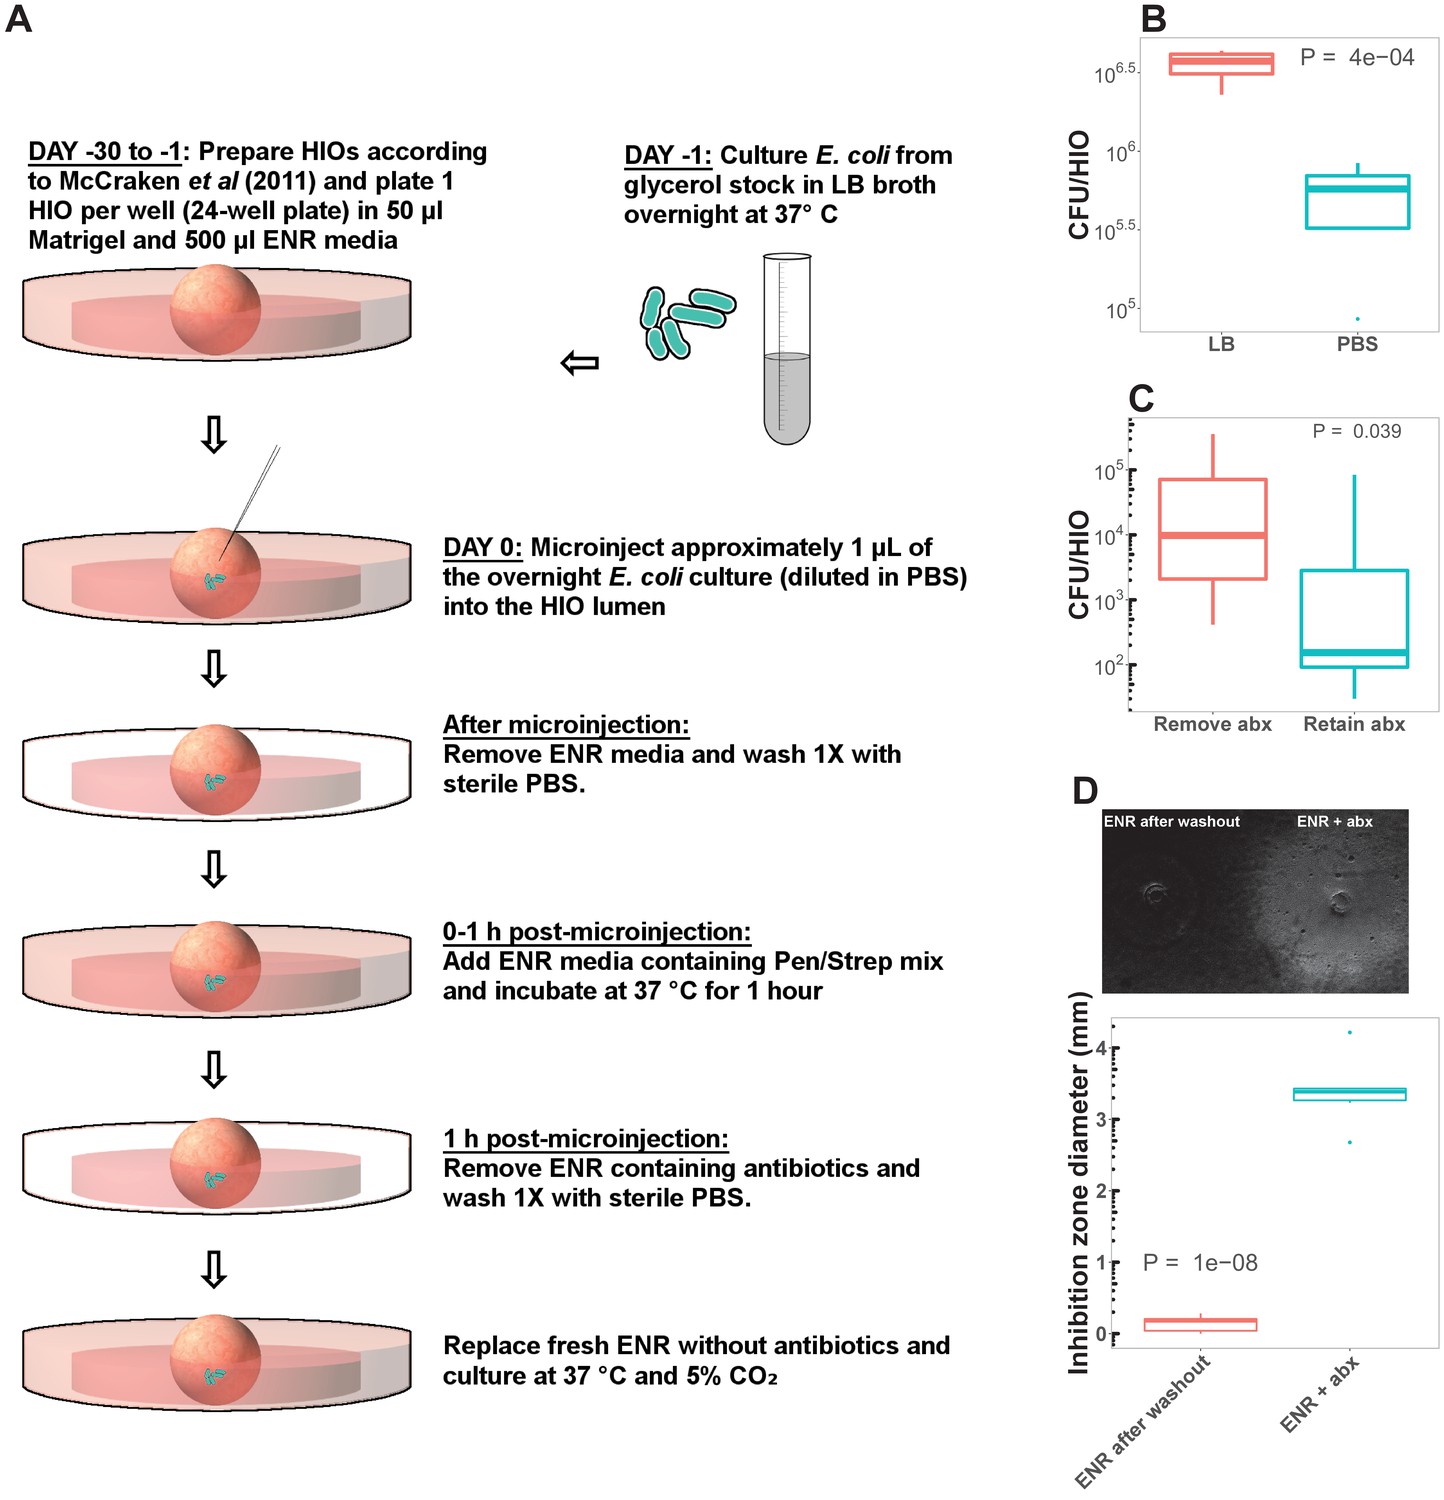
HIO colonization protocol.
(A) Schematic representation of the microinjection of HIOs with live E. coli. See Materials and Methods for additional details. (B) A comparison of CFU/HIO at 24 hpost-microinjection of HIOs microinjected with 10 × 103 CFU live E. coli diluted in sterile PBS or fresh LB broth. N = 5 HIOs per condition. All experiments presented in the main paper represent E. coli diluted in PBS. (C) To test for the effect of antibiotic carryover of E. coli growth in the HIO lumen, we compared CFU/HIO in HIOs cultured in antibiotic-free media ('Remove abx') or media containing penicillin and streptomycin at 24 hr post-microinjection with 10 3 CFU (colony forming units) live E. coli. All experiments presented in the main paper represent HIOs cultured in antibiotic-free media due to the apparent effect of antibiotics in suppressing E. coli growth within the HIO lumen. N = 5 HIOs per condition. (D) In several experiments, bacterial translocation was measured by samplign the external HIO culture media (Figure 1 and 8). To evaluate the potential influence of antibiotic carryover in our estimates of bacterial translocation, we measured growth inhibition in E. coli cultures plated as a lawn of LB agar and treated with 1 μl samples of HIO media collected during the 1 hr antibiotic wash step or after HIO culture washout with PBS and replacement with fresh antibiotic-free media (see panel A). N = 6 replicates per culture condition. All p-values represent the results of unpaired one-tailed Student’s t-test comparisons.
Figure 2
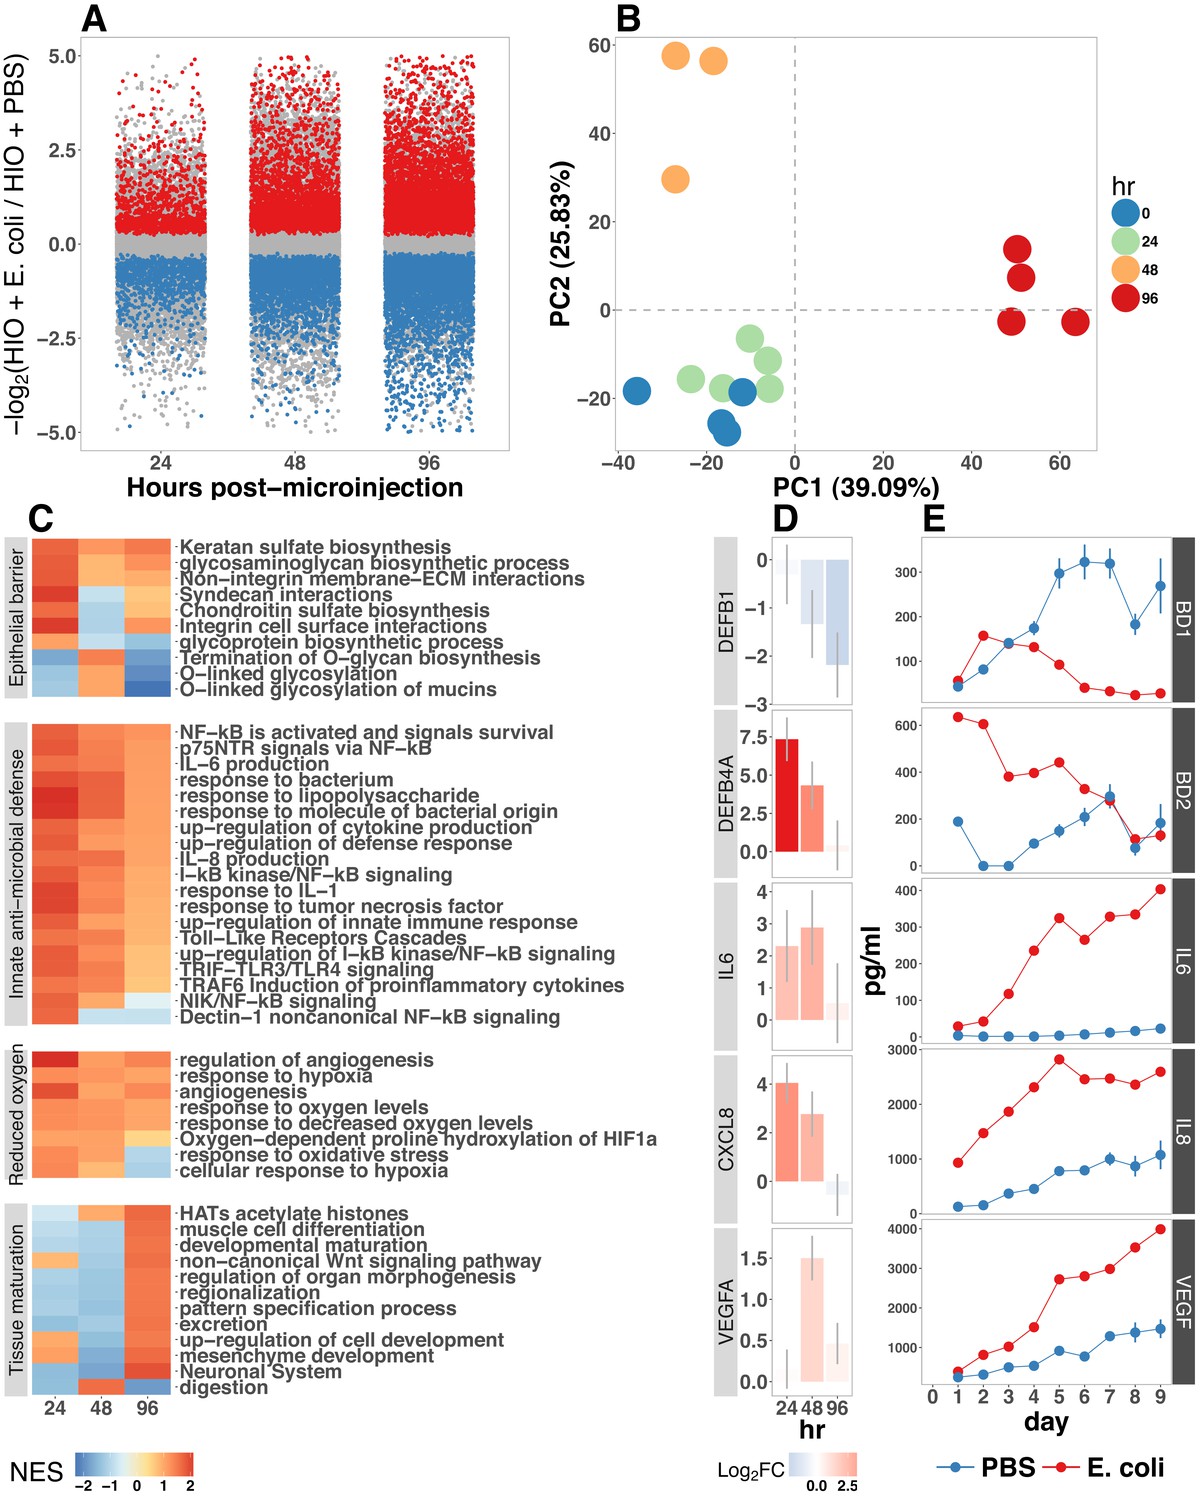
(A) Log2-transformed fold change in normalized RNA-seq gene counts in E. coli colonized HIOs at 24, 48, and 96 hr post-microinjection with 104 live E. coli relative to PBS-injected HIOs. Differentially expressed genes (FDR-adjusted p-value < 0.05) are indicated in red (up-regulated) or blue (down-regulated). Plotted results are the mean fold change per gene for each group. (B) Principle component plot of HIOs at 0–96 hr post-microinjection derrived from whole-transcriptome RNA-seq normalized gene counts. Cumulative explained variance for PC1 and PC2 is indicated as a percentage on the x- and y-axes, respectively. (C) Heat map of normalized enrichment scores (NES) from GSEA of normalized RNA-seq expression data using the GO and REACTOME databases. A positive value of NES indicates activation of a given gene set and a negative value suggests relative suppression of a gene set. All NES scores are calculated relative to PBS-microinjected controls. (D) Mean log fold change in normalized RNA-seq gene counts at 24–96 hr post microinjection relative to PBS-injected control HIOs. (E) Protein secretion at 0–9 days post-microinjection with PBS or E. coli as measured by ELISA in the supernatant of HIO cultures. The genes given in D correspond to the proteins measured in E. N = 4 (0 hr), 5 (24 hr), 3 (48 hr), and 4 (96 hr) biological replicates consisting of 5–6 pooled HIOs per replicate for panels A-D. N = 48 E. coli-injected HIOs and N = 8 PBS-injected HIOs for panel E.
Figure 3 with 1 supplement
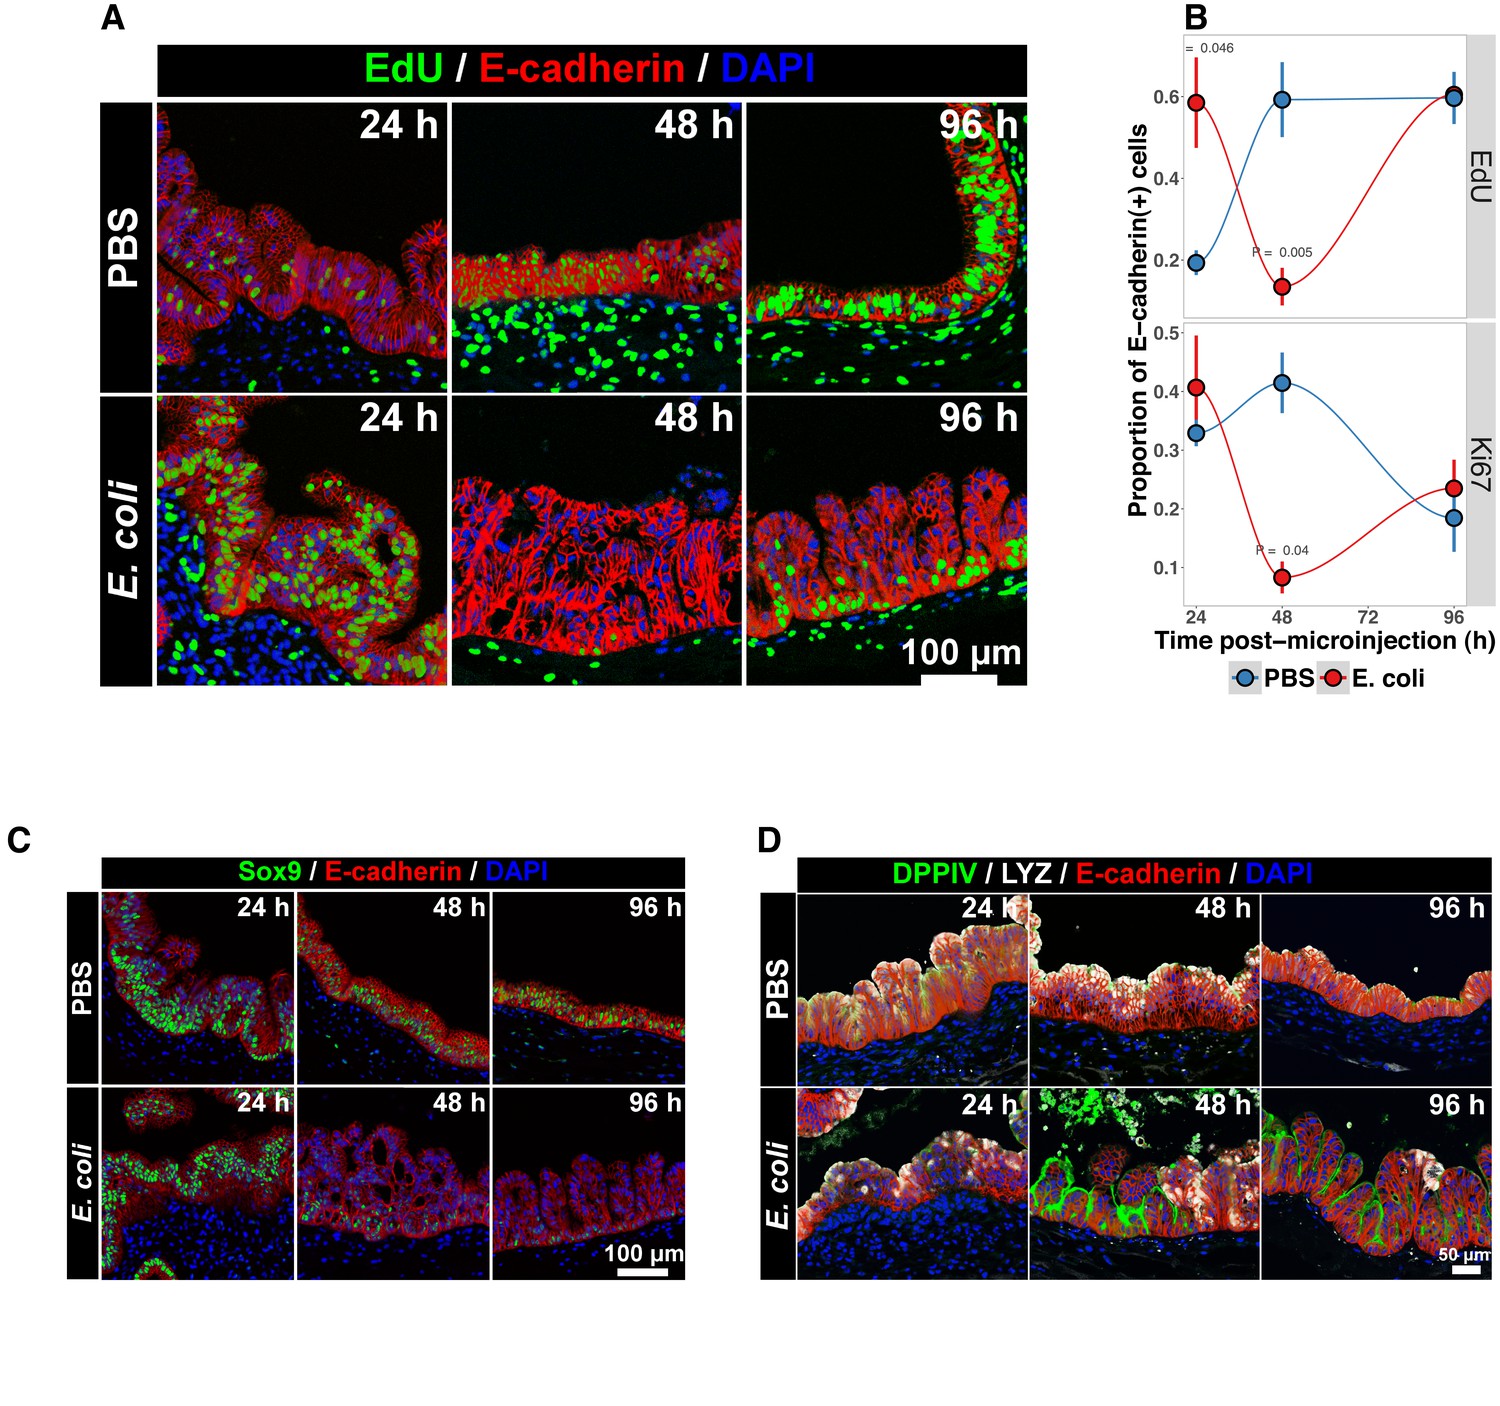
Bacterial colonization results in a transient increase in epithelial proliferation and the maturation of enterocytes.
(A) Representative confocal micrographs of HIOs injected with PBS or 104 CFU E. coli str. ECOR2 at 24–96 hr post-microinjection and stained with fluorescent indicators for for EdUDNA, E-cadherin, or nuclei (DAPI) as indicated in the figure labels . All HIOs were exposed to 10 M EdU at 22 hr post-microinjection and EdU was removed at 24 hr. Panels are representative of 4 HIOs per timepoint per treatment condition. (B) Quantification of the number of EdU-positive and Ki67-positive epithelial cells (E-cadherin cells) per 10X confocal microscopy field. One 10X confocal microscopy field consisting of 200–1000 epithelial cells was collected from each of 4 HIOs per timepoint per treatment group. The error bars represent the standard error of the mean and the p-values reflect the results of an unpaired two-tailed Student’s t-test comparing the PBS-injected HIOs to the E. coli-injected HIOs at that timepoint. (C) Representative confocal micrographs of HIOs injected with PBS or 104 CFU E. coli str. ECOR2 at 24–96 hr post-microinjection and stained with fluorescent antibodies for Sox9, E-cadherin, or nuclei (DAPI) as indicated in the figure labels. Panels are representative of 4 HIOs per timepoint per treatment condition.
Figure 3—figure supplement 1
Pathview (Luo and Brouwer, 2013) plot of the KEGG (Kanehisa and Goto, 2000) pathway showing the Cell mitotic cycle ('HSA 04110') superimposed with RNA-seq expression data corresponding to the log2 -transformed fold change in expression of cell cycle transcripts from HIOs microinjected with E. coli relative to PBS-injected HIOs at 48 h post-microinjection.
Mean of 4 biological replicates, each representing 5-6 pooled HIOs.
Figure 4
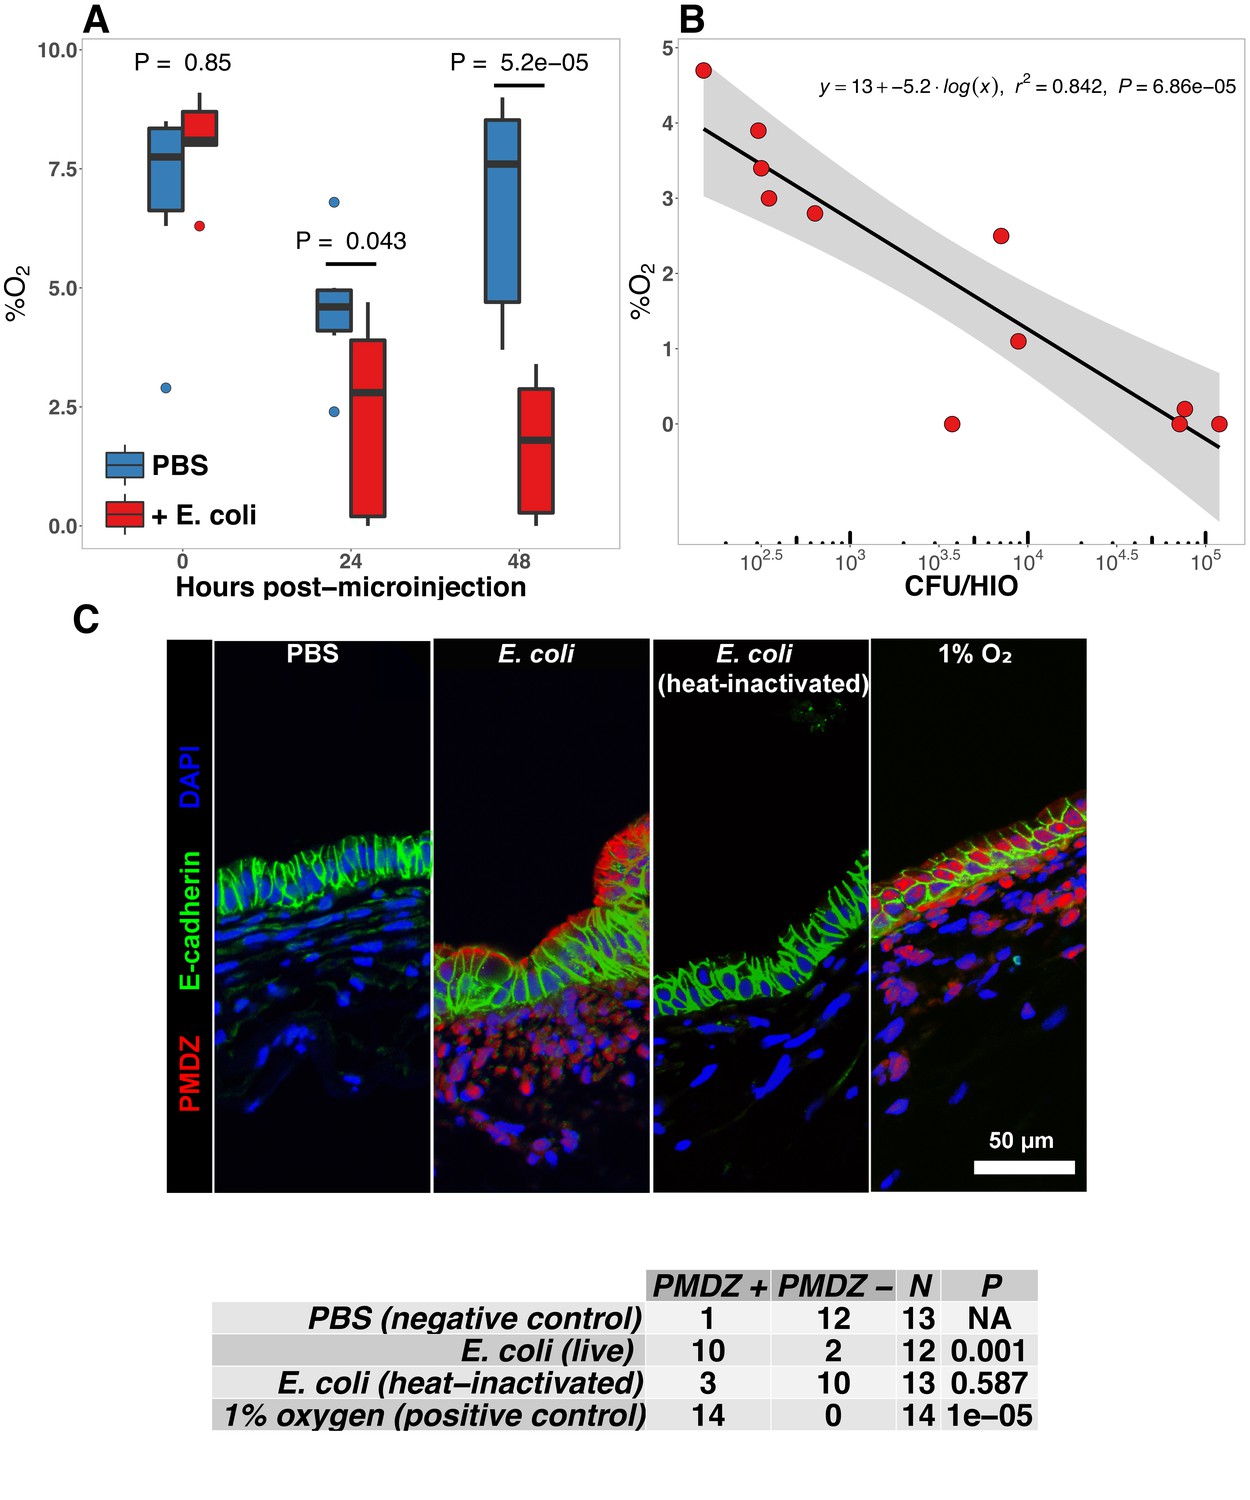
E. coli colonization is associated with a reduction in luminal oxygen concentration.
(A) Luminal oxygen concentration in human intestinal organoids at 0–48 hr post-microinjection with 104 CFU live E. coli. p Values reflect results of unpaired one-tailed Students t-tests for the comparisons indicated. N = 6–11 replicate HIOs per treatment group per time point. (B) Linear regression analysis of luminal CFU E. coli per organoid at and luminal oxygen concentration in the same organoid 24 hr post-microinjection . (C) Confocal micrographs of the HIO epithelium in PBS- and E. coli-injected HIOs at 48 hr post-microinjection. Images are representative of the replicates detailed in the table, with 12–14 replicate HIOs per treatment group pooled from two separate experiments. Individual HIOs were scored as PMDZ or PMDZ based on the presence or absence, respectively, of PMDZ conjugates as detected by immunofluorescent microscopy. p-Values represent the results of contingency tests comparing the distribution of PMDZ and PMDZ HIOs in the PBS-treated group to each of the other conditions.
Figure 5 with 2 supplements
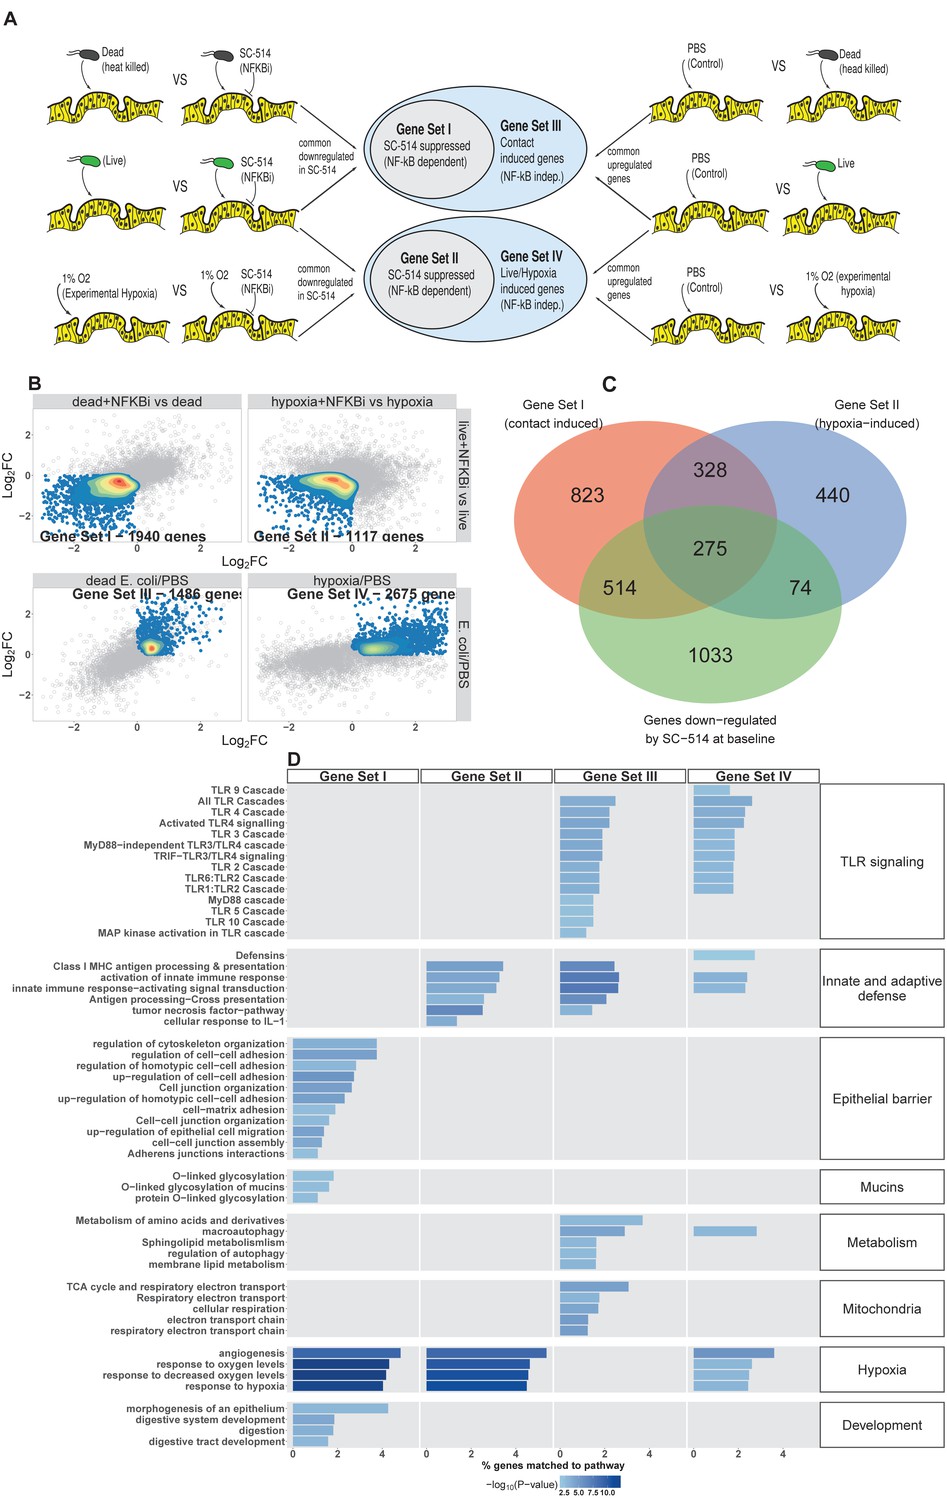
NF-κB integrates complex microbial and hypoxic stimuli.
(A) Analysis scheme for identifying genes sets representing the components of the transcriptional response to live E. coli that could be recapitulated with heat-inactivated E. coli (contact induced) or hypoxia (microbial-associated hypoxia induced) as well as the subsets of genes induced through NF-κB dependent signaling. HIOs were microinjected with PBS, 104 CFU E. coli or an equivalent concentration of heat-inactivated E. coli and cultured under standard cell culture conditions or hypoxic conditions (1% O2, 5% CO2, 94% N2) with and without 10 μM SC-514. (B) Scatter plots with density overlay indicating the genes meeting the a priori criteria identified in panel A with an FDR-adjusted p-value of < 0.05 for the comparisons listed on the axes of the plot. (C) Bar plot of the proportion of genes in the input gene sets mapping to each pathway from the GO and REACTOME databases enrichment p-values for each of the gene sets identified in A. Pathways with enrichment p-values > 0.01 were excluded from the plot. Results represent N = 4–5 biological replicates per treatment condition, with each replicate consisting of 5–6 pooled and identically treated HIOs.
Figure 5—figure supplement 1
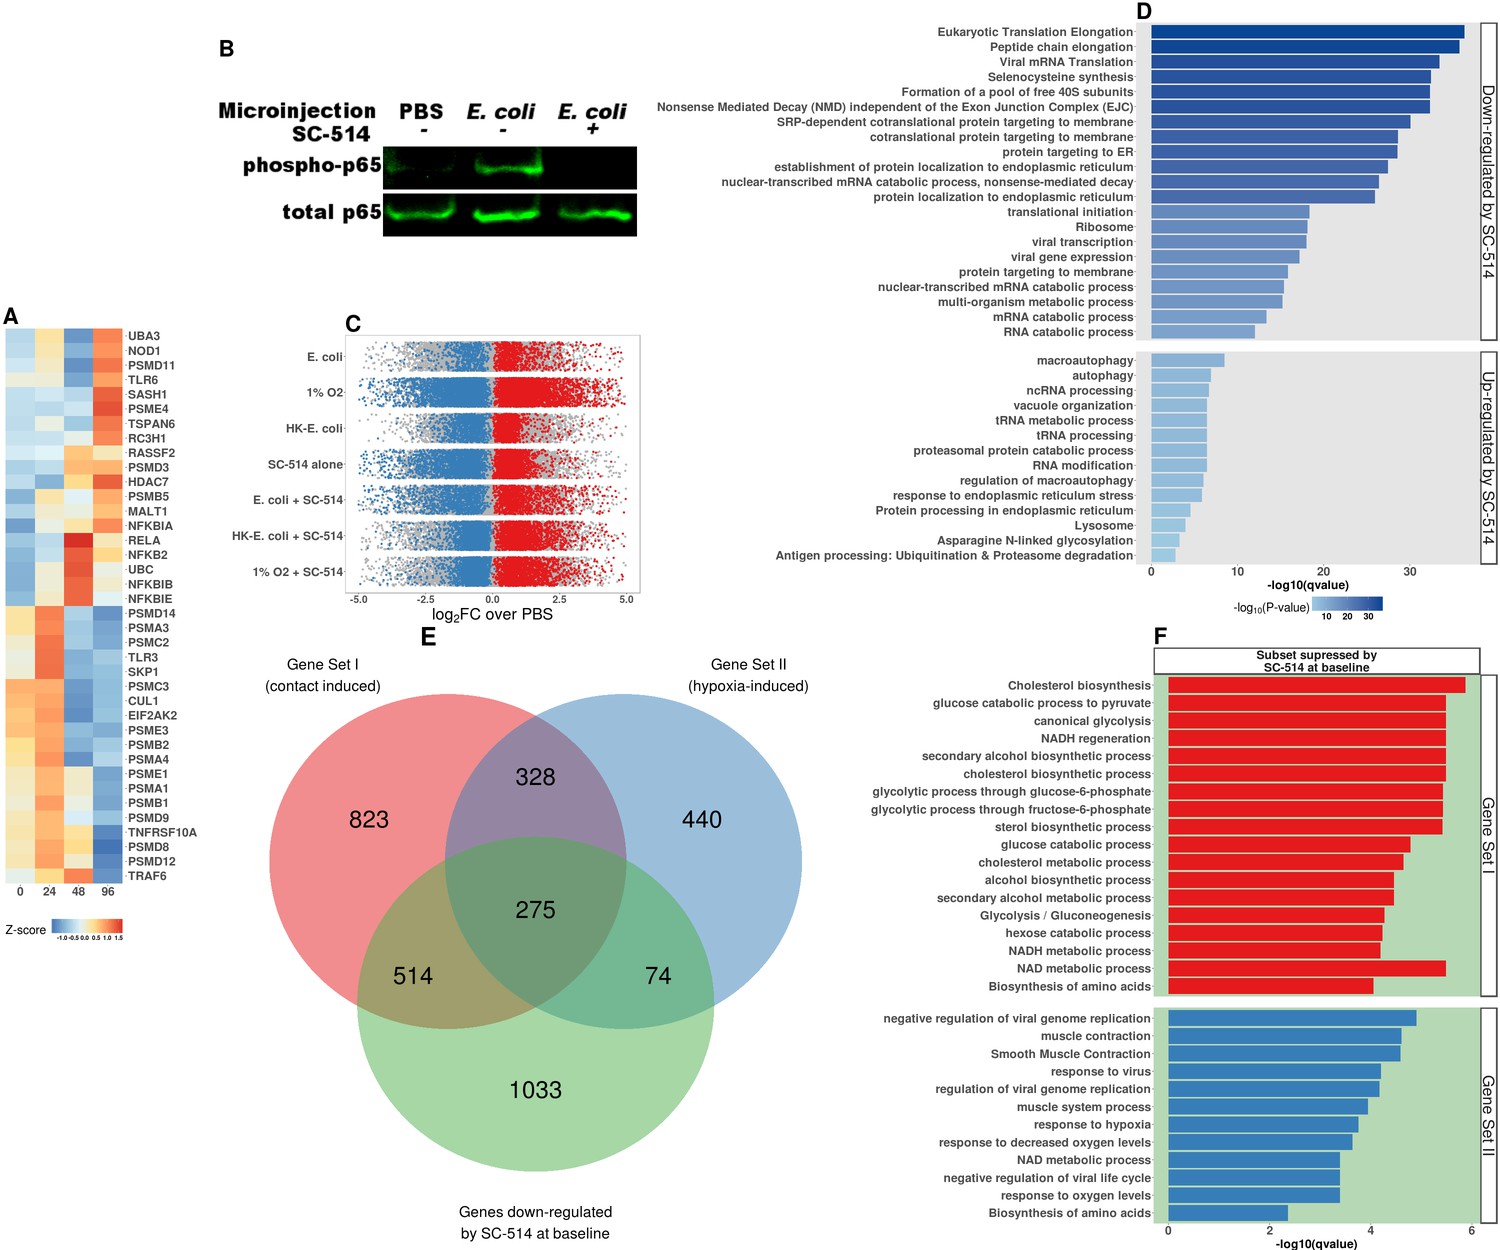
NF-κB signaling pathway acticvation in HIOs.
(A) Heatmap representation of time-dependent normalized RNA-seqgene expression for NF-κB pathway components in HIOs at 0-96 hr post-microinjection. (B) Western blot of phosphorylated p65 and total p65 in cell lysates from HIOs microinjected with PBS or live E. coli and treated with IKKβ inhibitor SC-514 (1 μM) as indicated in the figure. (C) log2-transformed fold-change in gene expression relative to PBS-injected controls for all seven experimental conditions examined in this set of experiments: live E. coli +/- SC-514, heat-killed E. coli +/- SC-514, and hypoxic culture +/- SC-514, and PBS + SC-514. Differentially expressed genes (adjusted FDR < 0.05) are indicated in red (up-regulated) or blue (down-regulated). Mean of three to five replicates per experimental condition. (D) Top 10 percentile by FDR-adjusted p-value of over-represented genes sets from the GO, KEGG, and REACTOME databases in genes that were significantly up- or down-regulated by treatment with SC-514 alone relative to PBS-injected control HIOs. (E) (Copied from Figure 5 for easeof reference) Venn Diagram showing the number of genes shared between Gene Set I, Gene Set II, and the set of genes that are significantly down-regulated in PBS-injected HIOs treated with SC-514 relative to PBS-injected control HIOs. (F) Top 10 percentile by FDR-adjusted p-value of over-represented genes sets from the GO, KEGG, and REACTOME databases in genes that were shared between Gene Set I or II and the set of genes that are significantly down-regulated in HIOs treated with SC-514 relative to PBS-injected control HIOs.
Figure 5—figure supplement 2
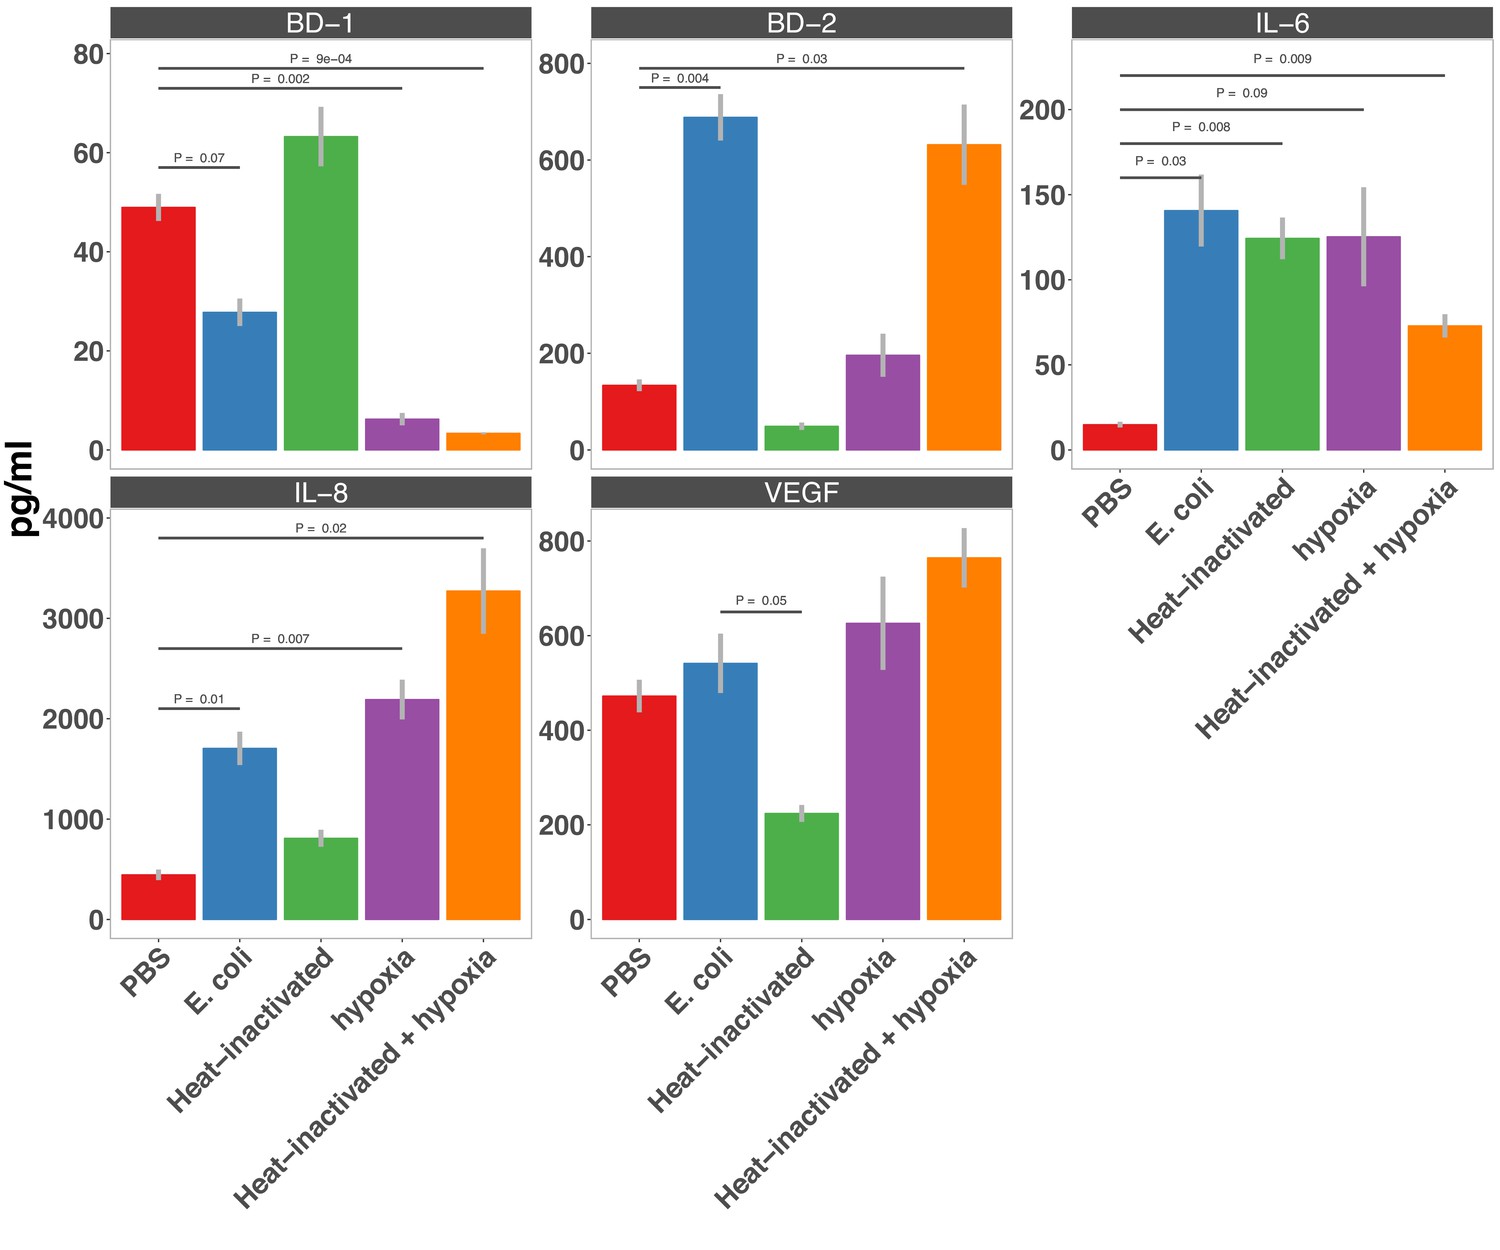
Secretion of AMPs (BD-1 & BD-2), cytokines (IL-6 & IL-8), and thepro-angiogenesis growth factor VEGF in HIOs microinjected with PBS, 10 4 CFU E.
coli, or anequivalent concentration of heat-inactivated E. coli and cultured under standard cell cultureconditions or hypoxic conditions (1% O2 , 5% CO2 , 94% N 2) for 24 hr as measured by ELISA. N = 7-8 HIOs per condition.
Figure 6 with 2 supplements
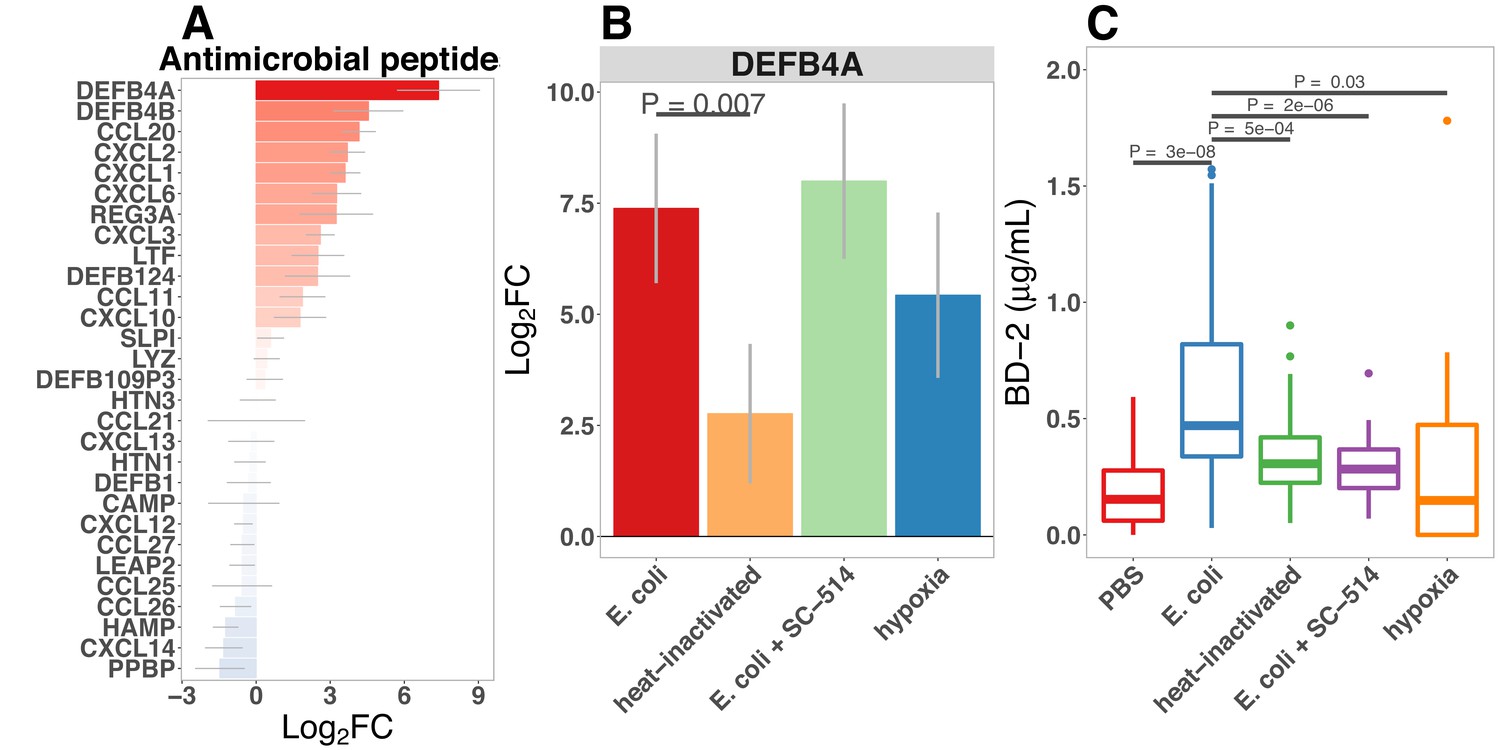
Bacterial colonization promotes secretion of antimicrobial peptides.
(A) Normalized fold change in antimicrobial peptide (AMP) gene expression in E. coli-associated HIOs at 24 hr relative to PBS control treatment. (B) Normalized fold change in expression of DEFB4A, the gene encoding human β-defensin 2 (BD-2) peptide, in each of the conditions indicated relative to PBS control treatment. Results in panels A and B represent N = 4–5 biological replicates per treatment condition, with each replicate consisting of 5–6 pooled and identically treated HIOs. (C) Concentration of BD-2 peptide in culture supernatant at 24 hr as measured by ELISA in HIO cultures treated as indicated. N = 10–14 individually treated HIOs per treatment condition with data combined from three independant replicate experiments. (D) Optical density (600 nm) of E. coli suspension cultures supplemented with PBS or BD-2 at 10-min intervals over an 18 hr period at 37. (E) Carrying capacity (K) of media supplemented with varying concentrations of BD-2 derrived from the growth curves presented in panel D. N = 8 biological replicates per treatment group for panels D and E. p-Values represents the results of a two-tailed Student’s t-test for the comparisons indicated.
Figure 6—figure supplement 1
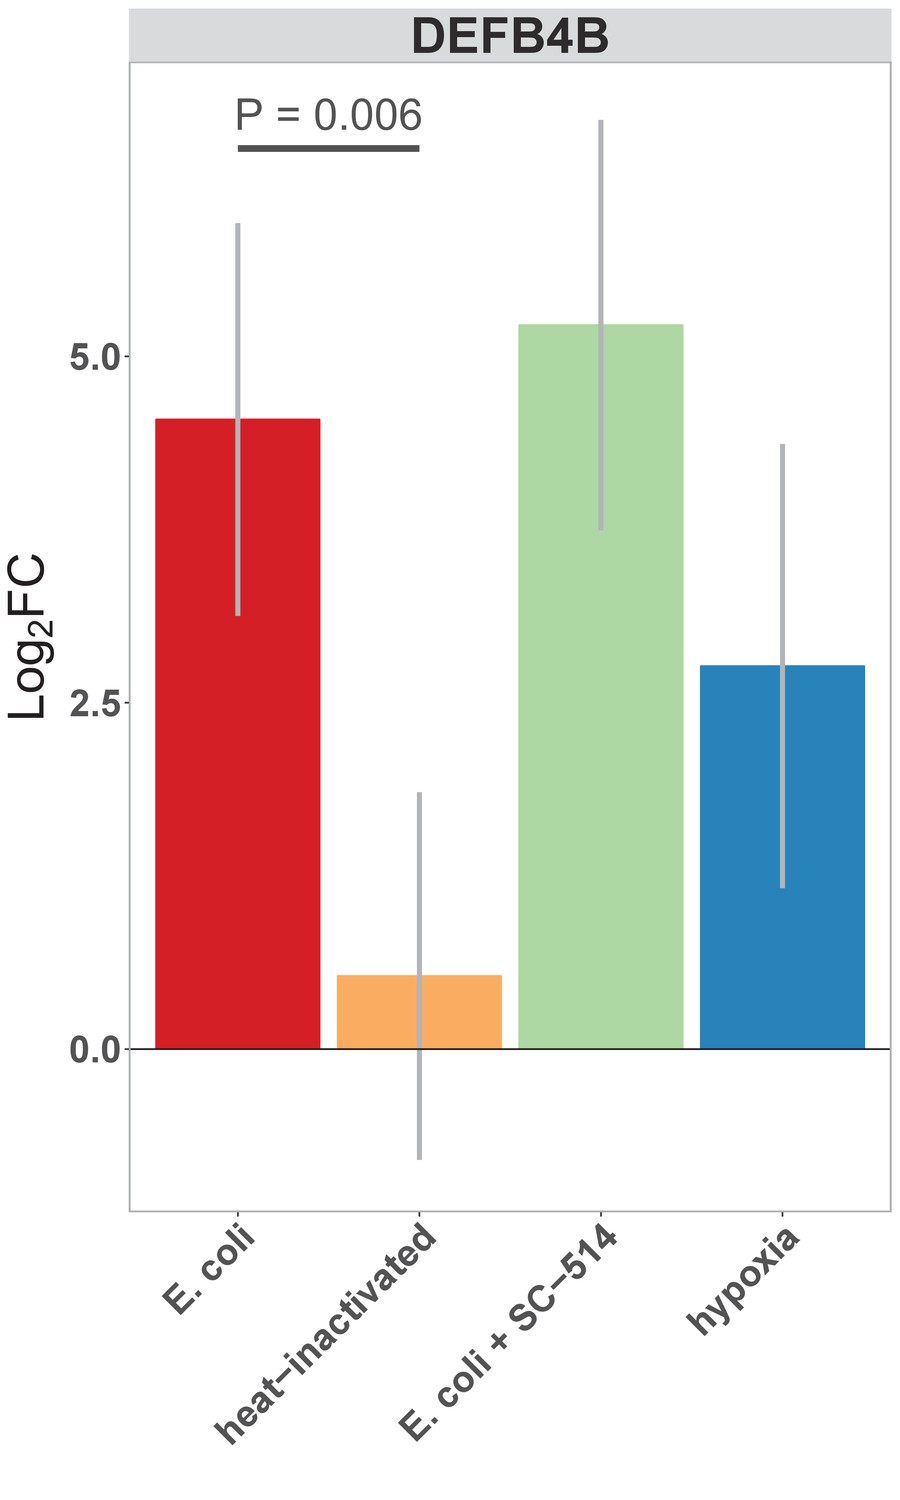
Normalized fold change in expression of DEFB4B, a duplicated gene encoding human β-defensin 2 (BD-2) peptide, in each of the conditions indicated relative to PBS control treatment.
Concentration of BD-2 peptide in culture supernatant at 24 hr as measured by ELISA in HIO cultures treated as indicated. p-Values represents the results of a two-tailed Student’s t-test for the comparison indicated.
Figure 6—figure supplement 2
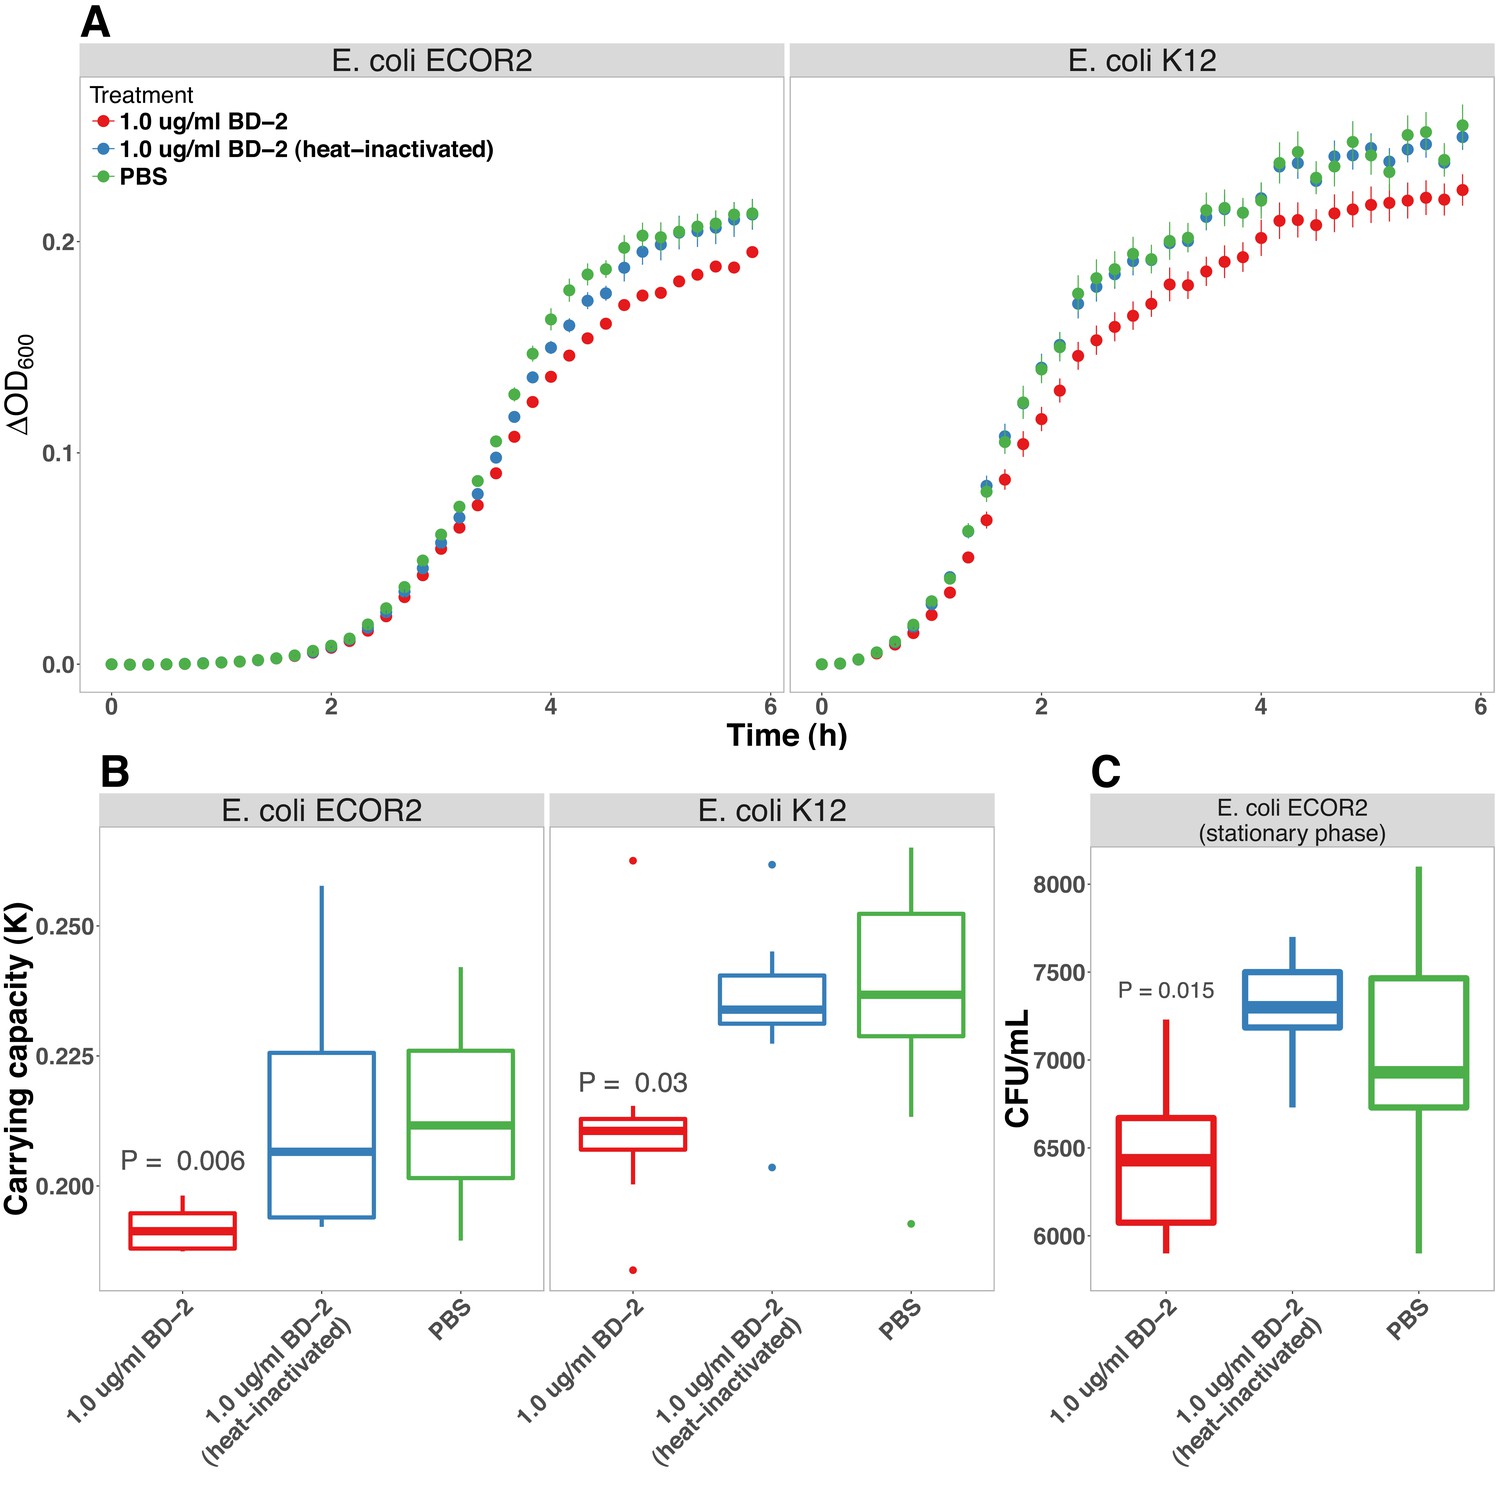
BD-2 inhibits E. coli growth in vitro.
(A) Optical density (600 nm) of E. coli str. ECOR2 and E. coli str. K12suspension cultures supplemented with PBS, BD-2 (1 μg/ml), or heat-inactivated BD-2 at 10-min intervals over a 6-hr period at 37◦C. (B) Carrying capacity (K) of E. coli cultures incubated with PBS, BD-2 (1 μg/ml), or heat-inactivated BD-2 during log-phase growth (panel A). p-Values represents the results of a one-tailed Student’s t-test relative to PBS treatment. For panels A and B, N = 8 per experimental condition for each E. coli strain. (C) CFU/ml of late stationary phase E. coli str. ECOR2 cultures diluted in PBS and supplemented with BD-2 (1 μg/ml) or heat-inactivated BD-2 for 6 h at 37◦C. N = 8 (BD-2 and heat inactivated BD-2) or 16 (PBS).
Figure 7 with 1 supplement
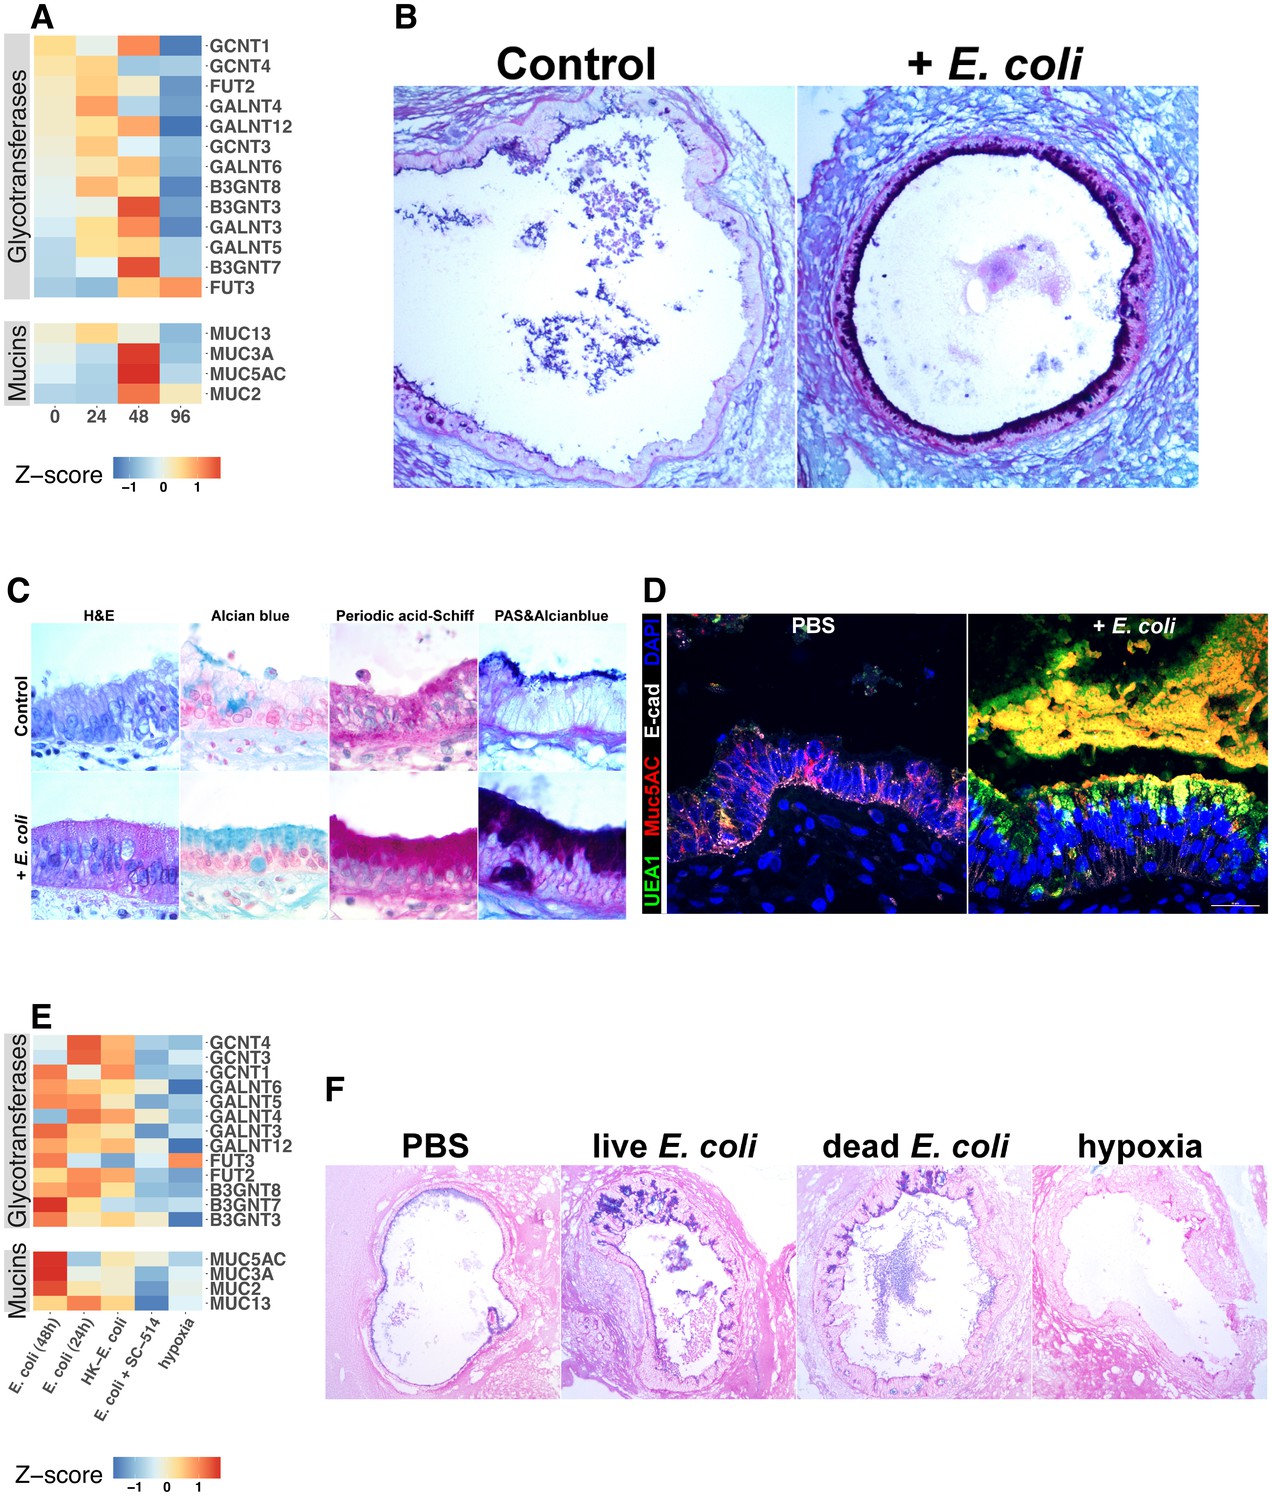
Bacterial colonization promotes expression of epithelial mucins and glycotransferases.
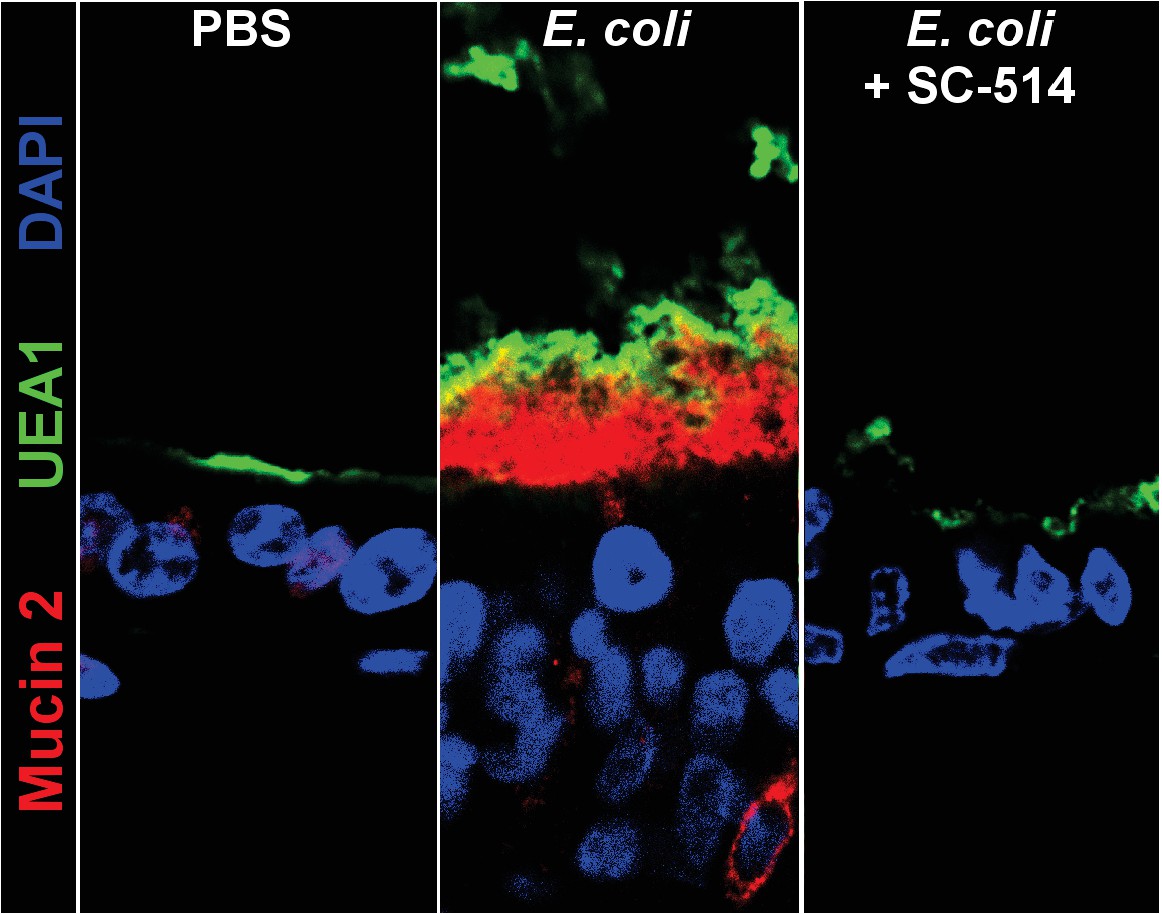
(A) Heatmap of normalized RNA-seq glycotransferase and mucin gene counts of HIOs associated with E.coli at 0–96 hr post-microinjection. N = 4 (0 hr), 5 (24 hr), 3 (48 hr), and 4 (96 hr) biological replicates consisting of 5–6 pooled HIOs per replicate. (B) Periodic acid-Schiff and Alcian Blue (PAS-AB) staining of control HIOs or HIOs microinjected with E. coli and cultured for 48 hr at 10X magnification. (C) HIO epithelium from control HIOs or HIOs microinjected with E. coli and cultured for 48 hr stained with H and E, AB, PAS, or PAS-AB and imaged under 100X light microscopy. (D) Confocal micrograph of HIO epithelium from a control HIO or an HIO microinjected with E. coli and cultured for 48 hr. Nuclei are stained blue with DAPI, and fluorescent antibody-labeled proteins E-cadherein and Mucin 5 AC are pseudocolored in white or red, respectively. UEA1 lectin is used to label the carbohydrate moiety Fucα1-2Gal-R, which is pseudo colored in green. 60X optical magnification. (E) Heatmap of normalized RNA-seq glycotransferase and mucin gene counts of HIOs associated with live or heat-inactivated E. coli, E. coli + NF-κB inhibitor (SC-514) or HIOs cultured under hypoxic conditions for 24 hr. Results represent the mean of N = 4–5 biological replicates per treatment condition, with each replicate consisting of 5–6 pooled and identically treated HIOs. (F) PAS-AB staining of HIOs treated as indicated in the figure labels for 24 hr. 10X magnification. Histological and immunofluorescent images in panels B-D and F are representative of three or more independent experiments, each consisting of 5–10 HIOs per treatment group.
Figure 7—figure supplement 1
Representative confocal micrographs of HIOs treated as indicated.
Fluorescent immunostaining pseudocoloring applied as indicated in the figure legend. 40X optical magnification with 3X digital zoom.
Figure 8 with 1 supplement
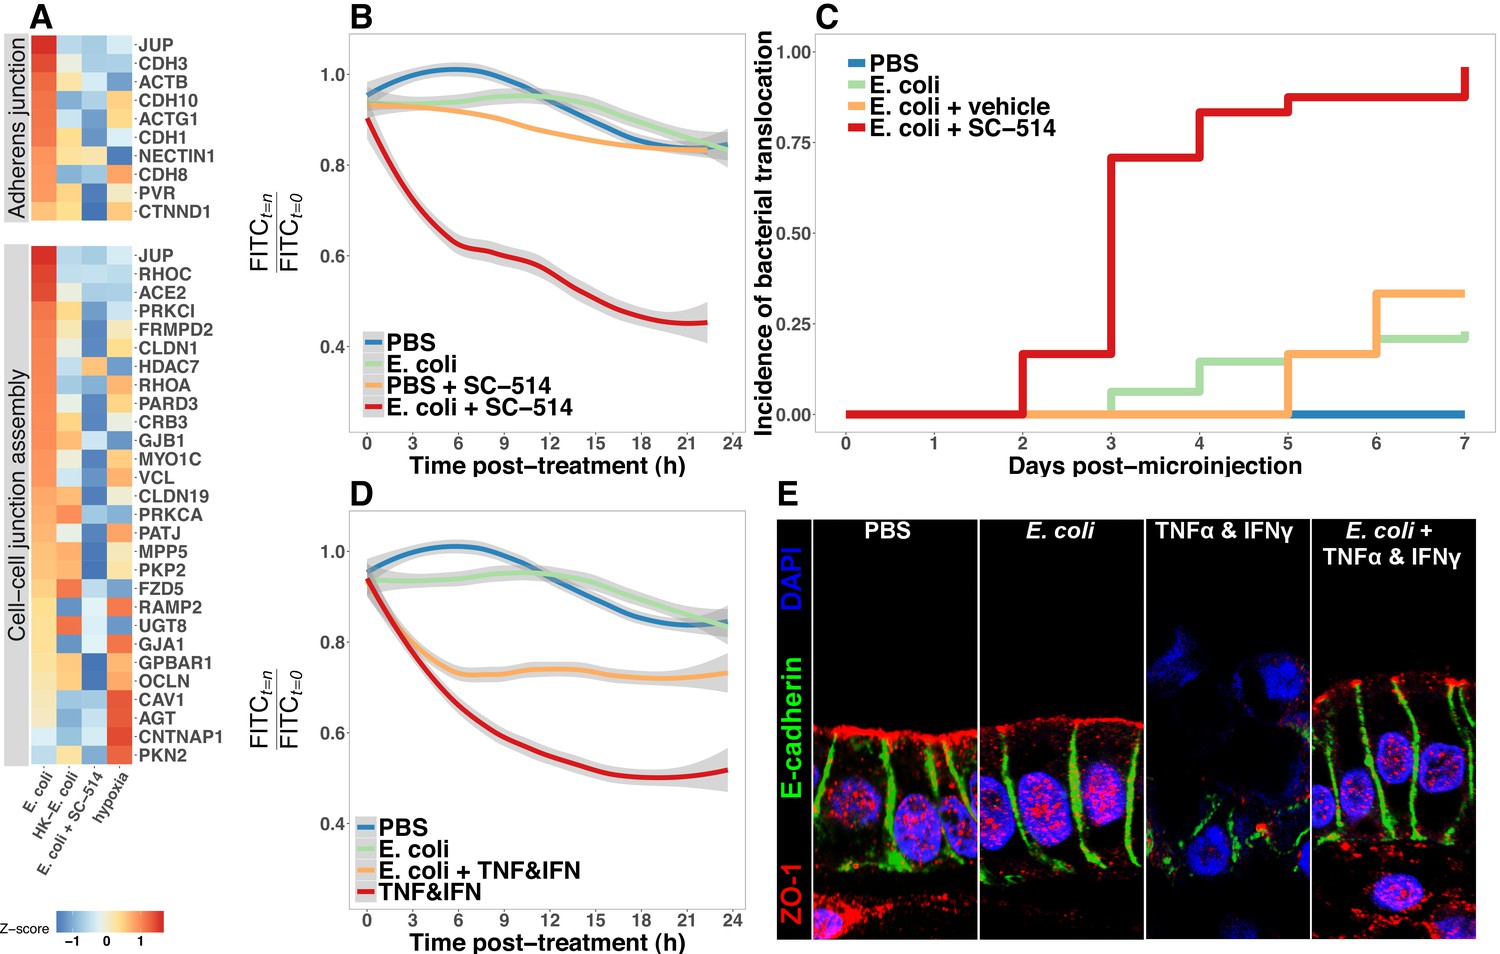
Bacterial colonization promotes resilience of the epithelial barrier via NF-κB.
(A) Heatmap of RNA-seq data indicating the relative expression of genes associated with the Adherens junction or Cell-cell junction assembly based on annotation in the REACTOME database. Results represent the mean of N = 4–5 biological replicates per treatment condition, with each replicate consisting of 5–6 pooled and identically treated HIOs. (B) Relative fluoresscence intensity over time in HIOs microinjected with 4 kDa FITC-dextran and imaged at 10 min intervals. HIOs were pretreated by microinjection with 104 CFU E. coli in PBS or PBS alone and cultured for 24 hr prior to treatment with media containing 10 M SC-514 or PBS alone and the injection of 2 mg/ml FITC-dextran (4 kDa) at the start of imaging. Line represents the best fit to the mean fluorescent intensity values in each condition with the grey region indicating S.E. for the fit line. N = 7–9 HIOs per group. (C) Rate of bacterial translocation over time in HIOs treated as indicated in the figure legend as detected by daily collection of external HIO media and enrichment in bacterial growth broth. N = 24 (E. coli + SC-514), N = 48 (E. coli), and N = 12 (PBS and E. coli + vehicle). (D) Relative fluorescence intensity over time in HIOs microinjected with FITC-dextran and imaged at 10 min intervals. HIOs were pretreated by microinjection with 104 CFU E. coli in PBS or PBS alone and cultured for 24 hr prior to treatment with media containing 500 ng/ml TNF-α and 500 ng/ml IFN-γ or PBS alone and the injection of 2 mg/ml FITC-dextran (4 kDa) at the start of imaging. Line represents the best fit to the mean fluorescent intensity values in each condition with the grey region indicating S.E. for the fit line. N = 8–9 HIOs per group. (E) Representative confocal micrographs of HIOs treated as indicated in D. Fluorescent immunostaining pseudocoloring applied as indicated in the figure legend. 60X optical magnification with 2X digital zoom. SC-514, small molecule inhibitor of NF-κB ; HK, heat-inactivated; TNF, tumor necrosis factor-α; IFN, interferon-γ.
Figure 8—figure supplement 1
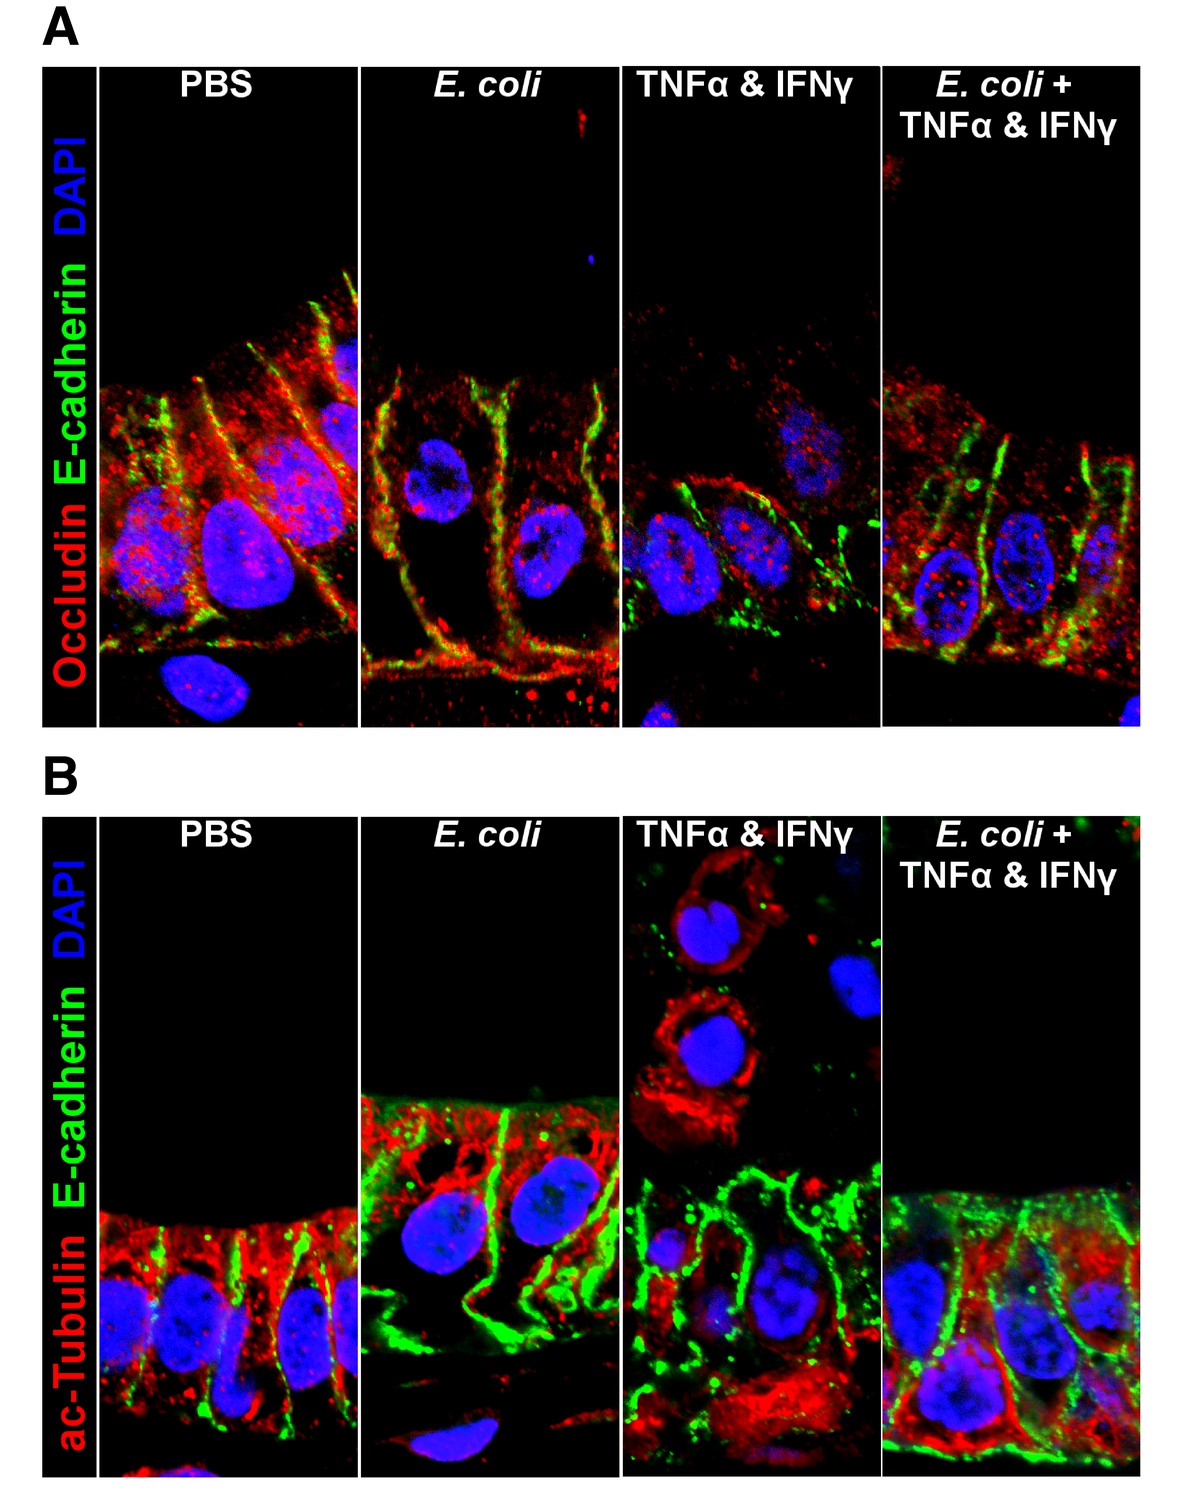
Representative confocal micrographs of HIOs treated as indicated.
Fluorescent immunostaining pseudocoloring applied as indicated in the figure legends. 60X optical magnification with 2X digital zoom.
Videos
Video 1
Animation of individual epifluorescent microscopy images from a human intestinal organoid (HIO) containing live GFP E. coli str.
ECOR2. Images were captured at 10 min intervals over the course of 18 hr an coalated in sequential order. Representative of three independent experiments. See Figure 1A.
Additional files
-
Supplementary file 1
List of differentially expressed genes and the Gene Set (I-IV) assignments used in the analyses presented in Figure 5.
- https://doi.org/10.7554/eLife.29132.022
-
Supplementary file 2
Immunostaining conditions for all immunohistochemistry data presented in this manuscript.
NDS, Normal donkey serum; PBS, phosphate buffered saline.
- https://doi.org/10.7554/eLife.29132.023
-
Transparent reporting form
- https://doi.org/10.7554/eLife.29132.024
Download links
A two-part list of links to download the article, or parts of the article, in various formats.
Downloads (link to download the article as PDF)
Open citations (links to open the citations from this article in various online reference manager services)
Cite this article (links to download the citations from this article in formats compatible with various reference manager tools)
Bacterial colonization stimulates a complex physiological response in the immature human intestinal epithelium
eLife 6:e29132.
https://doi.org/10.7554/eLife.29132


