A minimally sufficient model for rib proximal-distal patterning based on genetic analysis and agent-based simulations
- University of Southern California, United States
- Lakeland Applied Sciences LLC, United States
Figures
Figure 1
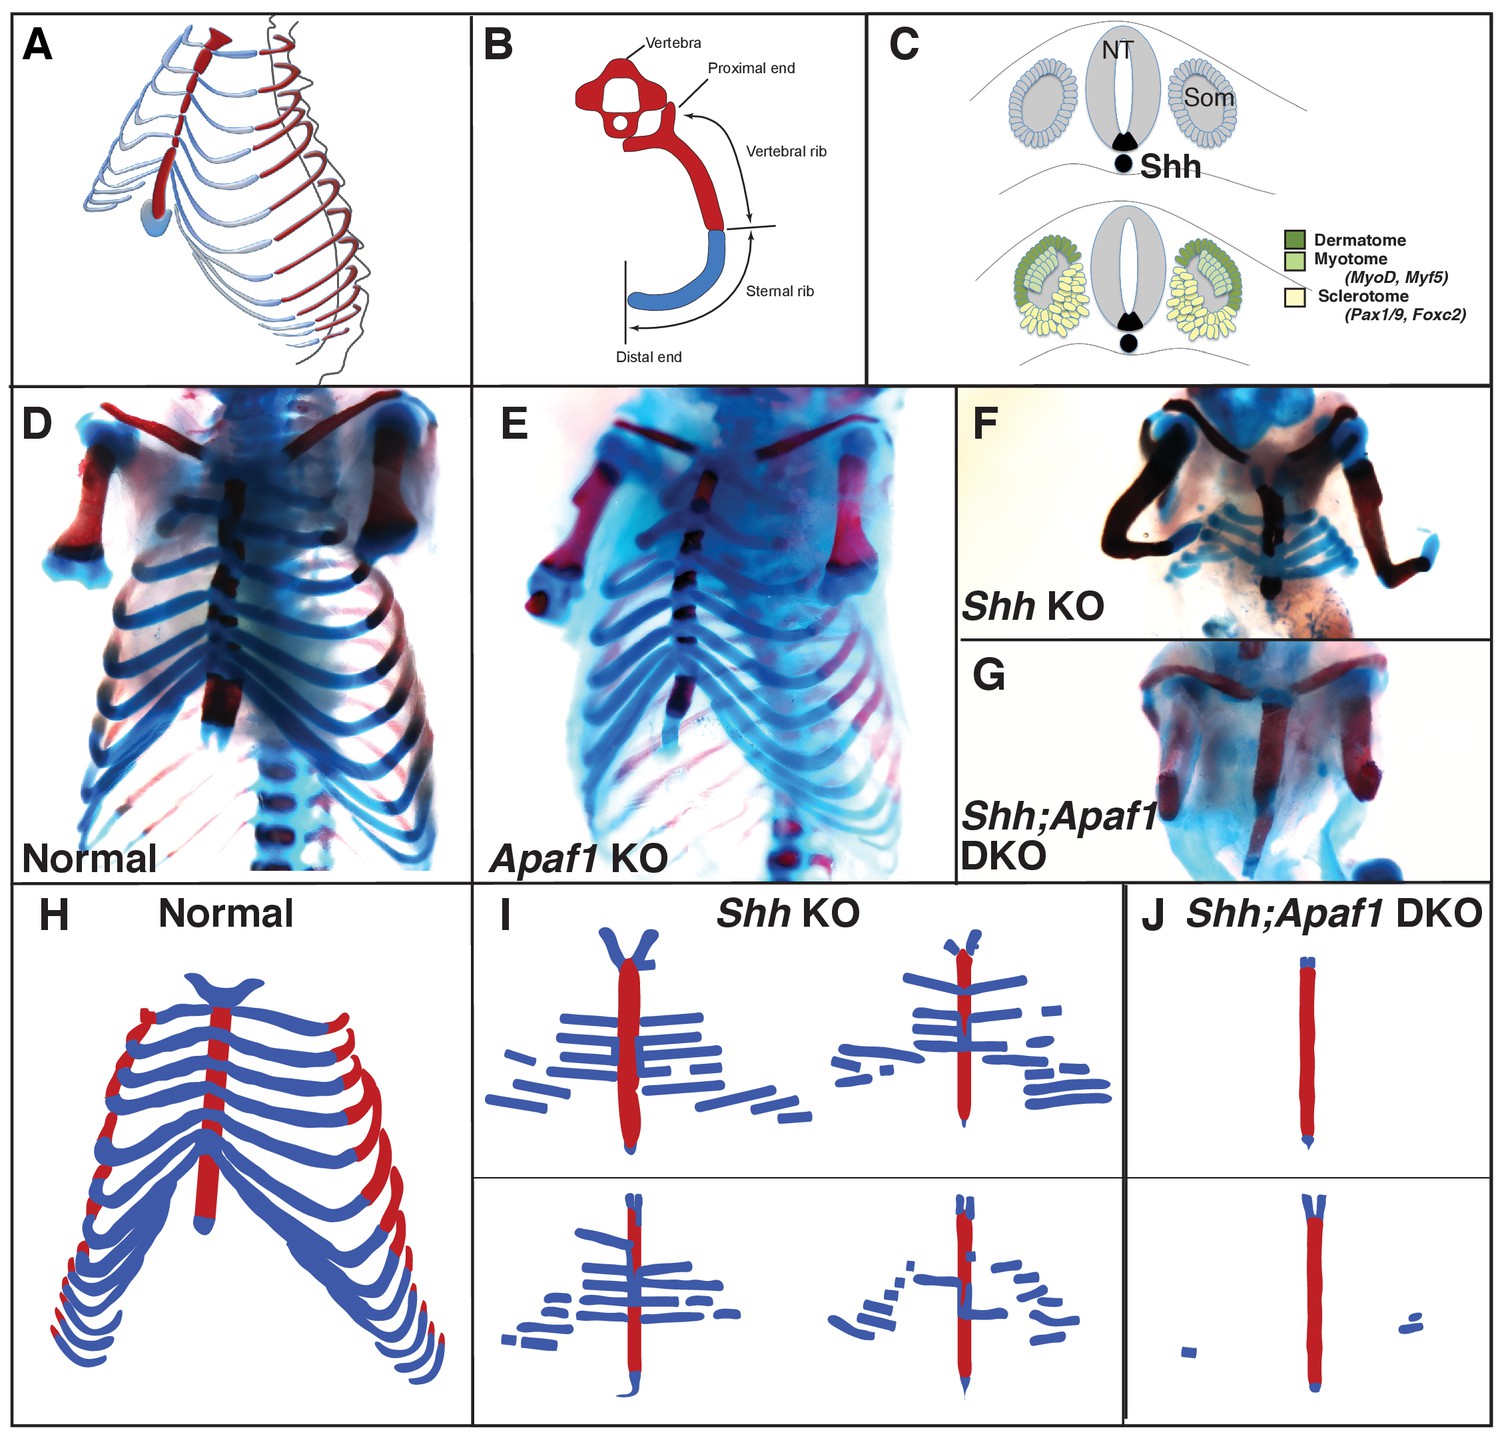
Rib skeletal development is compromised in Shh null animals.
(A) Frontal ¾ view of the thoracic cage depicting the orientation of the proximal and distal ribs. Mice have 13 pairs of ribs. (B) Schematic of a vertebra and rib, transverse view. Red represents bone including the proximal/vertebral rib and blue represents the cartilaginous distal/sternal rib. (C) The somite (Som), neural tube (NT), and notochord diagramed in cross-section. The dermatome and myotome (dark and light green) gives rise to the dermis and muscles while the sclerotome (yellow) gives rise to the vertebrae and ribs. Markers for these compartments are indicated. The location of Shh-expressing cells is indicated in black. (D–G) Alcian blue and alizarin red skeletal staining of the rib cage: (D) Normal mouse skeletal development at E18.5 (lower arms removed). (E) Without Apaf1, the axial skeleton develops normally (n = 12/12, lower arms removed). (F) Without Shh, embryos develop without vertebrae and the proximal portion of the ribs. Distal ribs form but are not patterned correctly (n = 17/17). (G) Double knock out (DKO) of both Shh and Apaf1 results in a more severe phenotype. DKO neonates develop without vertebrae, proximal and distal ribs (n = 7/7). The sternum is still present and ossifies on schedule. (H–J) Schematics representing skeletal preparations of normal (H) and null neonates. (I) The loss of the proximal ribs is consistent amongst all Shh KO neonates, however, the disrupted pattern of the distal ribs vary. (J) Occasionally Shh;Apaf1 DKO neonates have cartilage nodules laterally (presumably at the chondro-costal joint, n = 1/7).
Figure 2
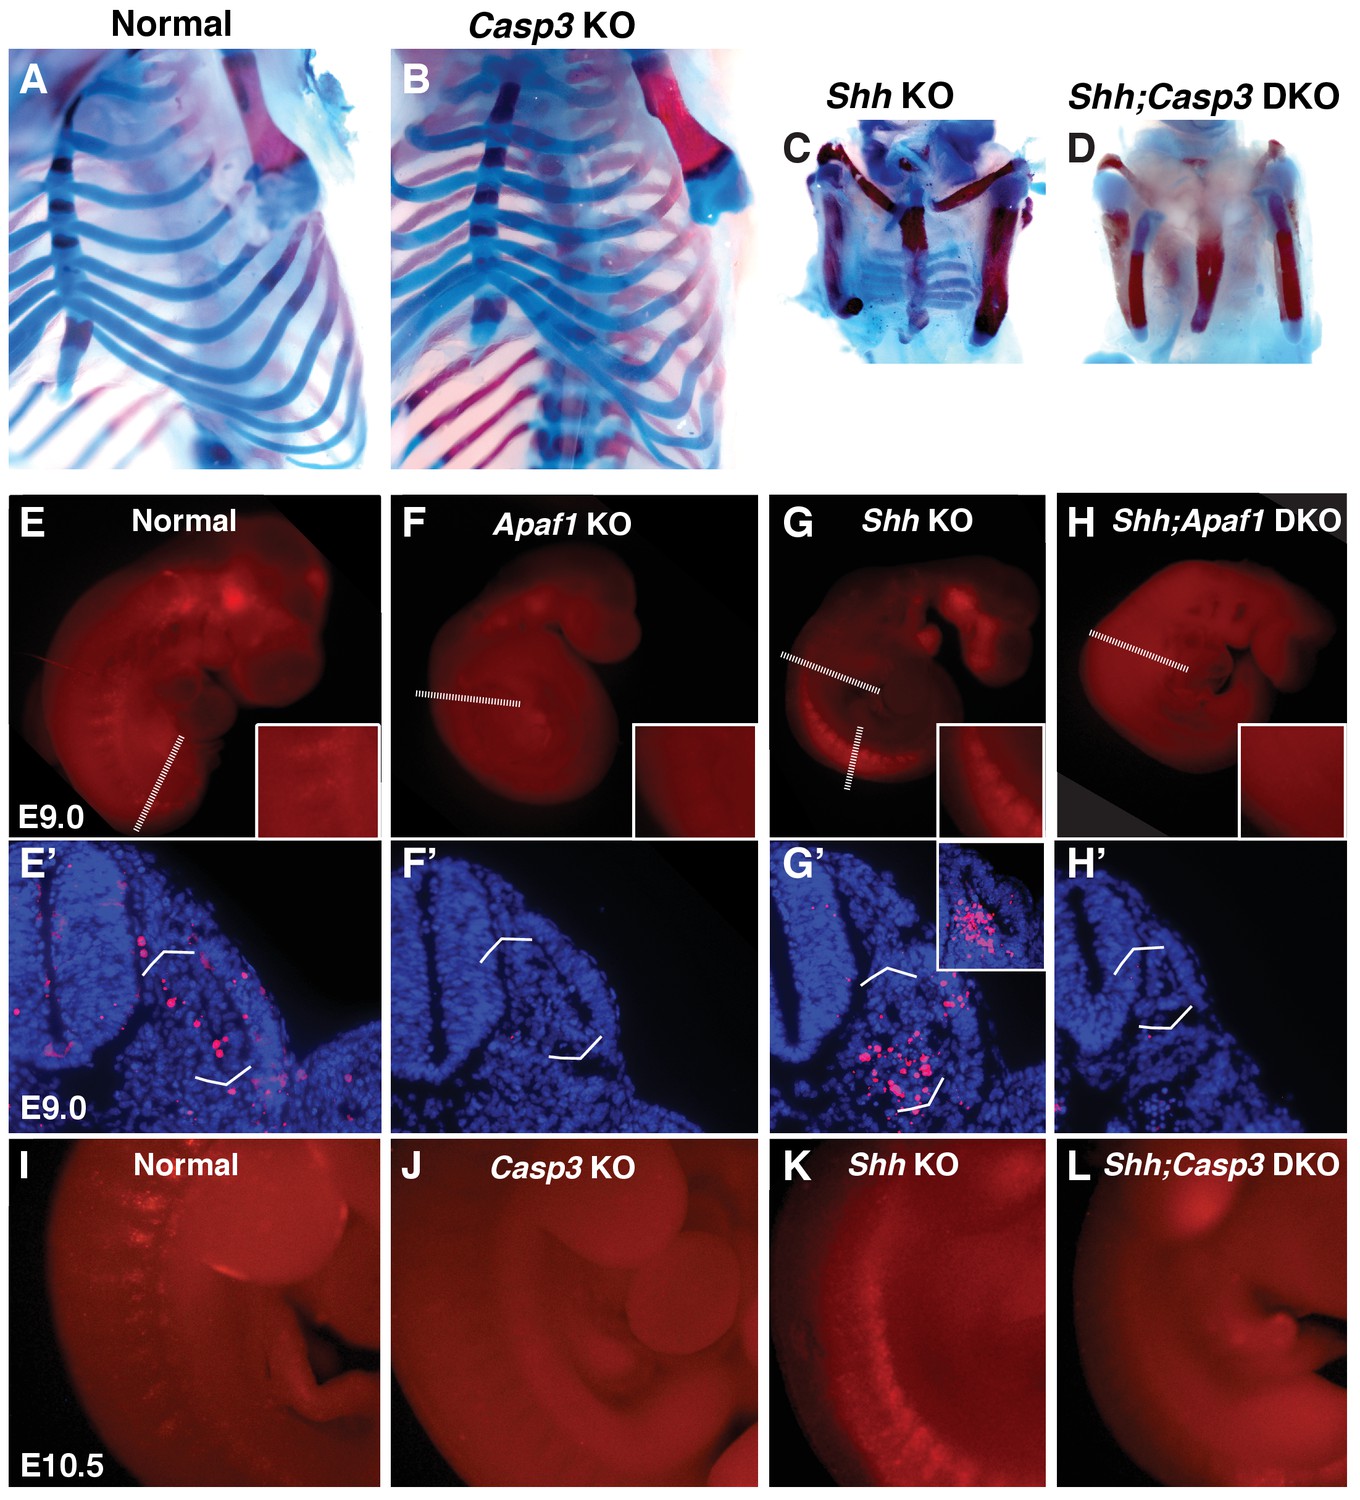
Programmed cell death is decreased in the absence of Casp3 and Apaf1.
(A–D) Alcian blue and alizarin red staining, E18.5 neonates. (A, B) Normal and Casp3 KO embryos are indistinguishable. (C) Shh KO embryos develop without vertebrae and proximal ribs and as before, distal ribs are present but mispatterned. (D) Shh;Casp3 DKO embryos exhibit a similar phenotype to Shh;Apaf1 DKO embryos— a complete loss of all vertebrae, proximal, and distal ribs. (E–L) Embryos stained with LysoTracker (red) are shown in whole-mount and in section (blue, DAPI). Dashed lines indicate the location of the sections in the panels below. (E, E’) Normal embryos have LysoTracker staining in the roof plate, limbs, and in the developing somites. (F, F’) Throughout Apaf1 KO embryos, including the somites, LysoTracker staining is dramatically reduced. (G, G’) Shh null embryos have increased LysoTracker staining in the somites. At the thoracic level, staining is found in sclerotomal cells emerging from the ventral medial somite. At a more caudal level (inset), abundant staining is present in the sclerotome epithelium. (H, H’). Shh;Apaf1 DKO embryos have little to no LysoTracker staining throughout. (I–L) Embryos from the Shh-Caspase3 cross had similar LysoTracker staining patterns. (I) Normal embryos. (J) Casp3 KO embryos displayed a dramatic reduction in LysoTracker staining. K. Shh KO embryos have abundant staining in the somites. (L) Reduced LysoTracker staining. (similar to Shh;Apaf1 DKO) was also observed in Shh;Casp3 DKO null embryos. Phenotypes were consistently observed in at least 3/3 animals of each genotype.
Figure 3 with 2 supplements
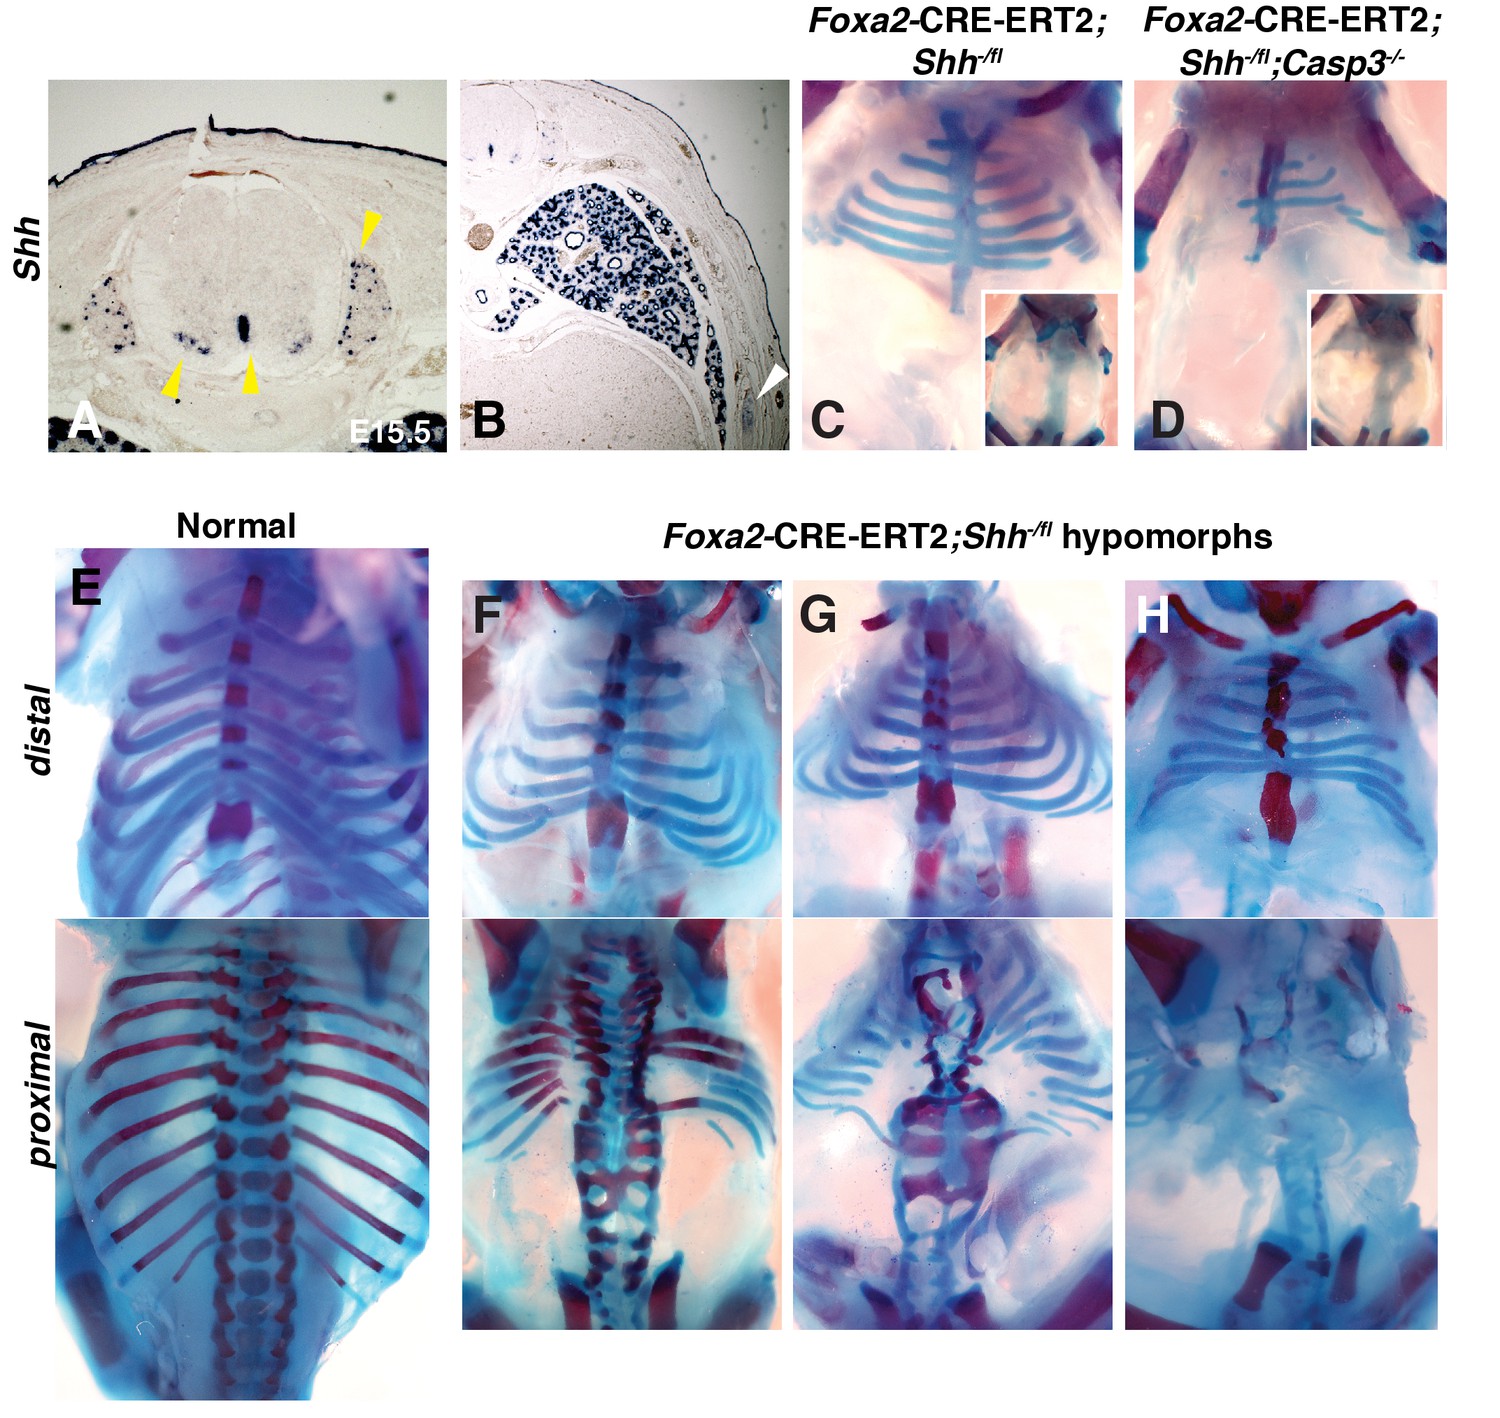
Conditional removal of Shh shows an early role for Hh signaling in rib development.
(A, B) Shh is expressed not only in the floor plate but also in the dorsal root ganglia, ventral neural tube, developing lungs (yellow arrowheads), as well as the developing ribs themselves (white arrowhead). (C–H) Alcian blue and alizarin red staining of neonates in which an inducible Foxa2-CRE-ERT2 was used to ablate Shh only in the notochord and floor plate. (C) An E18.5 Foxa2-CRE-ERT2;Shh-/fl neonate after a Tamoxifen injection at E7.0 exhibits a similar phenotype to Shh null animals. Neonates develop without vertebrae and proximal ribs (inset – dorsal view). Distal ribs develop with mild segmental defects. (D) The additional loss of a Casp3 in the Shh hypomorph worsened the phenotype. Note a reduction of the distal segments compared to the Shh hypomorph alone (inset – dorsal view shows lack of vertebrae and proximal ribs). (E) Normal embryo, ventral (top) and dorsal view (bottom). (F–H) Range of hypomorph phenotypes. Those with the least severe phenotype (F) have some disruption of the vertebrae and the most proximal ends of the proximal ribs, while the most severe phenotype is similar to Shh KO embryos with complete loss of vertebrae and proximal ribs (H). Phenotypes were observed in at least 3/3 animals of each genotype. Ptch1 expression after Tamoxifen injection at E7.0 and E8.0 was assessed at E8.0 and E.9.0, respectively, see Figure 3—figure supplement 1. Skeletal defects could be due to alterations in somite patterning. Experiments addressing this possibility can be found in Figure 3—figure supplement 2.
Figure 3—figure supplement 1

Expression of Ptch1 in Foxa2-CRE-ERT2;Shh-/fl embryos.
(A, B) 24 hr after Tamoxifen injection at E8.0, Ptch1 expression is still evident in embryos carrying the conditional allele (B). This injection regimen failed to produce a Shh loss of function phenotype. (C, D, D’) 24 hr after Tamoxifen injection at E9.0, embryos carrying the conditional alleles displayed discontinuities in Ptch1 expression (D, D’). This injection regimen resulted in the skeletal abnormalities depicted in Figure 3.
Figure 3—figure supplement 2
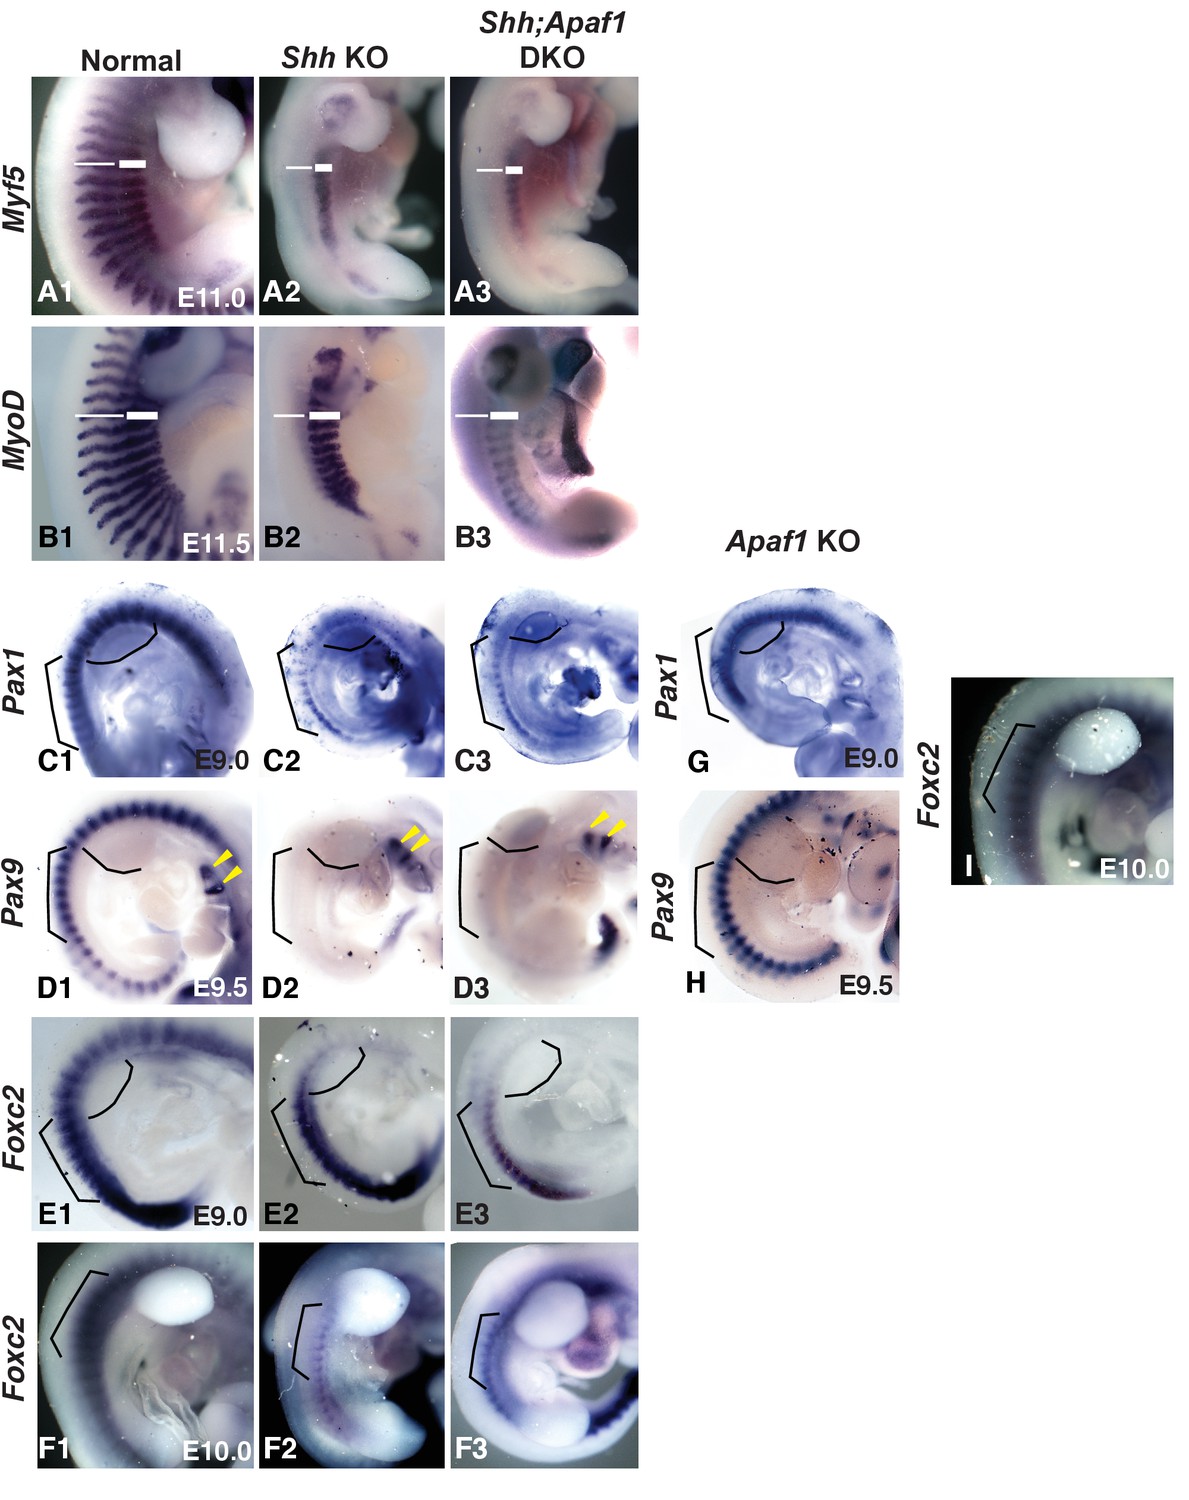
Somite patterning in Apaf1;Shh KO embryos is similar to Shh KO embryos.
(A1–B3) E11.0 and E11.5 embryos showing Myf5 (A1–A3) and MyoD (B1–B3) expression in the developing epaxial and hypaxial muscles. (A1 and B1) Normal embryos. Loss of Shh leads to a lack of Myf5 (A2) and MyoD (B2) in the epaxial region (thin line) but not the hypaxial region (thick line). Shh;Apaf1 DKO embryos also display a loss of Myf5 (A3) and MyoD (B3) in epaxial but not hypaxial progenitors. (C1–C3) Analysis of Pax1 expression at E9.0. (C1) Pax1 expression in normal embryos. (C2) Pax1 expression in the sclerotome of Shh KO embryos. (C3) Shh;Apaf1 DKO embryos also express Pax1 in a similar pattern. (D1–D3) Analysis of Pax9 expression at E9.5. (D1) Pax9 is expressed in the sclerotome of normal embryos. (D2). Shh KO embryos do not have Pax9 expression in the sclerotome. Note Pax9 expression in the brachial arches (arrowheads). (D3) Shh;Apaf1 DKO embryos exhibit a similar pattern. (E1–F3) Analysis of Foxc2 expression at E9.0 and E10.0. Foxc2 is expressed throughout the developing somite at E9.0 (E1) and is restricted to the sclerotome by E10.5 (F1) in normal embryos. Foxc2 expression is detected in similar patterns in both the Shh KO (E2, F2) and the Shh;Apaf1 DKO (E3, F3) embryos at both E9.0 and after de-epithelialization of the thoracic somites (E10.0). Brackets outline comparable somite regions, curved line indicates forelimb bud location. (G) Pax1 expression at E9.0 in Apaf1 KO embryos is similar to controls. Compare to C1. (H) Pax9 expression at E9.5 in Apaf1 KO embryos is similar to controls. Compare to D1. Tail truncated due to collection for genotyping. (I) Foxc2 expression at E10.0 in Apaf1 KO embryos is similar to controls. Compare to F1. Brackets outline comparable somite regions, curved line indicates forelimb bud location. Phenotypes were consistently observed in at least 3/3 animals of each genotype. When null for skeletal muscle genes, embryos can also display skeletal abnormalities, including rib fusions, truncations and sternal defects (Pax3: [Henderson et al., 1999; Vivian et al., 2000]). In Shh KO embryos epaxial progenitors are reportedly absent, while the hypaxial progenitors are reduced (Borycki et al., 1999; Gustafsson et al., 2002) and our results looking at Myf5 and MyoD expression confirmed this observation (A2, B2). Perhaps, absence of the epaxial compartment explains the failure of the proximal rib to form in both situations while additional defects in the hypaxial compartment are responsible for lost distal segments in the Shh;Apaf1 DKO embryos. However, we found that Shh;Apaf1 DKO embryos displayed the same pattern as Shh KO embryos (A3, B3) suggesting that a failure to specify the hypaxial muscle compartment is not the cause of the Shh;Apaf1 DKO phenotype. Pax9 and Pax1 are expressed in similar patterns in the sclerotome and are required for rib and vertebrae development (Furumoto et al., 1999; Peters et al., 1999; Rodrigo et al., 2003). Previous studies have shown that Pax1 is initially expressed in the Shh KO embryo but then lost (Chiang et al., 1996; Borycki et al., 1998; Zhang et al., 2001). As previously reported, we found Pax1 expressed in a smaller domain in Shh KO embryos compared to normal or Apaf1 KO embryos at E9.0 (C2). However, in Shh;Apaf1 DKO embryos, Pax1 expression was similar suggesting that some sclerotome specification still occurs (C3). As development continues, Pax1 expression is eventually lost in Shh KO embryos as well as in the Shh;Apaf1 DKO embryos. Neither Shh KO nor Shh;Apaf1 DKO embryos exhibited Pax9 expression in somites at E9.5 (B2–B3). We then determined if the expression of Foxc2, a winged helix/forkhead transcription factor required for axial skeletal development (Kume et al., 2001; Wilm et al., 2004) is altered. Foxc2, which is expressed in the early unsegmented paraxial mesoderm and later becomes restricted to the sclerotome, may be a more comprehensive sclerotome marker than Pax1/9 (C1, D1) (Furumoto et al., 1999). Like Pax1, Foxc2 was expressed in a reduced domain in both Shh KO and the Shh;Apaf1 DKO embryos compared to normal embryos prior to E9.0, (E2, E3). However, in contrast to Pax1, the smaller domain of Foxc2 expression continued to be present after E10.0 in both Shh KO embryos and somite-matched Shh;Apaf1 DKO embryos (F2, F3). In summary, the loss of Shh correlates with smaller Pax1 and Foxc2 expression domains. In addition, the Pax1 domain disappears while the smaller FoxC2 expression domain persists, suggesting that at least a portion of the sclerotome is maintained in both contexts. Compared to control embryos, Apaf1 KO embryos did not display disruptions in sclerotome patterning as assessed by RNA in situ marker expression analysis (G, H, I).
Figure 4
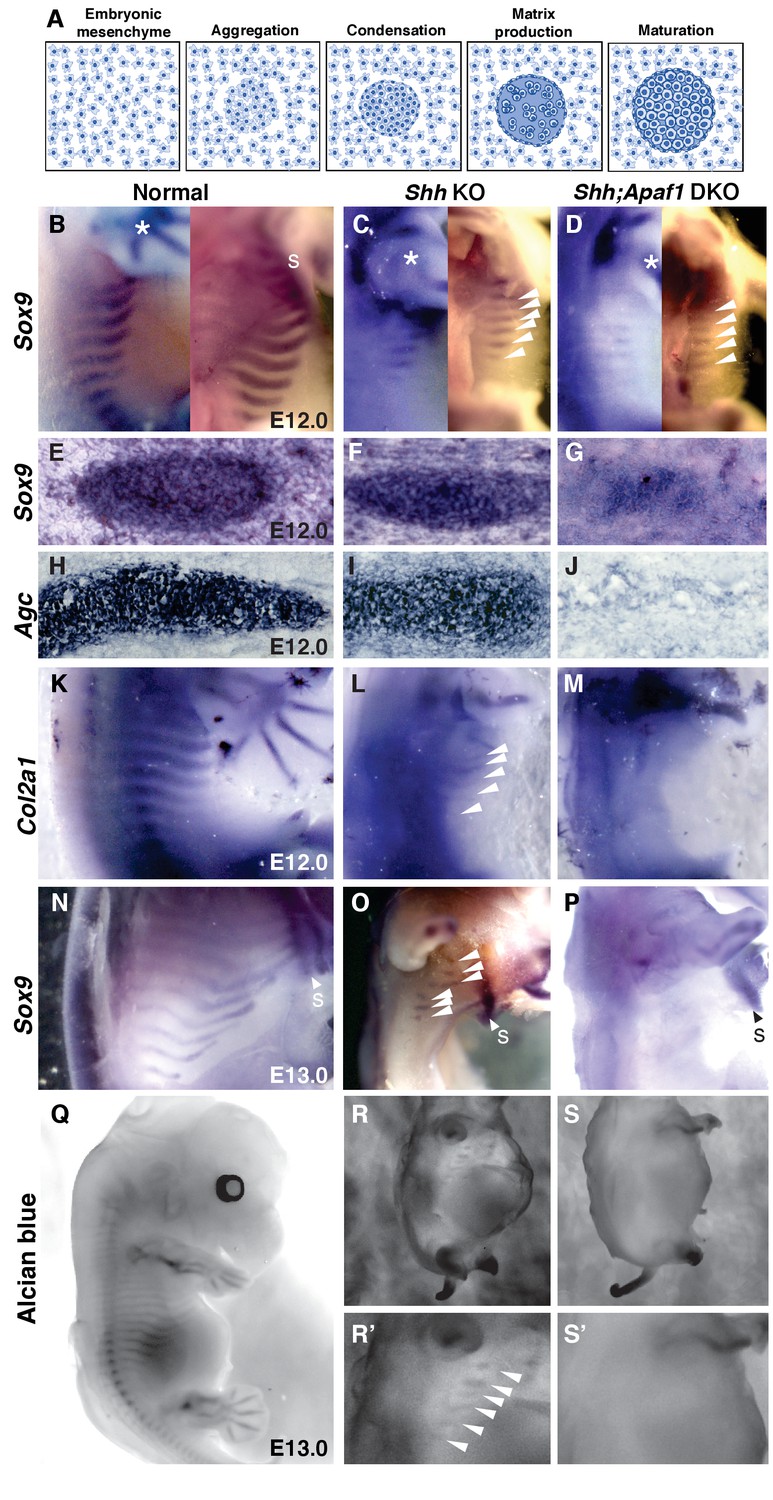
Cartilage differentiation fails in double null embryos.
(A) Schematic showing the steps of cartilage differentiation. (B–D) Sox9 expression at E12.0. First panel shows an external lateral view, second panel an internal lateral view, asterisk indicates Sox9 expression in the limbs. (B) Normal embryos express Sox9 in the ribs extending from the dorsal midline toward the sternum (S). (C) Shh KO embryos have reduced Sox9 expression domain (thinner and shorter) and located distally. (D) Shh;Apaf1 DKO embryos have a further reduced Sox9 expression in the distal domain. (E–J) Cross-sections show Sox9- and Agc-expressing condensed cartilage forming in normal and Shh KO embryos while Shh;Apaf1 DKO embryos have only a loose aggregate of Sox9-expressing cells and very few loosely distributed cells, if any, expressing Agc. (K–M) Normal embryos express Col2a1 in a band of cells from the vertebrae toward the sternum (K). (L) Shh KO embryos express Col2a1 only distally under the forearms (arrowheads). (M) No Col2a1 expression is observed in Shh;Apaf1 DKO embryos in the thoracic area. (N–P) Continued Sox9 expression is observed in controls (N) at E13.0. (O) In Shh KO embryos, Sox9 expression is present but only distally (arrowheads). (P) Sox9 expression is undetectable in the entire thoracic area of Shh;Apaf1 DKO embryos. (Q–S) Alcian blue cartilage staining of E13.0 embryos is shown in black and white for greater contrast. (Q) Cartilage anlagen in normal embryos extend from the vertebrae toward the sternum. (R, R’) Shh KO embryos have distally located rib cartilages (arrowheads). (S, S’) No alcian blue positive rib cartilages are observed in Shh;Apaf1 DKO embryos. Expression patterns were consistently observed in at least 3/3 animals of each genotype.
Figure 5
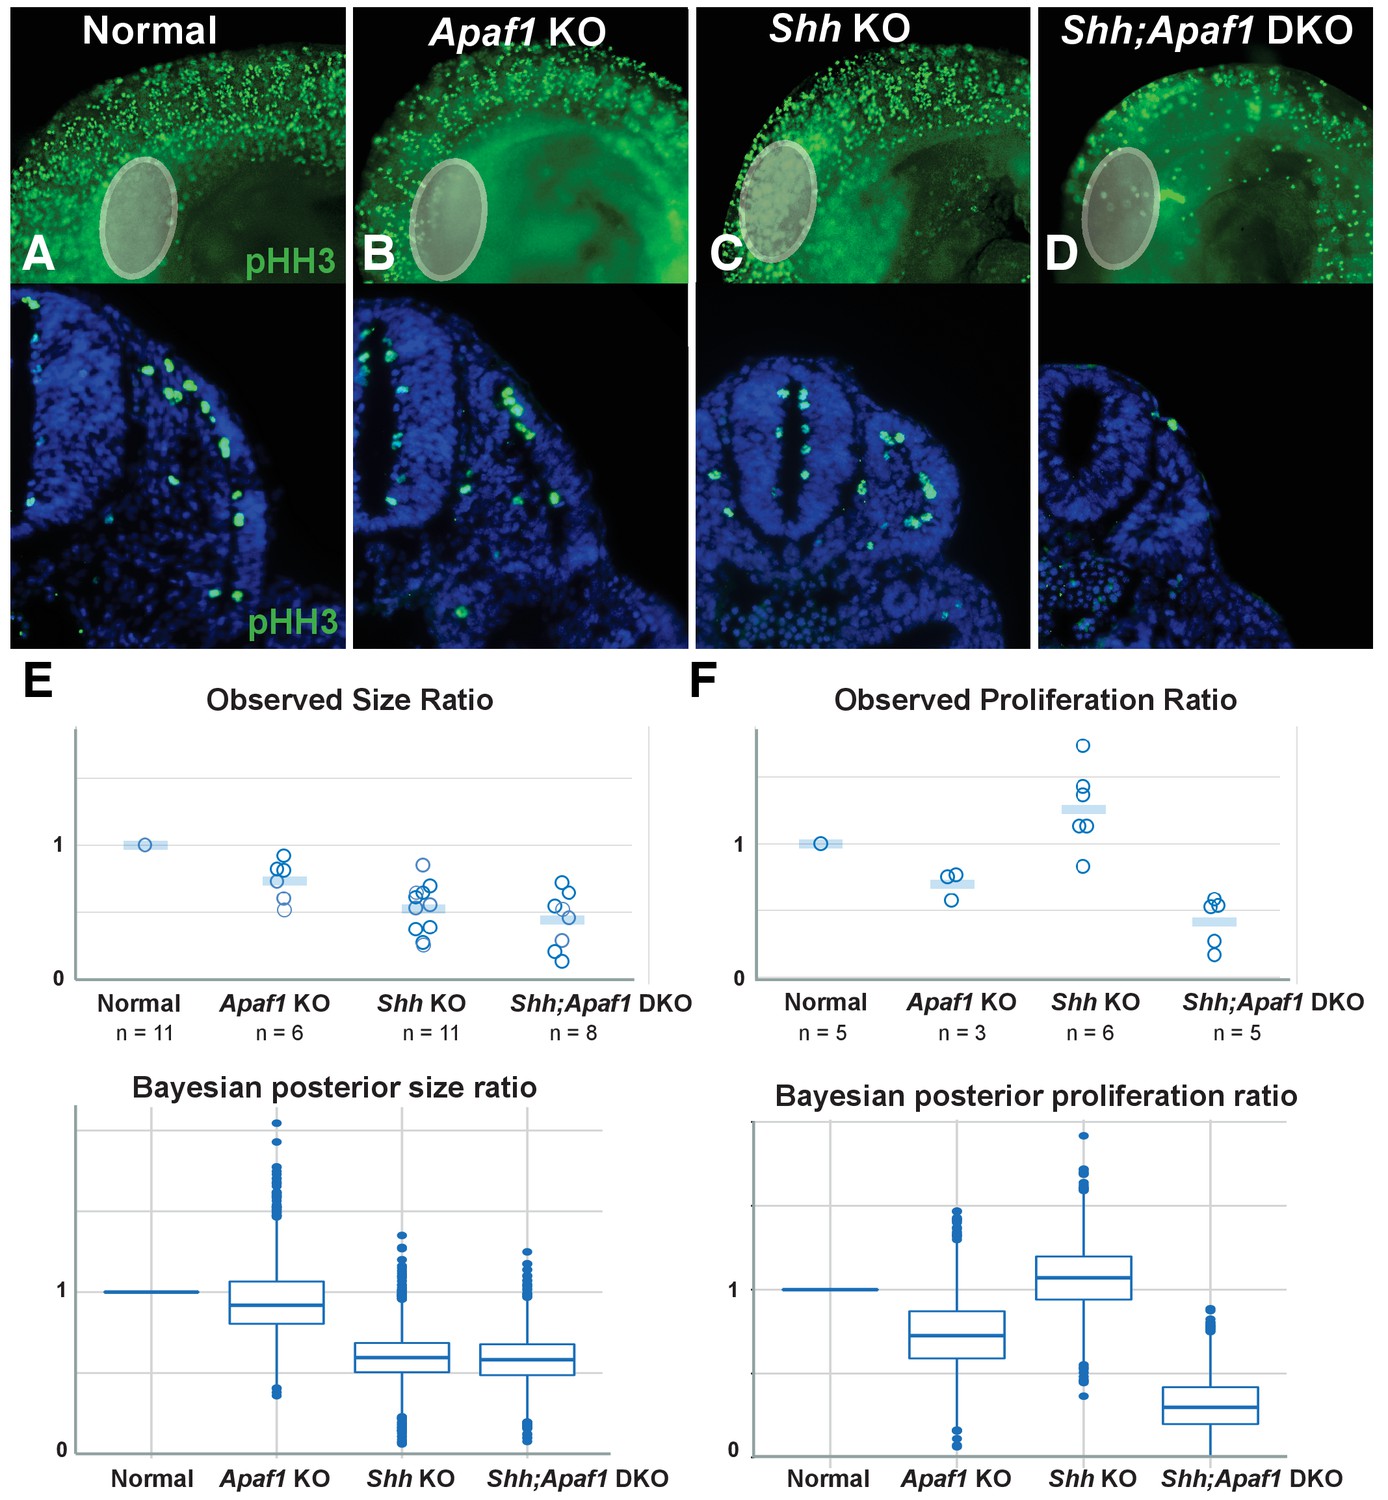
Alterations in somite size and proliferation are evident in the different genotypes.
(A–D) Representative longitudinal views (top, limb bud indicated by grey oval) and transverse sections (bottom) from somite-matched E9.0 mouse embryos at equivalent locations (based on anatomical landmarks). Phosphorylated histone H3 (pHH3) immunofluorescence reveals cells in mitosis (green: pHH3; blue: DAPI). (E). (Top) Ratio of average somite size to average litter-matched controls size is plotted directly. (Bottom) The probability distribution of Bayesian estimates for size ratios is shown in box plot format. Bayesian estimates indicate that Shh KO and Shh;Apaf1 DKO embryos have smaller somites than either controls or Apaf1 KO embryos. Median estimates are Apaf1 KO = 0.92, Shh KO = 0.59 and Shh;Apaf1 DKO = 0.57, probability that the ratios are less than 1 are 0.67, 0.99, and 0.99, respectively. (F) (Top) Ratio of average somite proliferation rate to average litter-matched controls size is plotted directly. Normal and Shh KO embryos have a similar ratio of pHH3 positive to total cells in the somite (shown relative to controls). While Apaf1 KO and Shh;Apaf1 DKO embryos both exhibit a decrease in the ratio of pHH3 positive to total cells. (Bottom) The probability distribution of Bayesian estimates for size ratios is shown in box plot format. Bayesian estimates indicate that Apaf1 KO and Shh;Apaf1 DKO embryos have a reduce proliferation rate than either controls or Shh KO embryos. Median estimates are Apaf1 KO = 0.71, Shh KO = 1.1 and Shh;Apaf1 DKO = 0.32, probability that the ratios are less than 1 are 0.91, 0.33, and 1.0, respectively. Boxes represent 50% probability with a line at the median, plot uses standard settings for ggplot2. See also Supplementary file 1, Source code 1, and Source code 2 for a description of the analysis of variance and the accompanying code, and Figure 5—source data 1 for the raw data.
-
Figure 5—source data 1
Measurements collected to create graphs in Figure 5E and F.
- https://doi.org/10.7554/eLife.29144.010
Figure 6 with 3 supplements

An agent-based model simulates rib proximal-distal patterning and outgrowth.
(A) A representative time series for the normal condition. The model simulates rib development up to E12.0 just prior to differentiation of the condensations. The red and blue agents represent cells biased to become part of a proximal or distal element, respectively. Yellow indicates that a fate decision has not yet been made. Gray stripes indicate the extent and intensity of the Hh gradient. (B) Outcome of adjusting Hh intensity without adjusting the gradient pitch using baseline parameter settings for the normal genotype. (C) Representative starting points and outcomes that mimic the phenotypes. Normal was simulated with a moderate Hh gradient intensity, mild cell death, and a moderate proliferation rate. The loss of Apaf1 was simulated by decreasing cell death to zero, decreasing the proliferation rate, and moderately decreasing the number of initial progenitors; loss of Shh was simulated by decreasing the Hh intensity, decreased progenitor pool size, slightly increased proliferation rate, and increased cell death. The absence of both Shh and Apaf1 was simulated with no cell death, an even smaller initial pool was used and an overall decrease in cell proliferation. More undecided (yellow) agents can be found in this case because proliferation is very low and the model assumes decisions are made at cell division. Over time, these cells eventually become blue due to low Hh levels. A detailed explanation of the model can be found in Supplementary file 2. The parameter values used to generate the outcomes are listed in Table 1, and the outcome of additional simulation runs while varying specific parameters can be found in Figure 6—figure supplements 1, 2 and 3. Example video simulations can be found in Video 1 and the code to run the simulations can be found in Source code 3.
Figure 6—figure supplement 1

Outcome from multiple simulations for each genotype.
(A) Outcome of 10 simulation runs using the parameters indicated in Table 1. (B) Variability in outcome for the genotype simulations shown in A.
Figure 6—figure supplement 2
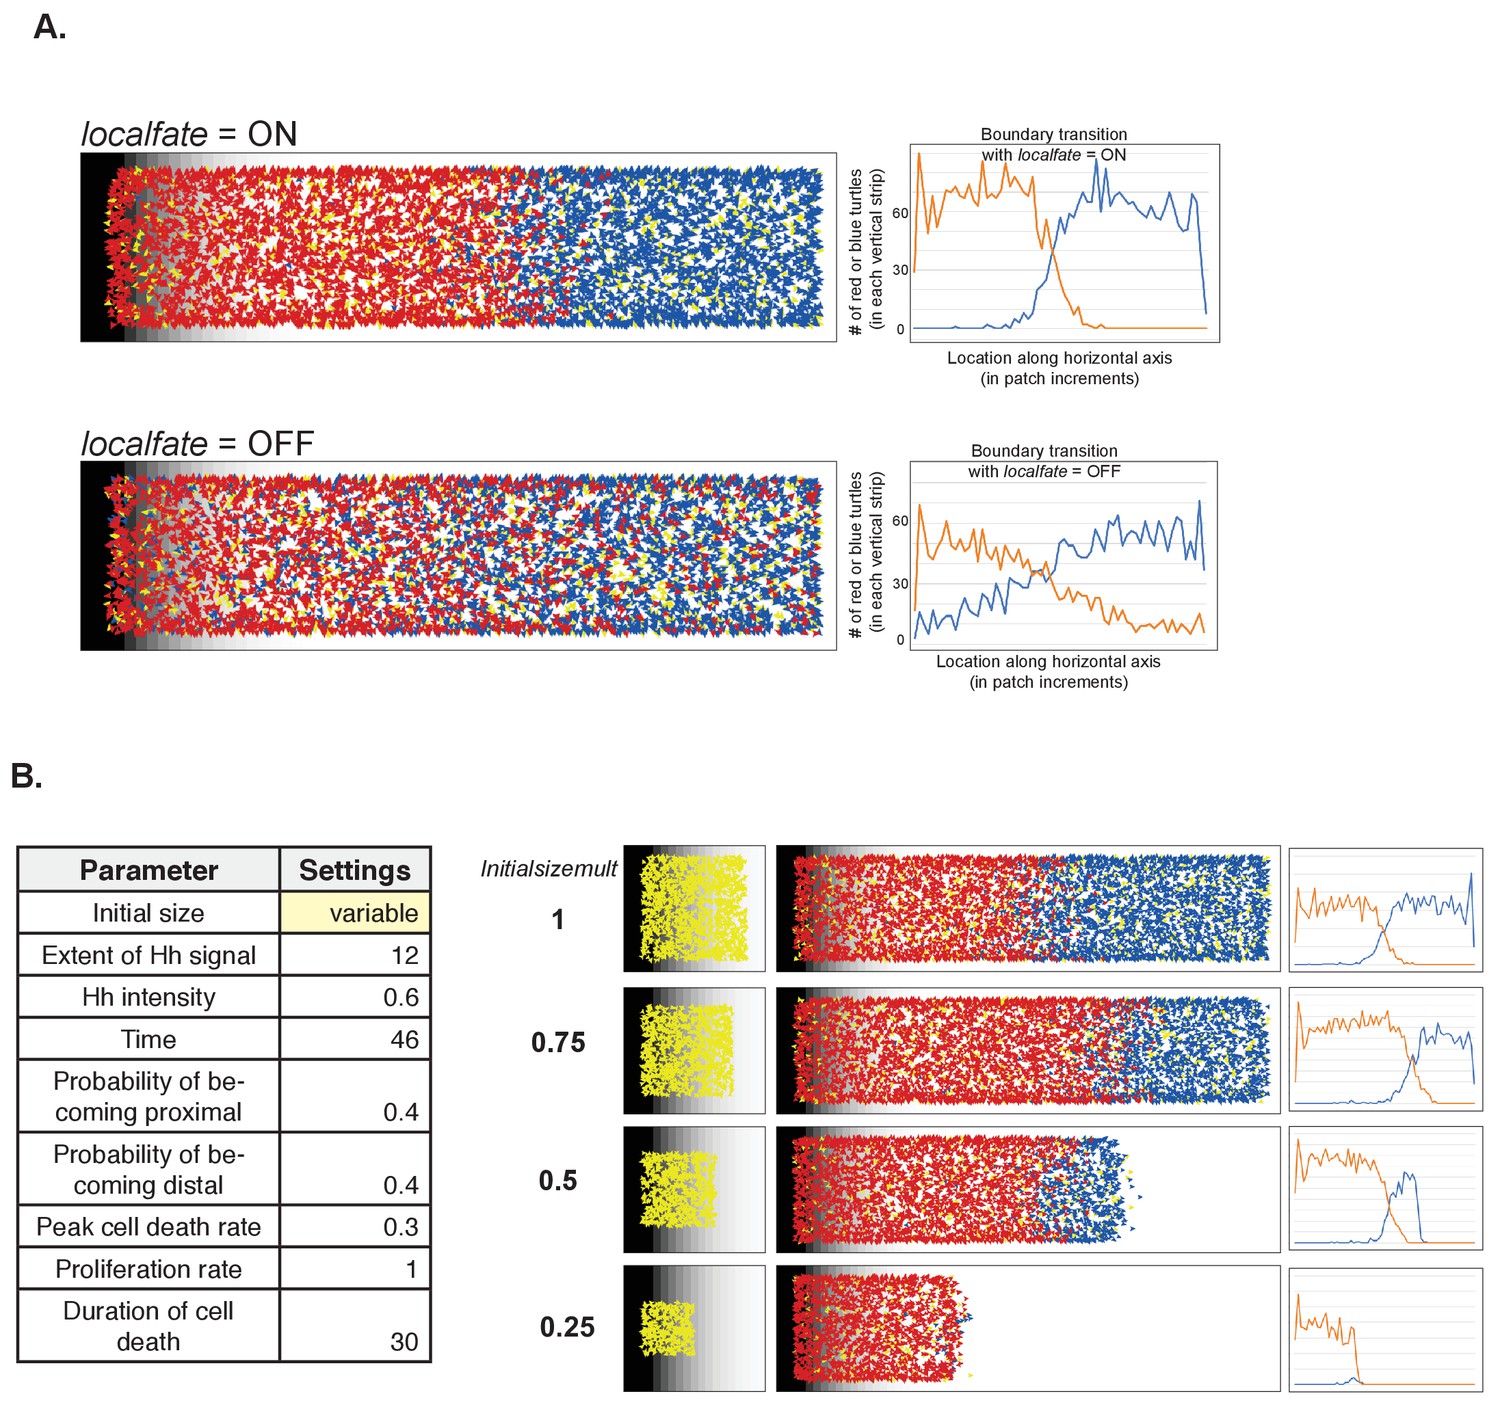
The impact of altering the nearest neighbor effect and the initial size on simulation outcome
(A) Effect of nearest neighbor on fate and boundary transition. (B) Varying the initial size (using the Normal settings as baseline for the other parameters).
Figure 6—figure supplement 3
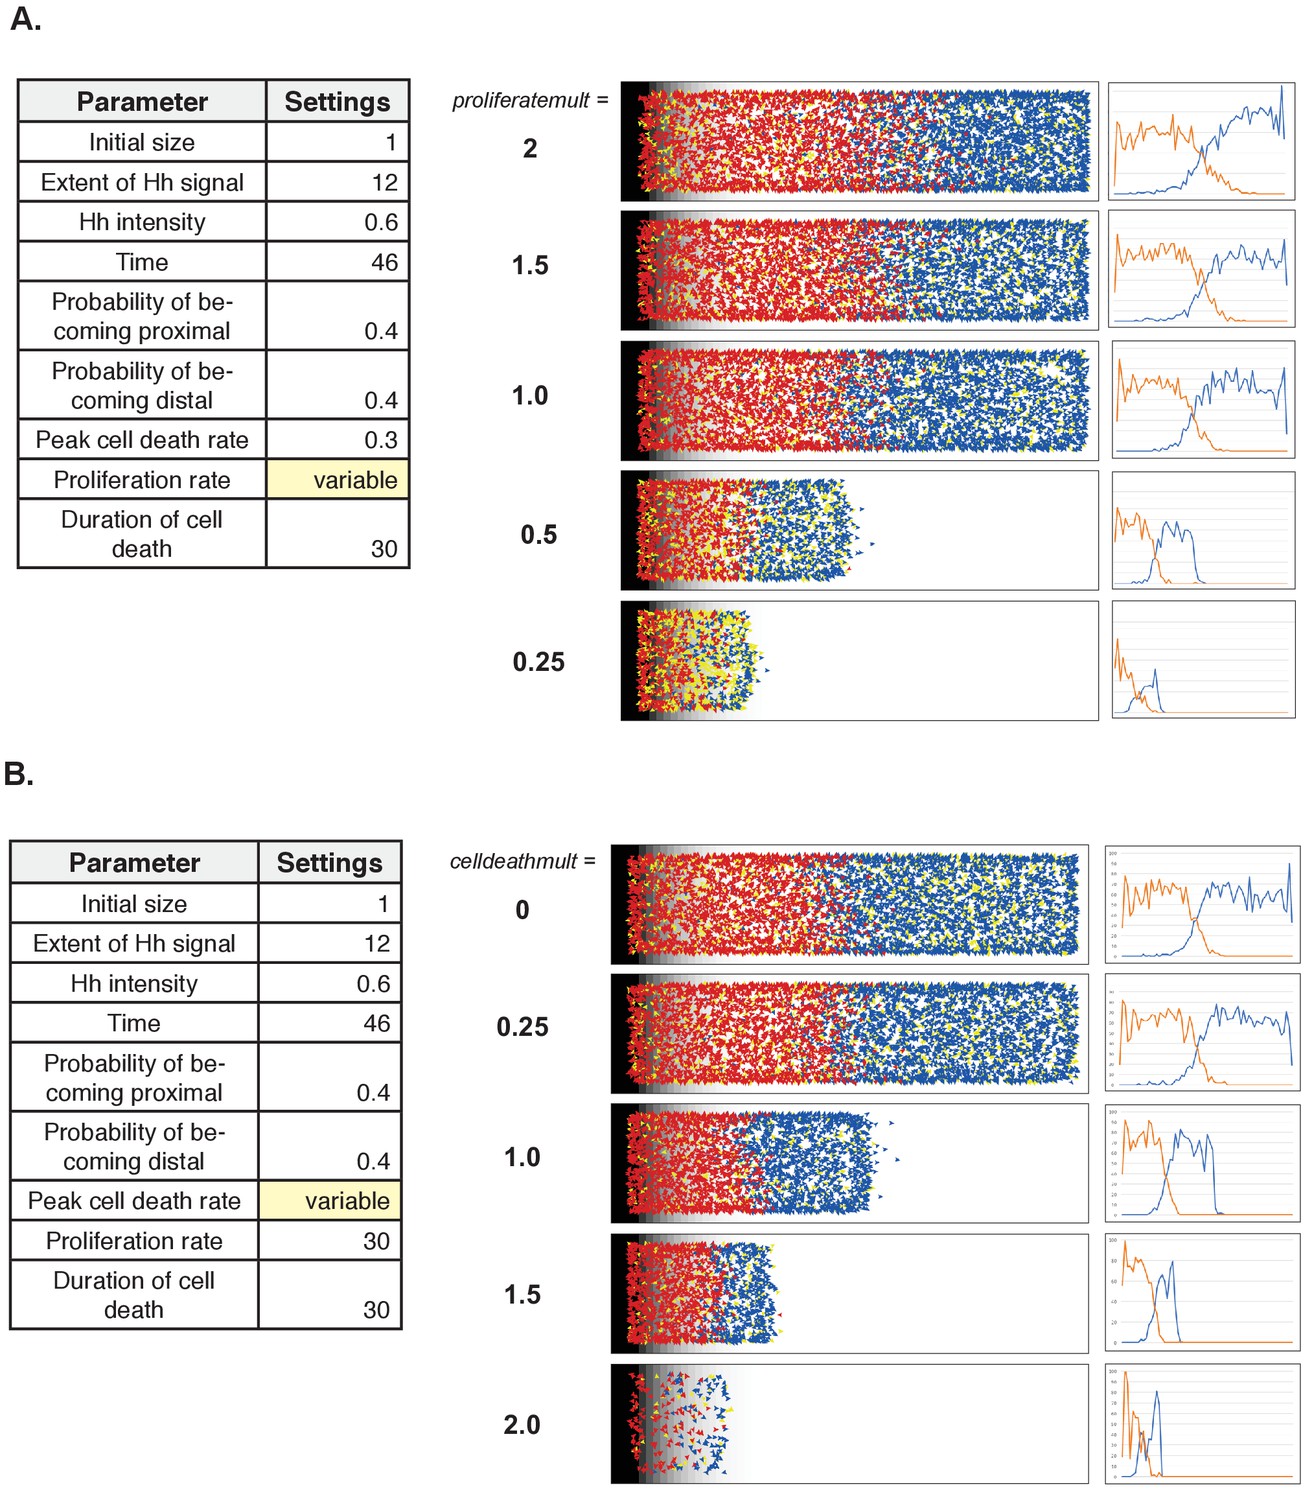
Outcome after varying the proliferation and cell death parameter values
(A) Varying the proliferation rate (using the Normal settings as baseline for the other parameters). (B) Varying the cell death rate (using the Normal settings as baseline for the other parameters).
Figure 7
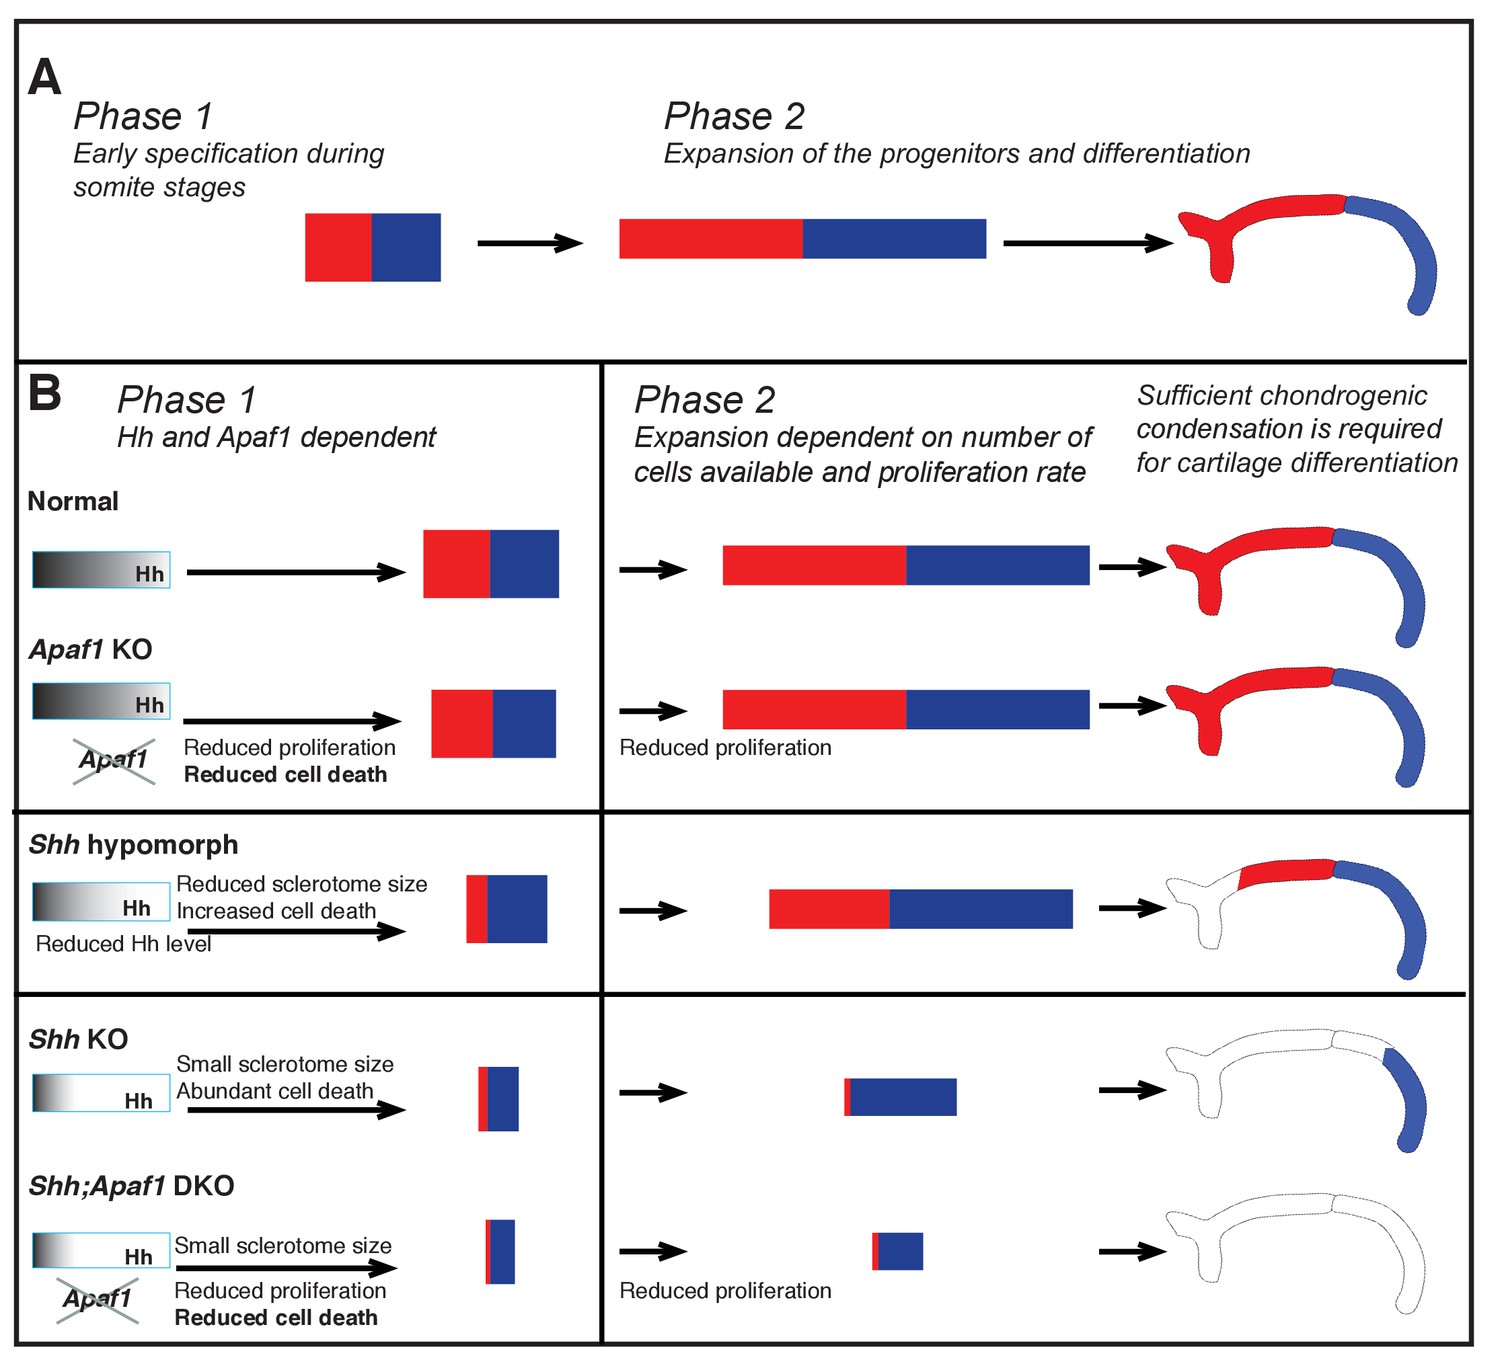
Summary of rib proximal-distal patterning: early specification and expansion.
(A) Based on insight from our computational simulations, we propose a qualitative description of normal development in terms of two effective phases: early specification (Phase 1) and expansion (Phase 2). Specification appears to occur early (during somitogenesis), while the population of cells resides within the range of the Hh gradient, and then expansion and differentiation occur during embryo growth with proximal and distal fates being maintained by some sort of community effect independent of the influence of Hh. (B) We suggest that during normal development, Phase 1 involves the biological processes of sclerotome induction, cell death, and proximal-distal patterning, while Phase 2 involves expansion of cell number dependent on: (1) the events of Phase 1, (2) the proliferation rate, and (3) the constraints of the space in which expansion happens (body size). In the absence of Apaf1, development is largely normal as a slighly smaller initial progenitor pool due to decreased cell proliferation is mostly compensated for by decreased cell death. In Shh KO embryos, Hh signaling is greatly reduced during Phase 1 and thus the number of cells induced to become sclerotome is reduced (much smaller initial size). In addition, low Hh signaling specifies predominantly distal sclerotome. Despite a high level of cell death, a sufficient number of cells proliferate and are able to differentiate into the most distal segment during Phase 2. When Hh signaling is not as dramatically reduced (as in Shh hypomorphs) distal and some proximal specification can occur. In Shh:Apaf1 DKO embryos, however, along with reduced sclerotome due to both loss of Shh (smaller initial size), cell proliferation in the somite is also further reduced. Thus, ultimately fewer skeletal progenitors are generated during Phase 2. These embryos are still able to form small distal aggregates; however, they are smaller than those found in Shh KO embryos, fail to condense or differentiate, and no rib skeletal elements form.
Videos
Video 1
Example simulations using the parameters listed in Table 1
https://doi.org/10.7554/eLife.29144.016Tables
Table 1
Parameter values used for running the simulations
https://doi.org/10.7554/eLife.29144.011| Parameter | Variable name | Normal | Apaf1 KO | Shh KO | Apaf1;Shh DKO |
|---|---|---|---|---|---|
| Initial size | initsizemult | 1 | 0.92 | 0.59 | .57 |
| Extent of Hh signal | shh-xport | 12 | 12 | 12 | 12 |
| Hh intensity | shh-intensity-log | 0.6 | 0.6 | -2 | -2 |
| Time | nticks | 46 | 46 | 46 | 46 |
| Probability of becoming proximal | pRed1 | 0.4 | 0.4 | 0.4 | 0.4 |
| Probability of becoming distal | pBlue1 | 0.4 | 0.4 | 0.4 | 0.4 |
| Peak cell death rate | celldeathmult | 0.3 | 0 | 1 | 0 |
| Proliferation rate | proliferatemult | 1 | 0.71 | 1.1 | 0.32 |
| Duration of cell death | cdduration | 30 | 30 | 30 | 30 |
Additional files
-
Source code 1
R code to process date in Figure 5—source data 1
- https://doi.org/10.7554/eLife.29144.018
-
Source code 2
Rstan Code to calculate the estimation
- https://doi.org/10.7554/eLife.29144.019
-
Source code 3
NetLogo code to run the simulation
- https://doi.org/10.7554/eLife.29144.020
-
Supplementary file 1
Description of the Bayesian method to estimate the median size and proliferation outcomes for each genotype
- https://doi.org/10.7554/eLife.29144.021
-
Supplementary file 2
Detailed description of the NetLogo model design
- https://doi.org/10.7554/eLife.29144.022
-
Transparent reporting form
- https://doi.org/10.7554/eLife.29144.023
Download links
A two-part list of links to download the article, or parts of the article, in various formats.
Downloads (link to download the article as PDF)
Open citations (links to open the citations from this article in various online reference manager services)
Cite this article (links to download the citations from this article in formats compatible with various reference manager tools)
A minimally sufficient model for rib proximal-distal patterning based on genetic analysis and agent-based simulations
eLife 6:e29144.
https://doi.org/10.7554/eLife.29144


