The synaptic ribbon is critical for sound encoding at high rates and with temporal precision
- University Medical Center Göttingen, Germany
- University of Göttingen, Germany
- Max Planck Institute for Biophysical Chemistry, Germany
- Max Planck Institute for Experimental Medicine, Germany
- Biomedical Sciences Institutes, Singapore
- Georg-August-University Göttingen, Germany
- University of the Saarland, Germany
- Max Planck Institute for Dynamics and Self-Organization, Germany
Figures
Figure 1 with 1 supplement
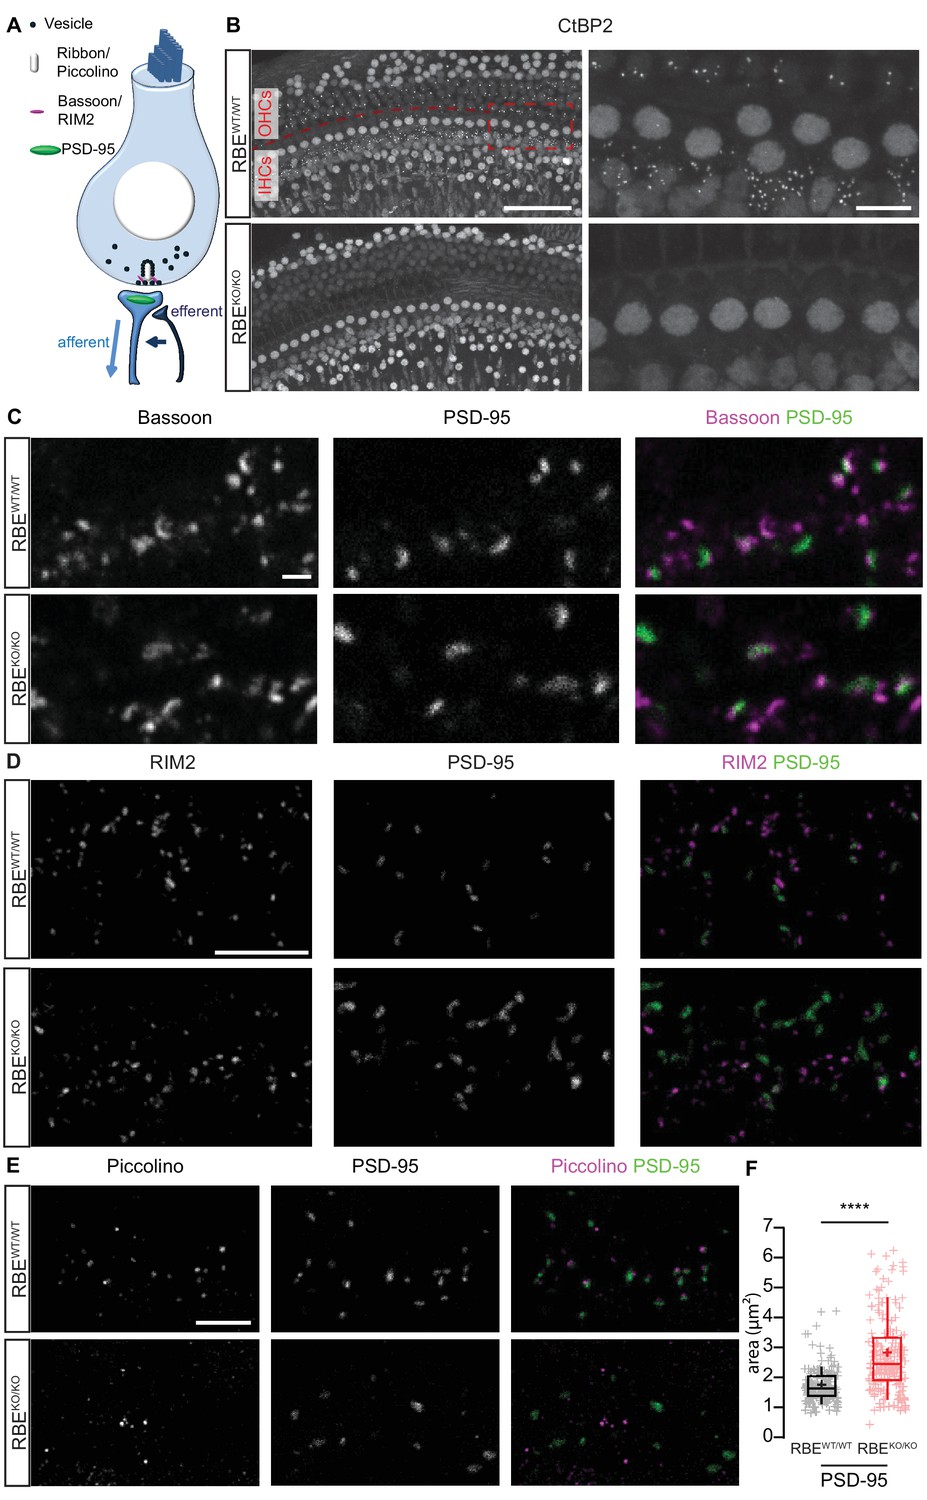
Loss of synaptic ribbons and piccolino from the AZs of RIBEYE-deficient IHCs.
(A) Simplified schematic representation of an IHC with the afferent and efferent connectivities. (B) Maximal projection of confocal sections from organs of Corti immunolabeled for CtBP2 and RIBEYE, present in the nuclei and the ribbons, respectively. The RBEWT/WT staining (top row) shows small puncta in the outer hair cell (OHC) and IHC rows representing the synaptic ribbons, which are completely absent in the RBEKO/KO hair cells (bottom row). Scale bar = 50 µm. Zoom into the IHC row (right column), emphasizes the complete disappearance of CtBP2-labeling at the basolateral part of RBEKO/KO IHCs. Scale bar = 10 µm. (C) Maximal projection of confocal sections from organs of Corti co-labeled for the presynaptic marker and anchor of the ribbon, bassoon (left column), and the postsynaptic marker, PSD-95 (middle column), in RBEWT/WT and RBEKO/KO IHCs. The merged picture (right column) shows the juxtaposition of bassoon (magenta) with PSD-95 (green), indicating its presence both at RBEWT/WT and ribbonless RBEKO/KO IHC synapses. Scale bar = 1 µm. (D) Maximal projection of confocal sections from organs of Corti co-labeled for the presynaptic marker RIM2 (left column) and the postsynaptic marker PSD-95 (middle column). The merged picture (right column) shows the co-localization of RIM2 (magenta) with PSD-95 (green) meaning its presence at the ribbonless IHC pre-synapses (scale bar = 5 µm). (E) Maximal projection of confocal sections from organs of Corti co-labeled for piccolino, a specific short splice variant of piccolo found at ribbons of RBEWT/WT IHC synapses (left column), co-labeled with PSD-95 (middle column). The merged pictures (right column) show PSD-95 (green) immunofluorescence lacking juxtaposed piccolino signal (magenta) in RBEKO/KO (bottom row), indicating absence of piccolino from afferent synapses of mutant IHCs. The punctate labeling for piccolo, away from PSD-95, most likely represents labeling of piccolo at conventional efferent synapses (schematically shown in Figure 1A). Scale bar = 5 µm. (F) Quantification of the area of PSD-95 immunofluorescent spots. The PSD-95 spots are siginificantly bigger in the RBEKO/KO IHCs (p<0.0001, Mann-Whitney-Wilcoxon test, n = 178 spots, N = 3 for RBEKO/KO and n = 163 spots, N = 3 for RBEWT/WT). Box plots show 10, 25, 50, 75 and 90th percentiles with individual data points overlaid; means are shown as crosses.
Figure 1—figure supplement 1
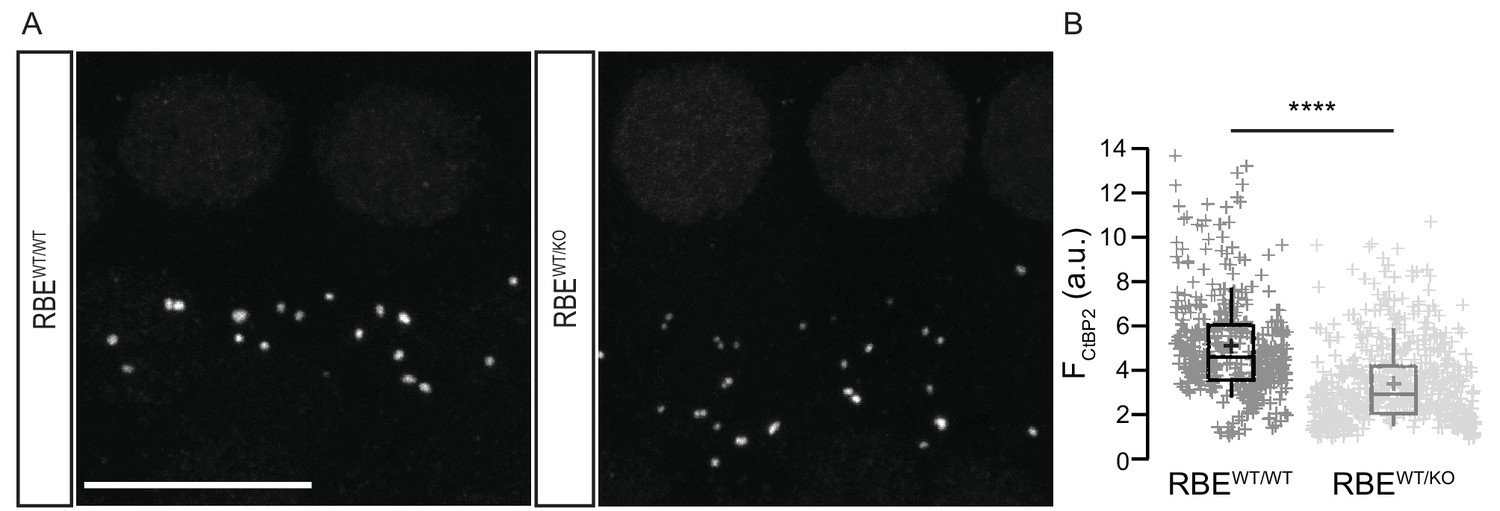
Gene-dosage dependent expression of the RIBEYE at IHC AZs.
(A) Maximal projection of organs of Corti immunolabeled for the C-terminal domain of both CtBP2 and RIBEYE, present in the nuclei and the ribbons. The number of ribbons does not differ between RBEWT/KO (n = 50 IHCs, N = 4) and RBEWT/WT IHCs (n = 39 IHCs, N = 3). Scale bar = 10 µm. (B) Box plot highlighting significantly reduced immunofluorescence intensities for the ribbons in the heterozygous condition (n = 600 spots for 40 RBEWT/KO IHCs, N = 3 and n = 411 spots for 29 RBEWT/WT IHCs, N = 3, p<0.0001, Mann-Whitney-Wilcoxon test). Box plots show 10, 25, 50, 75 and 90th percentiles with individual immunofluorescent spots overlaid; means are shown as crosses.
Figure 2 with 1 supplement
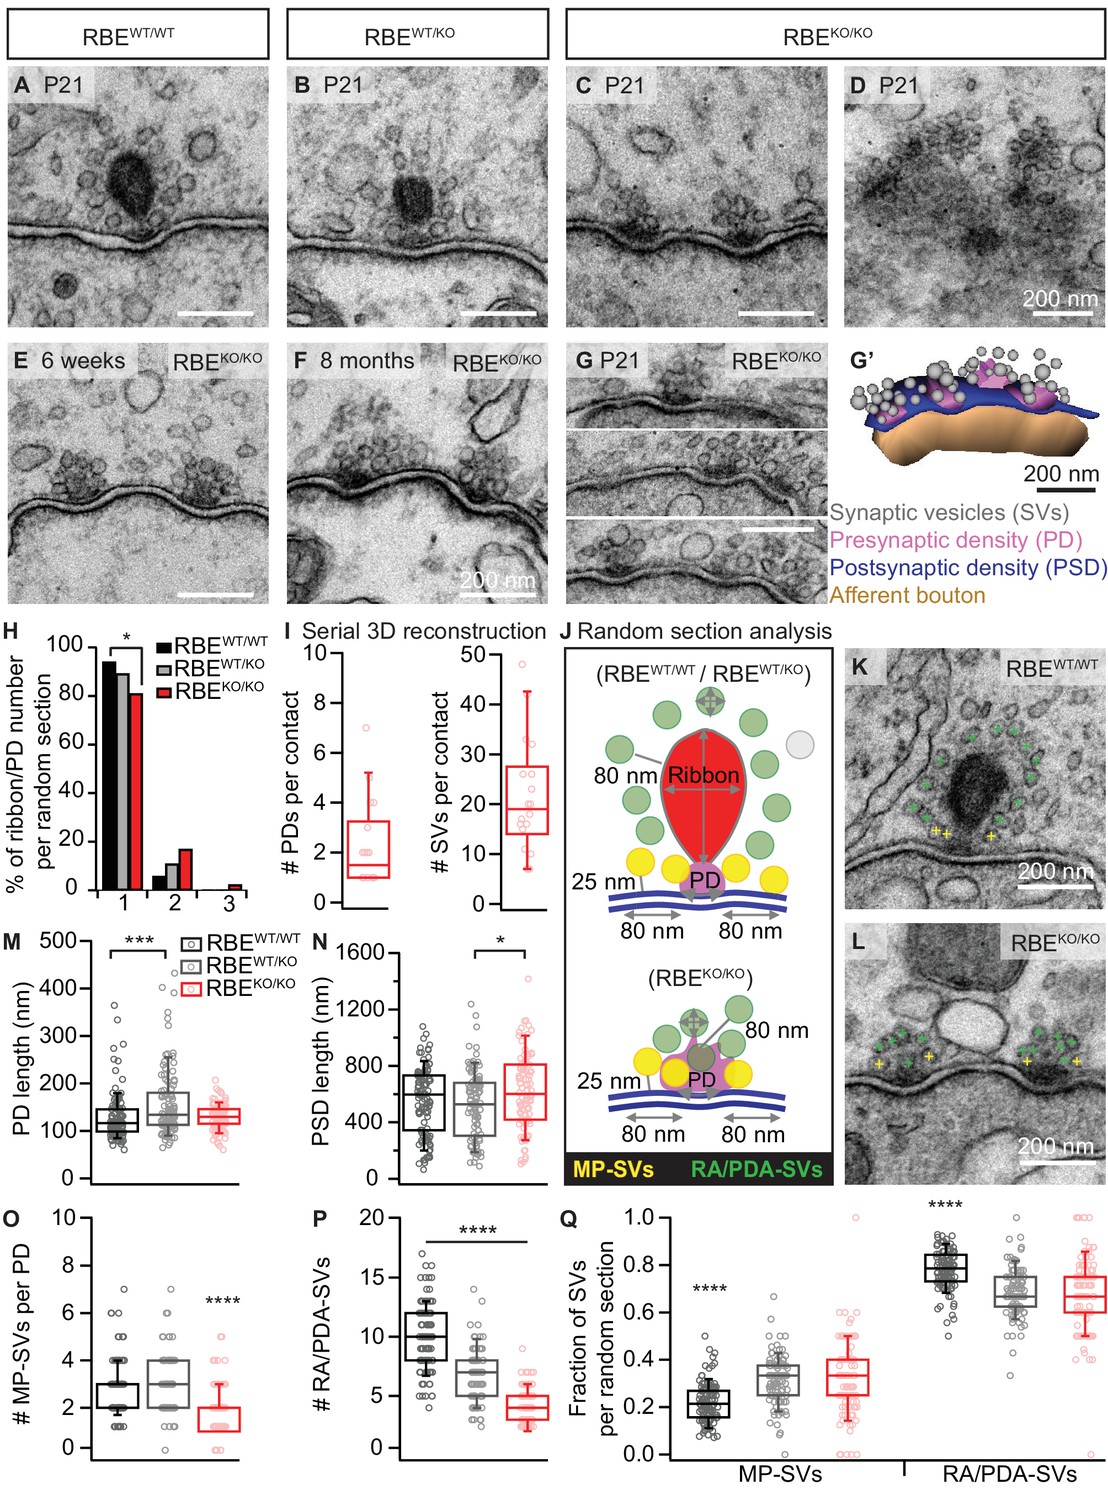
RIBEYE disruption transforms IHC synapses into contacts with multiple small ribbonless AZs.
(A–C) Representative electron micrographs of IHC afferent synapses from P21 RBEWT/WT, RBEWT/KO and RBEKO/KO mice. Ribbonless RBEKO/KO synapses display one or more presynaptic densities (PD) clustering SVs. Scale bars = 200 nm. (D) RBEKO/KO IHC AZ cut tangentially, revealing multiple PDs (here six) per AZ. (E, F) Representative electron micrographs of RBEKO/KO IHC synapses from mice at 6 weeks (E) and 8 months (F) of age: the presence of at least 2 AZs per contact in mature IHCs argues against a developmental delay. (G) Consecutive serial sections of a typical RBEKO/KO P21 IHC synapse showing multiple AZs. Scale bar = 200 nm. (G’) Corresponding serial 3D reconstruction of the synapse in (G) showing four PDs (magenta) surrounded by a total of 48 SVs (gray). Scale bar = 200 nm. (H) Quantification of the number of ribbon/PD per random section. AZs with a single PD are less frequently observed in RBEKO/KO IHCs (n = 108 AZs, N = 2 for RBEKO/KO and n = 106 AZs, N = 2 for RBEWT/WT; p<0.05, NPMC test). (I) Number of PDs and SVs per AZ in P21 RBE KO/KO mice in serial 3D reconstructions of RBEKO/KO afferent synapses. Box plots show 10, 25, 50, 75 and 90th percentiles with individual data points overlaid, as for (M, N, O, P & Q). (J) Schematic drawing illustrating the quantitative analysis of random sections. SV diameter: average of vertical and horizontal measurements from outer rim to outer rim. The ribbon height, width and area were measured as indicated by the gray lines. The length of the PD was determined along the AZ. For ribbon-occupied AZs: Membrane-proximal (MP) SVs (yellow) were counted in a distance of ≤25 nm from the AZ membrane (blue) and ≤80 nm from the PD. Ribbon-associated (RA) SVs were found in the first layer around the ribbon (red) with a maximum distance of 80 nm to the ribbon, quantified as indicated by the gray lines. For ribbonless AZs: Instead of RA-SVs we defined PD-associated SVs (PDA-SVs: all SV at PD with a maximum distance of 80 nm to the PD not matching the MP-SV criteria, defined as above). (K, L) Electron micrographs illustrating the quantification of the MP-SVs (yellow crosses) and the RA/PDA-SVs (green crosses). (M–Q) Quantification of random IHC synapse (P21) sections revealed no significant differences between RBE KO/KO and RBEWT/WT for the PD and PSD length (PD length: n = 108 PDs, N = 2 for RBE KO/KO and n = 108 PDs, N = 2 for RBEWT/WT; p=0.92, NPMC test and PSD length: n = 98 PSDs, N = 2 for RBE KO/KO and n = 113 PSDs, N = 2 for RBEWT/WT; p=0.11, Tukey’s test). However, in the RBEWT/KO IHCs, the PDs were bigger than in the WT IHCs (n = 101 PDs, N = 2; p=0.0004, NPMC test), and the PSDs were smaller than in the knock-out IHCs (n = 100 PSDs, N = 2 for RBEWT/KO; p=0.01, Tukey’s test). MP-SVs (n = 108 AZs, N = 2 for RBEKO/KO, n = 106 AZs, N = 2 for RBEWT/WT; p<0.0001, NPMC test) and RA/PDA-SVs (n = 108 AZs, N = 2 for RBEKO/KO, n = 106 AZs, N = 2 for RBEWT/WT; p<0.0001, Tukey’s test) per AZ, as well as the fraction of RA/PDA-SVs in RBEKO/KO, were significantly reduced (n = 108 AZs, N = 2 for RBEKO/KO, n = 106 AZs, N = 2 for RBEWT/WT; p<0.0001, NPMC test).
Figure 2—figure supplement 1
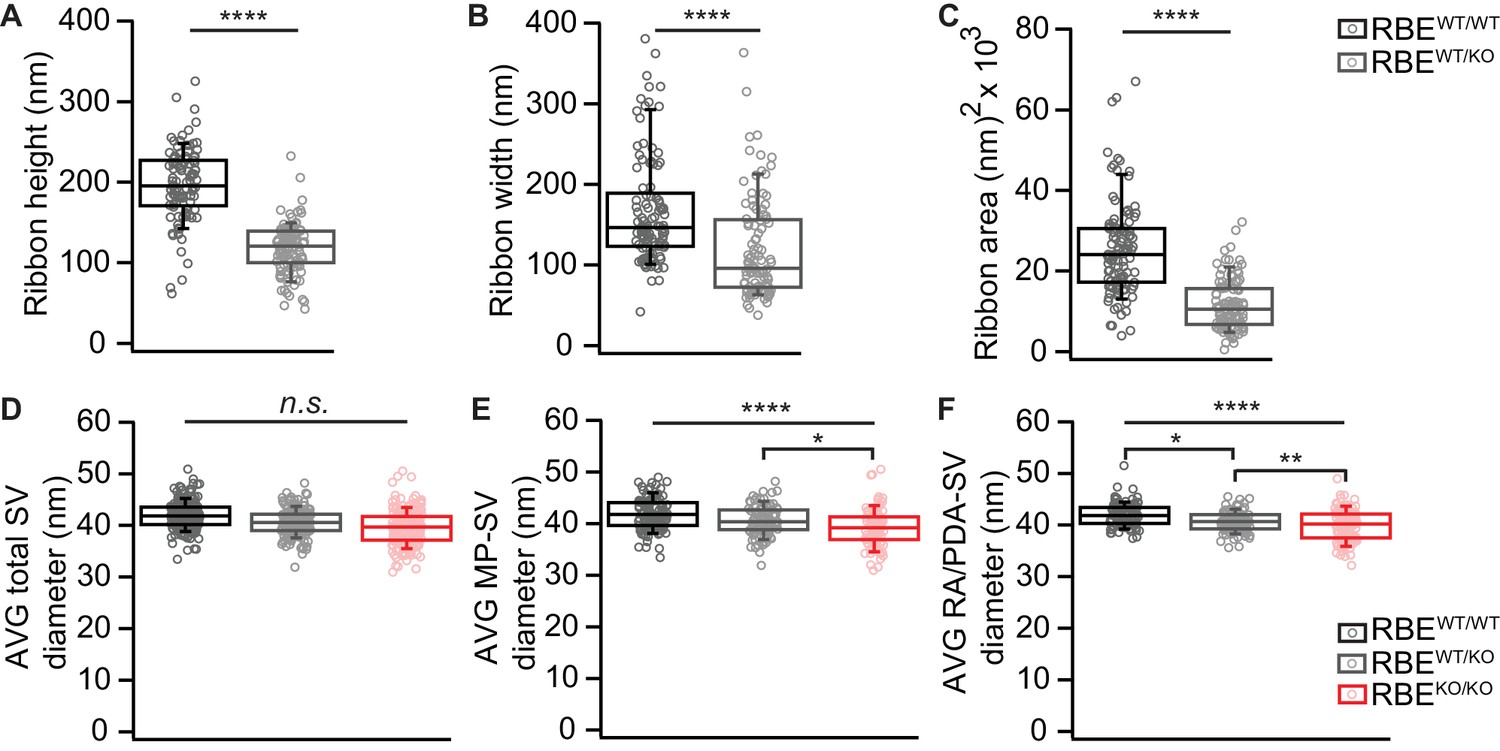
Random section analysis showed smaller synaptic ribbons and vesicles in RBEWT/KO mice.
(A–C) Random section analysis of P21 mice revealed smaller ribbon sizes in RBEWT/KO IHCs (n = 101 ribbons, N = 2 for RBEWT/KO, n = 106 ribbons, N = 2 for RBEWT/WT; p<0.0001, Mann-Whitney-Wilcoxon test for all), while the SV diameter per ribbon/PD was unaltered for all three genotypes considering all SVs (D): n = 108 AZs, N = 2 for RBEKO/KO, n = 101 AZs, N = 2 for RBEWT/KO, n = 106 AZs, N = 2 for RBEWT/WT as for (E, F); p=0.30, NPMC test. However, a reduction of MP-SV diameter (E): RBEKO/KO and RBEWT/KO vs. RBEWT/WT; p<0.0001, NPMC test and RBEWT/KO vs. RBEKO/KO; p=0.03, NPMC test) and RA/PDA-SV diameter (F): RBEKO/KO, vs. RBEWT/WT; p<0.0001, NPMC test and RBEKO/KO vs. RBEWT/KO; p=0.003, NPMC test and RBEWT/KO vs. RBEWT/WT; p=0.02, NPMC test) was observed for RBEWT/KO and RBEKO/KO. Box plots show 10, 25, 50, 75 and 90th percentiles with individual data points overlaid.
Figure 3 with 1 supplement
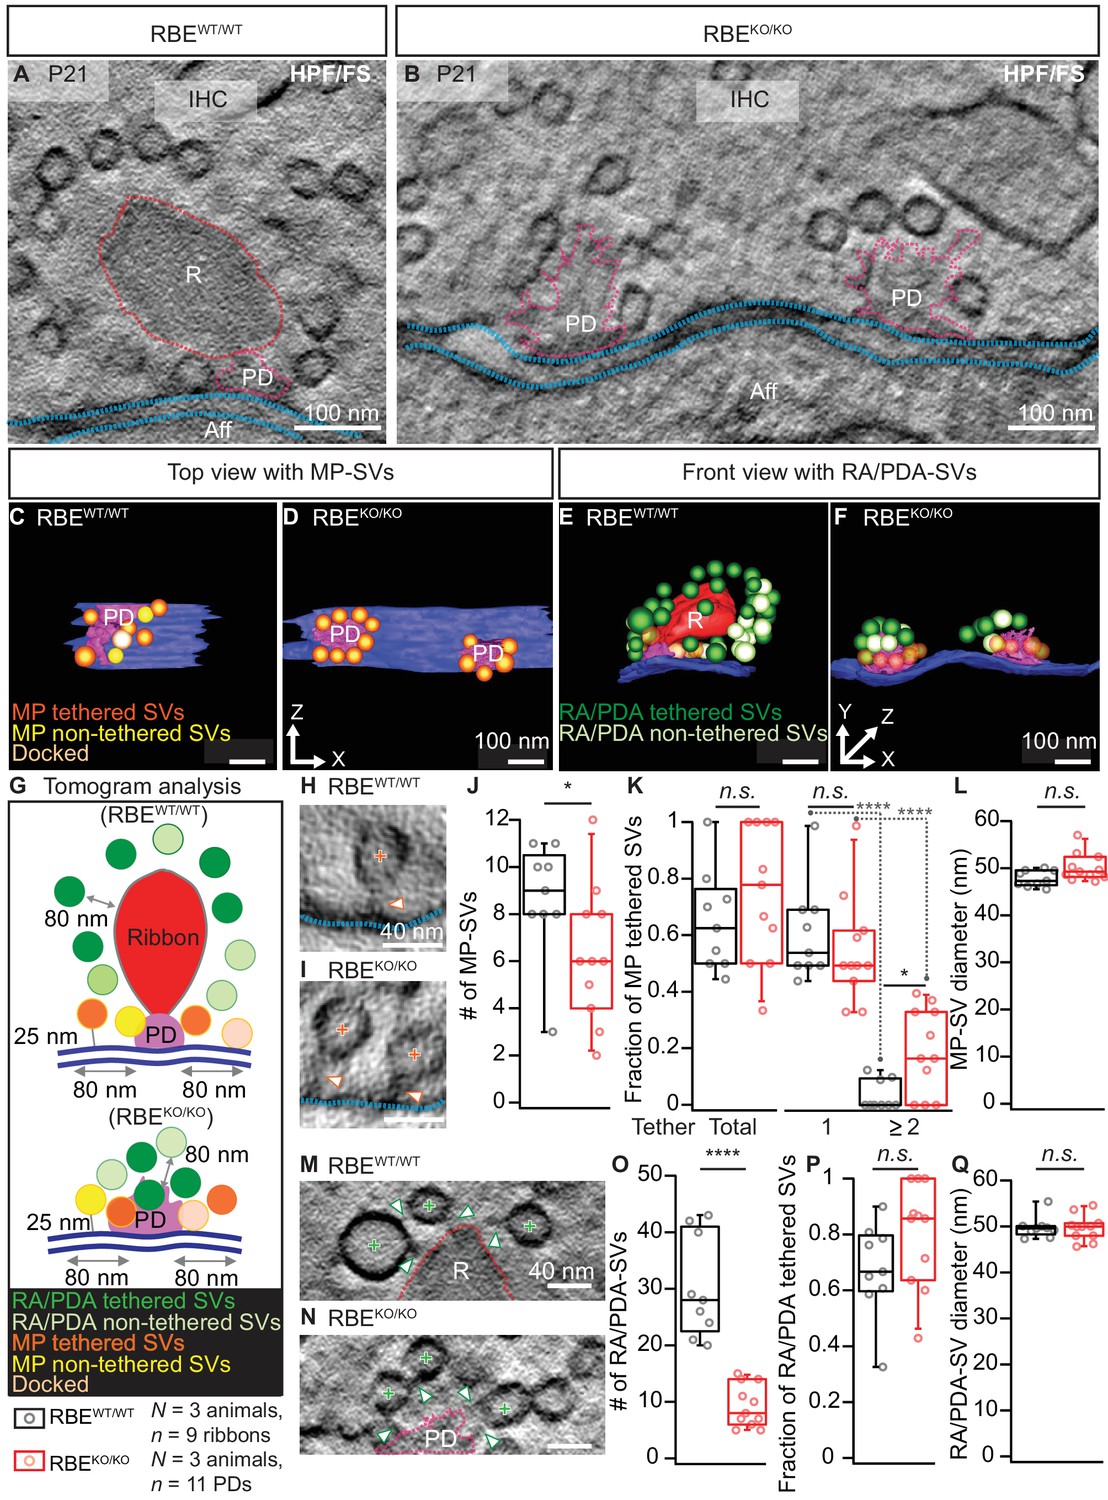
Electron tomography analysis of synaptic ultrastructure obtained after HPF/FS.
(A, B) Exemplary virtual electron tomographic sections of P21 RBEWT/WT (A) and RBEKO/KO (B) highlight the ribbon R in red, the presynaptic density (PD) in magenta and the AZ membrane with blue dotted lines. No synaptic ribbons, but two PDs were observed in RBEKO/KO (B). Scale bars = 100 nm. (C–F) 3D rendered models of RBEWT/WT (C, E) and RBEKO/KO (D, F) IHC synapses. (C, D) The top view depicts the MP-SV pool with tethered (orange), non-tethered (yellow) and docked (light orange) SVs. For clarity ribbons, RA/PDA-SVs are removed. Scale bars = 100 nm. (E,F) The front view shows the RA/PDA-SV pool from RBEWT/WT (E) and RBEKO/KO (F) IHCs. Tethered (dark green) and non-tethered (light green) RA/PDA-SVs. For the ease of visualization, the MP-SV pool is transparent here and other synaptic structures such as ribbon (red), PD (magenta) and AZ membrane (blue) are indicated. Scale bars = 100 nm. (G) Illustrations show the tomogram analysis parameters comparable to 2D-random section analysis (Figure 2), in addition to that the vesicle pools are subdivided into tethered, non-tethered and docked SVs. (H, I, M, N) Representative tomogram virtual sections of membrane-tethered MP-SVs (H, I; orange cross), ribbon/PD tethered SVs and ribbon/PD proximal interconnecting SVs (M, N; green cross) in RBEWT/WT (H, M) and in RBEKO/KO (I, N). Tethers are marked with a white arrowhead and other synaptic entities are color-coded similar to (A, B). Scale bars = 40 nm. (J–L) Quantification for the MP-SV pool is depicted; n = 9 ribbons, N = 3 animals for RBEWT/WT and n = 11 PDs, N = 3 animals for RBEKO/KO. Fewer MP-SV were observed in RBEKO/KO (J; p=0.04, Mann-Whitney-Wilcoxon test). The fraction of tethered MP-SVs was unaltered in RBEKO/KO (K; p=0.30, t-test). Most of the SVs were tethered by a single tether in both RBEKO/KO and RBEWT/WT. Significantly more SVs with multiple-tethers were observed in RBEKO/KO (K; single tethered MP-SVs, multiple-tethered MP-SVs: n.s.: p>0.05,*: p=0.01, ****: p<0.0001, Tukey’s test). MP-SV diameter was unaltered in RBEKO/KO (L; p=0.06, Mann-Whitney-Wilcoxon test). (O–Q) Quantification for the RA/PDA-SVs, sample size is same as for the MP-SV analysis. Significantly fewer PDA-SVs were observed in RBEKO/KO (O; RBEKO/KO: p<0.0001, Mann-Whitney-Wilcoxon test). The fraction of PDA tethered SVs in RBEKO/KO was comparable to RA tethered SVs in RBEWT/WT (P; p=0.12, t-test). SV diameters were unaltered in the RA/PDA vesicle pool (Q; p=0.06, Mann-Whitney-Wilcoxon test). Box plots show 10, 25, 50, 75 and 90th percentiles with individual data points overlaid. See Figure 3—figure supplement 1 and supplementary file 1 for modified tomogram analysis according to Jung et al., 2015a.
Figure 3—figure supplement 1
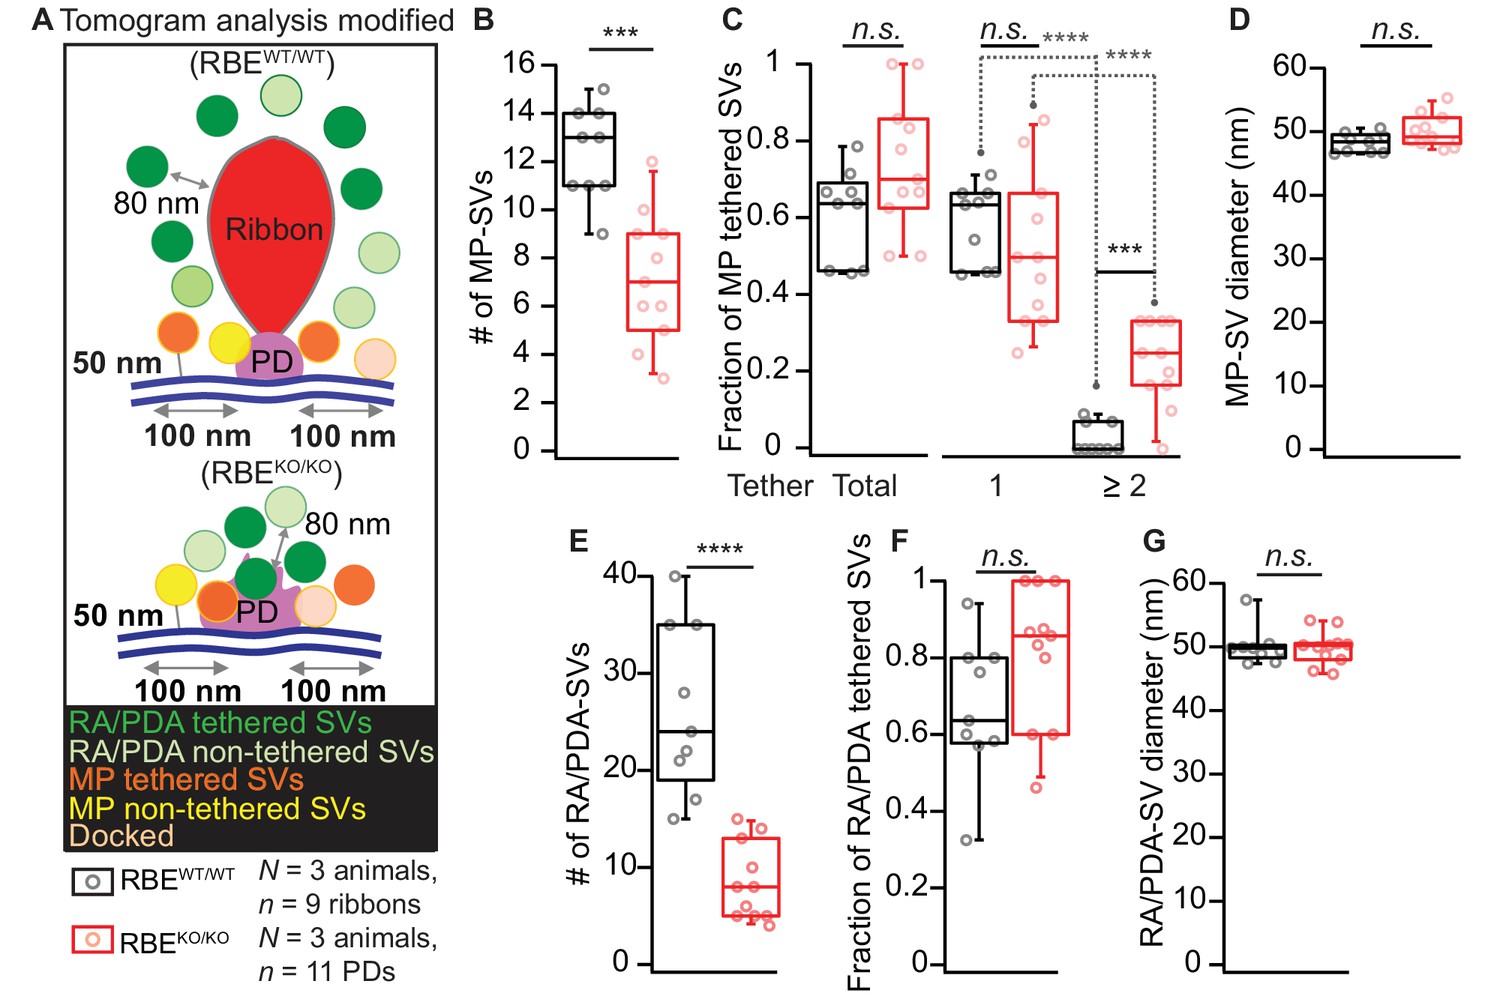
Electron tomogram analysis according to Jung et al., 2015a.
(A) Illustrations for tomogram analysis parameters, as used in Jung et al., 2015a are depicted. The MP-SVs were defined as vesicles with ≤50 nm from the AZ membrane and with the shortest distance from the vesicle membrane to the presynaptic density of ≤100 nm, excluding the RA/PDA-SVs. (B–D) Quantification for MP-SVs: n = 11 PDs, N = 3 animals for RBEKO/KO and n = 9 ribbons, N = 3 animals for RBEWT/WT were analyzed. Fewer MP-SVs were observed in RBEKO/KO (B; p=0.0001, Mann-Whitney-Wilcoxon test). The fraction of tethered MP-SVs was unaltered in RBEKO/KO (p=0.06, t-test). Most of the SVs were tethered by a single tether in both RBEWT/WT and RBEKO/KO. Significantly more multiple-tethered SVs were observed in RBEKO/KO (C; single-tethered MP-SVs; multiple-tethered MP-SVs, n.s.: p>0.05, ****: p<0.0001, Tukey’s test). MP-SV diameters were unaltered in RBEKO/KO (D; p=0.06, Mann-Whitney-Wilcoxon test). (E–G) Quantification for RA/PDA-SVs (same sample size): Significantly fewer PDA-SVs were observed in RBEKO/KO than RA-SVs in RBEWT/WT (E; p<0.0001, Mann-Whitney-Wilcoxon test). The fraction of tethered PDA-SVs in RBEKO/KO was comparable to that of tethered RA-SVs in RBEWT/WT (F; p=0.10, t-test). RA/PDA-SV diameters were unaltered (G; p=0.68, Mann-Whitney-Wilcoxon test). Box plots show 10, 25, 50, 75 and 90th percentiles with individual data points overlaid.
Figure 4
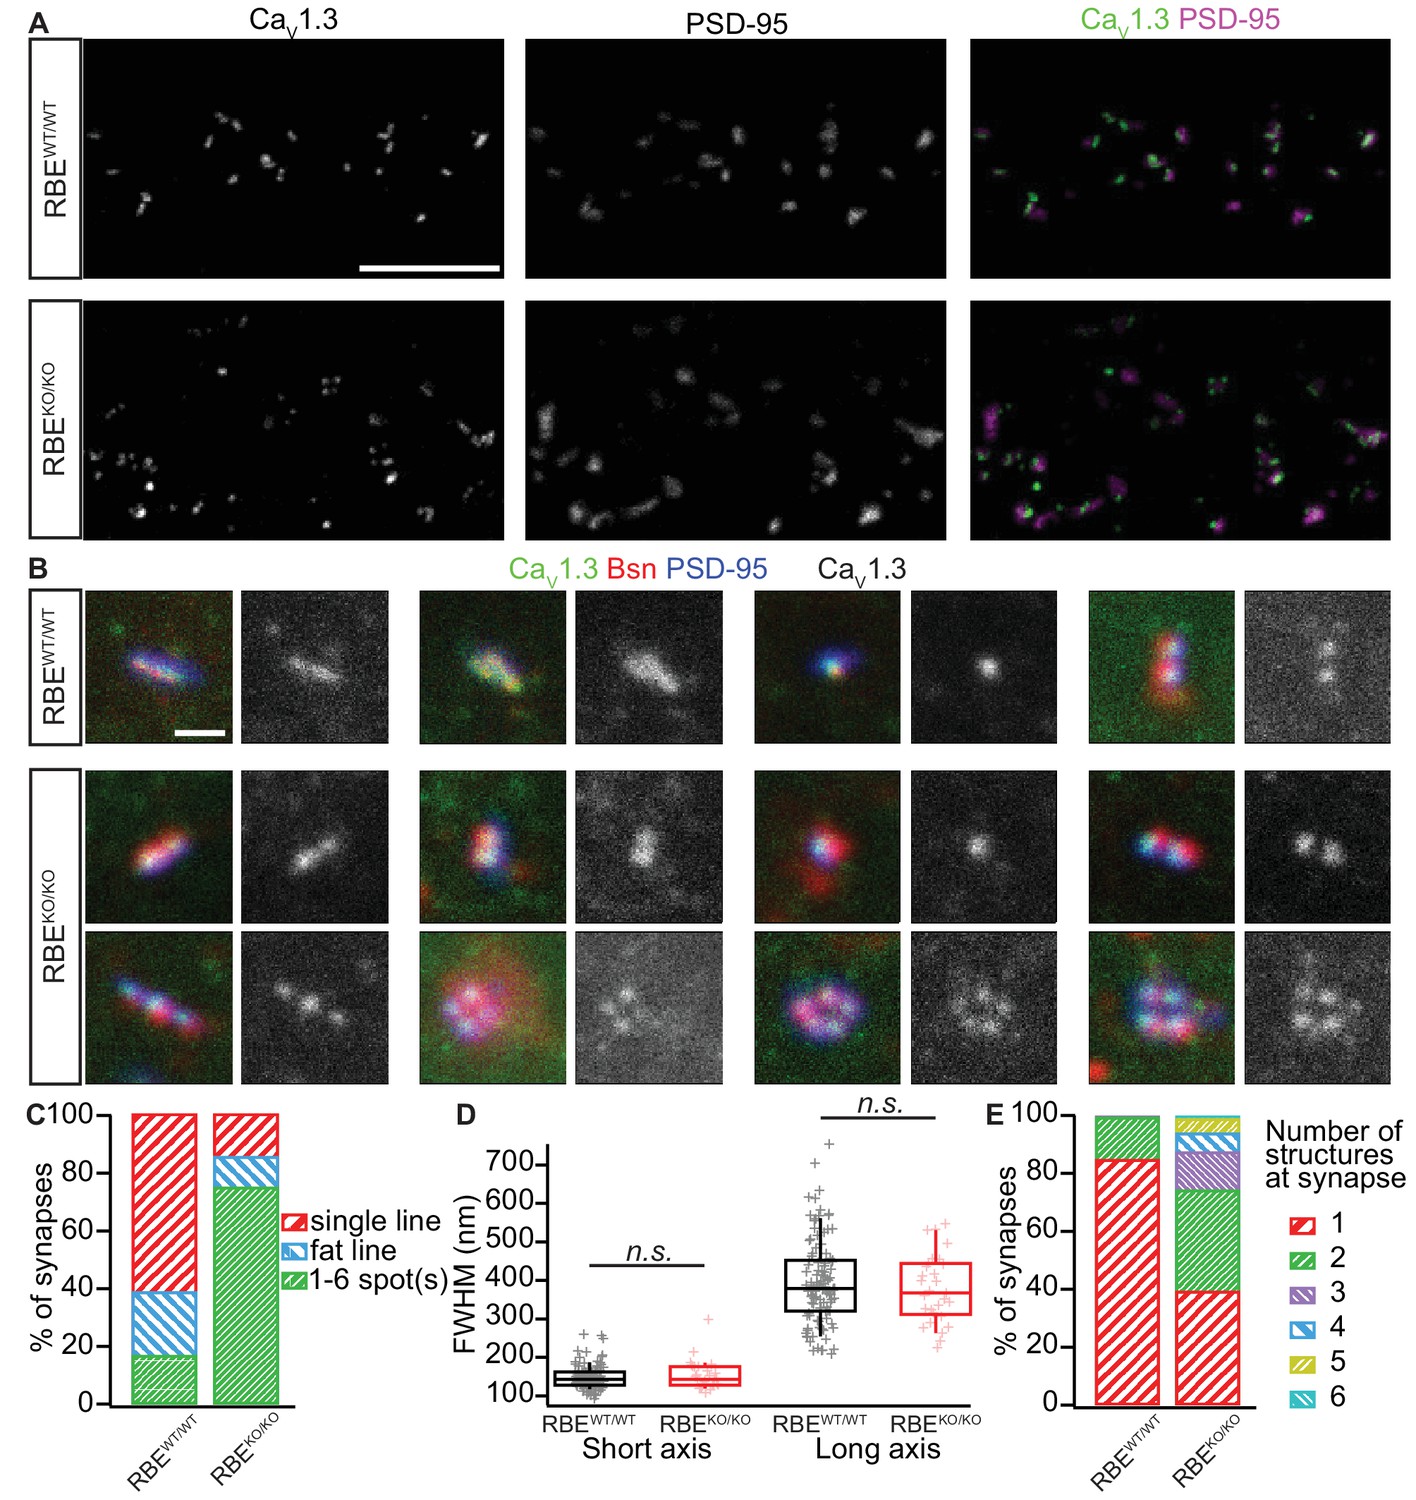
Analyzing AZ Ca2+-channel clusters using confocal and STED immunofluorescence microscopy.
(A) Maximal projections of confocal sections from organs of Corti immunolabeled for CaV1.3 Ca2+-channels (left column) and PSD-95 (middle column). The merged pictures (right column) show their juxtaposition in both conditions. While we mostly found one linear/spot-like Ca2+-channel cluster per PSD in RBEWT/WT IHCs (top row), we often observed several spots per PSD in RBEKO/KO IHCs (bottom row). Scale bar = 5 µm. (B) Triple co-labeling of CaV1.3 (green), bassoon (red), and PSD-95 (blue) at several IHC AZs from RBEWT/WT and RBEKO/KO mice, imaged in 2D-STED (CaV1.3 and PSD-95) and confocal mode (bassoon), showing that CaV1.3 Ca2+-channels cluster at AZs in IHCs of both genotypes. CaV1.3 immunofluorescence is displayed in gray next to the merged image for better visualization. Scale bar = 500 nm. (C) 178 RBEWT/WT and 183 RBEKO/KO synapses were categorized according to the pattern of CaV1.3 immunofluorescence found by assigning them to a group of either line-shaped clusters, fat line-shaped clusters or one/multiple spots. A markedly higher fraction of synapses was found to display a spot-like CaV1.3-signal in RBEKO/KO than in RBEWT/WT IHCs. (D) Fitting of a 2D-Gaussian function to the immunofluorescence data of the line-shaped CaV1.3 clusters showed no difference in terms of size between RBEWT/WT and RBEKO/KO clusters, as estimated by the full width at half maximum of the Gaussian’s short and long axis. Box plots show 10, 25, 50, 75 and 90th percentiles with individual data points overlaid. (E) Quantification of the number of fluorescent structures (lines or spots) labeled by the anti-CaV1.3 antibody at RBEWT/WT and RBEKO/KO synapses showed a significantly increased number in the knockout (p<0.0001, Mann-Whitney-Wilcoxon test).
Figure 5
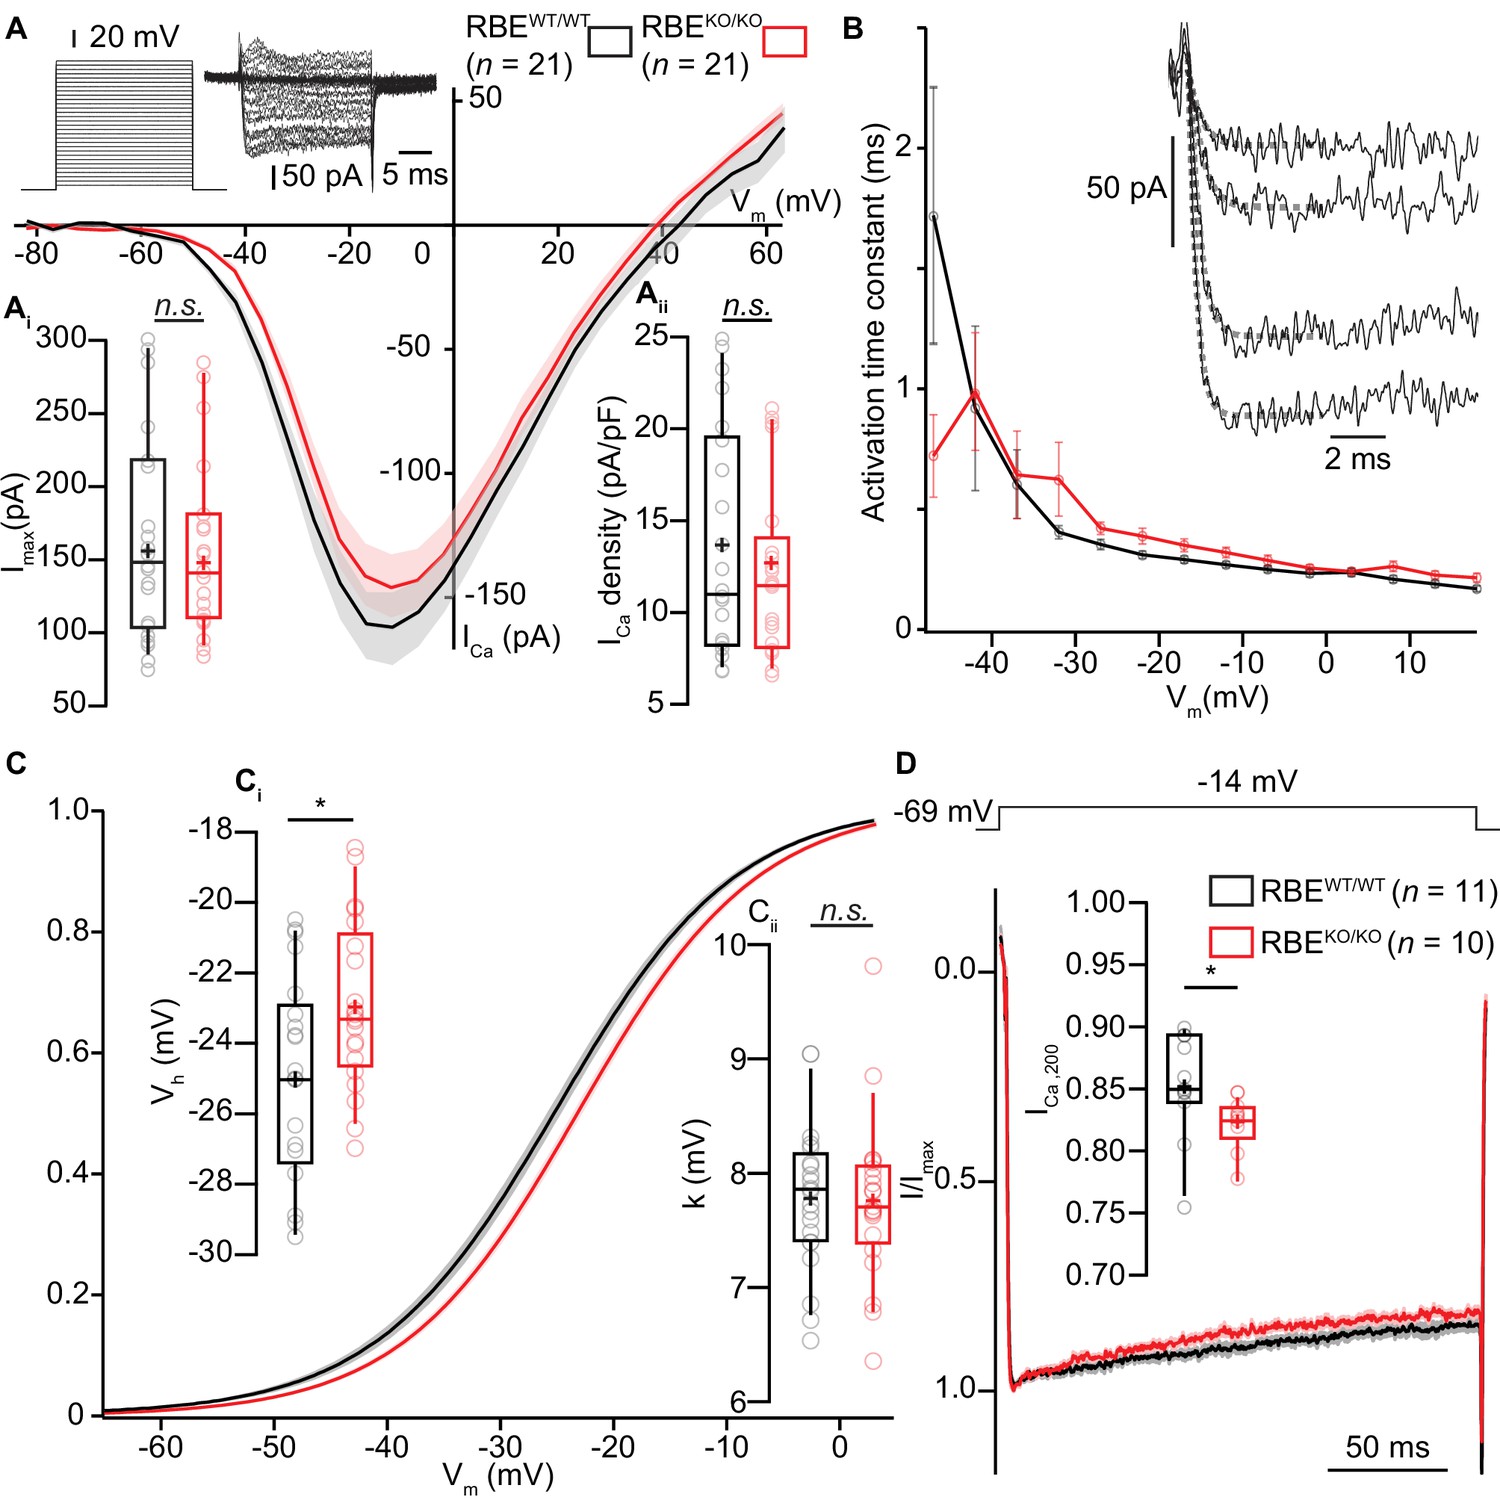
IHC Ca2+-influx shows normal amplitude but a mild depolarized shift in voltage-dependence.
(A) IV-relationship of the whole-cell Ca2+-current in RBEWT/WT (black, n = 21 cells, N = 8) and RBEKO/KO (red, n = 21 cells, N = 8) IHCs show comparable (sign-inverted) current amplitudes (Ai, p=0.62, t-test) and density (Aii, p=0.37, t-test.). Mean (line) ± S.E.M. (shaded areas) are displayed as for (C, D). The protocol, consisting of 20 ms steps of 5 mV from −82 to +63 mV, as well as exemplary resulting currents, aredisplayed in the left. Box plots show 10, 25, 50, 75 and 90th percentiles with individual data points overlaid, means are shown as crosses, as for (C, D). (B) Activation time constants (mean ± S.E.M.) of Ca2+-currents at different potentials were obtained by fitting a power exponential equation to the first 5 ms of the current traces, revealing no differences between conditions. (C) Fractional activation of the whole-cell Ca2+-current derived from the IV-relationships (A) was fitted to a Boltzmann function. (Ci) Box plots of the voltage for half-maximal activation Vh and Vh-estimates of individual IHCs show a depolarized shift of the fractional activation of the Cav1.3 Ca2+-channels in the RBEKO/KO IHCs (p=0.029, t-test). (Cii) Box plots of the voltage-sensitivity or slope factor k and k-estimates of individual IHCs illustrate comparable voltage sensitivity between both conditions (p=0.67, t-test). (D) Average peak-normalized Ca2+-currents resulting from 200 ms depolarizations to −14 mV. We observe an enhanced inactivation in ribbonless IHCs, quantified as a reduced residual Ca2+-current (inset). (n = 10 cells, N = 5 for RBEKO/KO and n = 11 cells, N = 7 in the RBEWT/WT; p=0.017, Mann-Whitney-Wilcoxon test).
Figure 6 with 1 supplement

Synaptic Ca2+-influx shows normal amplitude but shifted voltage-dependence and broader spread.
(A, B) IHCs were patch-clamped at the modiolar basolateral face, loaded with TAMRA-CtBP2-binding peptide and the low affinity Ca2+-indicator Fluo-4FF, and scanned in the red channel after loading for 4 min to image TAMRA-labeled ribbons, nuclei, and cytosol. 3D projection of TAMRA fluorescence shows the absence of ribbons in RBEKO/KO IHCs (B: 3D projection and red channel). Voltage-ramps from −87 to +63 mV during 150 ms (A: left top) were used to trigger synaptic hotspots of Fluo-4FF fluorescence (A: left middle, 10 AZs in one exemplary RBEWT/WT IHC, B: green channel, marked by arrowheads; ΔF: average of the nine brightest pixels (red square)) and IHC Ca2+-influx (A, left bottom). Ca2+-imaging proceeded from the IHC bottom to the most apical ribbon in RBEWT/WT, and from IHC bottom to +12 µm (typically reaching the bottom of nucleus) in RBEKO/KO. Scale bar = 5 µm. (C) FV-relationship (ΔF/F0 vs. depolarization level in ramp, protocol as in A): approximating the voltage-dependence of synaptic Ca2+-influx.Mean (line) ± S.E.M. (shaded areas) are displayed as for (D). (Ci) ΔFmax/F0 was calculated by averaging 5 values at the FV-peak (between the dotted lines) and was comparable between RBEWT/WT (n = 78 AZs for 15 cells, N = 8) and RBEKO/KO IHCs (n = 61 AZs for 15 cells, N = 7) (p=0.20, Mann-Whitney-Wilcoxon test). Box plots show 10, 25, 50, 75 and 90th percentiles with individual data points overlaid, means are shown as crosses, as for (D, F). (D) Fractional activation curves derived from fits to the FV-relationships (C) were fitted to a Boltzmann function. Mean (line) ± S.E.M. (shaded areas) are displayed. (Di) The voltage for half-maximal activation Vh was significantly different between RBEWT/WT (n = 68 AZs for 15 IHCs, N = 8) and RBEKO/KO (n = 55 AZs for 15 IHCs, N = 7) AZs (p=0.0029, t-test), while the voltage-sensitivity or slope factor k (Dii) not (p=0.42, t-test). (E) Exemplary ΔF pictures of Fluo-4FF hotspots at RBEWT/WT (left) and RBE KO/KO (right) synapses fitted and overlaid by 2D-Gaussian functions to estimate spatial extent as full width at half maximum (FWHM) for the short axis (S.A.) and the long axis (L.A.). Scale bar = 1 µm. (F) Ribbonless synapses of RBEKO/KO IHCs showed a greater spatial spread of the Fluo-4FF fluorescence change. FWHM calculated from the Gaussian fitting to the Fluo-4FF fluorescence hotspot was larger for both axes in RBEKO/KO (n = 61 AZs for 15 IHCs, N = 8) compared to RBEWT/WT (n = 74 AZs for 15 IHCs, N = 7) (L.A.: p=0.00016; S.A.: p=0.0029, t-test).
Figure 6—figure supplement 1
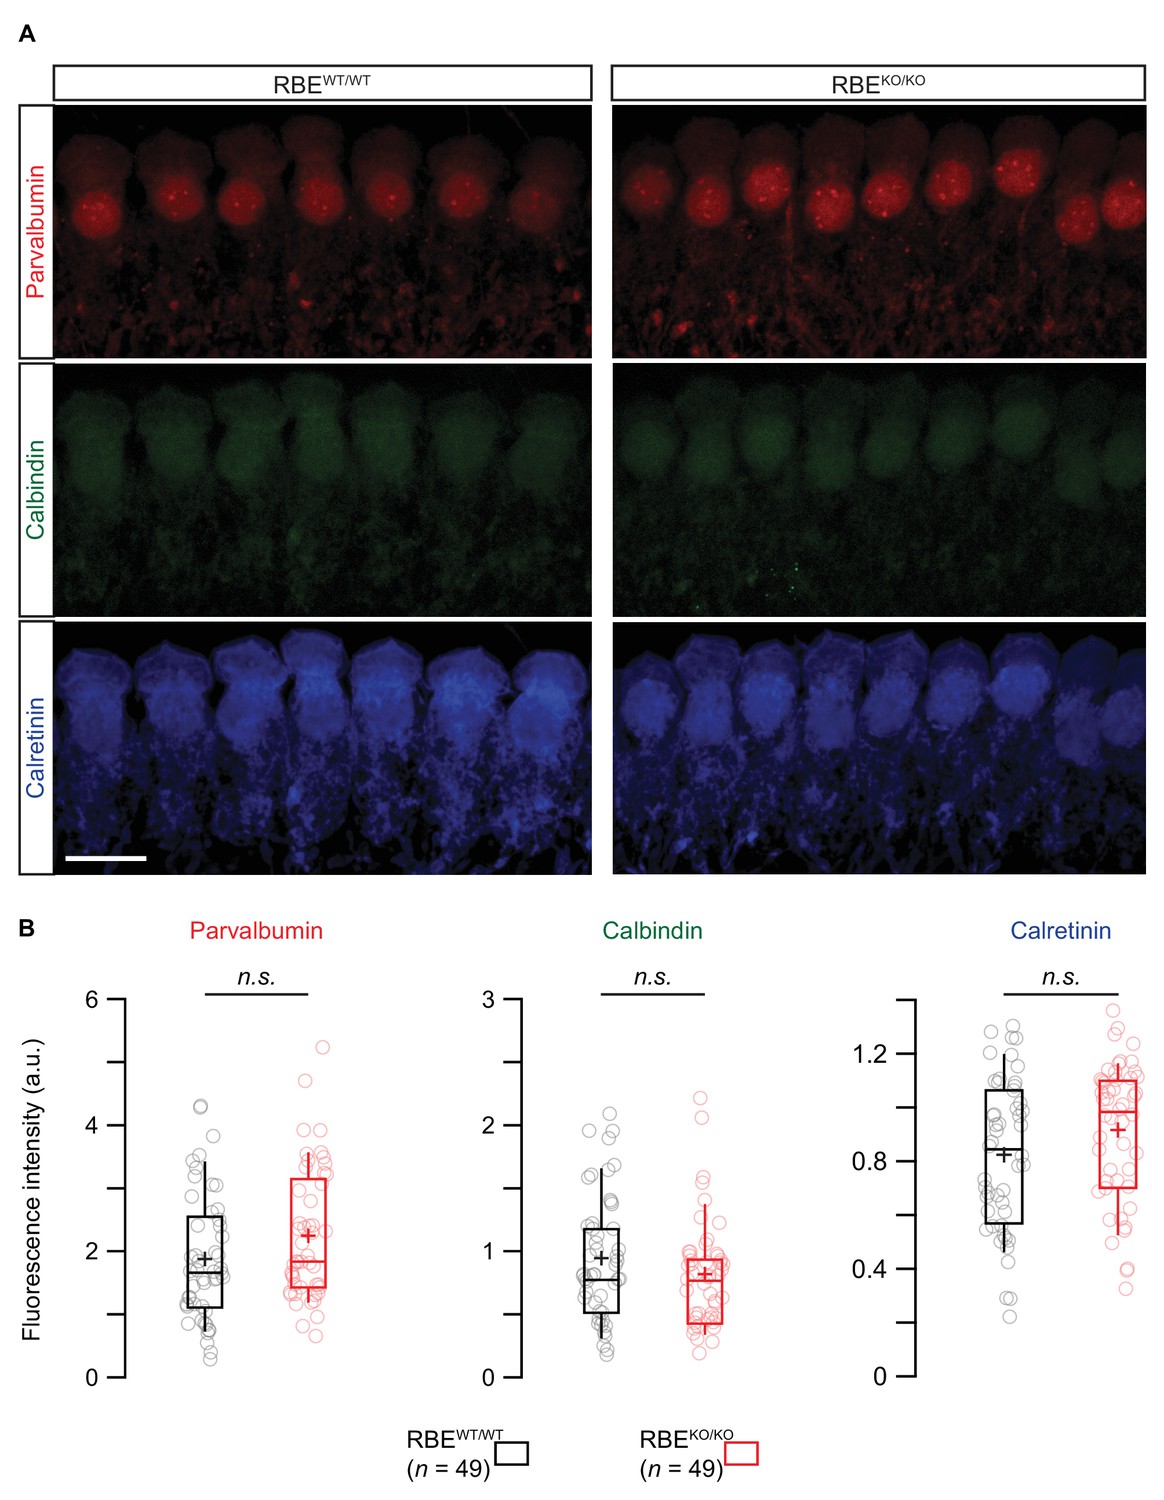
Semi-quantitative immunofluorescence analysis of the three main proteinaceous Ca2+-buffers.
(A) Maximal projection of confocal sections from organs of Corti co-immunolabeled for parvalbumin (top row), calbindin (middle row) and calretinin (bottom row). Scale bar = 10 µm. (B) Box plots showed no significant differences in immunofluorescence intensities for the three proteinaceous Ca2+-buffers between RBEKO/KO and RBEWT/WT conditions (n = 49 IHCs, N = 4 for both genotypes, p=0.08, 0.23 and 0.09 from left to right, Mann-Whitney-Wilcoxon test for all). Box plots show 10, 25, 50, 75 and 90th percentiles with individual cells overlaid; means are shown as crosses.
Figure 7
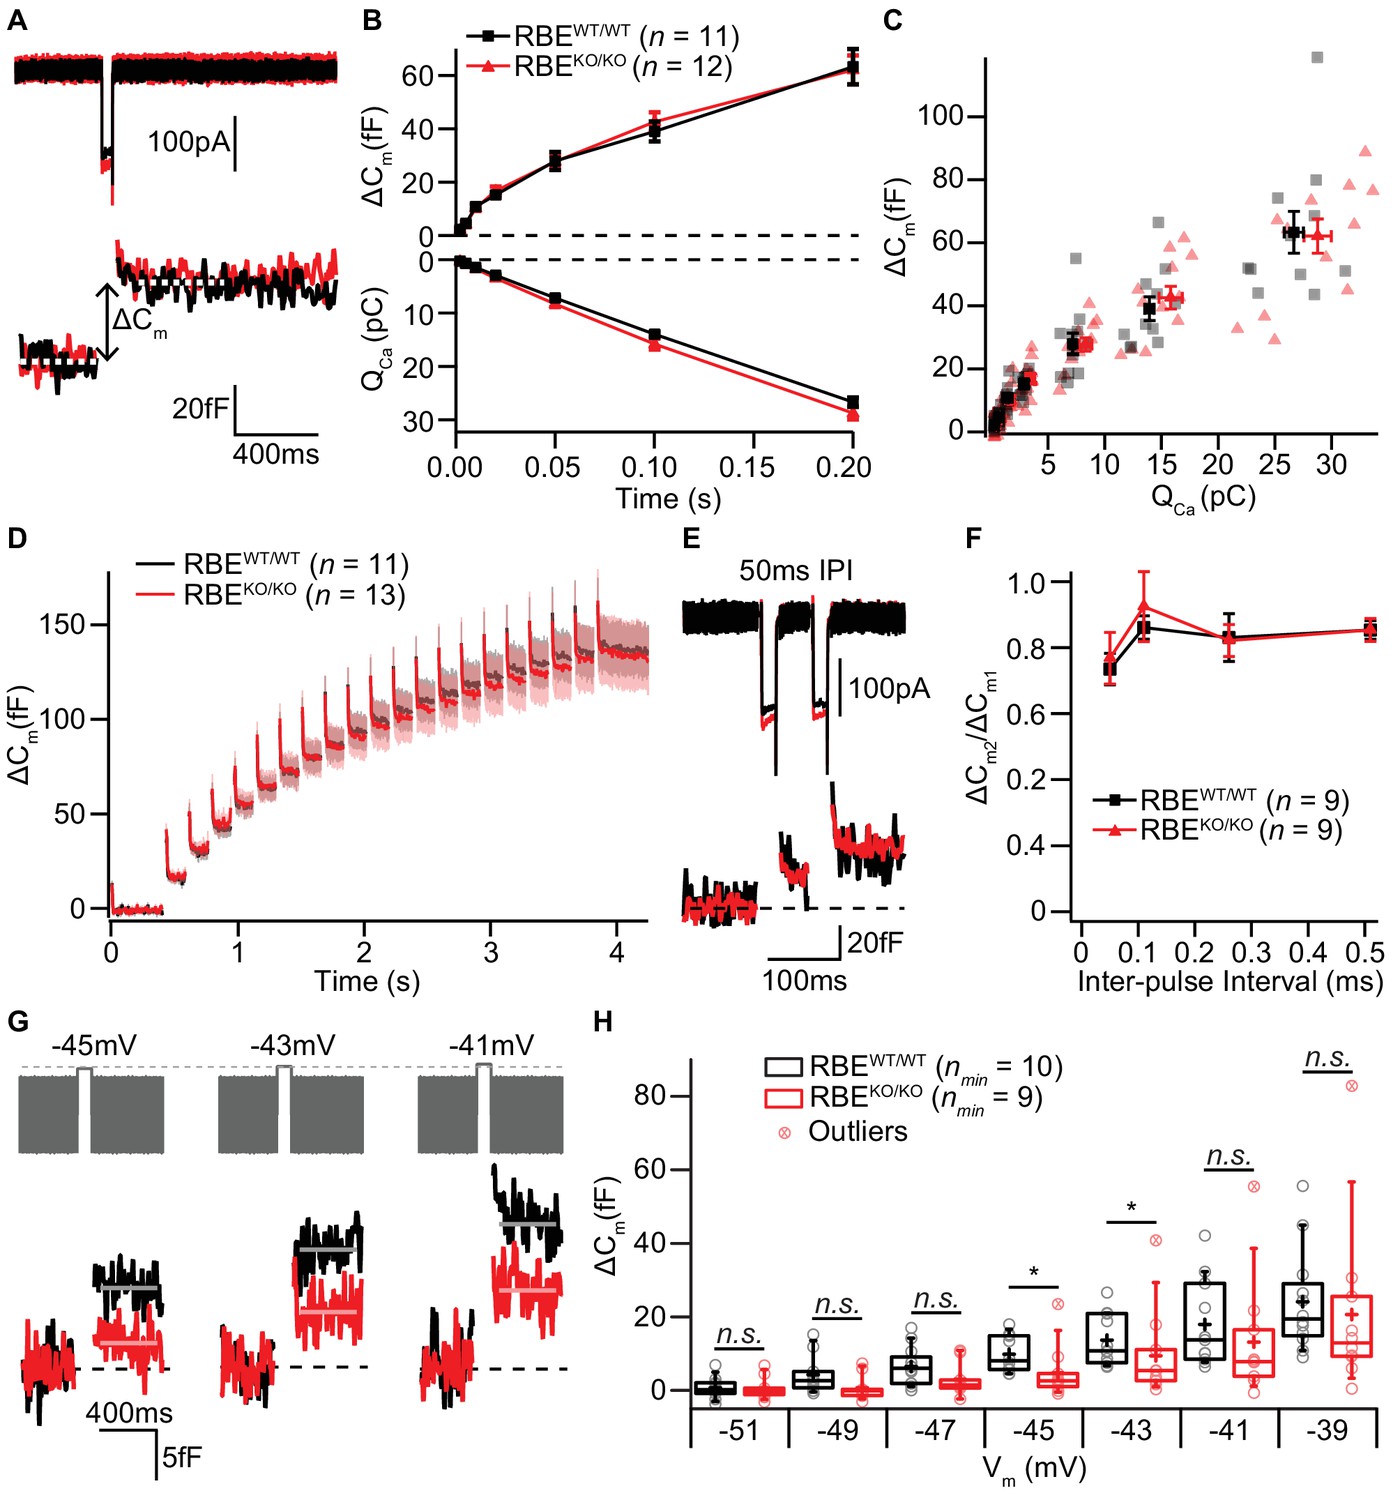
IHC exocytosis is normal for strong depolarizations but mildly reduced for weak ones.
(A) Representative Ca2+-currents (top) and corresponding low passed-filtered membrane capacitance (ΔCm) traces recorded from RBEWT/WT and RBEKO/KO IHCs upon 50 ms depolarizations from −69 to −14 mV. (B) Cumulative exocytosis (exocytic ΔCm, top) and corresponding Ca2+-charge (QCa, bottom) of RBEWT/WT (n = 11 cells, N = 8) and RBEKO/KO (n = 12 cells, N = 7) IHCs as a function of stimulus duration (2 to 200 ms to −14 mV) were unaltered in RBEKO/KO IHCs. Data is presented as mean ± S.E.M as for (F). (C) Relating ΔCm to the corresponding QCa indicated comparable Ca2+ efficiency of exocytosis between RBEWT/WT and RBEKO/KO IHCs. Mean ± S.E.M. for each pulse duration is presented in black and red; individual IHCs data points are overlaid. (D) Mean ΔCm traces (shaded areas: S.E.M.) in response to trains of 20 ms depolarizations from −87 to −17 mV (20 stimuli separated by 160 ms) of RBEWT/WT (n = 11 cells, N = 5) and RBEKO/KO (n = 13 cells, N = 8) IHCs show comparable exocytic ΔCm. (E) Representative low pass-filtered ΔCm traces in response to a pair of 20 ms pulses to −17 mV, separated by a 50 ms of inter-pulse interval (IPI). (F) Ratios of exocytosis (ΔCm2/ ΔCm1) to a pair of 20 ms pulses with varying inter-pulse intervals (50, 110, 260 and 510 ms) reveal a comparable recovery from RRP depletion between RBEWT/WT (n = 9 cells, N = 6) and RBEKO/KO IHCs (n = 9 cells, N = 6). (G) Representative low pass-filtered ΔCm traces in response to 100 ms step-depolarizations to −45, –43 and −41 mV. (H) Box plot and single values of ΔCm elicited by 100 ms step-depolarizations of RBEWT/WT (nmin = 10 cells, N = 8) and RBEKO/KO (nmin = 9 cells, N = 9) IHCs to different potentials. Exocytic ΔCm of RBEKO/KO IHCs was reduced for mild depolarizations (−45, –43 and −41 mV; p=0.0115, p=0.0295 and p=0.1321, respectively; p=0.0017, p=0.0042 and p=0.0489, without definitive outliers; Mann-Whitney-Wilcoxon test), but comparable to RBEWT/WT IHCs at stronger depolarizations (−39 mV; p=0.2030, Mann-Whitney-Wilcoxon test). Box plots show 10, 25, 50, 75 and 90th percentiles with the individual data points overlaid.
Figure 8 with 1 supplement
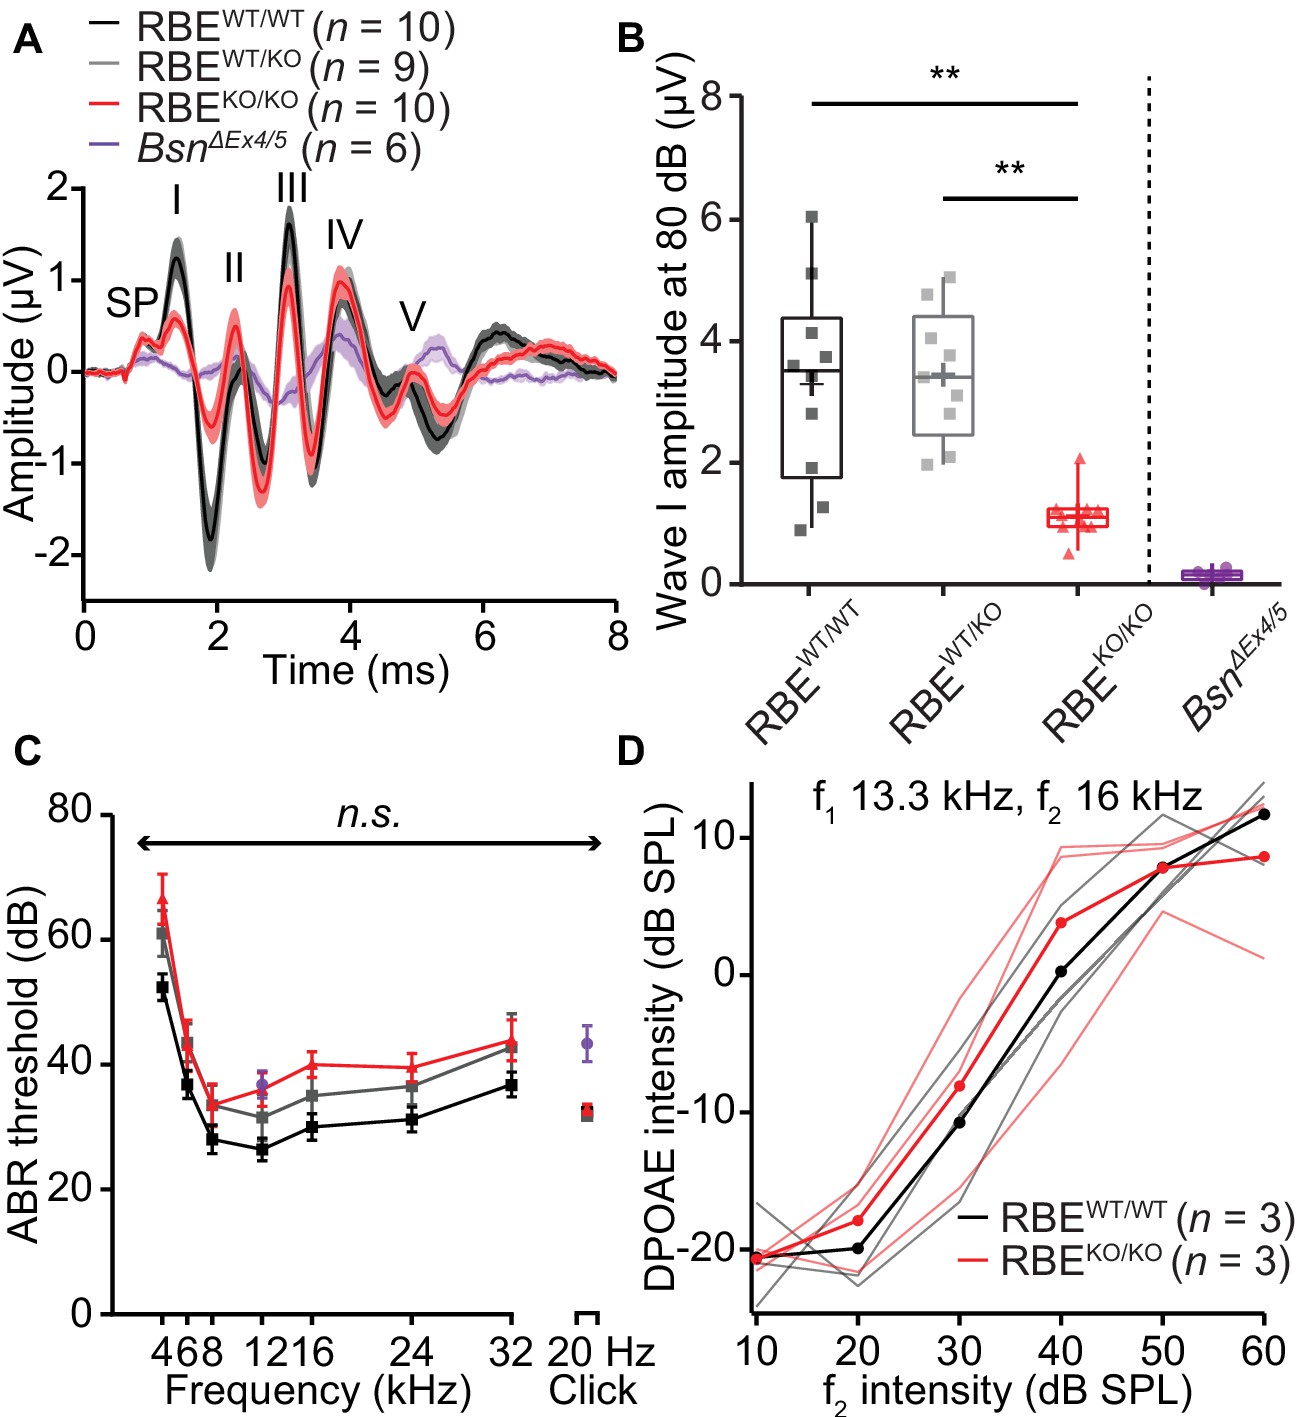
Auditory brainstem responses indicate impaired synchronous SGN activation in RBEKO/KO mice.
(A) Average ABR waveforms in response to 80 dB clicks (n = N = 10 for RBEKO/KO and RBEWT/WT, N = 9 for RBEWT/KO at 6 weeks of age) showed a reduced amplitude of ABR wave I in RBEKO/KO mice indicating an impairment of SGN activation, which is quantified in (B). This decrease was not as pronounced as in SGNs lacking bassoon (BsnΔEx4/5, data from Jing et al., 2013). The central ABR waves were better preserved, except for wave III. SP: summating potential (hair cell receptor potential), roman numerals (I–V): ABR waves generated along the early auditory pathway. Mean (lines) ± S.E.M. (shaded areas) are displayed. (B) ABR wave I was significantly reduced in RBEKO/KO mice as compared to RBEWT/WT and RBEWT/KO (p=0.0051 and p=0.0017, respectively, NPMC test). No statistical significance was observed between responses recorded in RBEWT/WT and RBEWT/KO mice (p>0.9999, NPMC test). Data from BsnΔEx4/5 are shown for comparison. Box plots show 10, 25, 50, 75 and 90th percentiles with the individual data points overlaid, means are shown as crosses. (C) ABR thresholds were comparable in RBEWT/WT, RBEWT/KO and RBEKO/KO for tone burst-driven (n.s., Tukey’s test) and click-driven ABRs (n.s., NPMC test). Previously published data for BsnΔEx4/5 showed elevated thresholds as a response to short stimuli (click 20 Hz) but a similar threshold level at 12 kHz. (D) DPOAE amplitude in response to pairs of simultaneous sine waves (f1 and f2, frequencies indicated on panel) at increasing stimulus intensity (f1 intensity 10 dB above f2 in all cases). Mean (thick lines) and data from individual mice (n = N = 3 in RBEWT/WT and RBEKO/KO) are displayed.
Figure 8—figure supplement 1
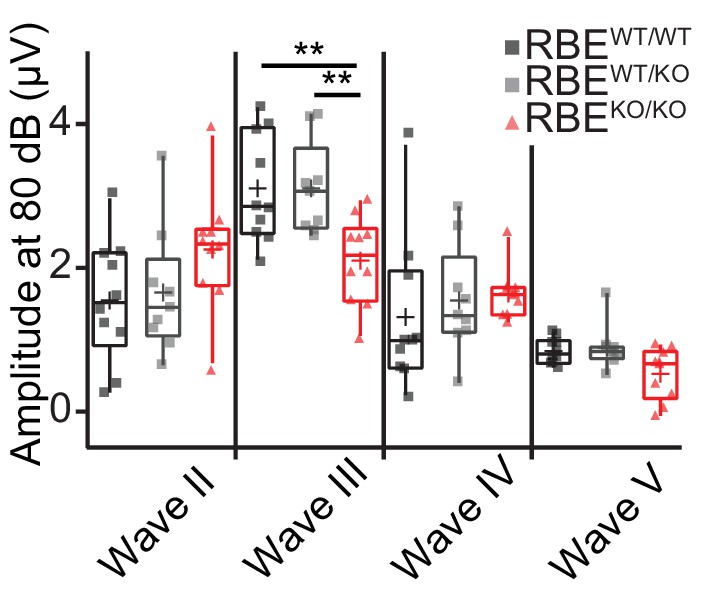
Quantification of ABR waves II-V amplitude in RBEKO/KO mice.
Mean ABR wave II-V amplitude in response to an 80 dB click in 6/8 week‐old mice. Responses were comparable in waves II, IV and V (Tukey’s test for comparison of the three groups regarding wave II and III, NPCM test for comparison of wave IV and V, n = N = 10 for RBEWT/WT and RBEKO/KO, n = N = 9 for RBEWT/KO), but significantly reduced in wave III in RBEKO/KO mice as compared to RBEWT/WT and RBEWT/KO (p=0.0093 and p=0.0075, respectively). Box plots show 10, 25, 50, 75 and 90th percentiles with individual data points overlaid and means are shown as crosses.
Figure 9
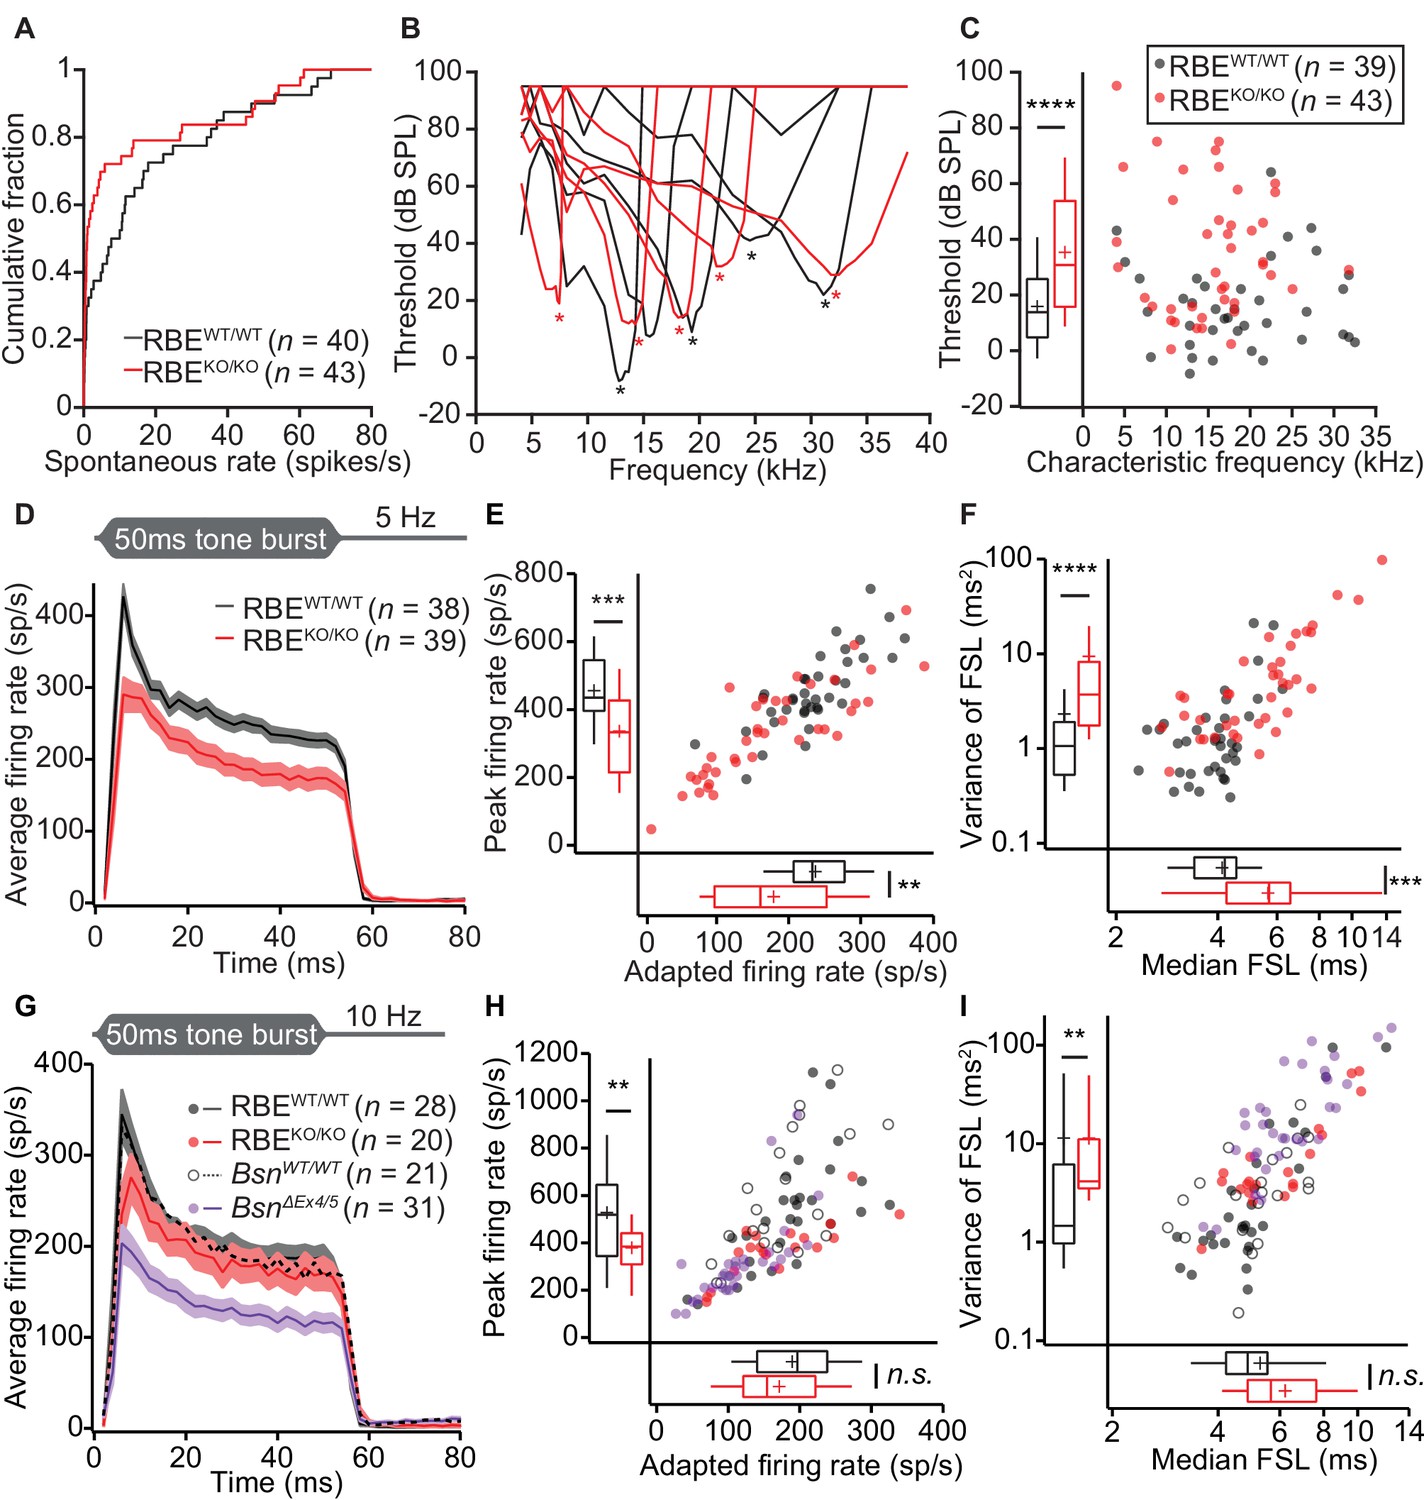
Impaired spontaneous and sound-evoked firing in putative SGNs of RBEKO/KO mice.
(A) Cumulative distribution functions of spontaneous firing rates of putative SGNs showed a higher fraction of low spontaneous rate SGNs in RBEKO/KO mice (n = 43 SGNs) than in RBEWT/WT mice (n = 40 SGNs, N = 8) (p=0.027, Kolmogorov-Smirnov test). (B) Representative frequency tuning curves of RBEKO/KO and RBEWT/WT SGNs showed comparable sharpness of tuning between SGNs of both genotypes. * point to the characteristic frequency (Cf) for which an increase in SGN firing requires the least sound pressure level. (C) Thresholds at Cf of RBEKO/KO SGNs (n = 43 SGNs, N = 9) were higher than those in RBEWT/WT mice (n = 39 SGNs, N = 9) (p<0.0001, Mann-Whitney-Wilcoxon test). Box plots show 10, 25, 50, 75 and 90th percentiles, means are shown as crosses, as for (E), (F), (H) and (I). (D) Average PSTH (bin width = 2 ms) of RBEKO/KO (n = 39 SGNs, N = 8) and RBEWT/WT SGNs (n = 38 SGNs, N = 9) recorded in response to 50 ms tone bursts at Cf 30 dB above threshold at a stimulus rate of 5 Hz. The time course of adaptation of RBEKO/KO SGNs (calculated by fitting a single exponential function to the individual histograms) was significantly longer (p=0.033, Mann-Whitney-Wilcoxon test). Mean (line) ± S.E.M. (shaded areas) are displayed as for (G). (E) Scatterplot of peak firing rate (bin with highest rate at sound onset) and adapted firing rate (averaged 35–45 ms from response onset) revealed lower firing rates in RBEKO/KO (n = 39 SGNs) as compared to RBEWT/WT (n = 38 SGNs, N = 9) mice (data from (D), peak rate: p=0.0001, adapted rate: p=0.0023, Mann-Whitney-Wilcoxon test). (F) Increased latency (data from (D), p=0.0002) and variance of latency (p<0.0001, Mann-Whitney-Wilcoxon test) of the first spike after sound onset in RBEKO/KO SGNs indicated lower temporal precision of sound onset coding. (G) Average PSTH (bin width = 2 ms) of RBEKO/KO (n = 20 SGNs, N = 6) and RBEWT/WT SGNs (n = 28 SGNs, N = 8) were recorded in response to 50 ms tone bursts at Cf 30 dB above threshold at a stimulus rate of 10 Hz and showed a similar adapted response in RBEKO/KO as compared to lower stimulation rates (Figures 9,11) but still a lower onset response than in RBEWT/WT SGNs. Responses in BsnΔEx4/5 mutants (shown for comparison, re-plotted from Jing et al., 2013) were considerably lower. (H) Scatterplot of peak firing rate (bin with highest rate at sound onset) and adapted firing rate (averaged 35–45 ms from response onset) show decreased onset firing rates in RBEKO/KO as compared to RBEWT/WT mice (data from (G), p=0.0093, Mann-Whitney-Wilcoxon test). The adapted response was comparable in both cases (p=0.3584, t-test). Data points from BsnΔEx4/5 mutants (re-plotted from Jing et al., 2013) and WT littermates are shown for comparison, also in (I). (I) Increased variance of first spike latency after sound onset in RBEKO/KO SGNs (p=0.0089, Mann-Whitney-Wilcoxon test) and comparable latencies were observed at this stimulation frequency (data from (G), p=0.0761, Mann-Whitney-Wilcoxon test).
Figure 10

Responses to pure tones in cochlear nucleus cells showed that the mutant phenotype is partially compensated in higher stations of the auditory pathway.
(A) Quantification of peak and adapted responses to 50 ms tone burst stimulation, 30 dB above threshold at Cf in SGNs displaying a chopper discharge pattern (periodically alternating phases of high firing rates with low firing rates, typical of multipolar cells in the posterior ventral cochlear nucleus), showed that the differences in rate faded away opposite to those shown at the level of the auditory nerve. Peak rates were still significantly lower in RBEKO/KO (n = 29 SGNs, N = 9) as compared to RBEWT/WT (n = 16 SGNs, N = 9) mice (p=0.0303, Mann-Whitney-Wilcoxon test), while the adapted rate showed a non-significant trend towards reduction in RBEKO/KO (p=0.0538, t-test). Box plots show 10, 25, 50, 75 and 90th percentiles and means are shown as crosses, as for (B). (B) Same recordings paradigm as (A) performed in a fiber with bushy cell discharge pattern (similar to the one found in SGNs, typical also in this type of cochlear nucleus neurons) showed comparable responses in both peak (p=0.2601, Mann-Whitney-Wilcoxon test) and adapted rate (p=0.0510, Mann-Whitney-Wilcoxon test) in RBEKO/KO (n = 19 SGNs, N = 7) and RBEWT/WT (n = 28 SGNs, N = 10).
Figure 11 with 1 supplement
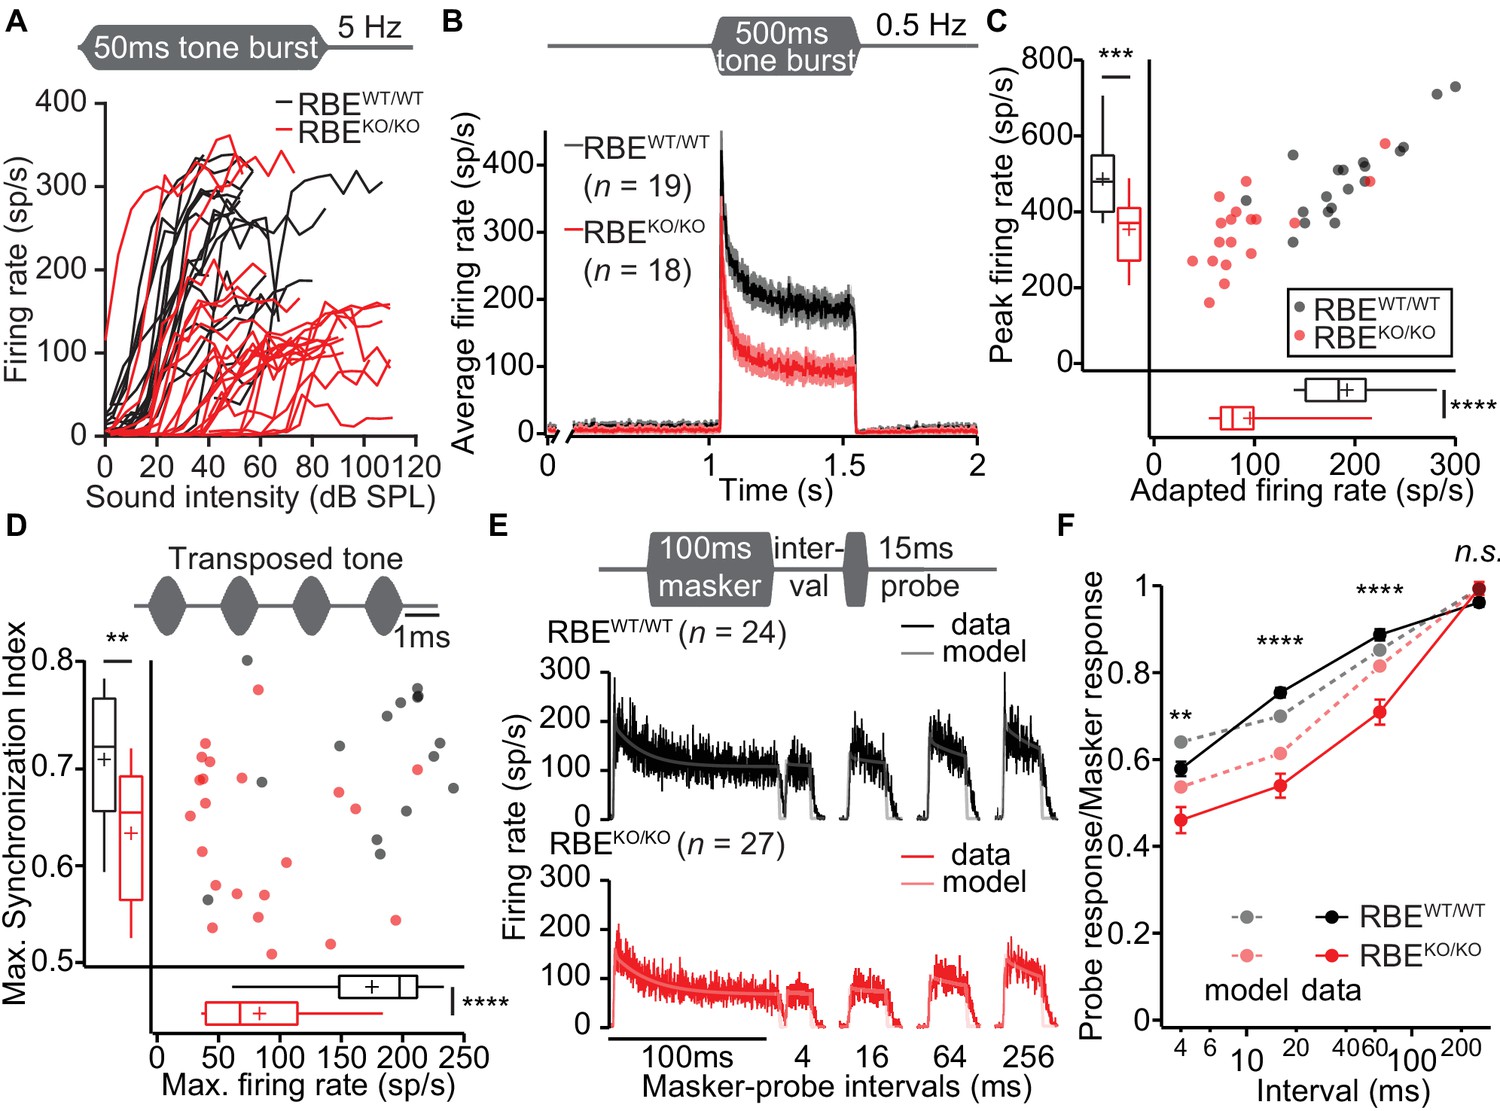
Lack of ribbons impairs vesicle replenishment in RBEKO/KO mice.
(A) Intensity coding was largely preserved for suprathreshold sound stimulation: rate-level functions (average increase in spike rate with stimulus intensity) of SGNs in response to 50 ms tone bursts at Cf at 5 Hz corroborated the notion of increased sound threshold but were otherwise comparable in RBEKO/KO (n = 24 SGNs, N = 8) and RBEWT/WT (n = 19 SGNs, N = 7) mice, for quantification see Figure 11—figure supplement 1C. (B) Average PSTH recorded in response to 50 × 500 ms tone bursts at Cf and 30 dB above threshold at a stimulus rate of 0.5 Hz (bin width = 2 ms): the onset response to this stimulus was preserved better in RBEKO/KO SGNs (n = 18 SGNs, N = 7) as compared to higher stimulation rates (Figure 9), but it was still lower than in RBEWT/WT SGNs (n = 19 SGNs, N = 7), as well as the adapted firing rate. Mean (line) ± S.E.M. (shaded areas) are displayed. (C) Scatterplot of peak (highest 2 ms bin) and adapted (averaged 405–415 ms from response onset) firing rates: significantly reduced peak (p=0.0005, t-test) and adapted (p<0.0001, Mann-Whitney-Wilcoxon test) rates in RBEKO/KO SGNs. Box plots show 10, 25, 50, 75 and 90th percentiles and means are shown as crosses, as for (D). (D) Temporal precision and reliability of sound coding is impaired in RBEKO/KO SGNs. Synchronization of firing to stimulus and firing rates (reflecting spike probability) were reduced when probed with amplitude-modulated (transposed) tones (continuous stimulation with a carrier frequency at Cf and at a modulation frequency of 500 Hz) (p=0.0043, t-test, for synchronization index, and p<0.0001, t-test, for firing rate, when comparing RBEKO/KO (n = 22 SGNs, N = 7) and RBEWT/WT (n = 15 SGNs, N = 6) SGNs). (E) Forward masking experiments were used to study presynaptic SV dynamics: a stimulus complex consisting of a 100 ms masker stimulus, a silent interval of 4/16/64/256 ms and a 15 ms probe (both at the characteristic frequency, 30 dB above threshold) was presented at 2 Hz. The averaged data after alignment of RBEWT/WT (n = 24 SGNs, N = 7, black) and RBEKO/KO (n = 27 SGNs, N = 8, red) SGNs responses are displayed as described in Materials and methods. On top of the data we present a fit of a biophysical model (light gray and pink lines) to the data used to study the SV dynamics at the AZ. The refilling and fusion rate constant during spontaneous and stimulated conditions as well as the number of occupied release sites are provided in Table 2. (F) Recovery of onset response showed as ratio of probe and masker response (number of spikes during first 10 ms, mean ± S.E.M), and prediction (dashed lines) derived from the model fit shown in (E). Recovery was slower in RBEKO/KO SGNs (n = 27 SGNs, N = 8) as compared to RBEWT/WT (n = 24 SGNs, N = 7) with significant differences in the ratio after 4 ms (p=0.0019, t-test), 16 ms (p<0.0001, Mann-Whitney-Wilcoxon test), and 64 ms masker-probe intervals (p<0.0001, Mann-Whitney-Wilcoxon test), but not after 256 ms (p=0.0835, t-test).
Figure 11—figure supplement 1
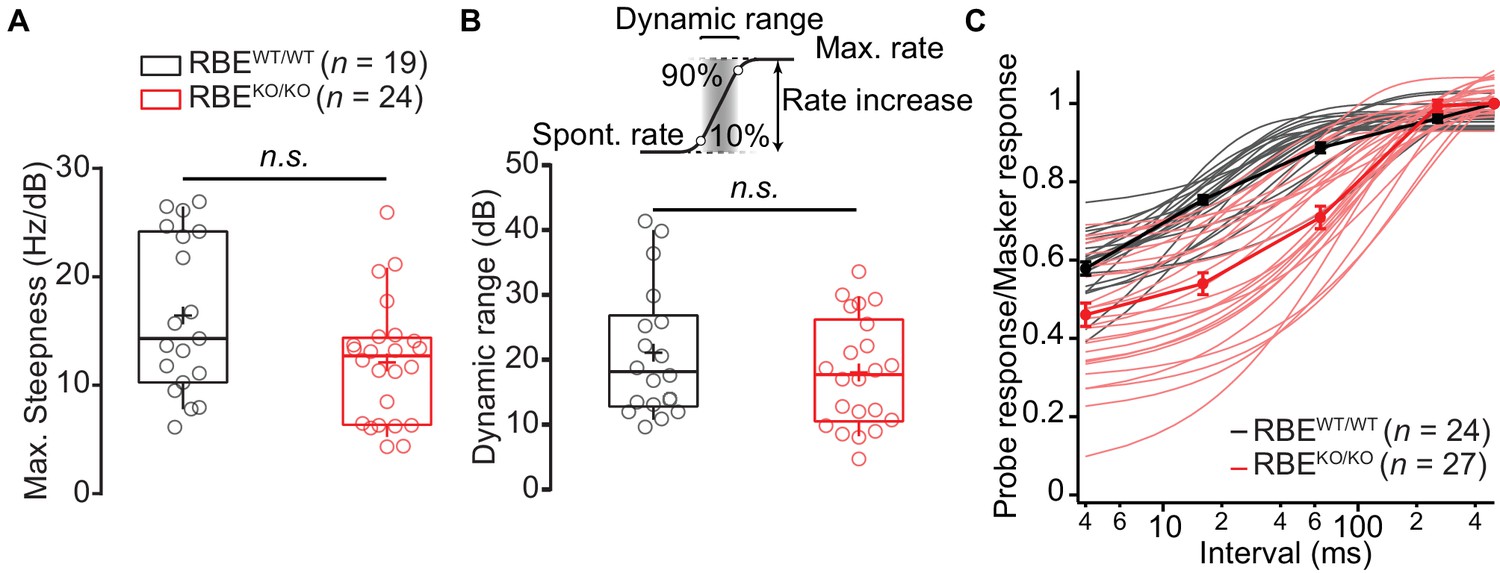
Rate-level functions and dynamic range remained unchanged in RBEKO/KO.
(A) Maximal steepness of the rate-level functions (average increase of spike rate with sound intensity) were comparable in RBEKO/KO (n = 24 SGNs, N = 8) and RBEWT/WT (n = 19 SGNs, N = 7) (p=0.0679, Mann-Whitney-Wilcoxon test). Box plots show 10, 25, 50, 75 and 90th percentiles and means are shown as crosses, as for (B). (B) Dynamic range is defined as the range of sound intensity levels in which the rate–level function shows a spike rate increase between 10% and 90% of the difference between spontaneous and maximal rate. The absence of ribbon in RBEKO/KO did not affect this estimate significantly (p=0.3044, t-test). (C) Ratio of probe and masker onset response (number of spikes during first 10 ms, mean ± S.E.M.) and single exponential fits to individual units (RBEKO/KO, n = 27 SGNs, N = 8, pink and RBEWT/WT, n = 24 SGNs, N = 7, gray) showed a slower recovery in RBEKO/KO with a significantly lower time constant (p<0.0001, Mann-Whitney-Wilcoxon test).
Tables
Table 1
Average double-exponential fitting results to peristimulus time histograms obtained by 50 ms tone bursts 30 dB above threshold at Cf (200 ms inter-stimulus interval).
https://doi.org/10.7554/eLife.29275.018| Fast time constant | Slow time constant | Amplitude fast component | Amplitude slow component | R | |
|---|---|---|---|---|---|
| RBEWT/WT | 6.31 ± 0.77 | 95.63 ± 24.21 | 484.61 ± 104.76 | 58.42 ± 12.90 | 0.93 ± 0.00 |
| RBEKO/KO | 18.79 ± 6.91 | 101.66 ± 27.77 | 310.56 ± 73.60 | 64.92 ± 107.49 | 0.91 ± 0.01 |
| p-value | 0.0045 | 0.3580 | 0.0519 | 0.5475 | 0.2041 |
Table 2
Parameters for the biophysical model capturing the release dynamics during forward-masking and repetitive tone burst experiments
https://doi.org/10.7554/eLife.29275.021| Forward masking | All tone bursts – global fit | |||
|---|---|---|---|---|
| RBEWT/WT | RBEKO/KO | RBEWT/WT | RBEKO/KO | |
| Nslots | 8 | 6.5 | 15.6 | 13.7 |
| krefill, stim | 29.5 | 18.2 | 18.4 | 19.9 |
| krefill, spont | 13.3 | 7.1 | 5.59 | 2.71 |
| kfusion, stim | 32.2 | 31 | 82.5 | 45.1 |
| kfusion, spont | 0.6 | 0.9 | 0.63 | 0.54 |
Key resources table
| Reagent type (species) or resource | Designation | Source or reference | Identifiers | Additional information |
|---|---|---|---|---|
| Strain, strain background (Mus musculus) | Constitutive RIBEYE knockout, C57BL/6 background | PMID: 26929012 | ||
| Antibody | CtBP2 (mouse monoclonal) | BD Biosciences | 612044 | 1:200 |
| Antibody | PSD-95 (mouse monoclonal) | Sigma Aldrich | P246-100ul | 1:200 |
| Antibody | Bassoon SAP7f407 (mouse monoclonal) | Abcam | ab82958 | 1:200 |
| Antibody | Bassoon (guinea pig polyclonal) | Synaptic Systems | 141 004 | 1:500 |
| Antibody | RIM2 (rabbit polyclonal) | Synaptic Systems | 140 103 | 1:100 |
| Antibody | Cav1.3 (rabbit polyclonal) | Alomone Labs | ACC 005 | 1:75 or 1:100 |
| Antibody | Piccolino (rabbit polyclonal) | Regus-Leidig et al. (2013) | 1:500 | |
| Antibody | Parvalbumin α (guinea pig polyclonal) | Synaptic Systems | 195 004 | 1:1000 |
| Antibody | Calbindin 28 k (mouse monoclonal) | Swant | 07(F) | 1:500 |
| Antibody | Calretinin (rabbit polyclonal) | Swant | 1893–0114 | 1:1000 |
| Antibody | Alexa Fluor 488 conjugated anti-rabbit (goat polyclonal) | Invitrogen | A11008 | 1:200 |
| Antibody | Alexa Fluor 488 conjugated anti-guinea-pig (goat polyclonal) | Invitrogen | A11004 | 1:200 |
| Antibody | Alexa Fluor 568 conjugated anti-mouse (goat polyclonal) | Invitrogen | A11073 | 1:200 |
| Antibody | Alexa Fluor 647 conjugated anti-rabbit (donkey polyclonal) | Invitrogen | A31573 | 1:200 |
| Antibody | STAR580 conjugated anti-mouse (goat polyclonal) | Abberior | 2-0002-005-1 | 1:200 |
| Antibody | STAR580 conjugated anti-rabbit (goat polyclonal) | Abberior | 2-0012-005-8 | 1:200 |
| Antibody | STAR635p conjugated anti-mouse (goat polyclonal) | Abberior | 2-0002-007-5 | 1:200 |
| Antibody | STAR635p conjugated anti-rabbit (goat polyclonal) | Abberior | 2-0012-007-2 | 1:200 |
| Software, algorithm | Patchmaster or Pulse | http://www.heka.com/products/products_main.html#soft_pm | RRID:SCR_000034 | |
| Software, algorithm | IGOR Pro | http://www.wavemetrics.com/products/igorpro/igorpro.htm | RRID:SCR_000325 | |
| Software, algorithm | Patchers Power Tools | http://www3.mpibpc.mpg.de/groups/neher/index.php?page=software | RRID:SCR_001950 | |
| Software, algorithm | MATLAB | http://www.mathworks.com/products/matlab/ | RRID:SCR_001622 | |
| Software, algorithm | Gatan Microscopy Suite | http://www.gatan.com/products/tem-analysis/gatan-microscopy-suite-software | RRID:SCR_014492 | DigitalMicrograph scripting |
| Software, algorithm | Reconstruct | PMID: 15817063 | ||
| Software, algorithm | Serial-EM | PMID: 16182563 | ||
| Software, algorithm | 3dmod | PMID: 8742726 | ||
| Software, algorithm | IMOD | http://bio3d.colorado.edu/imod | RRID:SCR_003297 | |
| Software, algorithm | Genetic fit algorithm | Sanchez del Rio and Pareschi, 2001 | doi: 10.1117/12.411624 | |
| Software, algorithm | Fiji | http://fiji.sc | RRID:SCR_002285 | |
| Software, algorithm | ImageJ | https://imagej.nih.gov/ij/ | RRID:SCR_003070 | |
| Software, algorithm | Imaris | http://www.bitplane.com/imaris/imaris | RRID:SCR_007370 | |
| Software, algorithm | Excel | microsoft.com/mac/excel | ||
| Software, algorithm | Origin | http://www.originlab.com/index.aspx?go=PRODUCTS/Origin | RRID:SCR_014212 | |
| Software, algorithm | GraphPad Prism | https://www.graphpad.com/scientific-software/prism/ | RRID:SCR_015807 | |
| Software, algorithm | Java Statistical Classes library | Bertie, 2002 |
Additional files
-
Source code 1
Matlab scripts for the waveform-based spike detection.
- https://doi.org/10.7554/eLife.29275.022
-
Source code 2
Live calcium imaging analysis.
- https://doi.org/10.7554/eLife.29275.023
-
Source Code 3
Routines for the analysis of whole-cell capacitance measurements
- https://doi.org/10.7554/eLife.29275.024
-
Source Code 4
Matlab scripts for the count andintensity of immunofluorescent spots.
- https://doi.org/10.7554/eLife.29275.025
-
Source code 5
Java routine for the SV diameter quantifications in random sections
- https://doi.org/10.7554/eLife.29275.026
-
Supplementary file 1
Modified tomogram analysis.
The table depicts the modified tomogram analysis performed according to Jung et al., 2015a displaying the mean ± (S.E.M.), (S.D.), p-values, sample size and statistical tests used to compare RBEWT/WT and RBEKO/KO. Refer to Figure 3—figure supplement 1 for the graphs.
- https://doi.org/10.7554/eLife.29275.027
-
Supplementary file 2
Passive electrical properties of patch-clamp recording experiments.The table shows the mean ± (S.E.M.) of the passive electrical properties across all ruptured and perforated patch-clamp recording experiments in RBEWT/WT and RBEKO/KO conditions.
- https://doi.org/10.7554/eLife.29275.028
-
Transparent reporting form
- https://doi.org/10.7554/eLife.29275.029
Download links
A two-part list of links to download the article, or parts of the article, in various formats.
Downloads (link to download the article as PDF)
Open citations (links to open the citations from this article in various online reference manager services)
Cite this article (links to download the citations from this article in formats compatible with various reference manager tools)
The synaptic ribbon is critical for sound encoding at high rates and with temporal precision
eLife 7:e29275.
https://doi.org/10.7554/eLife.29275


