Effects of water, sanitation, handwashing, and nutritional interventions on telomere length among children in a cluster-randomized controlled trial in rural Bangladesh
- University of California, Berkeley, United States
- University of California, San Francisco, United States
- International Centre for Diarrhoeal Disease Research, Bangladesh
- University of California, Davis, United States
- Miller School of Medicine, University of Miami, United States
- Stanford University, United States
Figures
Figure 1
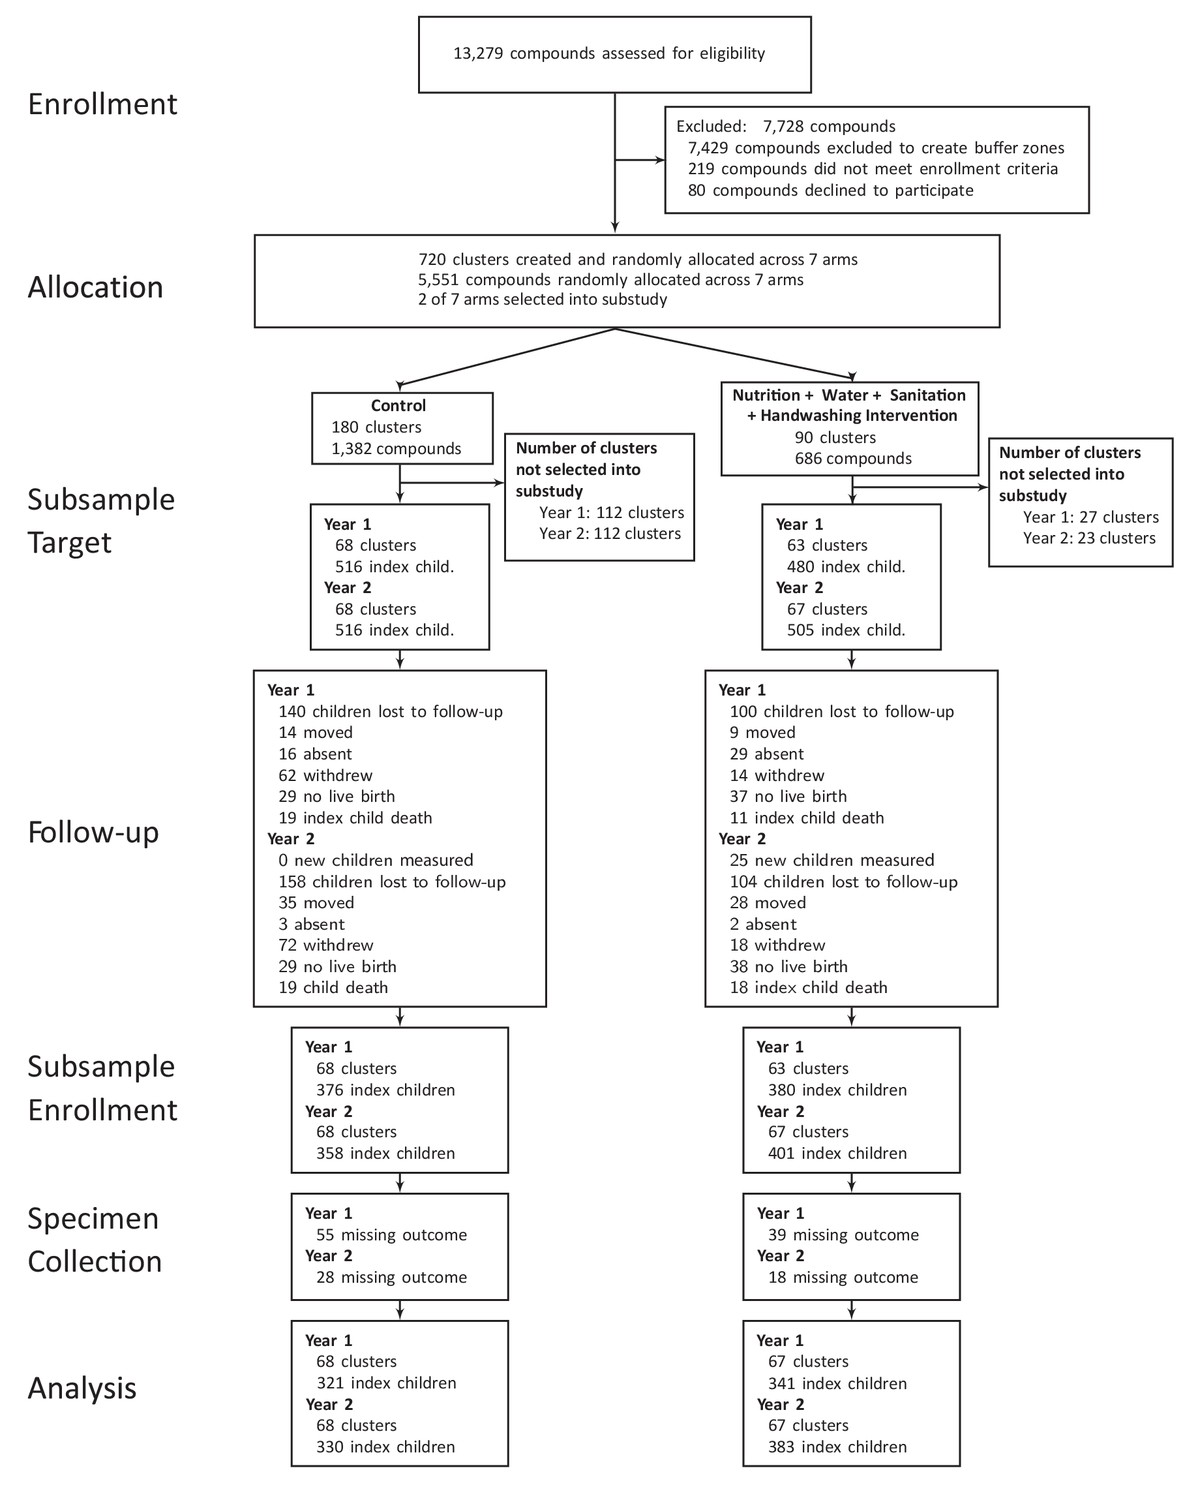
Flowchart of participants’ progress through the phases of the trial.
https://doi.org/10.7554/eLife.29365.003-
Figure 1—source data 1
Source data and code for Figure 1.
- https://doi.org/10.7554/eLife.29365.004
Figure 2
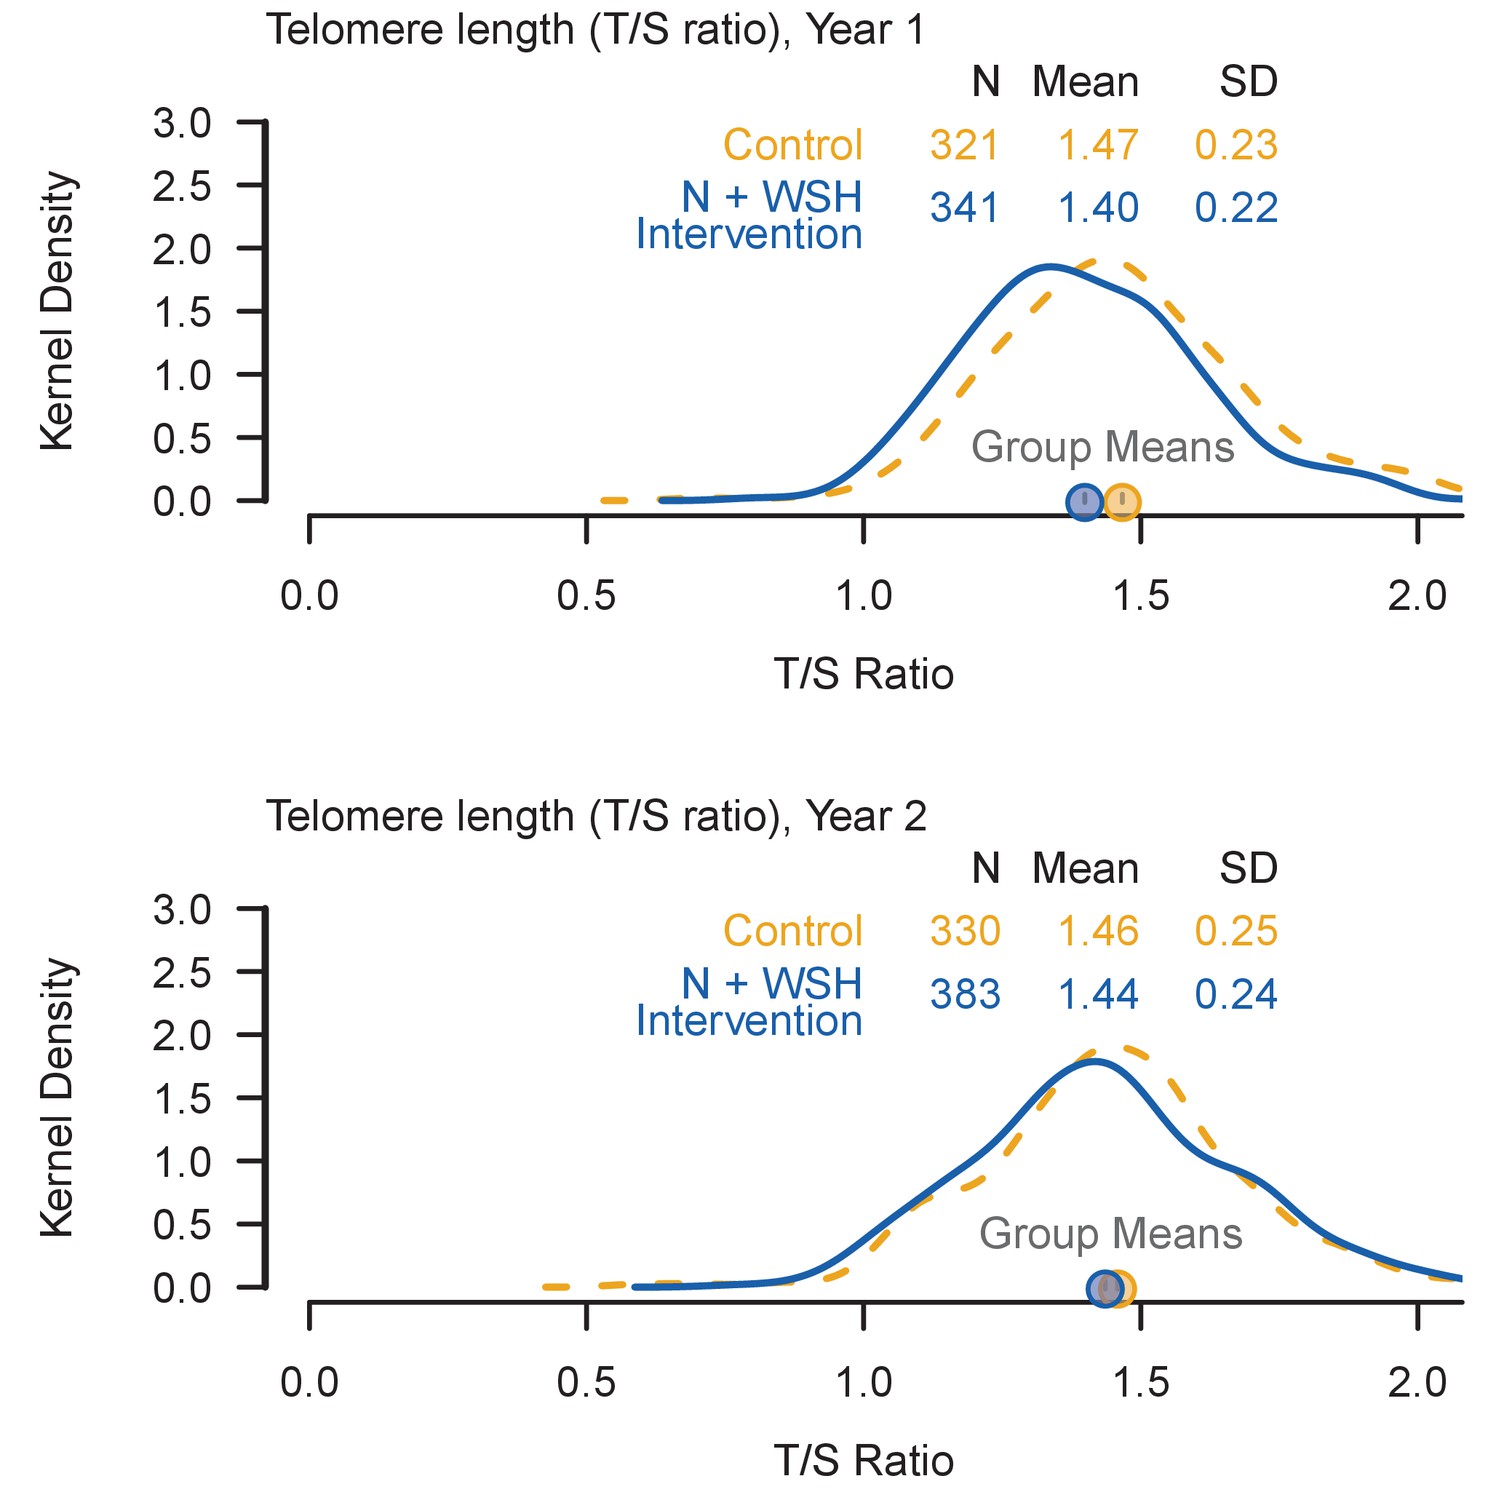
Kernel density plots summarize the distribution of the telomere lengths (T/S ratios) among enrolled children.
In each panel, a dashed orange line illustrates the distribution of T/S ratio among control children and a solid blue line illustrates the distribution of T/S ratio among N+WSH intervention children. Even if a child was not present at Year 1, they were included in the analysis if they provided a sample at Year 2.
-
Figure 2—source data 1
Source data and code for Figure 2.
- https://doi.org/10.7554/eLife.29365.010
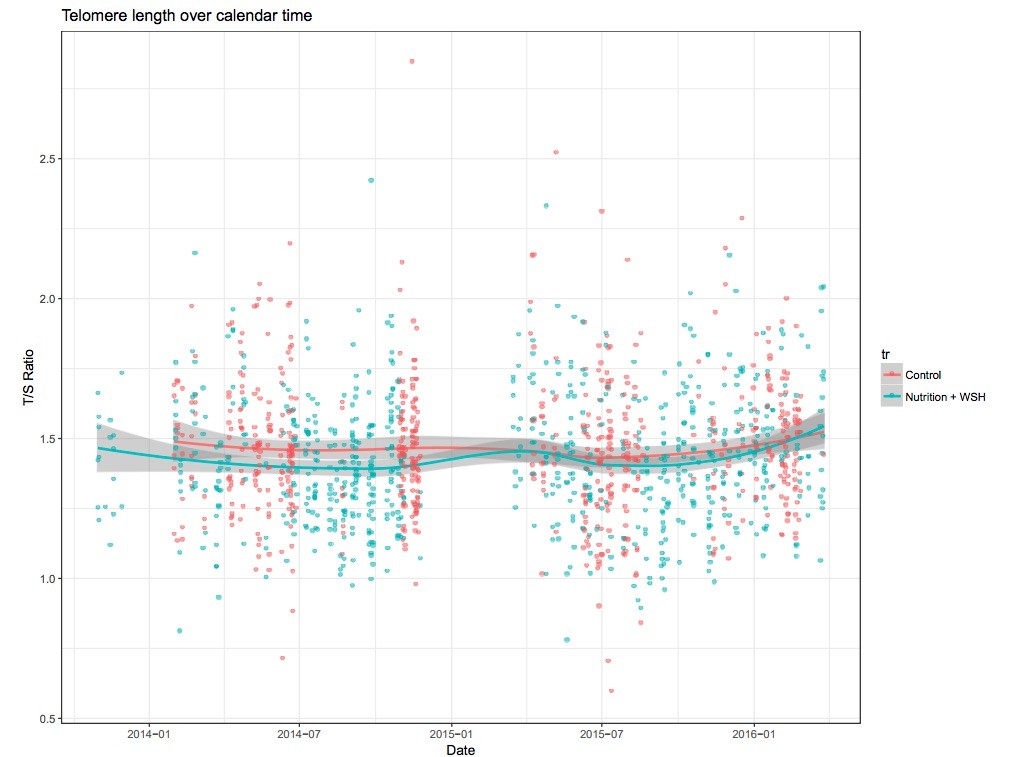
Author response image 1
Tables
Table 1
Enrollment characteristics within the Control households and the N + WSH intervention households
https://doi.org/10.7554/eLife.29365.005| Children measured at Year 1 | Children measured at Year 2 | |||
|---|---|---|---|---|
| No. of children: | Control (N=321) | N+WSH Intervention (N=338) | Control (N=330) | N+WSH Intervention (N=380) |
| % / mean (SD) | % / mean (SD) | % / mean (SD) | % / mean (SD) | |
| Maternal | ||||
| Age (years) | 23 (5) | 24 (5) | 23 (5) | 24 (5) |
| Years of education | 7 (3) | 6 (3) | 7 (3) | 6 (3) |
| Paternal | ||||
| Years of education | 5 (4) | 5 (4) | 6 (4) | 5 (4) |
| Works in agriculture | 24% | 29% | 25% | 29% |
| Household | ||||
| Number of persons | 5 (2) | 5 (2) | 5 (2) | 5 (2) |
| Has electricity | 60% | 62% | 62% | 62% |
| Has a cement floor | 16% | 12% | 15% | 13% |
| Acres of agricultural land owned | 0 (0) | 0 (0) | 0 (0) | 0 (0) |
| Drinking Water | ||||
| Shallow tubewell primary water source | 72% | 70% | 72% | 72% |
| Stored water observed at home | 49% | 53% | 49% | 52% |
| Reported treating water yesterday | 0% | 0% | 0% | 0% |
| Distance (mins) to primary water source | 1 (1) | 1 (2) | 1 (1) | 1 (2) |
| Sanitation | ||||
| Reported daily open defecation | ||||
| Adult men | 4% | 9% | 4% | 9% |
| Adult women | 3% | 5% | 3% | 5% |
| Children: 8-<15 years | 4% | 11% | 2% | 11% |
| Children: 3-<8 years | 29% | 35% | 32% | 37% |
| Children: 0-<3 years | 73% | 88% | 73% | 88% |
| Latrine | ||||
| Owned | 62% | 52% | 59% | 52% |
| Concrete slab | 97% | 93% | 96% | 94% |
| Functional water seal | 38% | 31% | 38% | 31% |
| Visible stool on slab or floor | 54% | 48% | 52% | 46% |
| Owned a potty | 8% | 4% | 7% | 5% |
| Human feces observed in the | ||||
| House | 6% | 7% | 5% | 9% |
| Child’s play area | 1% | 1% | 1% | 2% |
| Handwashing | ||||
| Within 6 steps of latrine | ||||
| Has water | 18% | 13% | 21% | 14% |
| Has soap | 9% | 6% | 11% | 7% |
| Within 6 steps of kitchen | ||||
| Has water | 11% | 10% | 11% | 11% |
| Has soap | 3% | 3% | 5% | 4% |
| Nutrition | ||||
| *Household is food secure | 74% | 72% | 73% | 72% |
-
Enrollment characteristics of households with children who had telomere measurements. Data are percentages of binary variables or mean (SD) of continuous variables. Percentages were estimated from slightly smaller denominators than those shown at the top of the table for the following variables due to missing values: mother’s age, father’s education, father works in agriculture, acres of land owned, open defecation, latrine has a concrete slab, latrine has a functional water seal, visible stool on latrine slab or floor, ownership of child potty, observed feces in the house or child’s play area, handwashing variables.
*Assessed by the Household Food Insecurity Access Scale
-
Table 1—source data 1
Source data and code for Table 1.
- https://doi.org/10.7554/eLife.29365.006
Table 2
Balance of enrollment characteristics in the WASH Benefits main trial, telomere substudy children enrolled at Year 1, and telomere substudy children lost to follow-up at Year 2
https://doi.org/10.7554/eLife.29365.007| WASH Benefits Main Trial | Telomere substudy: Had telomere outcomes at Year 1 | Telomere substudy: Lost to follow-up at Year 2 (from those who had telomere outcomes at Year 1) | ||||
|---|---|---|---|---|---|---|
| No. of children: | Control (N=1779) | N+WSH Intervention (N=953) | Control (N=321) | Control (N=338) | N+WSH Intervention (N=61) | N+WSH Intervention (N=44) |
| % / mean (SD) | % / mean (SD) | % / mean (SD) | % / mean (SD) | % / mean (SD) | % / mean (SD) | |
| Maternal | ||||||
| Age (years) | 24 (5) | 24 (6) | 23 (5) | 24 (5) | 23 (4) | 23 (5) |
| Years of education | 6 (3) | 6 (3) | 7 (3) | 6 (3) | 7 (3) | 6 (4) |
| Paternal | ||||||
| Years of education | 5 (4) | 5 (4) | 5 (4) | 5 (4) | 5 (4) | 5 (4) |
| Works in agriculture | 30% | 30% | 24% | 29% | 20% | 18% |
| Household | ||||||
| Number of persons | 5 (2) | 5 (2) | 5 (2) | 5 (2) | 5 (3) | 5 (2) |
| Has electricity | 57% | 60% | 60% | 62% | 57% | 61% |
| Has a cement floor | 10% | 10% | 16% | 12% | 20% | 7% |
| Acres of agricultural land owned | 0.15 (0.21) | 0.14 (0.38) | 0 (0) | 0 (0) | 0 (0) | 0 (0) |
| Drinking Water | ||||||
| Shallow tubewell primary water source | 75% | 73% | 72% | 70% | 77% | 66% |
| Stored water observed at home | 48% | 48% | 49% | 53% | 56% | 57% |
| Reported treating water yesterday | 0% | 0% | 0% | 0% | 0% | 0% |
| Distance (mins) to primary water source | 1 (1) | 1 (2) | 1 (1) | 1 (2) | 1 (1) | 1 (1) |
| Sanitation | ||||||
| Reported daily open defecation | ||||||
| Adult men | 7% | 7% | 4% | 9% | 3% | 7% |
| Adult women | 4% | 4% | 3% | 5% | 2% | 2% |
| Children: 8-<15 years | 10% | 10% | 4% | 11% | 8% | 13% |
| Children: 3-<8 years | 38% | 37% | 29% | 35% | 30% | 32% |
| Children: 0-<3 years | 82% | 88% | 73% | 88% | 73% | 83% |
| Latrine | ||||||
| Owned | 54% | 53% | 62% | 52% | 67% | 50% |
| Concrete slab | 95% | 94% | 97% | 93% | 100% | 98% |
| Functional water seal | 31% | 27% | 38% | 31% | 46% | 38% |
| Visible stool on slab or floor | 48% | 46% | 54% | 48% | 64% | 53% |
| Owned a potty | 4% | 4% | 8% | 4% | 16% | 2% |
| Human feces observed in the | ||||||
| House | 8% | 7% | 6% | 7% | 10% | 5% |
| Child’s play area | 2% | 1% | 1% | 1% | 2% | 0% |
| Handwashing | ||||||
| Within 6 steps of latrine | ||||||
| Has water | 14% | 11% | 18% | 13% | 18% | 8% |
| Has soap | 7% | 6% | 9% | 6% | 11% | 8% |
| Within 6 steps of kitchen | ||||||
| Has water | 9% | 9% | 11% | 10% | 9% | 5% |
| Has soap | 3% | 3% | 3% | 3% | 0% | 0% |
| Nutrition | ||||||
| *Household is food secure | 67% | 71% | 74% | 72% | 75% | 68% |
-
Data are percentages of binary variables or mean (SD) of continuous variables. Percentages were estimated from slightly smaller denominators than those shown at the top of the table for the following variables due to missing values: mother’s age, father’s education, father works in agriculture, acres of land owned, open defecation, latrine has a concrete slab, latrine has a functional water seal, visible stool on latrine slab or floor, ownership of child potty, observed feces in the house or child’s play area, handwashing variables.
*Assessed by the Household Food Insecurity Access Scale
-
Table 2—source data 1
Source data and code for Table 2.
- https://doi.org/10.7554/eLife.29365.008
Table 3
Effect of intervention on telomere length (T/S ratio) after 1 and 2 years of N + WSH intervention and on change in telomere length between Year 1 and Year 2.
https://doi.org/10.7554/eLife.29365.011| Arm | N | Mean | Unadjusted difference: Intervention vs. Control (95% CI) | Age- and sex- adjusted difference: Intervention vs. Control (95% CI) | Fully adjusted † difference: Intervention vs. Control (95% CI) | Inverse probability of censoring † difference: Intervention vs. Control (95% CI) |
|---|---|---|---|---|---|---|
| After 1 year of intervention (age ~ 14 months) | ||||||
| Control | 321 | 1.47 | ||||
| N + WSH | 341 | 1.40 | −0.07 (−0.11,–0.03) p=0.001* | −0.06 (−0.10,–0.02) p=0.005* | −0.05 (−0.10,0.01) p=0.099 | −0.07 (−0.11,–0.03) p=0.001* |
| After 2 years of intervention (age ~ 28 months) | ||||||
| Control | 330 | 1.46 | ||||
| N + WSH | 383 | 1.44 | −0.02 (−0.06,0.02) p=0.305 | −0.02 (−0.06,0.02) p=0.271 | −0.04 (−0.09,0.01) p=0.147 | −0.02 (−0.06,0.02) p=0.288 |
| Change in telomere length between Year 1 and 2 | ||||||
| Control | 260 | −0.01 | ||||
| N + WSH | 297 | 0.03 | 0.04 (0.00,0.08) p=0.050* | 0.04 (−0.00,0.08) p=0.073 | 0.04 (−0.01,0.09) p=0.081 | 0.03 (−0.01,0.07) p=0.088 |
-
*P<0.05
Confidence intervals were adjusted for clustered observations using robust standard errors. Separate weights were created for the inverse probability weighting for each of the different analyses because the probability of missing at Year 1 was different than at Year 2.
-
† Adjusted for pre-specified covariates associated with the outcome (likelihood ratio test p-value<0.2): Field staff who collected data, month of measurement, household food insecurity, child age, child sex, mother’s age, mother’s height, mother’s education level, number of children < 18 years in the household, number of individuals living in the compound, distance in minutes to the primary water source, household floor materials, household wall materials, household electricity, and household assets (wardrobe, table, chair, clock, khat, chouki, radio, television, refrigerator, bicycle, motorcycle, sewing machine, mobile phone, cattle, goats, and chickens).
-
Table 3—source data 1
Source data and code for Table 3.
- https://doi.org/10.7554/eLife.29365.012
Table 4
Subgroup analysis across sex of the effect of N + WSH intervention on telomere length (T/S ratio) after 1 and 2 years of intervention and on change in telomere length between Year 1 and Year 2
https://doi.org/10.7554/eLife.29365.013| Arm | Female children | Male children | Female children Unadjusted difference: Intervention vs. Control (95% CI) | Male children Unadjusted difference: Intervention vs. Control (95% CI) | Interaction term sex by treatment (95% CI) | ||
|---|---|---|---|---|---|---|---|
| N | Mean | N | Mean | ||||
| After 1 year of intervention (age ~ 14 months) | |||||||
| Control | 162 | 1.50 | 159 | 1.43 | |||
| N + WSH | 180 | 1.42 | 161 | 1.37 | −0.08 (−0.13,–0.03) p=0.001* | −0.06 (−0.11,–0.00) p=0.040* | 0.03 (−0.04,0.09) p=0.435 |
| After 2 years of intervention (age ~ 28 months) | |||||||
| Control | 167 | 1.50 | 163 | 1.42 | |||
| N + WSH | 202 | 1.45 | 181 | 1.42 | −0.05 (−0.10,0.01) p=0.082 | 0.00 (−0.05,0.05) p=0.877 | 0.05 (−0.01,0.12) p=0.105 |
| Change in telomere length between Year 1 and 2 | |||||||
| Control | 134 | –0.01 | 126 | −0.01 | |||
| N + WSH | 160 | 0.03 | 137 | 0.04 | 0.04 (−0.02,0.09) p=0.227 | 0.05 (0.00,0.09) p=0.048* | 0.01 (−0.06,0.08) p=0.747 |
-
*P<0.05
Confidence intervals were adjusted for clustered observations using robust standard errors.
-
Table 4—source data 1
Source data and code for Table 4.
- https://doi.org/10.7554/eLife.29365.014
Additional files
-
Reporting standard 1
- https://doi.org/10.7554/eLife.29365.015
-
Transparent reporting form
- https://doi.org/10.7554/eLife.29365.016
Download links
A two-part list of links to download the article, or parts of the article, in various formats.
Downloads (link to download the article as PDF)
Open citations (links to open the citations from this article in various online reference manager services)
Cite this article (links to download the citations from this article in formats compatible with various reference manager tools)
Effects of water, sanitation, handwashing, and nutritional interventions on telomere length among children in a cluster-randomized controlled trial in rural Bangladesh
eLife 6:e29365.
https://doi.org/10.7554/eLife.29365


