Theta-burst microstimulation in the human entorhinal area improves memory specificity
- University of California, United States
- California Institute of Technology, United States
Figures
Figure 1
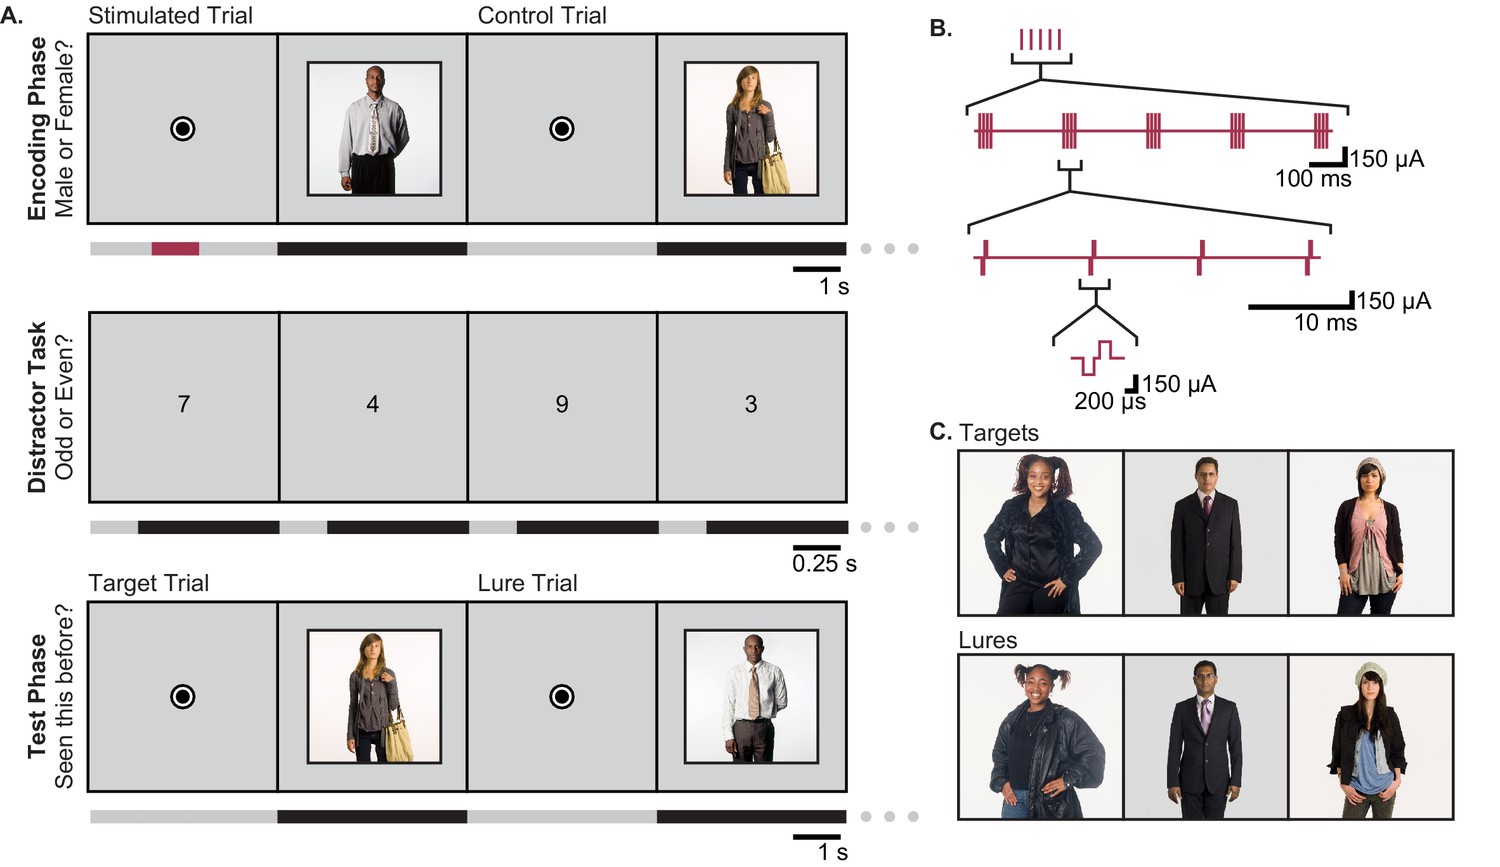
Task Design.
(A) The person-recognition task consisted of three phases. In the encoding phase, participants were shown portraits of people for 4 s each (black bars in timeline), preceded by a 4.2–5.2 s fixation dot (gray bars). Half of the pictures were randomly selected for stimulation. For these, one second of theta-burst stimulation (red bar) was applied beginning 2.2–2.7 s before picture onset, during viewing of the fixation dot. To ensure that participants were viewing the portraits, they were asked to report whether the person in each image was male or female. The encoding phase was followed by a 30 s distractor task in which single digits were presented once per second and the participant was asked to identify each digit as odd or even. Finally, during the test phase, participants were shown a mixture of images they had seen during the encoding phase (targets) and portraits of people who looked similar but had not been previously viewed (lures). Participants were asked to report whether each image was ‘old’ or ‘new.’ (B) Theta burst stimulation consisted of 5 sets of current pulses, separated by 200 ms, in which each set included four biphasic stimulation pulses presented at 100 Hz. (C) Representative pairings of target and lure images. All images used in the task were adapted with permission from the book Exactitudes (Versluis and Uyttenbroek, 2002). Further examples of images may be viewed at http://exactitudes.com. Demographic data for the study participants are presented in Figure 1—source data 1.
-
Figure 1—source data 1
Participant demographics and stimulation location.
Age, gender, handedness, and hemisphere of language dominance of each of the 13 participants (R: right, L: left, A: ambidextrous, B: bilateral, NA: not available (language dominance was not tested)). Antiepileptic drugs refers to medications taken on the day(s) of the experiments. Also shown are the clinically determined seizure-onset zones and stimulated medial temporal lobe (MTL) regions for each subject. Numbers in parentheses indicate the number of individual experimental sessions in which each subject participated. Participants 6 and 13 participated in multiple sessions and received stimulation on each side, but not concurrently. * indicates a stimulated region that fell within the seizure-onset zone for that participant.
- https://doi.org/10.7554/eLife.29515.003
Figure 2 with 2 supplements
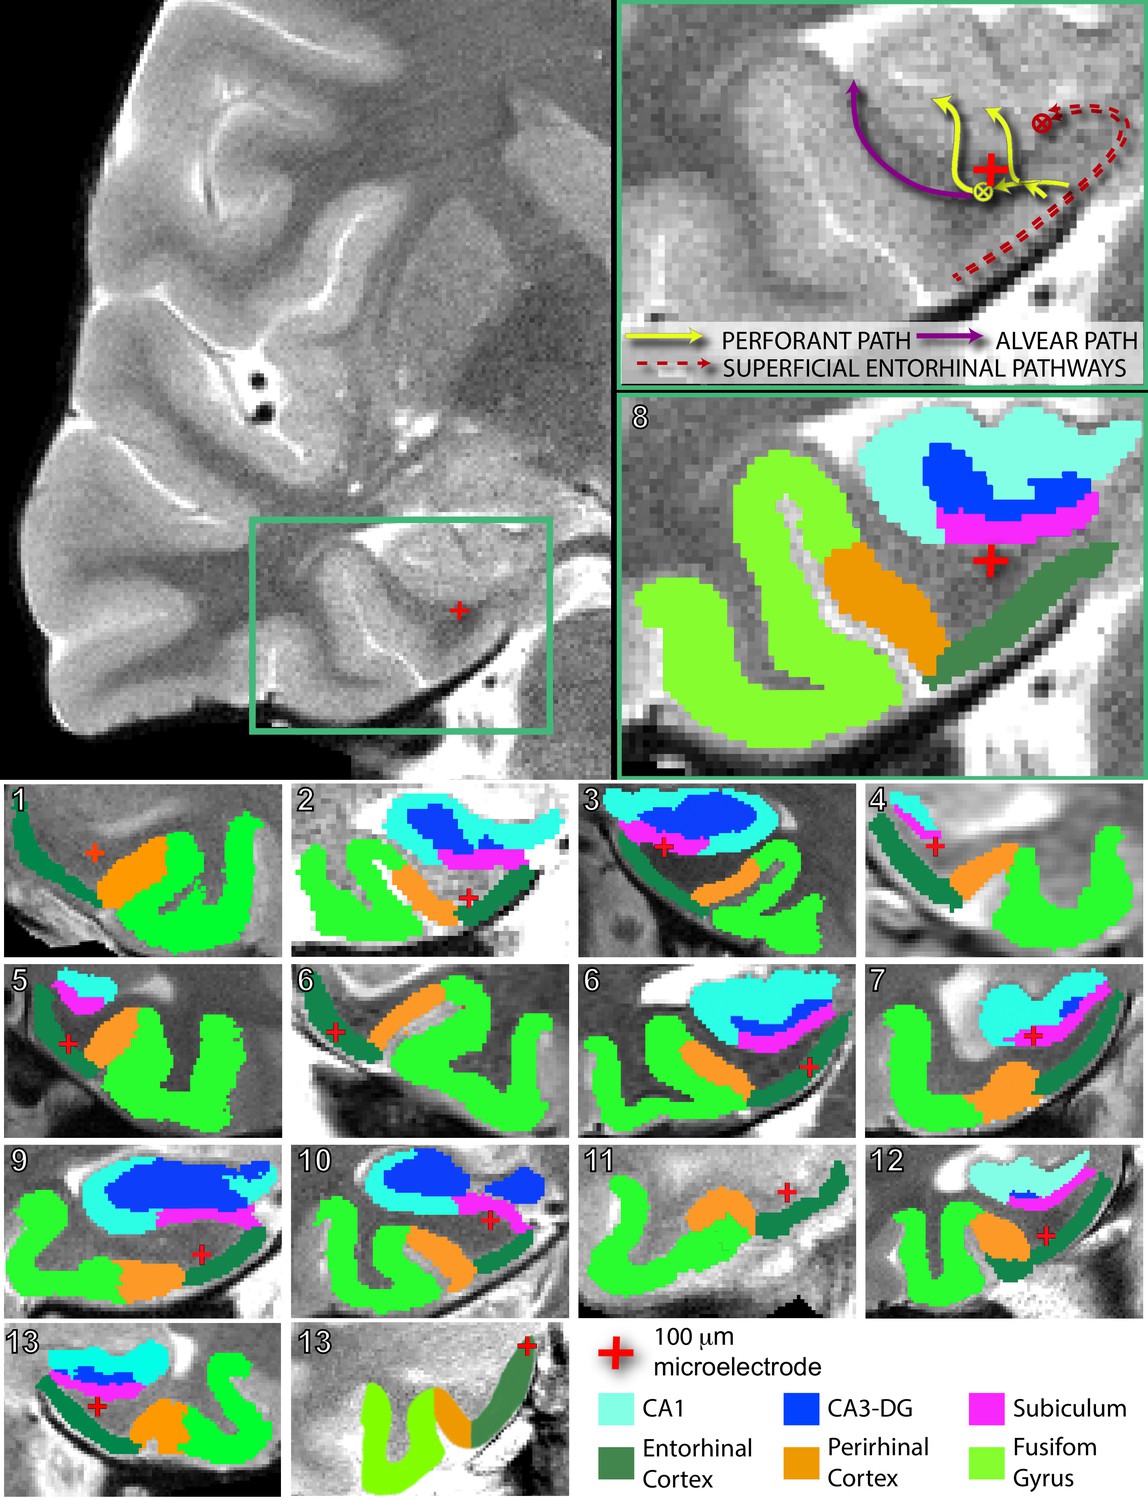
Electrode localization in participants.
(Top) Pre-implantation high-resolution MRI scans (left) were co-registered to post-implantation high-resolution CT scans (not pictured) for electrode localization. Automated protocols were used to delineate different regions (colored areas in bottom right magnification), as well as white versus gray matter areas. The red crosshair denotes the location of the microstimulation electrode in the right angular bundle. Arrow diagrams, shown in the upper right magnification, depict the expected trajectories and directions of afferent pathways to the hippocampus; adapted from Zeineh et al. (2017). denotes fiber tracts traveling transverse to the coronal plane. Perforant path fibers begin in entorhinal gray matter, travel through the angular bundle, and pass through the subicular pyramidal layer, prior to arriving to either the dentate gyrus or CA fields of the hippocampus. (Bottom) Segmented MRIs and locations of microelectrodes, same as above, for all other participants in the study. Numbers in the upper left refer to participant ID (Figure 1—source data 1). Subregions were delineated by hand for participant 13’s right hemisphere, as the electrode was located farther anterior than the automated protocols are intended to compute. A comparison of the spatial specificity of microstimulation and macrostimulation is shown in Figure 2—figure supplement 1. Group level localization data are presented in Figure 2—figure supplement 2.
Figure 2—figure supplement 1
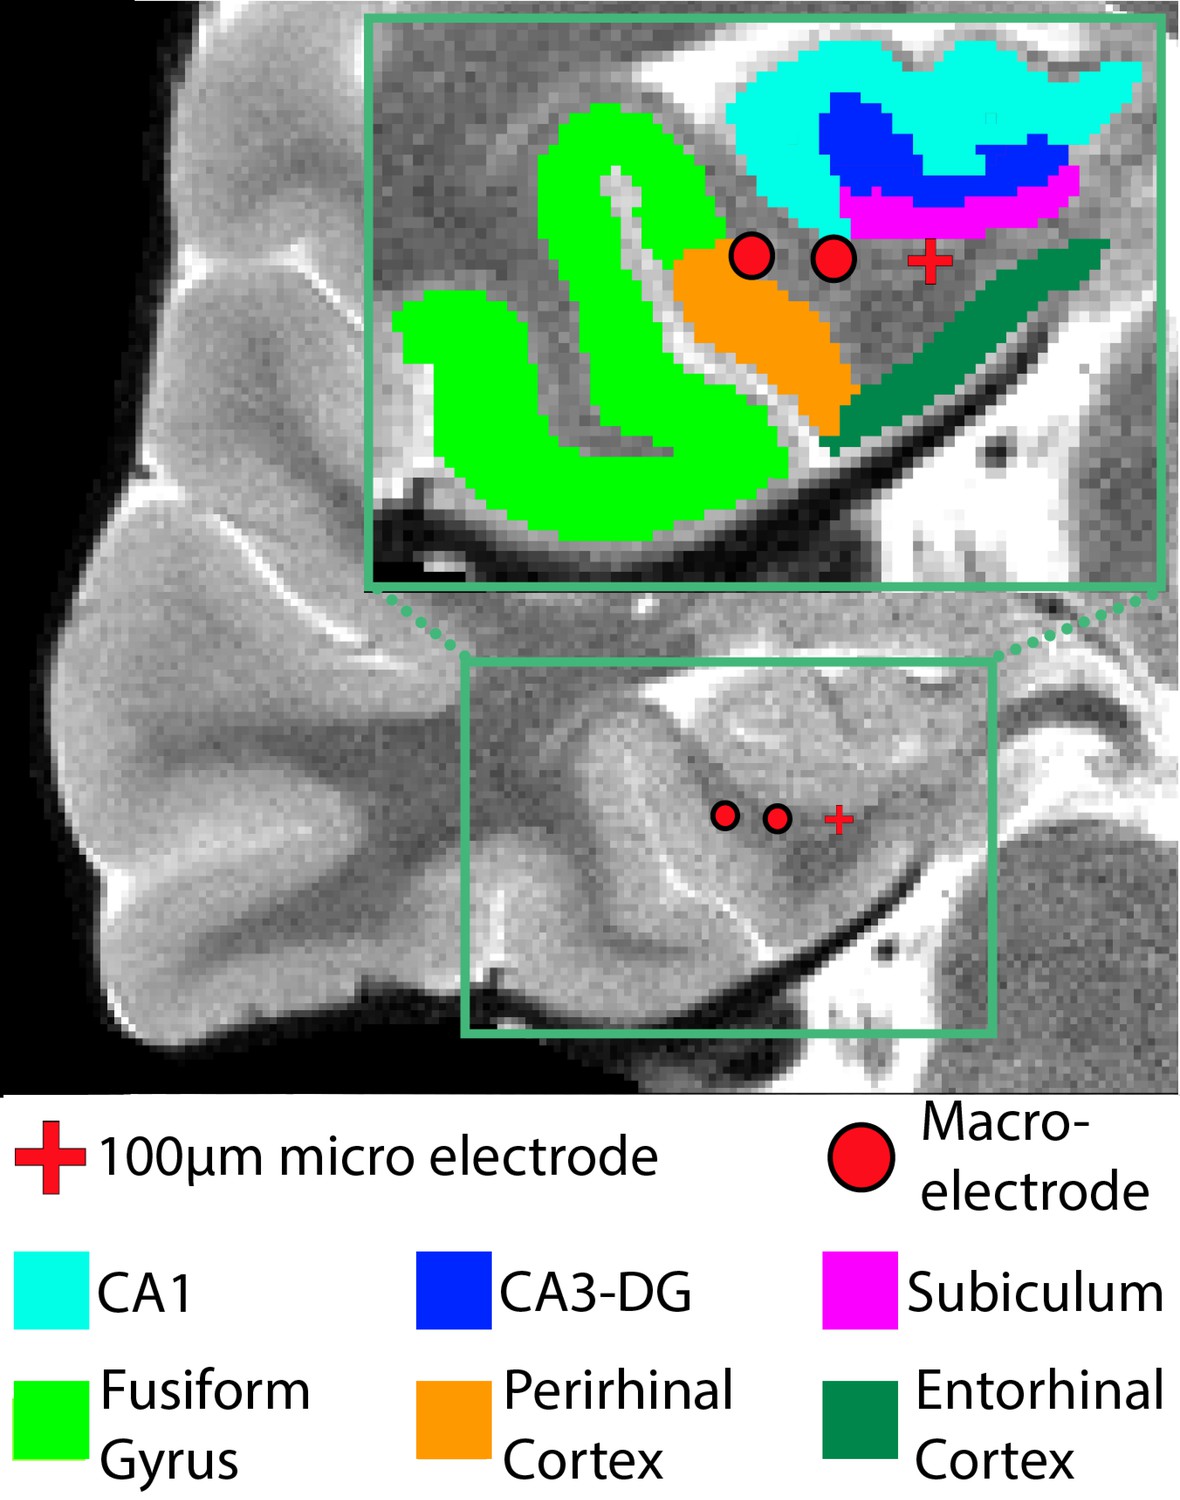
Microstimulation electrodes provide spatially focused stimulation.
Representative example of electrode placement (participant 8). (MRI image; Magnification: segmentation of subregions of the MTL). Microstimulation electrodes are denoted by red crosshairs. For comparison, macrostimulation electrodes are denoted by red circles. Due to their smaller size, microstimulation electrodes are precisely localized to a single region, whereas macrostimulation contacts may span multiple areas, especially when bipolar stimulation is applied across pairs of contacts. In this example, bipolar current applied across this pair of contacts would not only affect the angular bundle, but also perirhinal cortex, CA1, and likely, fusiform gyrus and subiculum.
Figure 2—figure supplement 2
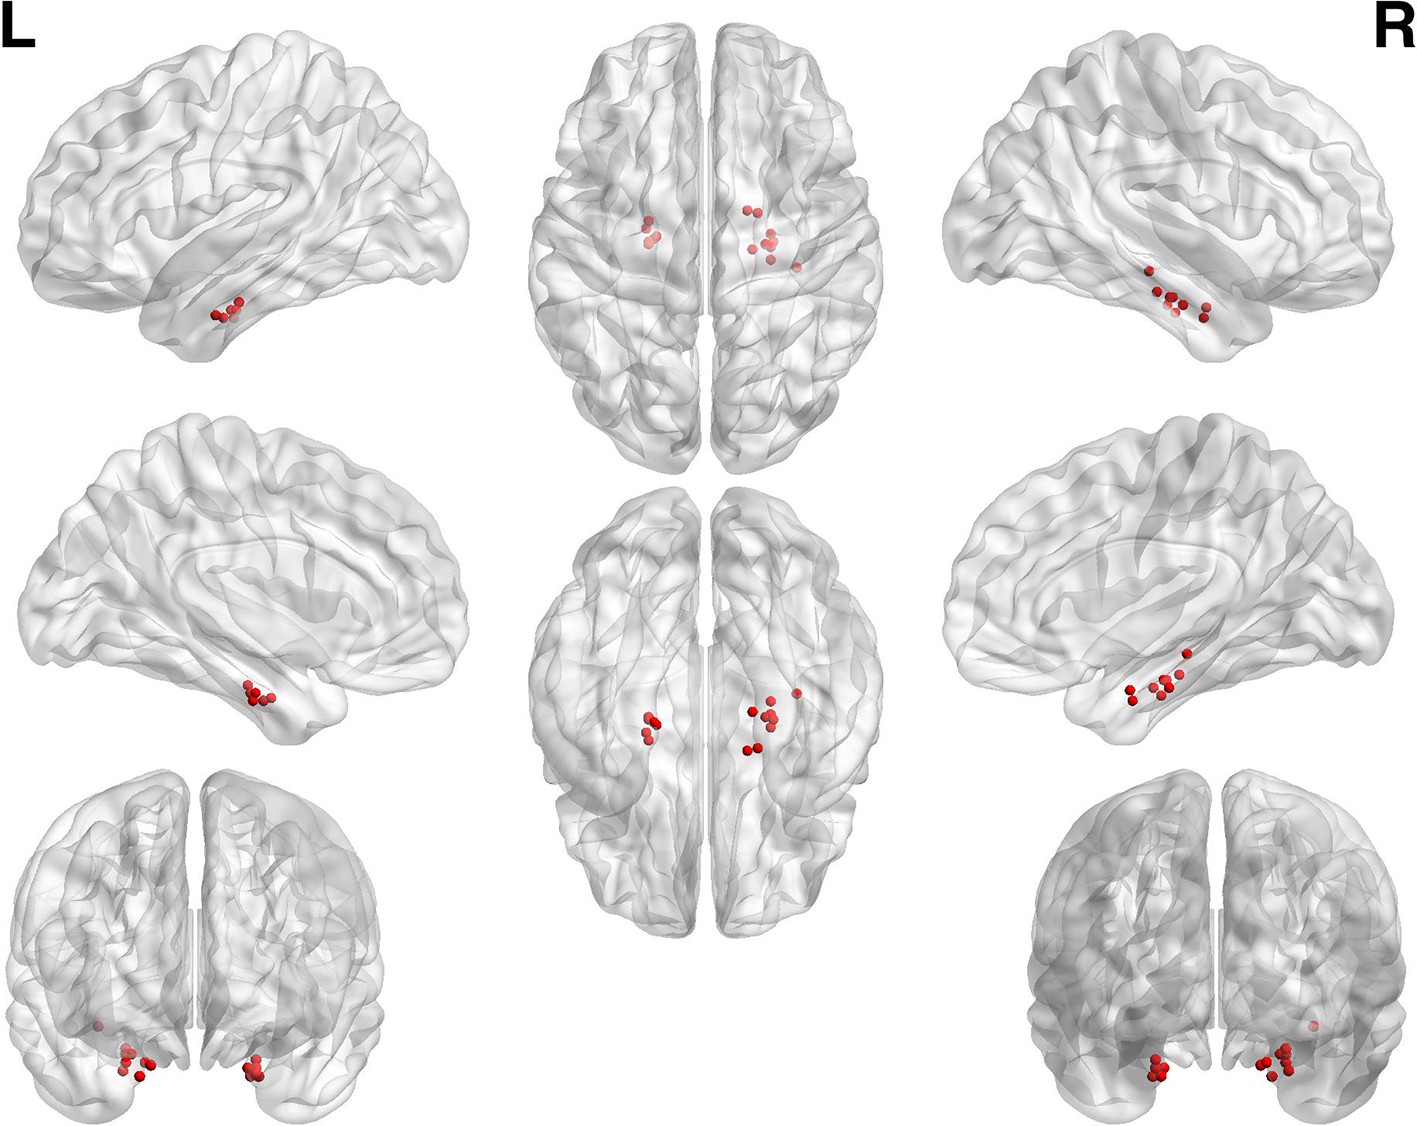
Group-level microelectrode placements.
For each participant, microelectrodes were localized by co-registering postoperative CT and preoperative MRI images. Electrode locations were then registered onto a standard MNI brain and visualized using the BrainNet toolbox in Matlab ([Xia et al., 2013], see Materials and methods). Each red dot corresponds to one microelectrode.
Figure 3
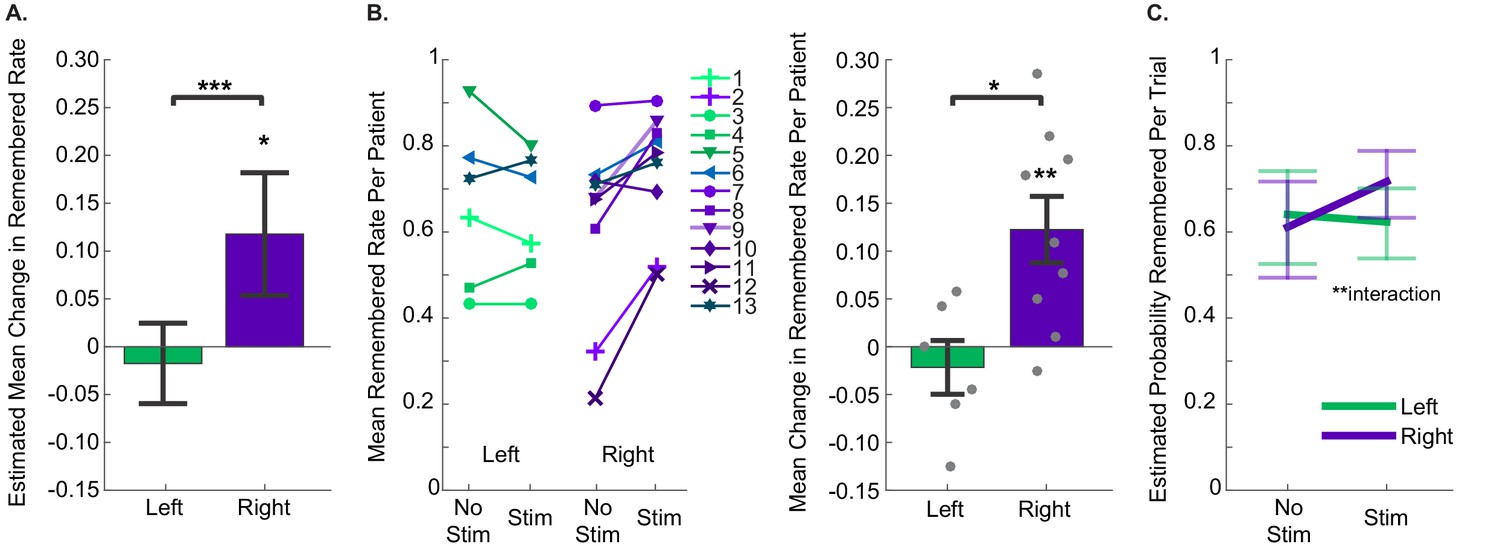
Stimulation of the right entorhinal area improved memory specificity.
(A) The estimated mean change in fraction of stimulated items that were remembered compared to non-stimulated items, as estimated with Generalized Estimating Equations, which accounted for within subject correlations in performance. Positive numbers indicate that stimulated trials were remembered at greater rates. The effect of stimulation hemisphere was significant (p=6.17 × 10⁻⁴, N = 40 sessions from 13 participants (left: 21 sessions from 6 participants; right: 19 sessions from 9 participants)). Error bars indicate 95% confidence intervals, demonstrating that the increase in performance due to stimulation of the right entorhinal area was greater than 0. (Data and SPSS model definitions: Figure 3—source data 1, Source code 1.) (B) (Left) Remembered rates for each individual participant. For participants who did the task more than once, average rates are presented. Participants 6 and 13 performed the task with stimulation on each side (in different sessions), and the sessions from each hemisphere are presented independently. Upward slanting lines correspond to positive change scores, indicating that stimulation improved performance. (Right) Difference in remembered rates for left and right entorhinal area stimulation (mean ±s.e.m.). These are significantly different (t(13) = −2.98, p=0.011), and stimulation in the right entorhinal area leads to significantly positive changes in remembering (t(8) = 3.53, p=0.008). (C) Trial by trial analysis of whether a portrait was subsequently remembered was evaluated with a GEE model including stimulation condition and stimulation hemisphere, as well as trial-order effects. The only significant predictor was the interaction term between stimulation condition and hemisphere (p=0.002, N = 1207 trials from 13 participants). Error bars are 95% Wald Confidence Intervals. (Model coefficients: Figure 3—source data 3, data: Figure 3—source data 2, and SPSS model definitions: Source code 2).
-
Figure 3—source data 1
Session-level performance data.
- https://doi.org/10.7554/eLife.29515.008
-
Figure 3—source data 2
Trial-level performance data.
- https://doi.org/10.7554/eLife.29515.009
-
Figure 3—source data 3
Trial by trial analysis of behavioral data.
Each trial’s behavioral outcome was categorized based on whether the viewed portrait was remembered during the test phase or not (total number of trials = 1207 from 13 participants). This metric was modeled as a binary logit response (remembered/missed). Stimulation condition (on/off), stimulation hemisphere (left/right), an interaction term between these two and whether the target image was presented first were specified as factors, which together with normalized trial numbers as a covariate, constituted the model effects. Each factor (row) is quantified by its corresponding (unexponentiated) coefficient (B) and the error associated with it (Std. error and 95% confidence interval), together with whether that term was statistically significant in the model (hypothesis test column).
- https://doi.org/10.7554/eLife.29515.010
Figure 4 with 1 supplement
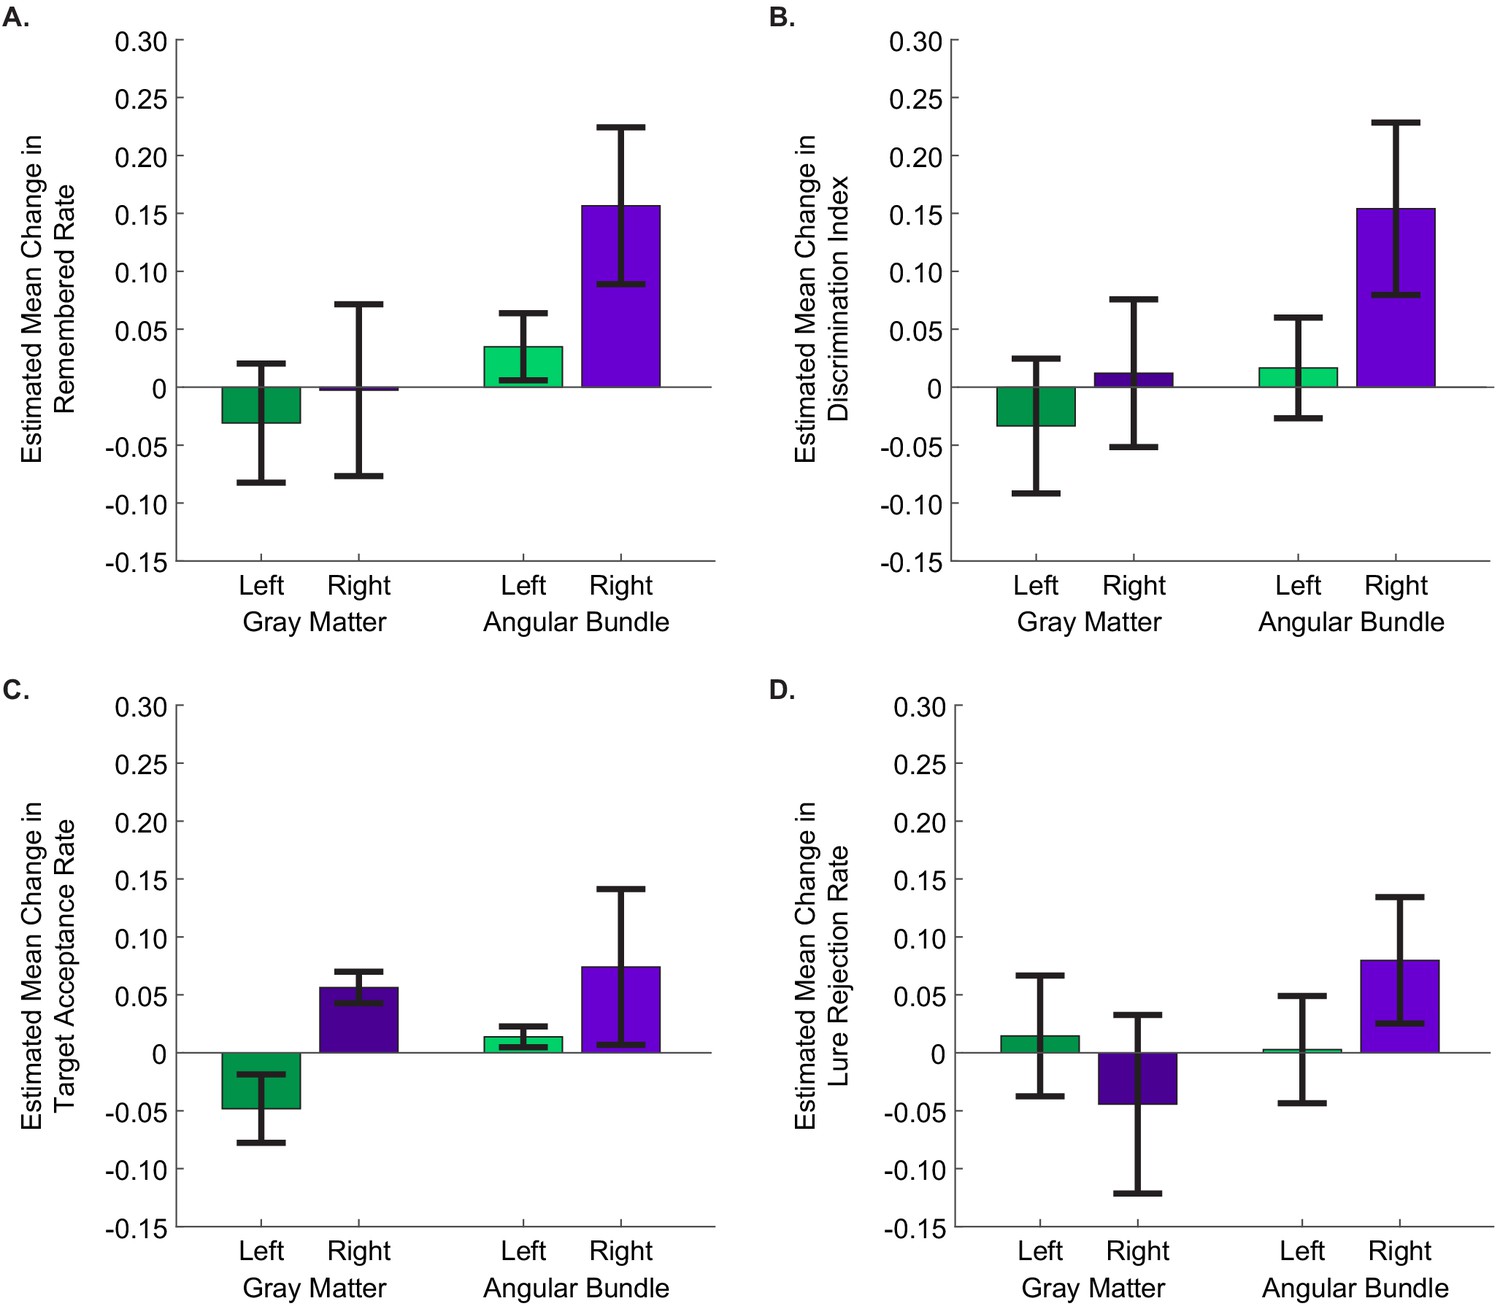
Stimulation of the right angular bundle improves memory specificity, whereas stimulation of gray matter introduces response bias.
The estimated mean difference in stimulated compared to non-stimulated trials in (A) remembered rate, (B) discrimination index, (C) target acceptance rate, and (D) lure rejection rate, as computed by GEE models. In all panels, positive values indicate that performance was better for stimulated than non-stimulated trials. Error bars represent Wald 95% confidence intervals for the estimated means. The main effects of stimulation hemisphere and stimulation region were significant for all behavioral metrics except lure rejection rate, with stimulation in the right hemisphere and in the angular bundle improving performance for each (remembered rate: hemisphere: p=1.49 × 10⁻⁴, region: p=0.011; DI: hemisphere: p=2.79 × 10⁻³, region: p=2.53 × 10⁻³;target acceptance rate: hemisphere: p=0.034, region: p=2.52×10⁻⁵); In the case of lure rejection rate, the interaction between stimulation hemisphere and region was significant. (p=0.018). (Left gray matter: 11 sessions from three participants; right gray matter: 6 sessions from three participants; left angular bundle: 10 sessions from three participants; right angular bundle: 13 sessions from six participants.) (Data is in Figure 3—source data 1; SPSS model effects and definitions are in Figure 4—source data 1 and Source code 3, respectively.).
-
Figure 4—source data 1
Tests of Model Effects for session-level behavioral metrics.
Each behavioral metric was modeled as a linear scale response with stimulation hemisphere (left/right), stimulation region (angular bundle/gray matter), and an interaction term between the two (total number of sessions = 40 from 13 participants). The main effects of stimulation hemisphere and stimulation region, but not the interaction, were significant for remembered rate, discrimination index, and target acceptance rate. The interaction term was significant for lure rejection rate. The Wald Chi-Square statistic, degrees of freedom (df), and significance level (p) are presented for each significant effect.
- https://doi.org/10.7554/eLife.29515.013
Figure 4—figure supplement 1
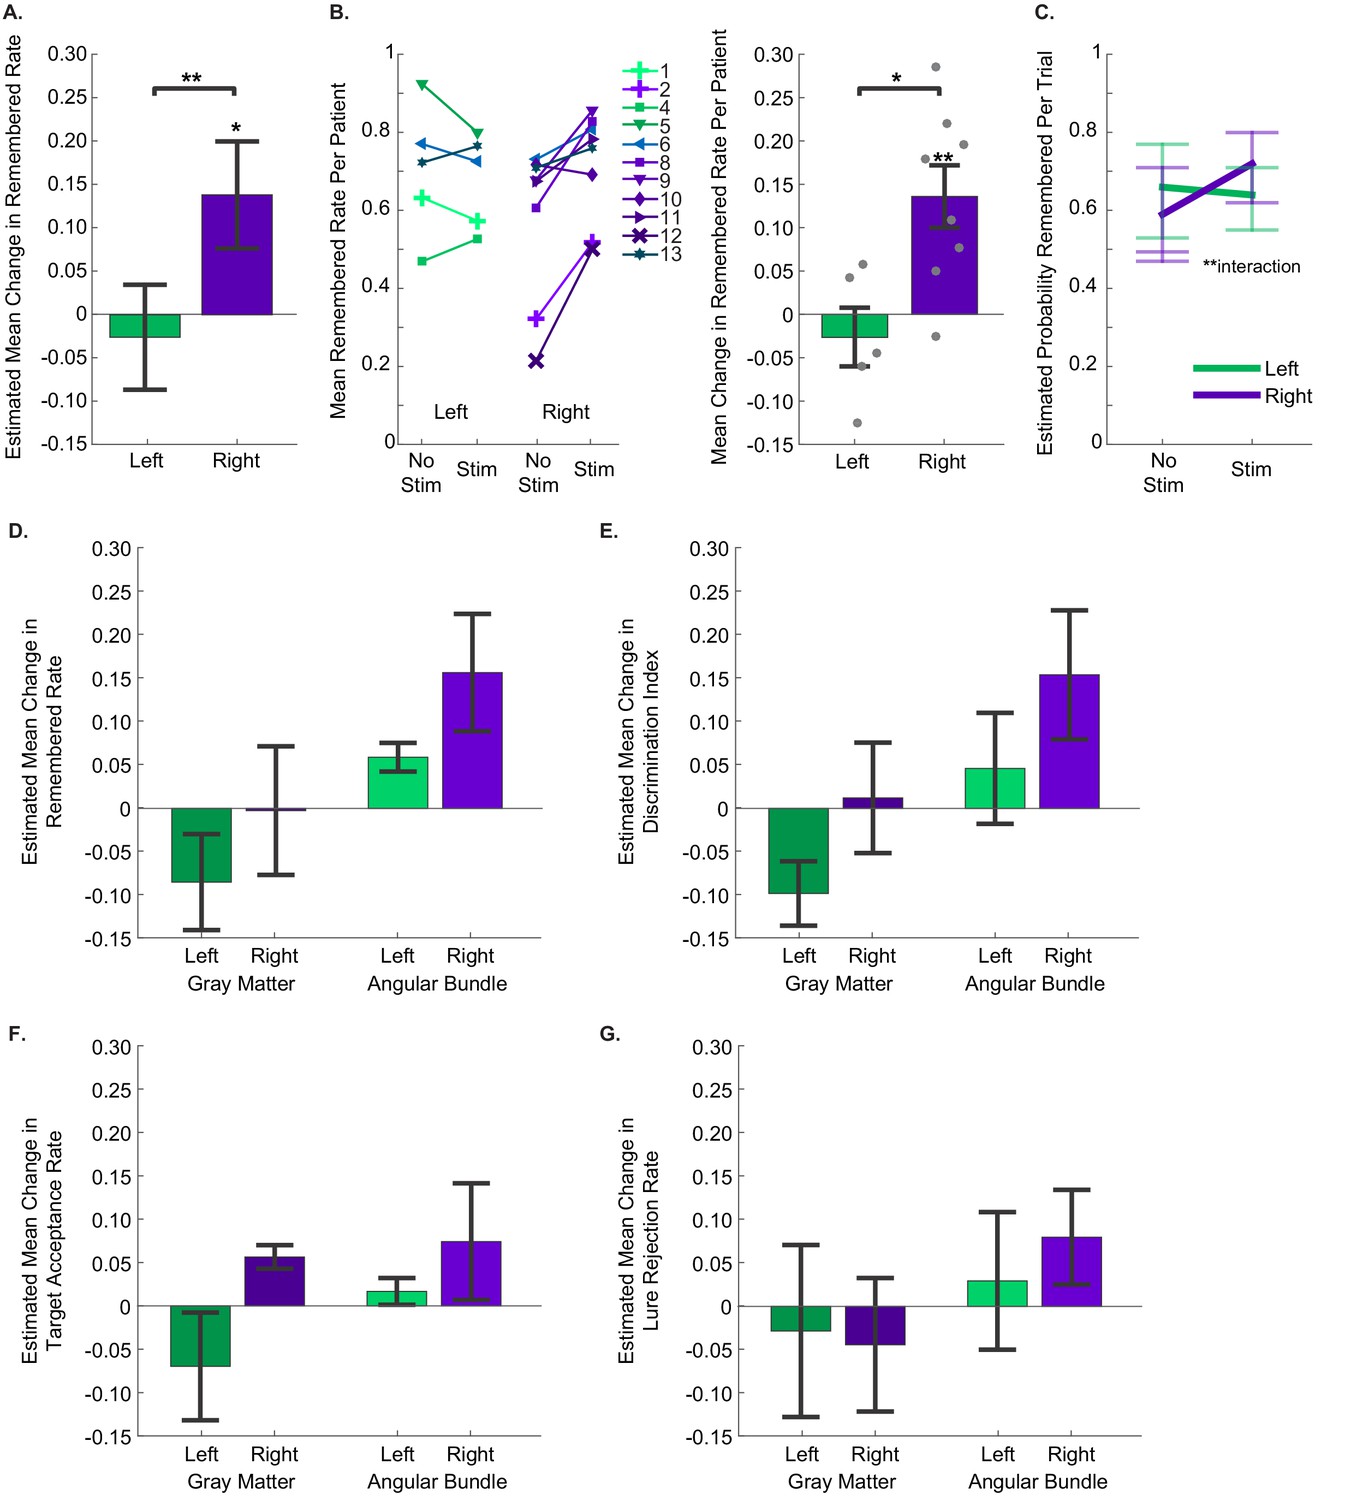
Effects of stimulation in the entorhinal area, proper.
Sessions when the stimulating electrode was located in the subiculum are excluded. The layout of A-C is as in Figure 3. (A) The effect of stimulation hemisphere was significant (p=2.69 × 10⁻⁴, N = 30 sessions from 11 participants (left: 14 sessions from five participants; right: 16 sessions from eight participants)). (B) Difference in remembered rates for left and right entorhinal area stimulation were significantly different (t(11) = −3.05, p=0.011), and stimulation in the right entorhinal area leads to significantly positive changes in remembering (t(7) = 3.79, p=0.007). (C) The interaction term between stimulation condition and hemisphere was significant (p=0.002, N = 983 trials from 11 participants), along with whether the target was presented before the lure (p=2.31×10⁻⁴; EM (target first): 0.71. EM (lure first): 0.59). (D–G) The estimated mean difference in stimulated compared to non-stimulated trials in (D) remembered rate, (E) discrimination index, (F) target acceptance rate, and (G) lure rejection rate. The main effects of stimulation hemisphere and stimulation region were significant for all behavioral metrics except lure rejection rate, with stimulation in the right hemisphere and in the angular bundle improving performance and stimulation in the left entorhinal gray matter impairing performance for each (remembered rate: hemisphere: p=1.36 × 10⁻⁷, region: p=0.0034; DI: hemisphere: p=2.52 × 10⁻⁶, region: p=1.89 × 10⁻³; target acceptance rate: hemisphere: p=0.021, region: p=2.70×10⁻⁴); In the case of lure rejection rate, only stimulation hemisphere was significant. (hemisphere: p=0.010; region: p=0.718). Error bars are 95% Wald Confidence Intervals.
Additional files
-
Source code 1
Syntax to run model that generated Figure 3A in SPSS.
- https://doi.org/10.7554/eLife.29515.014
-
Source code 2
Syntax to run model that generated Figure 3C in SPSS.
- https://doi.org/10.7554/eLife.29515.015
-
Source code 3
Syntax to run models that generated Figure 4.
- https://doi.org/10.7554/eLife.29515.016
-
Source code 4
- https://doi.org/10.7554/eLife.29515.017
-
Transparent reporting form
- https://doi.org/10.7554/eLife.29515.018
Download links
A two-part list of links to download the article, or parts of the article, in various formats.
Downloads (link to download the article as PDF)
Open citations (links to open the citations from this article in various online reference manager services)
Cite this article (links to download the citations from this article in formats compatible with various reference manager tools)
Theta-burst microstimulation in the human entorhinal area improves memory specificity
eLife 6:e29515.
https://doi.org/10.7554/eLife.29515


