Pharmacological augmentation of nicotinamide phosphoribosyltransferase (NAMPT) protects against paclitaxel-induced peripheral neuropathy
- University of Texas Health Science Center at San Antonio, United States
Figures
Figure 1 with 1 supplement

PTX differentially affects nociceptive thresholds and damages peripheral sensory neurons.
(A–I) Nociceptive thresholds to mechanical (A), cold (D), and heat (G) stimulation of the hindpaws of adult male Sprague-Dawley rats treated with vehicle (EtOH/Kolliphor EL/PBS, 1:1:6, i.p.) or PTX (11.7 mg/kg, i.p.) on days 0, 2, and 4. Data represent the mean change from baseline ± SEM. Individual rat timecourse plots showing changes in mechanical (B), cold (E), or heat (H) sensitivity following vehicle or PTX treatment. Bold lines represent group means. Area under the timecourse curves (AUC) of mechanical (C), cold (F), or heat (I) thresholds from vehicle- or PTX-treated rats. Bars represent the mean ± SEM and small circles are individual rat AUC values. ****p<0.0001, **p<0.01, *p<0.05 vs. Veh by two-way mixed effect ANOVA with Sidak’s post-hoc test (A, D, G) or two-tailed Student’s t-test (C, F, I), n = 14–15 rats/group. (J) Confocal images of IENFs in rat hindpaw biopsies. IENFs immunolabeled with PGP9.5 (arrowheads) project from subepidermal fascicles across the epidermal-dermal junction. Scale bar, 100 μm. (K) Confocal images of ATF3 expression (arrowheads) in nuclei of DRG neurons (also labeled with NeuN) acquired on day 7. Scale bar, 100 μm. (L and M) Quantification of IENF densities from paw biopsies collected on day 7 (L) and day 16 (M) of the experimental paradigm. Bars represent the mean ± SEM calculated from individual rat IENF densities from each group (circles), n = 7 rats/group. (N) Quantification of ATF3 expression. Bars represents mean ± SEM from each group, n = 3 rats/group. ****p<0.0001, ***p<0.001 vs. Veh by two-tailed Student’s t-test (L–N).
Figure 1—figure supplement 1
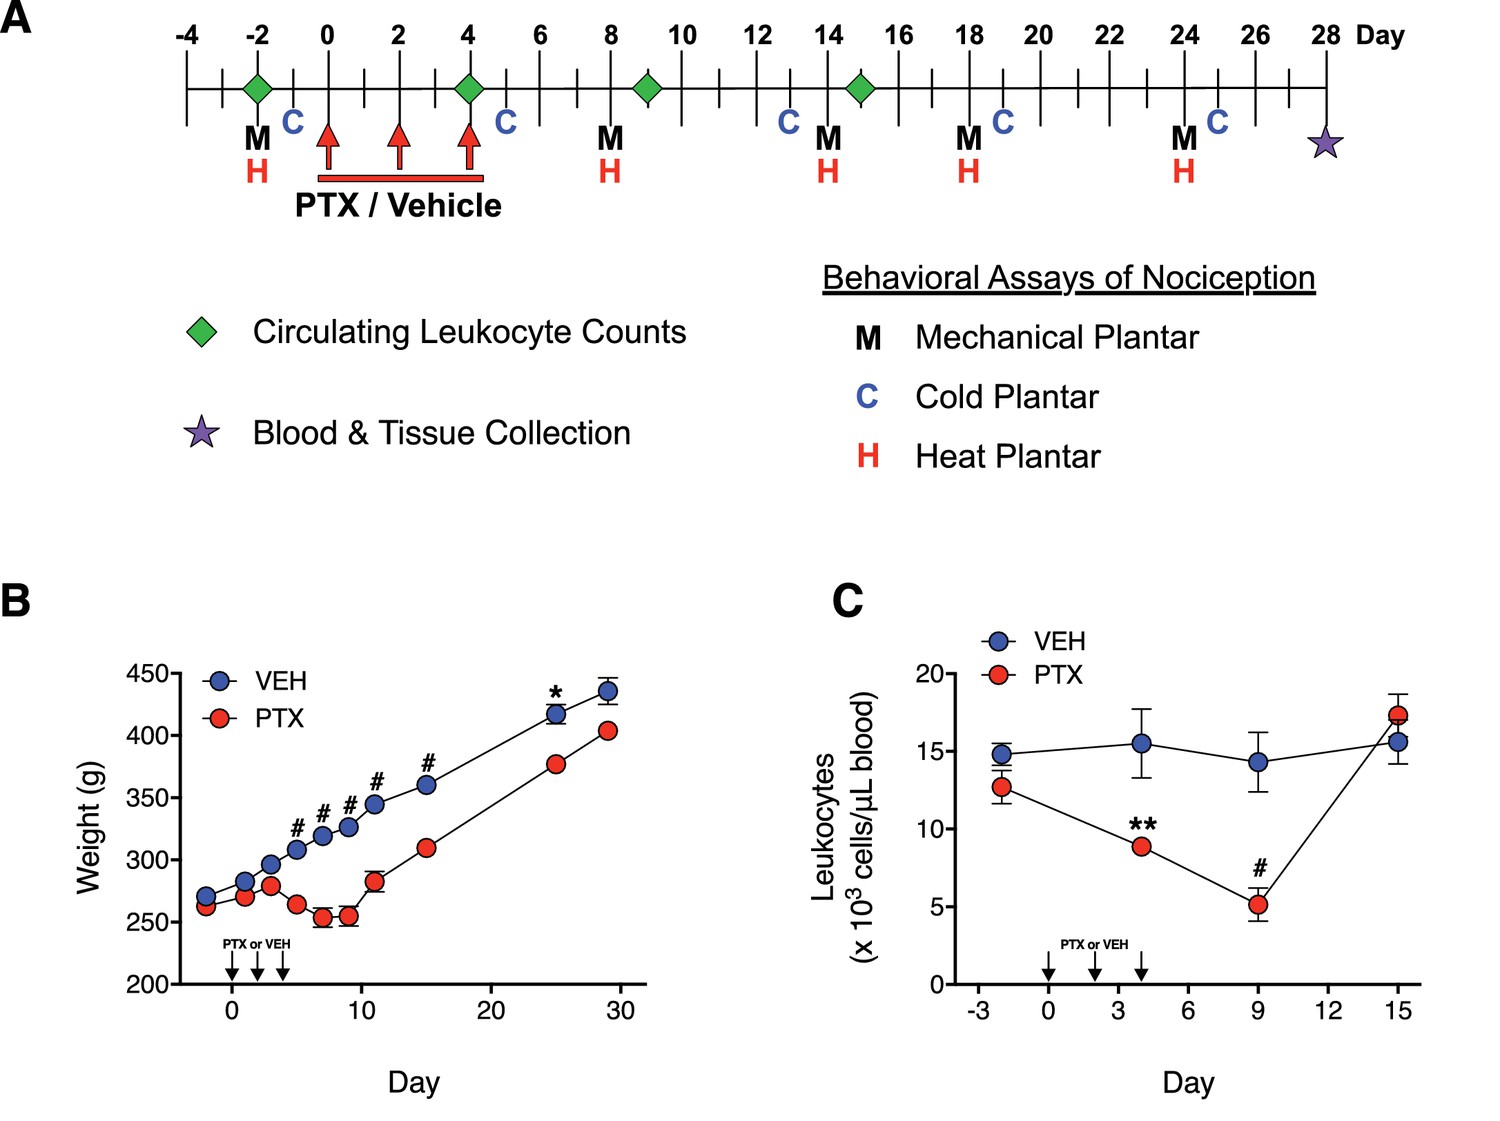
PTX treatment produces a recoverable loss in both body weight and circulating leukocyte levels in adult male rats.
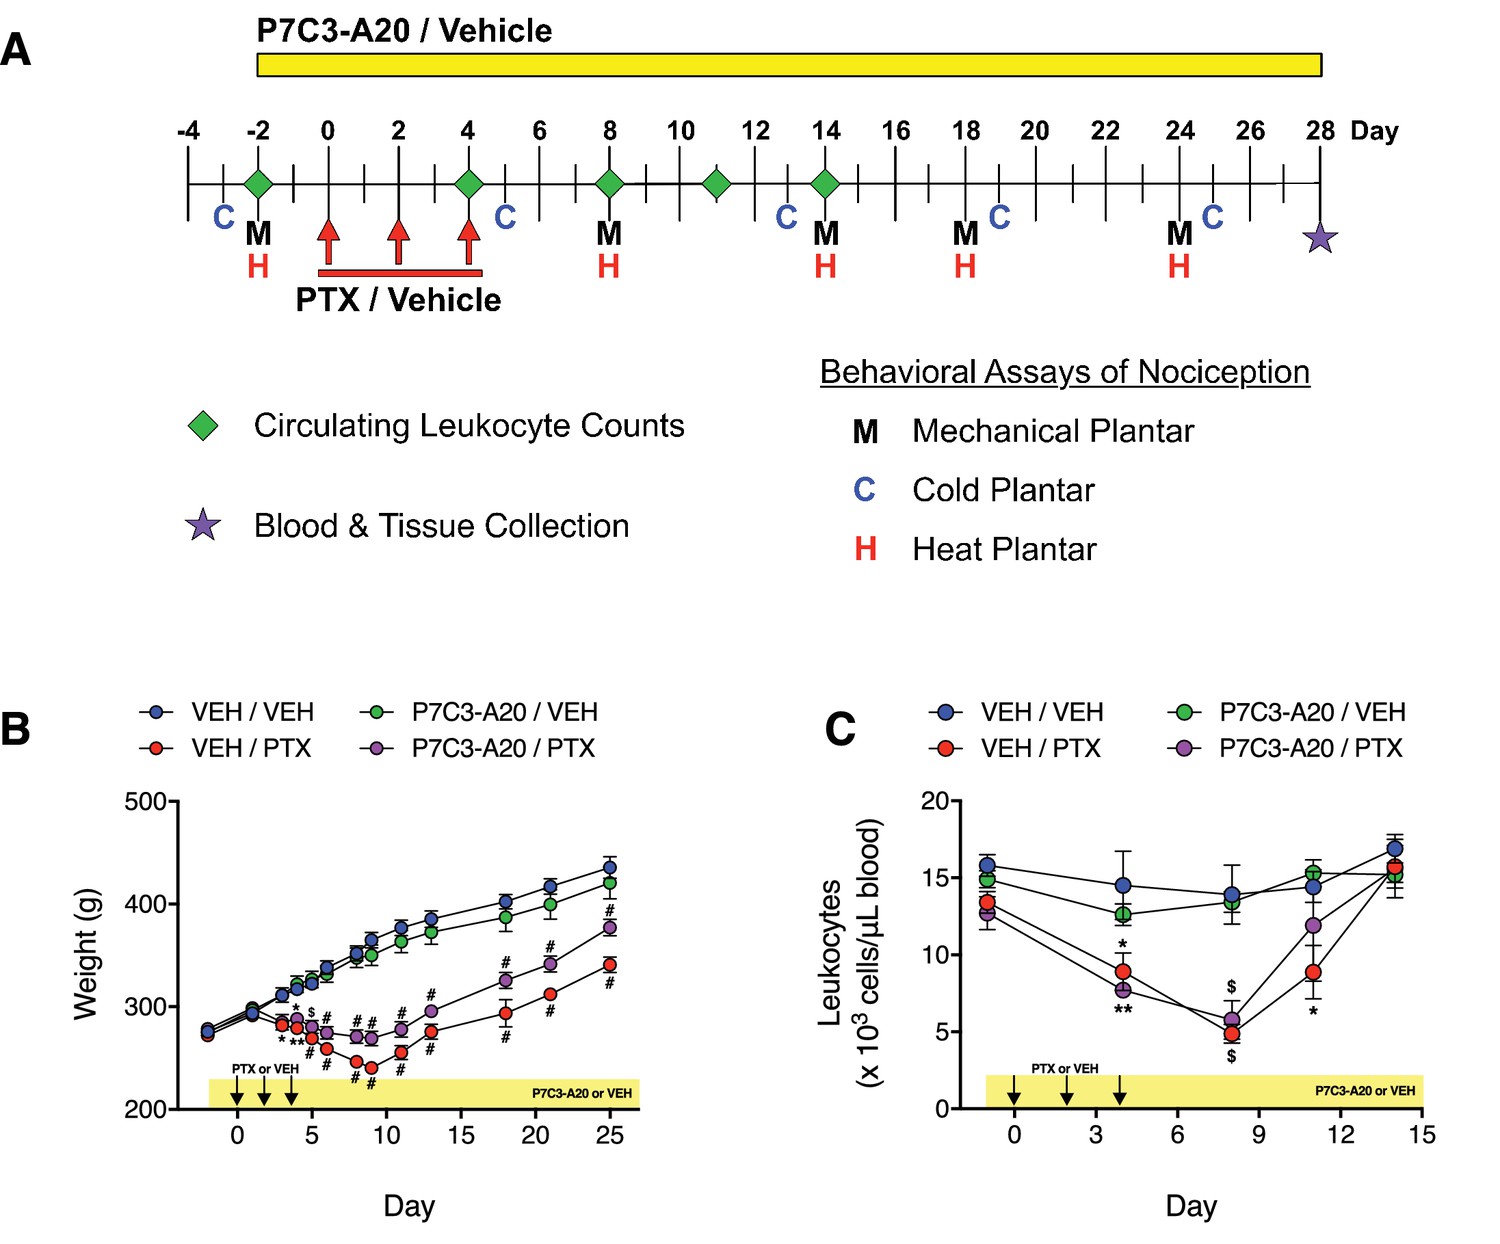
(A) Treatment schedule with PTX. Adult male Sprague-Dawley rats received intraperitoneal (i.p.) injections of PTX (11.7 mg/kg) or vehicle on days 0, 2, and 4. Blood samples were collected from the ventral saphenous vein and responses to noxious mechanical, cold, and heat stimulation were measured before, during, and after treatment as indicated. (B and C) PTX produced a transient decrease in both body weight (B) and circulating leukocyte count (C). Data are expressed as mean ± SEM, n = 14–15 rats/group. (Note: Error bars for some data points are within the size of the symbol). #p<0.0001, **p<0.01, *p<0.05 vs. vehicle-treated controls by two-way mixed effect ANOVA with Sidak’s post-hoc test.
Figure 2 with 1 supplement
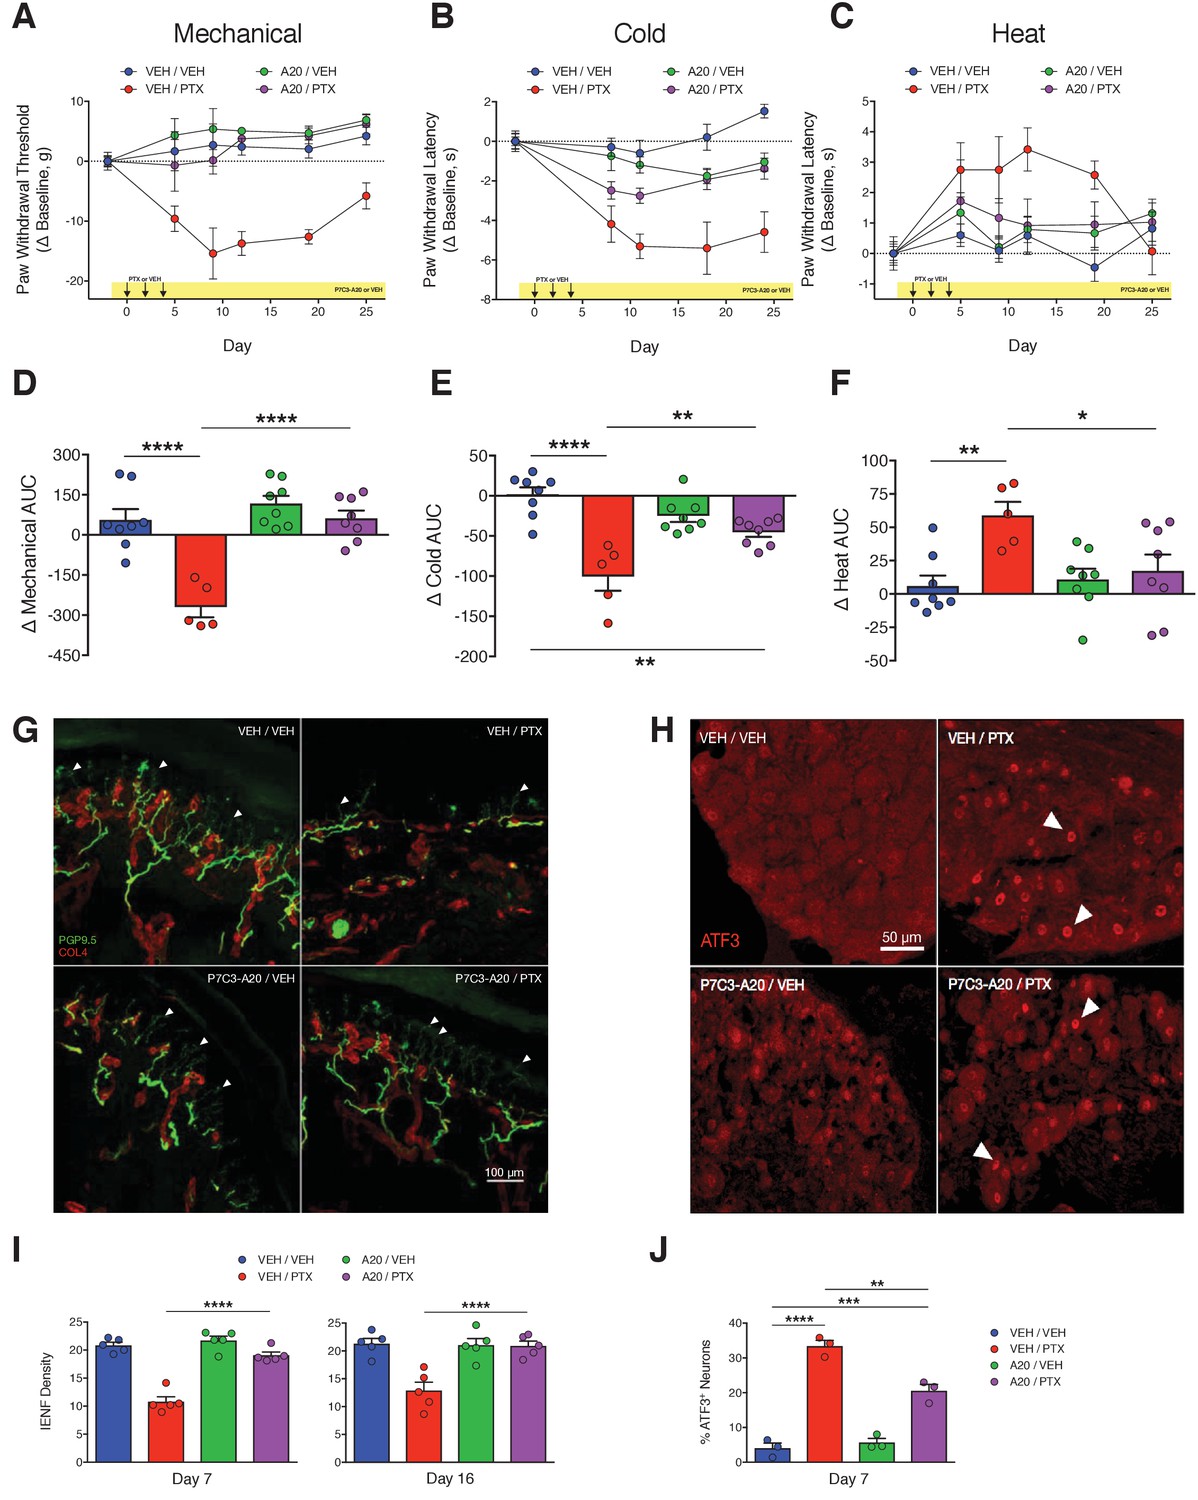
P7C3-A20 abrogates neuropathic pain and protects peripheral sensory neurons from PTX-induced damage.
(A–C) Nociceptive thresholds to mechanical (A), cold (B), and heat (C) stimulation of the hindpaws of rats treated daily with vehicle (DMSO/Kolliphor EL/PBS, 1:4:10, i.p.) or P7C3-A20 (10 mg/kg/day, i.p.), in addition to vehicle or PTX treatment on days 0, 2, and 4 as before (Figure 1). Data represent the mean change from baseline ± SEM. (D–F) Treatment group AUCs of mechanical (D), cold (E), or heat (F) thresholds. Bars represent the mean AUC ±SEM and small circles are individual rat AUC values. ****p<0.0001, **p<0.01, *p<0.05 by one-way ANOVA with Dunnett’s post-hoc test, n = 5–8 rats/group. (G and H) Confocal images of IENFs in rat hindpaw biopsies (G, scale bar: 100 μm) and ATF3 expression in lumbar DRG (H, scale bar: 50 μm.) (I) IENF densities from hindpaw biopsies collected on days 7 and 16 of the experimental paradigm. Bars represent the mean ±SEM calculated from individual rat IENF densities from each group (circles), n = 5–8 rats/group. (J) ATF3 expression in lumbar DRG perikarya collected on day 7. Bars represents mean ± SEM from each group, n = 3 rats/group. ****p<0.0001, **p<0.01 vs. Veh/PTX by one-way ANOVA with Tukey’s post-hoc test (I and J).
Figure 2—figure supplement 1
Effects of P7C3-A20 on PTX-induced weight loss and leukopenia.
(A) Adult male Sprague-Dawley rats received P7C3-A20 (10 mg/kg/day, i.p.) beginning 2 days prior to the first injection of PTX (11.7 mg/kg, i.p., q.a.d.) or vehicle. Blood samples were collected and responses to noxious mechanical, cold, and heat stimulation were measured before, during, and after treatment as indicated. (B and C) P7C3-A20 did not affect PTX-induced weight loss (B) or leukopenia (C). Data are expressed as mean ±SEM, n = 6–8 rats/group (weight) or 4 rats/group (leukocyte counts). #p<0.0001, $p<0.001, **p<0.01, *p<0.05 vs. vehicle-treated controls by two-way mixed effect ANOVA with Sidak’s post-hoc test.
Figure 3 with 4 supplements
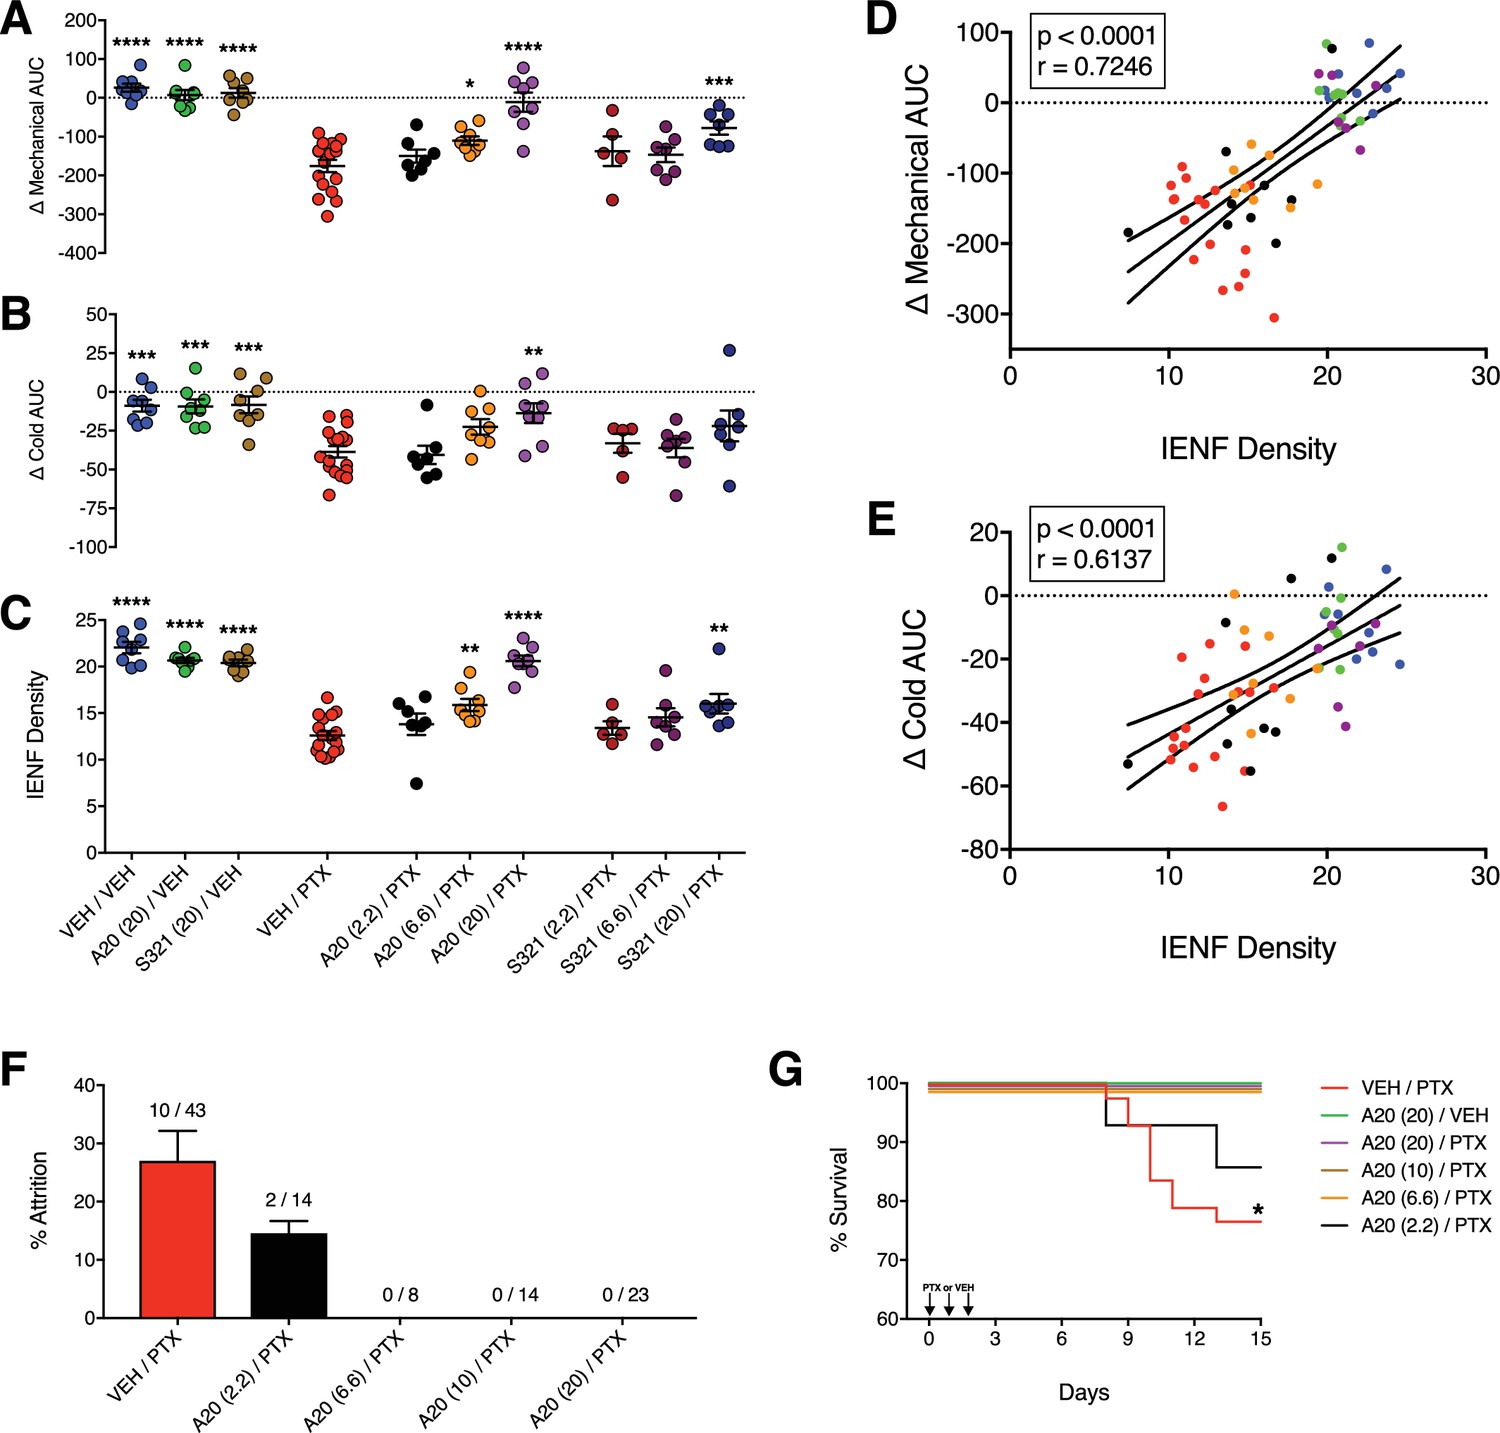
P7C3-A20 and P7C3-S321 are dose-dependently neuroprotective, improve general health, and attenuate premature death associated with PTX.
(A–C) AUCs to mechanical (A) and cold (B) stimulation and IENF densities (C) showing the dose-dependent neuroprotective effects of P7C3-A20 and P7C3-S321. Horizontal lines represent mean AUC ±SEM calculated from individual rat AUC values shown as small circles. ****p<0.0001, ***p<0.001, **p<0.01, *p<0.05 vs. Veh/PTX by one-way ANOVA with Dunnett’s post-hoc test, n = 5–17 rats/group. (D and E). Correlation analyses between individual rat IENF density and their respective mechanical (D) or cold (E) AUC (Pearson, two-tailed, p<0.0001). Black lines are linear regression curves with 95% confidence bands. Colors reflect treatment group as defined in Figure 3A–C. (F) Study attrition by treatment group. For each behavioral experiment, the number of rats removed due to >20% wt loss or death was divided by the total number of rats per treatment group. Data represent mean ± SEM, n = 1–4 independent experiments. (G) Survival curves showing attrition of rats treated only with PTX (red line) typically occurred between days 8–11, which was abolished by P7C3-A20 treatment. *p=0.0206 (χ2=13.32) by the Mantel-Cox log-rank test.
-
Figure 3—source data 1
Raw datasets for Figure 3 and all figure supplements.
Body weights, leukocytes, mechanical baselines, cold baselines, IENF density calculations, IENF-behavior correlation analyses, plasma drug levels for every rat by treatment group in the dose-response study.
- https://doi.org/10.7554/eLife.29626.011
Figure 3—figure supplement 1
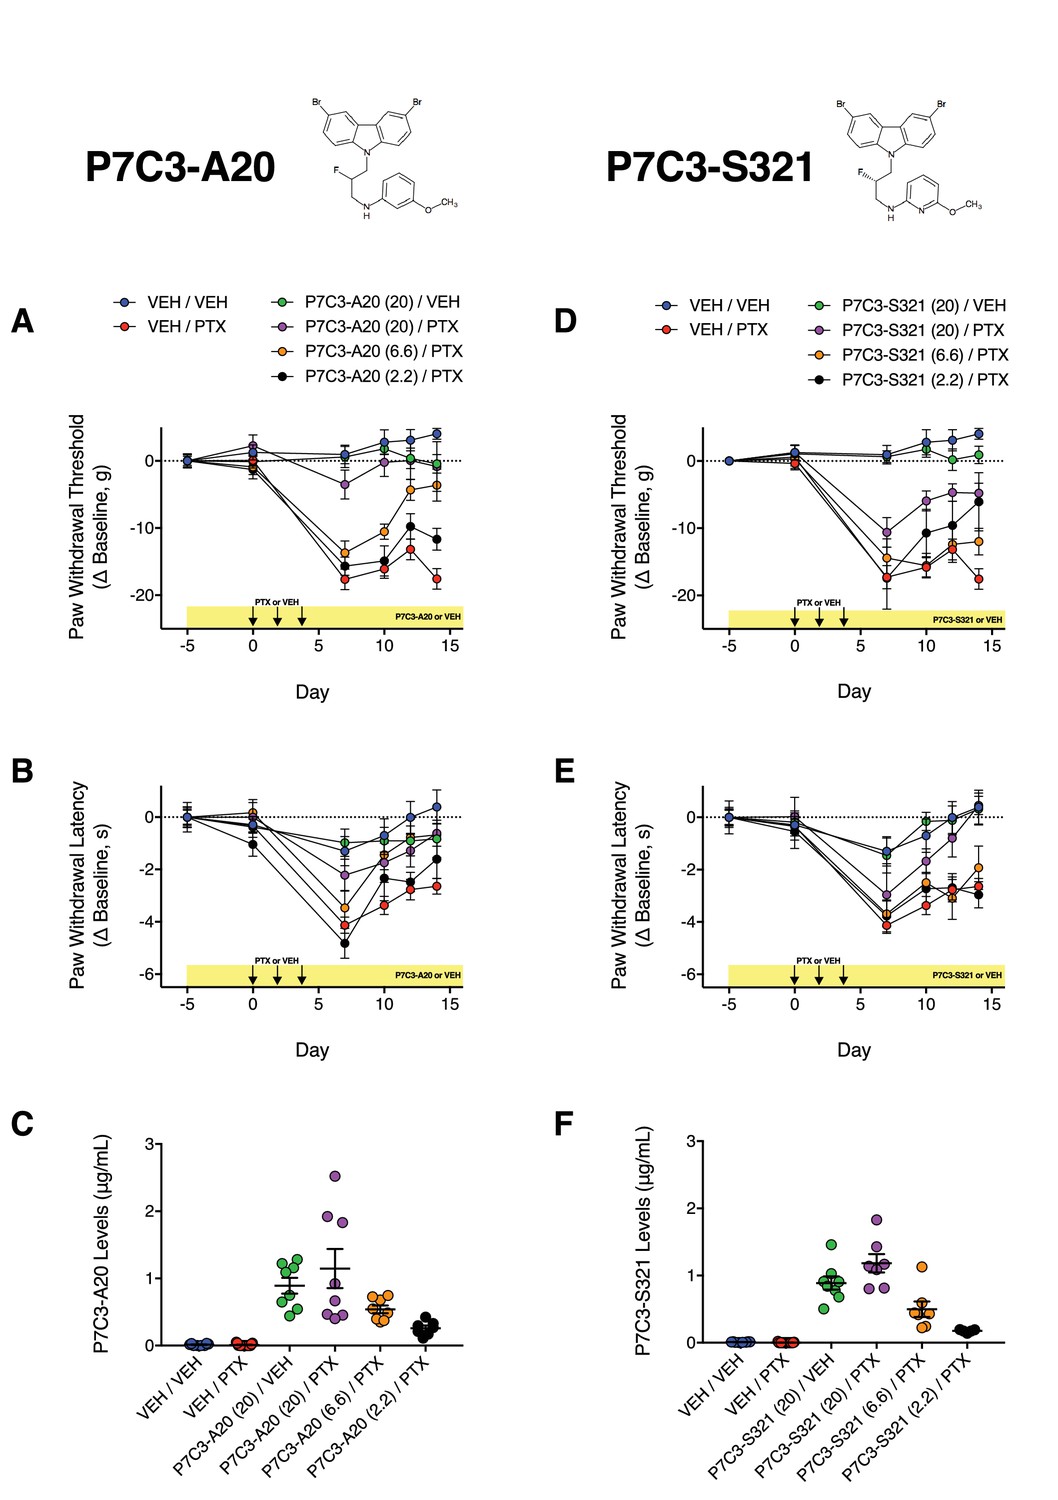
Dose-dependent effects of P7C3-A20 and P7C3-S321 on PTX-induced mechanical and cold allodynia.
(A and B) Timecourse of changes in paw nociceptive thresholds of rats treated with P7C3-A20 to mechanical (A) and cold (B) stimuli. (D and E) Timecourse of changes in paw nociceptive thresholds of rats treated with P7C3-S321 to mechanical (D) and cold (E) stimuli. (C and F) Plasma levels of P7C3-A20 (C) and P7C3-S321 (F). Plasma was acquired 16 hr after the final injection on day 16. Data are expressed as mean ±SEM, n = 7–17 rats/group. Drug doses (mg/kg/day) are indicated by numbers in parentheses.
Figure 3—figure supplement 2
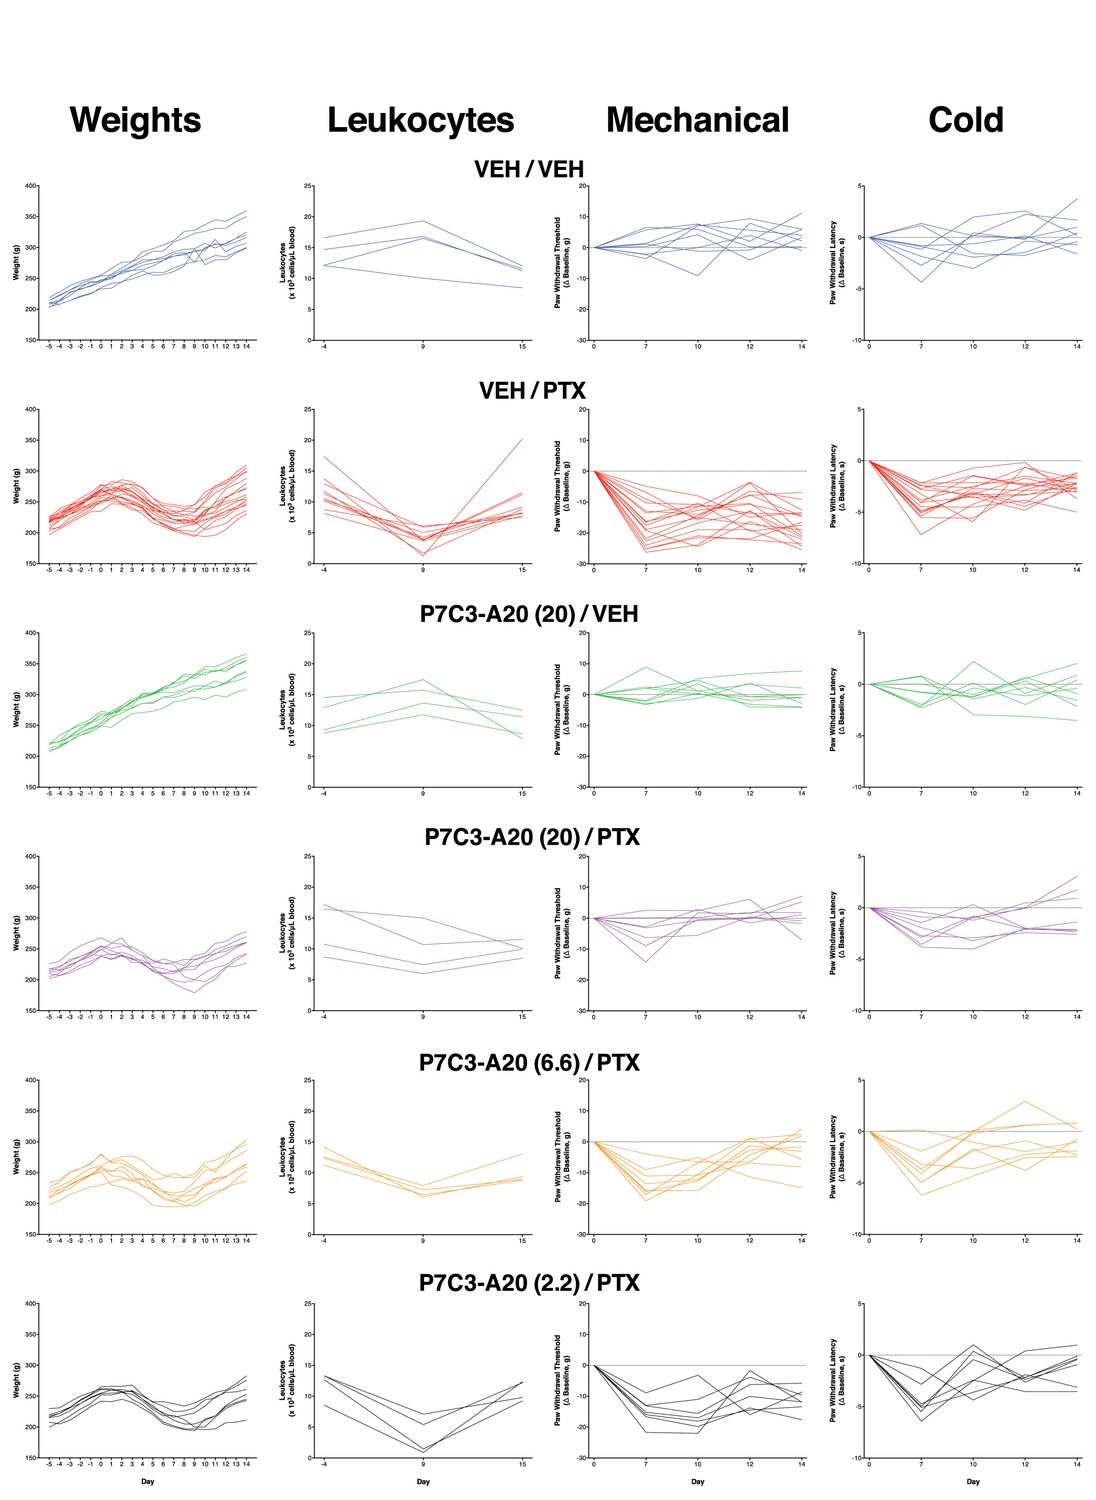
Body weight, leukocyte counts, mechanical thresholds, and cold thresholds of all individual rats treated with vehicle or P7C3-A20 ± PTX.
Individual timecourses of paw nociceptive thresholds for all rats in each treatment group in the dose-response experiment. Each treatment group is represented by n = 7–17 rats/group (weight, mechanical, cold) or 4 rats/group (leukocytes).
Figure 3—figure supplement 3

Effects of P7C3-A20 and P7C3-S321 on PTX-induced weight loss and leukopenia.
(A and B) A maximal dose of P7C3-A20 (20 mg/kg/day) did not alter PTX-induced weight loss (A), but partially reduced leukopenia (B). (C and D) P7C3-S321 did not alter PTX-induced body weight loss (C) or leukopenia (D). Data are expressed as mean ± SEM, n = 7–17 rats/group (weight) or 4 rats/group (leukocyte counts). ****p<0.0001 vs. Veh/PTX by two-way ANOVA with Sidak’s post-hoc test.
Figure 3—figure supplement 4
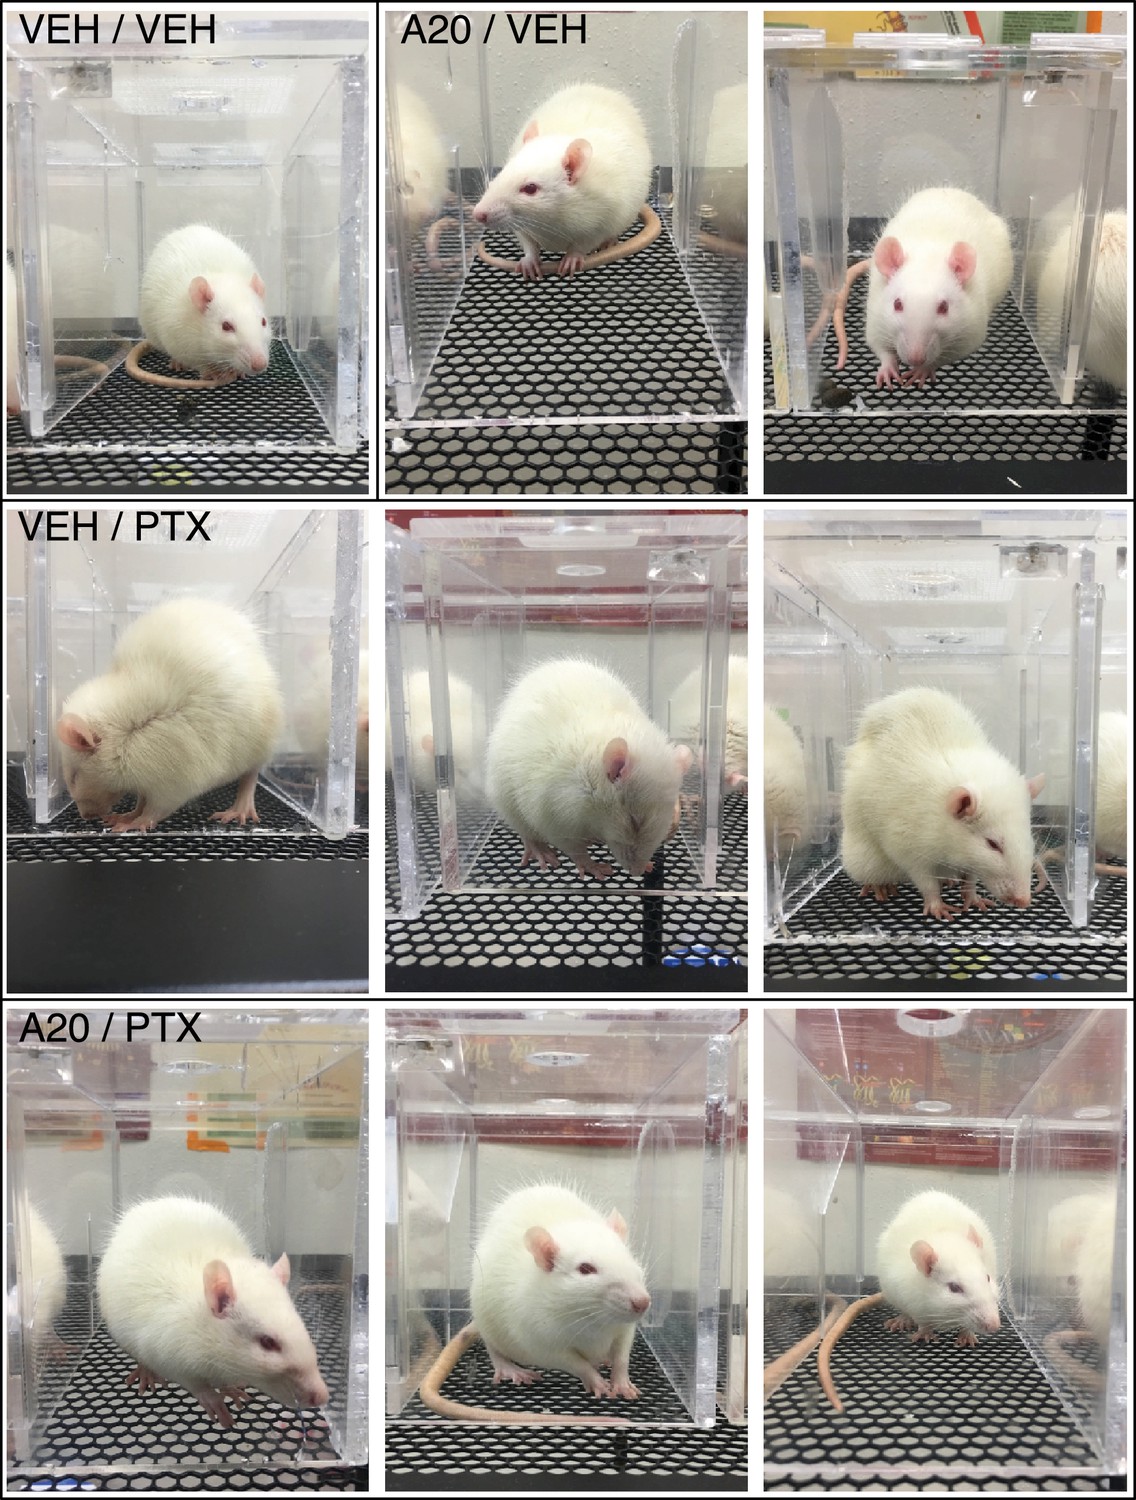
P7C3-A20 improved general health of PTX-treated rats.
Rats treated with vehicle or P7C3-A20 alone (top row) exhibited no overt signs of toxicity. The general health on day 7 of rats treated with PTX alone (middle row) was poor, with increased observations of diarrhea, mild hair loss, chromodacryorrhea, piloerection, grimacing, reduced grooming, standing/walking on ‘tip-toes,’ paw hovering, and jump responses. Comparatively, health indices for rats co-treated with P7C3-A20 and PTX (bottom row) were improved (see also Table 1).
Figure 4 with 1 supplement
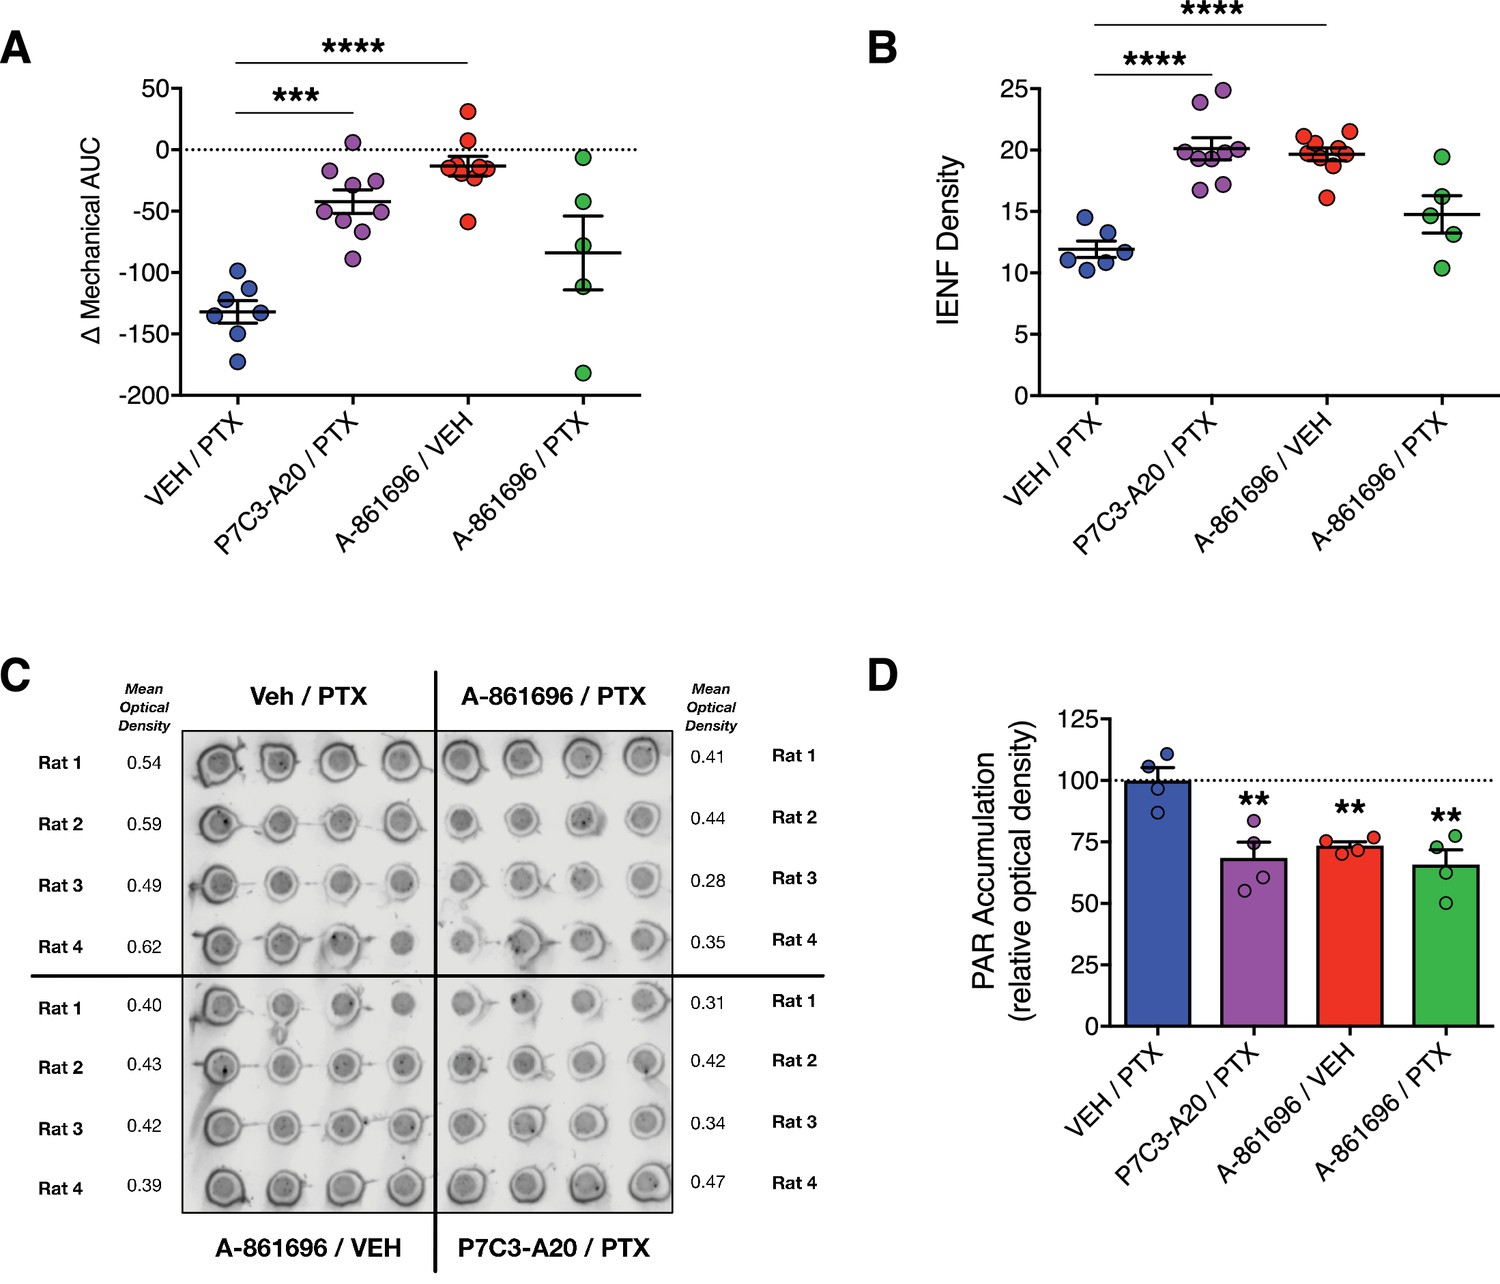
Inhibition of PARP does not prevent PTX-induced peripheral neuropathy in rats.
(A) Mechanical AUCs of rats treated with vehicle, P7C3-A20 (20 mg/kg/day, i.p.), or A-861696 (50 mg/kg/day, i.p.). Horizontal lines represent mean AUC ±SEM calculated from individual rat AUC values shown as small circles. (B) IENF densities from hindpaw biopsies collected on day 12. Horizontal lines represent the mean ±SEM calculated from individual rat IENF densities from each group (circles), n = 5–9 rats/group. (C and D) Dot-blot analysis of poly(ADP-ribose) (PAR) accumulation in lumbar DRG neurons of rats treated with PTX and either vehicle, P7C3-A20, or A-861696. Individual rat DRG homogenates were run in quadruplicate and the relative optical density was calculated for each rat. Bars represent the mean ±SEM, n = 4 rats/group. ****p<0.0001, ***p<0.001, **p<0.01 vs. Veh/PTX by one-way ANOVA with Dunnett’s post-hoc test (A, B, D).
Figure 4—figure supplement 1
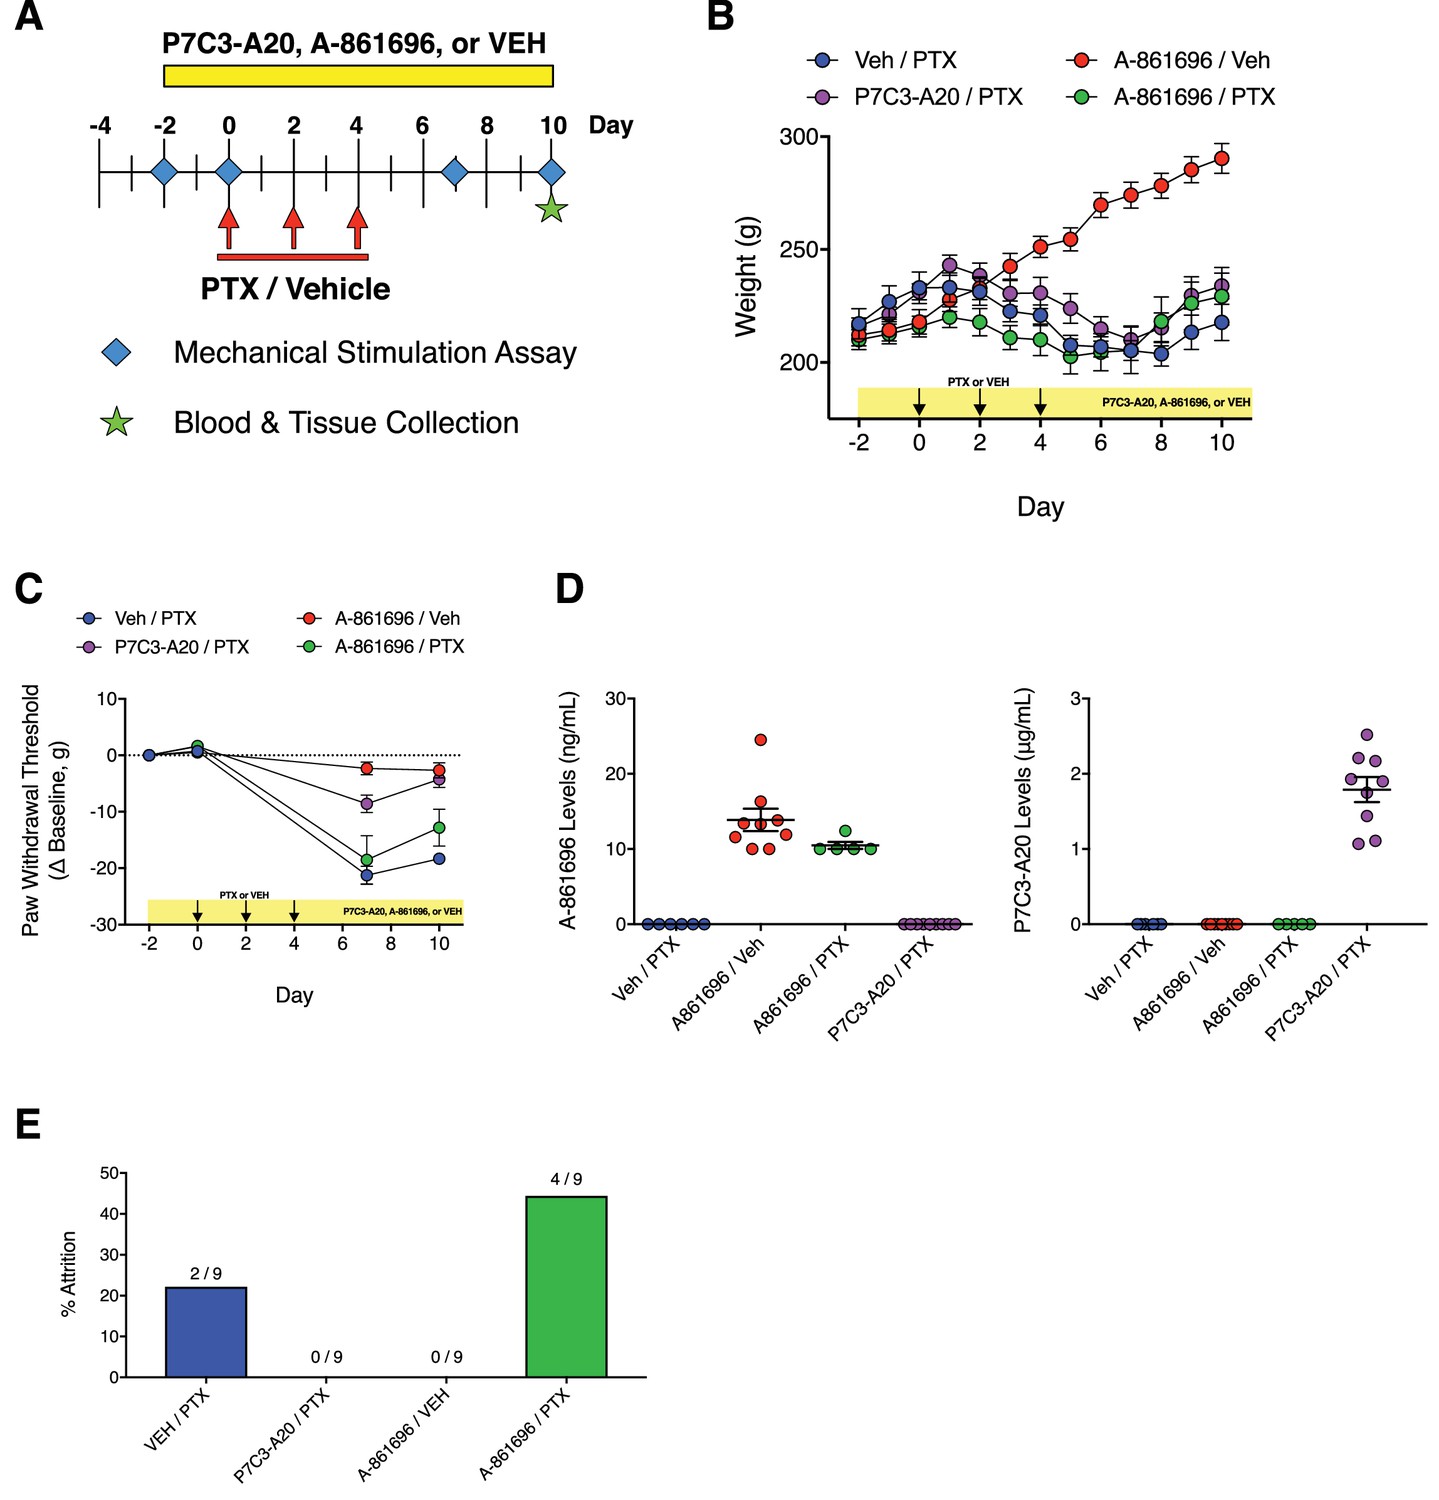
Comparison of the effects of P7C3-A20 and A-861696 (PARP inhibitor) on PTX-induced peripheral neuropathy.
(A) Diagram of the experimental paradigm that shows the daily injection schedule with either P7C3-A20 or A-861696 and PTX or vehicle. (B) Timecourse of changes in body weight from each treatment group. (C) Timecourse of changes in paw withdrawal threshold to mechanical stimulation in rats treated with PTX and either P7C3-A20 (20 mg/kg/day; i.p.) or the PARP inhibitor A-861696 (50 mg/kg/day, i.p.). P7C3-A20, but not A-861696, prevented PTX-induced mechanical allodynia. (D) Plasma levels of A-861696 or P7C3-A20 (determined by LC-MS/MS) in treated rats 16 hr after the final injection. (E) Study attrition by treatment group.
Figure 5 with 2 supplements
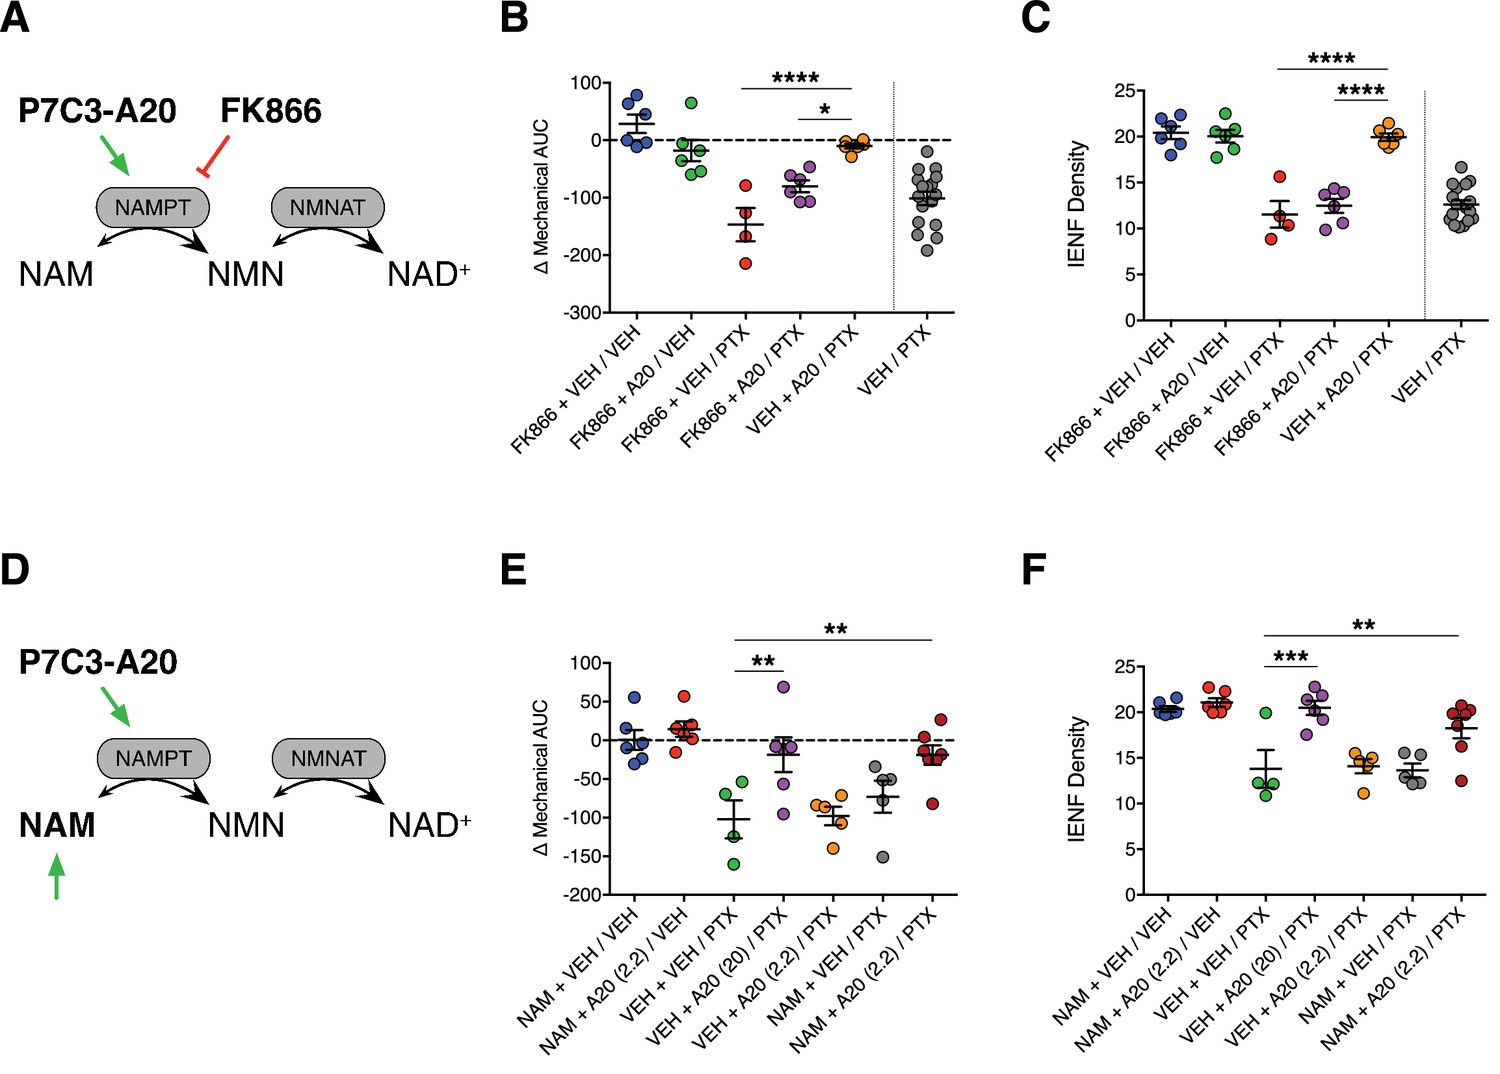
Stimulation of NAMPT is required to prevent PTX-induced damage to peripheral nociceptive neurons.
(A) FK866 (0.5 mg/kg, i.p., b.i.d.) was injected in rats to antagonize NAMPT stimulation by P7C3-A20 (10 mg/kg/day, i.p.) in response to PTX. (B) Individual rat mechanical AUCs. (C) IENF densities from hindpaw biopsies collected on day 12. Horizontal lines represent the mean ±SEM calculated from individual rat AUCs or IENF densities in each treatment group shown as small circles. ****p<0.0001, *p<0.05 vs. Veh + A20/PTX by one-way ANOVA with Sidak’s post-hoc test, n = 4–6 rats/group. (D) Exogenous NAM (150 mg/kg/day, s.c.) was administered to potentiate an ineffective dose of P7C3-A20 (2.2 mg/kg/day, i.p.) against PTX. (E and F). Scatter plots of mechanical AUCs (E) and IENF densities (F). ***p<0.001, **p<0.01 vs. Veh + Veh/PTX by one-way ANOVA with Sidak’s post-hoc test, n = 4–7 rats/group.
Figure 5—figure supplement 1
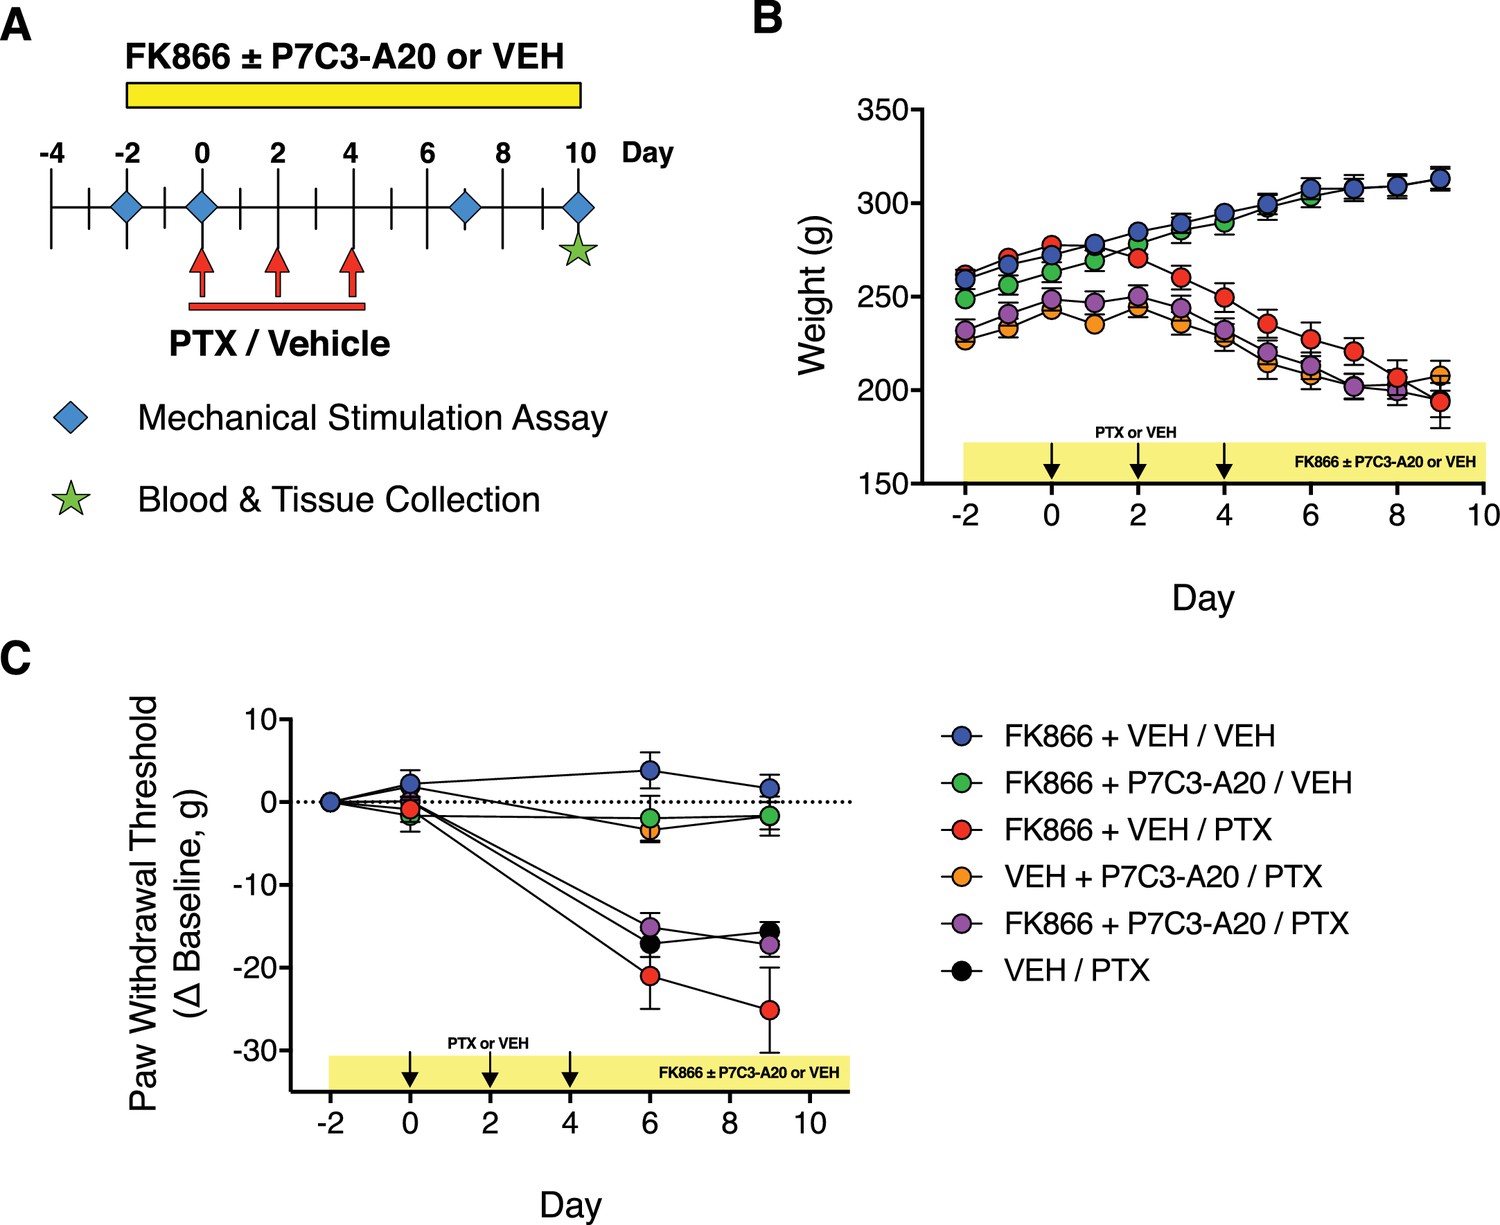
Inhibition of NAMPT with the selective inhibitor, FK866.
(A) Diagram of the experimental paradigm indicating treatment of rats with PTX or vehicle, P7C3-A20 (10 mg/kg/day, i.p.) or vehicle, and the NAMPT inhibitor, FK866 (0.5 mg/kg, b.i.d., i.p.) or vehicle. (B) Timecourse of changes in body weight following treatment. (C) Timecourse of changes in paw withdrawal threshold to mechanical stimulation in each treatment group. Data are expressed as mean ± SEM, n = 5–8 rats/group.
Figure 5—figure supplement 2
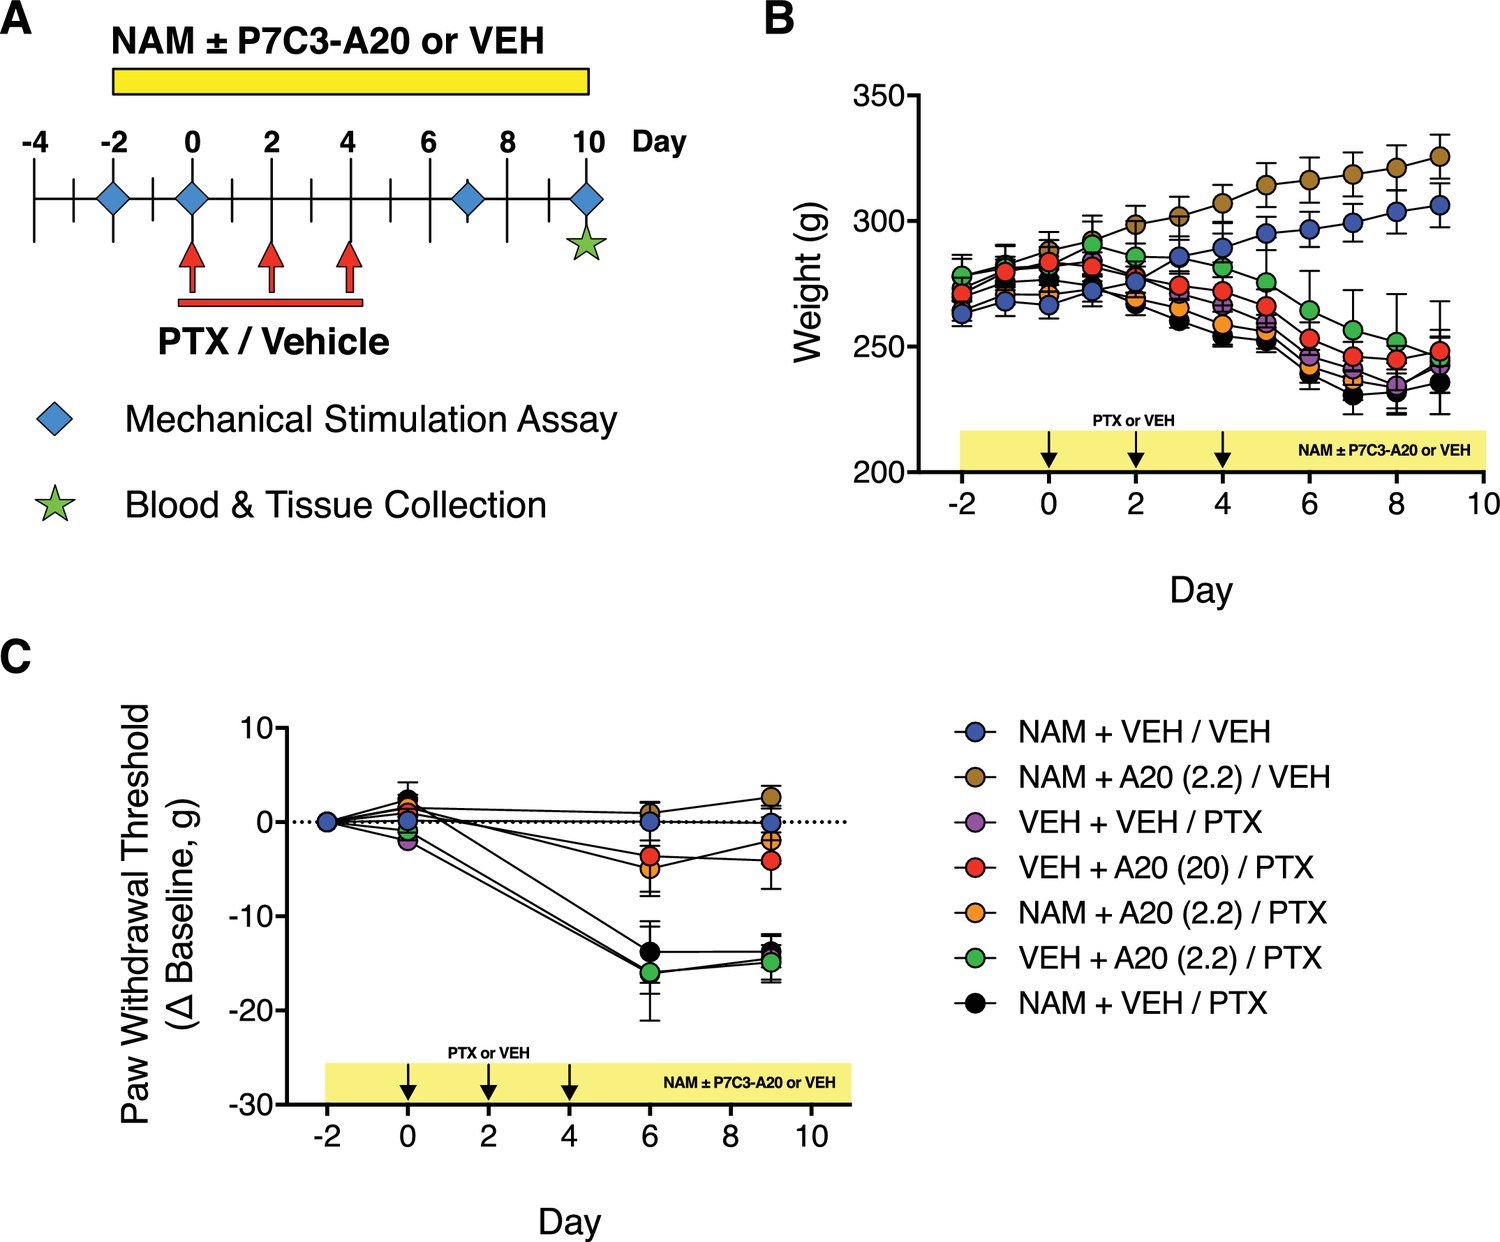
Modulation of NAMPT with its substrate, nicotinamide (NAM).
(A) Diagram of the experimental paradigm indicating treatment of rats with PTX or vehicle, P7C3-A20 (2.2 or 20 mg/kg/day, i.p.) or vehicle, and NAM (150 mg/kg, s.c.) or vehicle. (B) Timecourse of changes in body weight following treatment. (C) Timecourse of changes in paw withdrawal threshold to mechanical stimulation in each treatment group. Data are expressed as mean ± SEM, n = 5–9 rats/group.
Figure 6
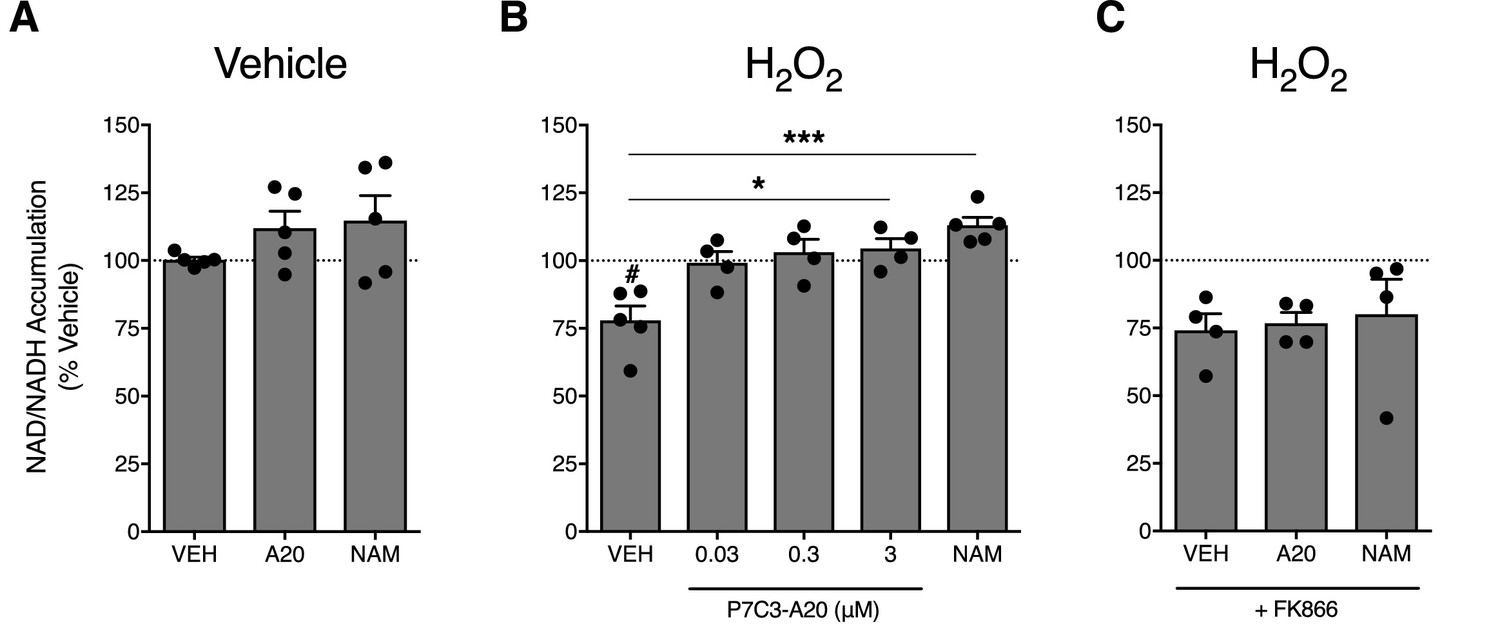
P7C3-A20 stimulates NAD recovery in response to depletion with H2O2 treatment in vitro.
(A) Effects of vehicle, P7C3-A20 (3 μM), or NAM (1 mM) on intracellular NAD production under basal conditions. A1A1 cells were pre-treated with vehicle (30 min) followed by indicated treatment (60 min). (B and C) Effects of vehicle, P7C3-A20, or NAM (1 mM) on intracellular NAD production in response to pretreatment with H2O2 (200 μM, (B). FK866 (10 nM) was co-administered with P7C3-A20 (3 μM) or NAM (1 mM) after H2O2 pretreatment (C). Treatment conditions were performed in quadruplicate for each experiment. Bars represent mean NAD accumulation ±SEM expressed as a percentage of vehicle. Circles are mean NAD values from independent experiments. #p<0.05 vs. Veh/Veh or ***p<0.001, *p<0.05 vs. H2O2/Veh by one-way ANOVA with Dunnett’s post-hoc test, n = 4–5 independent experiments.
Figure 7
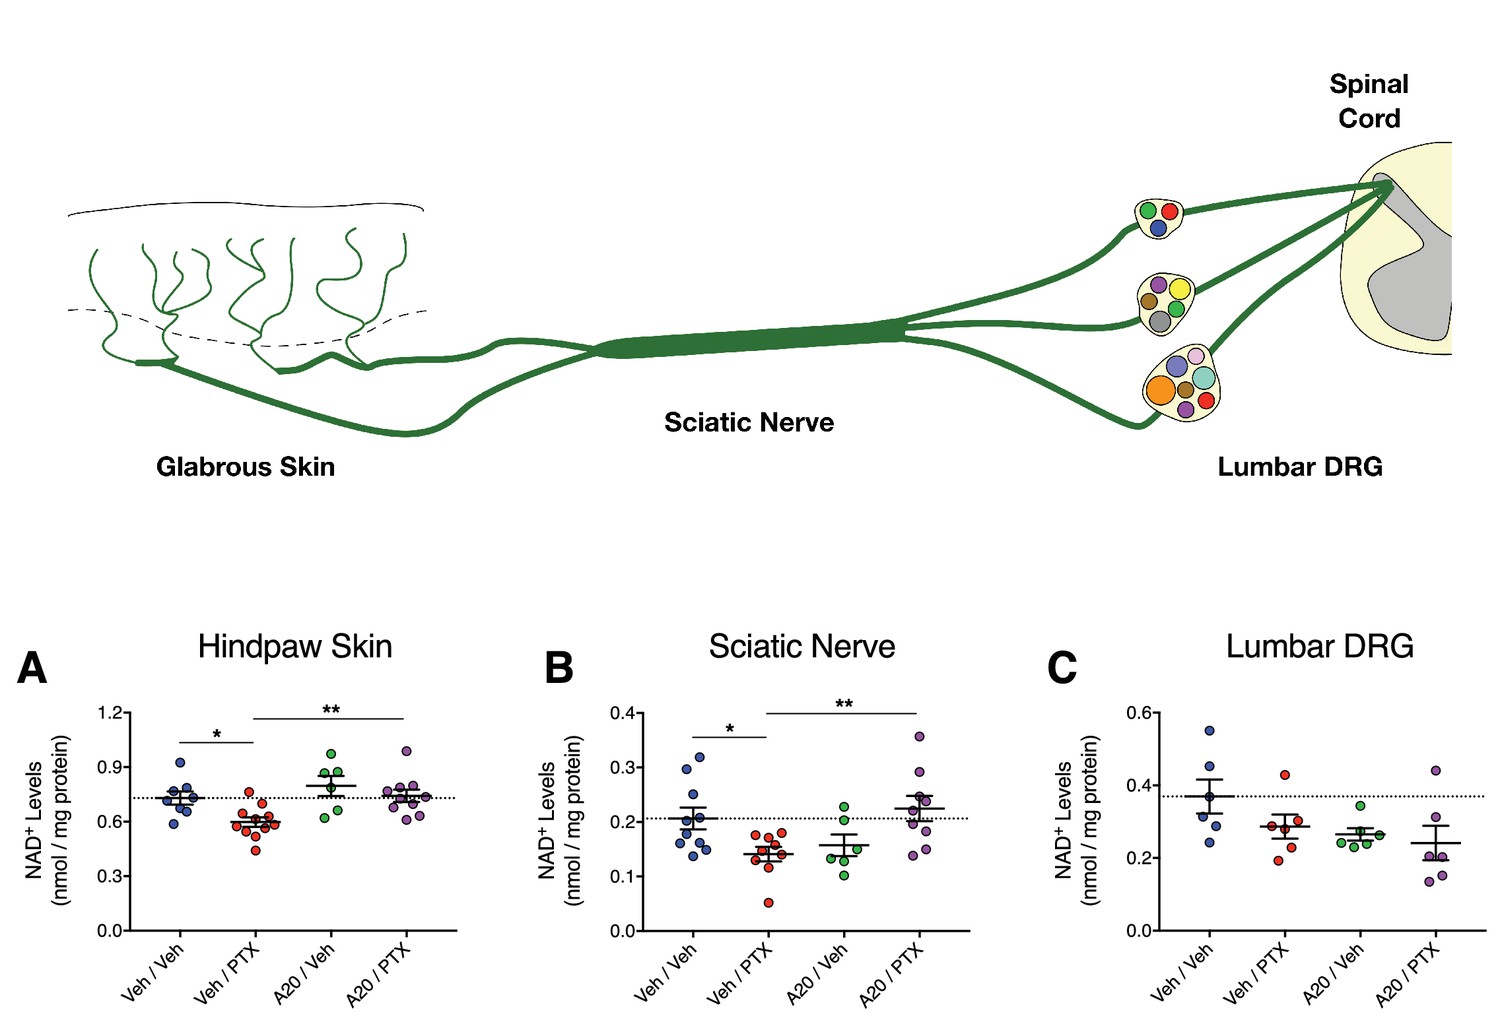
P7C3-A20 stimulates NAD recovery in peripheral neurons damaged by PTX in vivo.
(A–C) Tissue NAD+ levels in glabrous hindpaw skin (A), sciatic nerve (B), and lumbar DRG (C) collected from treated rats on day 10 of the experimental paradigm. As before, rats were treated daily with P7C3-A20 (20 mg/kg/day; i.p.) or vehicle beginning on day −2 through day 9, with PTX (11.7 mg/kg, i.p.) or vehicle injected on days 0, 2, and 4. On day 10, tissue samples were collected for homogenization and subsequent metabolite analysis using the NAD/NADH-Glo Assay (Promega, Madison, WI). Tissue NAD+ levels were normalized to total protein content. Bars identify the mean metabolite levels (nmol/mg protein)±SEM for each treatment group. Circles represent individual rat tissue NAD+ levels. **p<0.01, *p<0.05 vs. specified group by one-way ANOVA with Sidak’s post-hoc test, n = 6–11 tissue samples/group.
Figure 8 with 2 supplements
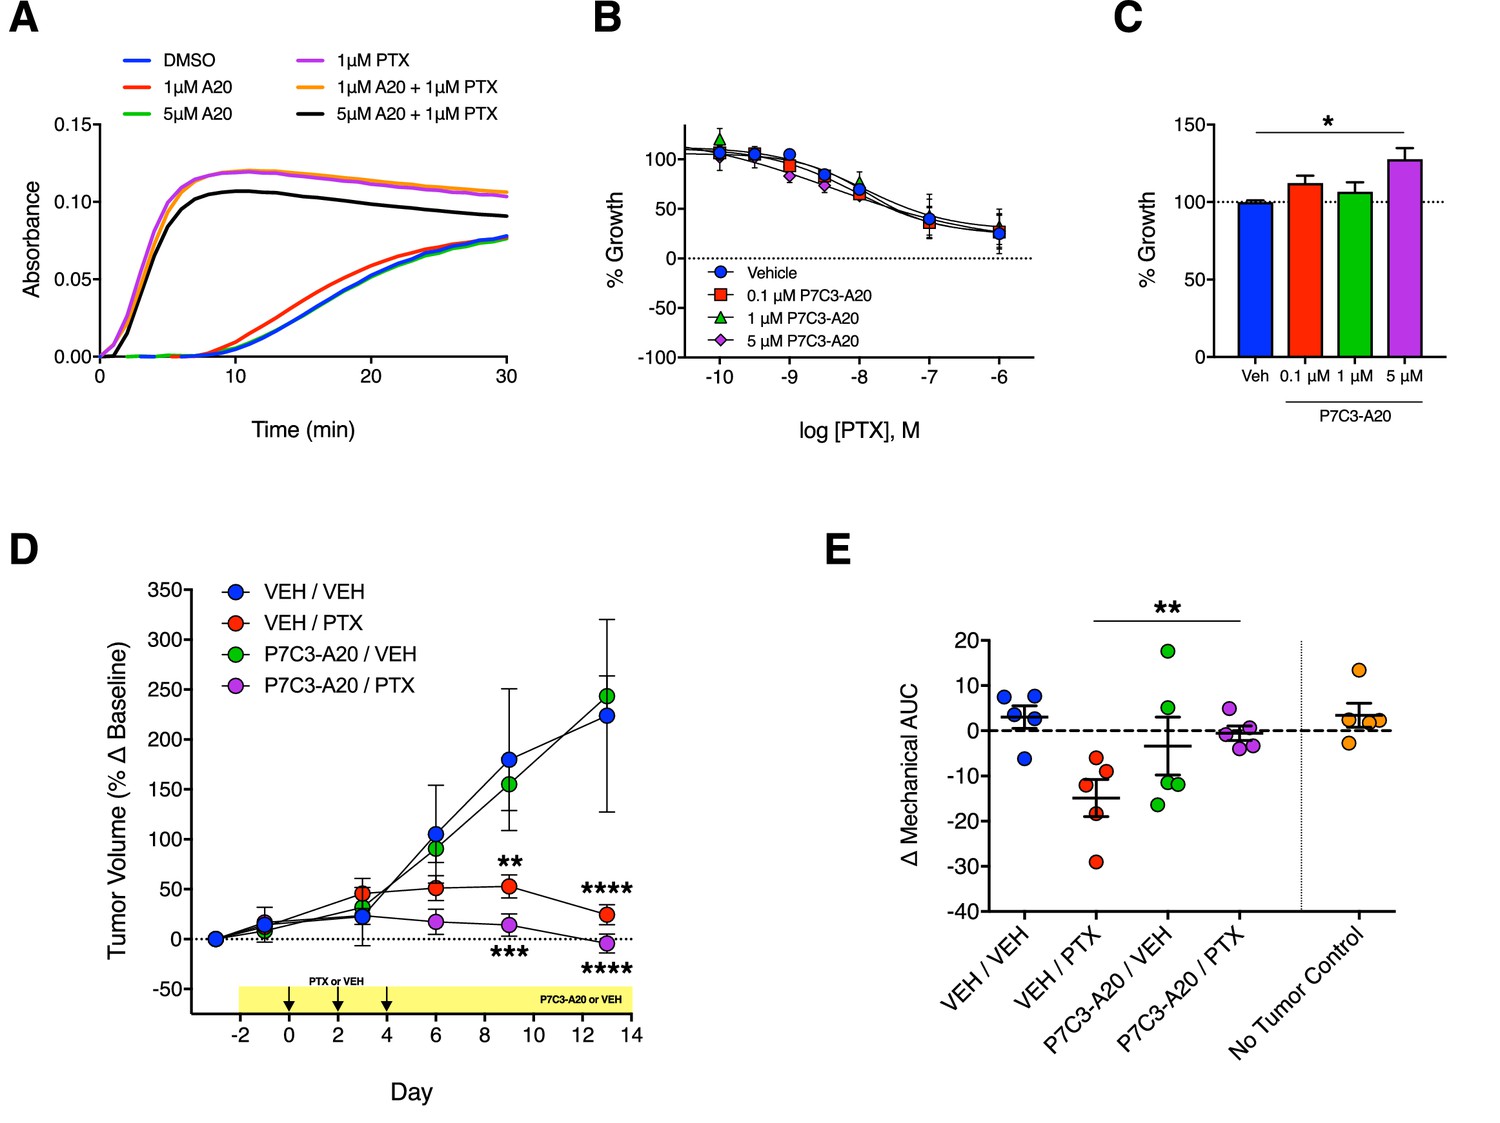
Antitumoral efficacy of PTX is maintained in the presence of P7C3-A20.
(A) Tubulin polymerization curves corresponding to addition of P7C3-A20 with and without PTX (n = 3 independent experiments). (B) Concentration-dependent anti-proliferation of PTX (48 hr) in MDA-MB-231 breast cancer cells pretreated (1 hr) with vehicle or P7C3-A20 (0.1–5 μM). (C) Effects of P7C3-A20 treatment only on growth of MDA-MB-231 cells. *p<0.05 vs. Veh by one-way ANOVA followed by Dunnett’s post-hoc test, n = 3 independent experiments. (D) Timecourse of changes in MDA-MB-231 tumor volumes in female athymic nude mice treated with P7C3-A20 (20 mg/kg/day, i.p.) or vehicle and PTX (11.7 mg/kg, i.p.) as indicated. ****p<0.0001, ***p<0.001, **p<0.01 vs. Veh/Veh by two-way mixed-effect ANOVA with Dunnett’s post-hoc test, n = 8–9 tumors/group. (E) Mechanical AUCs from tumored mice. Control mice lacking tumors were tested concurrently with the tumored mice. **p<0.01 by one-way ANOVA followed by Sidak’s post-hoc test, n = 5 mice/group.
Figure 8—figure supplement 1
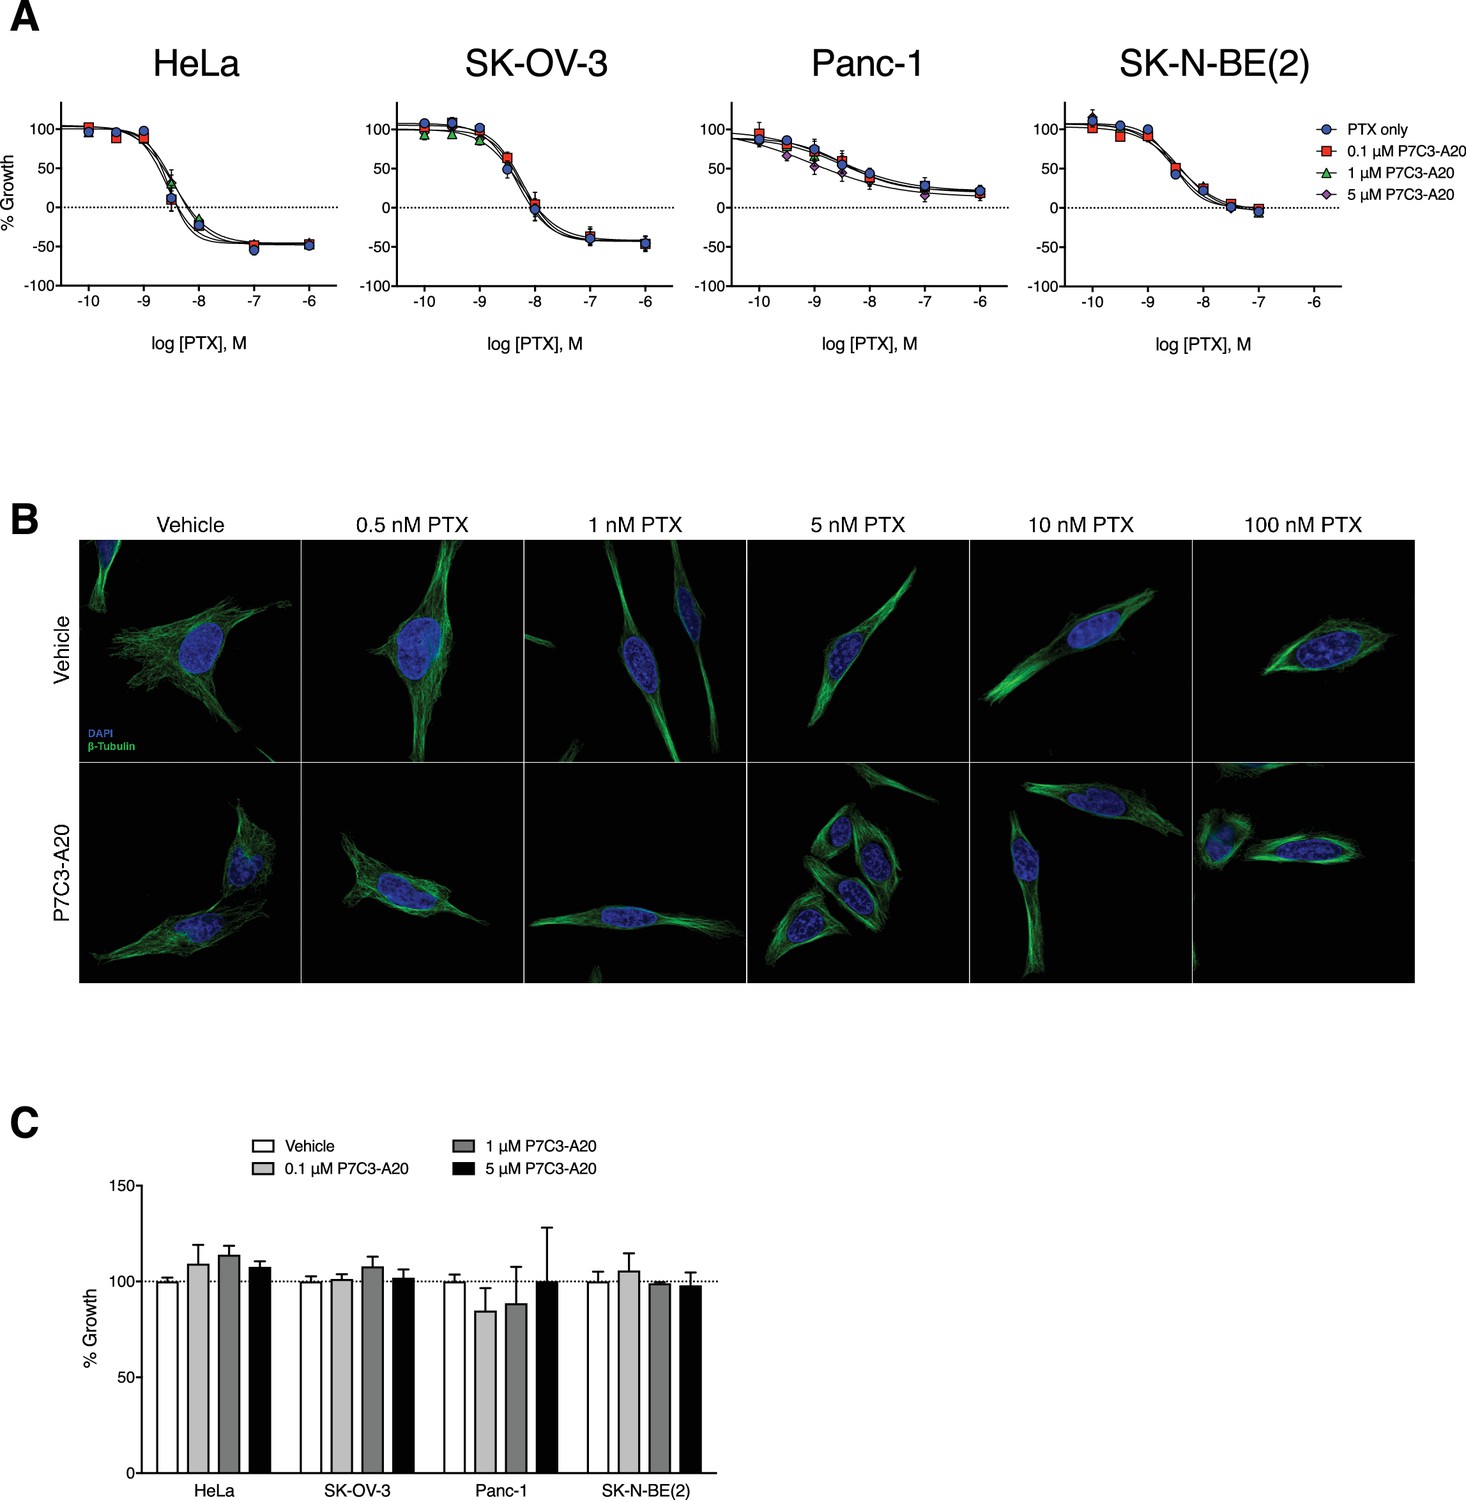
P7C3-A20 does not alter the anti-proliferative or microtubule-stabilizing capacity of PTX in vitro.
(A) Effect of various concentrations of P7C3-A20 on concentration-response curves for PTX to inhibit growth of several cancer cell lines with distinct genetic backgrounds. P7C3-A20 did not alter the potency or efficacy of PTX to inhibit growth. Cells were treated for 48 hr and cell growth was determined with the SRB assay. (B) P7C3-A20 did not alter the formation of perinuclear microtubule bundles by PTX. Immunofluorescent images of MDA-MB-231 cells pretreated with P7C3-A20 (5 μM) or vehicle for 1 hr followed by various concentrations of PTX or vehicle for an additional 4 hr and then stained for β-tubulin. (C) Effect of P7C3-A20 on the growth of various cancer cell lines. P7C3-A20 had no effect on the growth of the cell lines tested. Cells were incubated with P7C3-A20 (0.1–5 μM) or vehicle for 48 hr. Growth was monitored with the SRB assay.
Figure 8—figure supplement 2
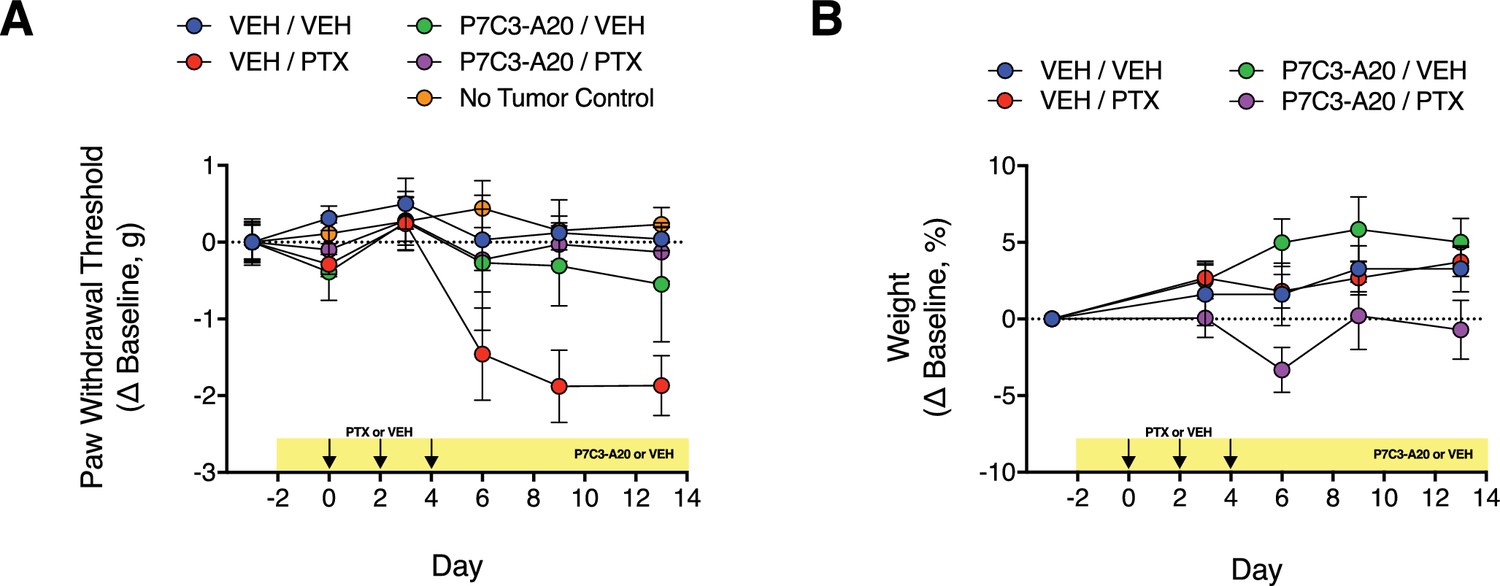
Effect of P7C3-A20 on PTX-induced mechanical allodynia and body weight in mice with implanted MDA-MB-231 tumor xenografts.
(A) Athymic nude mice received bilateral injections into both flanks with MDA-MB-231 cells. When tumors reached at least 250 mm3, mice were treated with P7C3-A20 (20 mg/kg/day; i.p.) or vehicle beginning on day −2. PTX (11.7 mg/kg, i.p.) or vehicle was injected on days 0, 2, and 4. Paw withdrawal threshold to mechanical stimulation of the hindpaw were measured on indicated days before and after PTX treatment. P7C3-A20 abolished the development of PTX-induced mechanical allodynia in tumored mice. The xenografts did not alter mechanical paw withdrawal threshold as indicated by the lack of difference between the responses from mice with or without implanted tumors. (B) Neither P7C3-A20 nor PTX affected the body weight of tumored mice. Data are expressed as mean ± SEM, n = 5 mice/group.
Tables
Table 1
Summary of general health observations in rats treated with P7C3-A20, P7C3-S321, or vehicle ±PTX
https://doi.org/10.7554/eLife.29626.012| General health observations | VEH/VEH [n = 8] | VEH/PTX [n = 20] | A20 (20)/VEH [n = 8] | A20 (20)/PTX [n = 8] | A20 (6.6)/PTX [n = 8] | A20 (2.2)/PTX [n = 8] | S321 (20)/VEH [n = 8] | S321 (20)/PTX [n = 8] | S321 (6.6)/PTX [n = 8] | S321 (2.2)/PTX [n = 8] |
|---|---|---|---|---|---|---|---|---|---|---|
| Gnawing on observation box | - | 7 | - | - | 1 | 2 | - | 1 | - | - |
| Diarrhea | - | 9 | - | 2 | 4 | 5 | - | 4 | 4 | 4 |
| Mild hair loss | - | 14 | - | 3 | 5 | 6 | - | 5 | 6 | 6 |
| Hind limb paralysis | - | - | - | - | - | - | - | - | - | - |
| Chromo-dacryorrhea | - | 10 | - | - | - | 1 | - | 1 | 1 | 3 |
| Standing/walking on ‘Tip-Toes’ | - | 17 | - | 2 | 4 | 5 | - | 2 | 5 | 5 |
| Hovering paw | - | 4 | - | - | 1 | 2 | - | - | - | 1 |
| Jump response | - | 5 | - | 1 | 2 | 2 | - | 2 | 2 | 1 |
| Death | - | 3 | - | - | - | 1 | - | 1 | 1 | 3 |
-
Numbers in parentheses next to the drug name indicate the daily dose in mg/kg.
Numbers in the table represent the number of rats that displayed the health indicator in the row title. “- “indicates 0 rats displayed the health indicator. Total number of rats in the group are shown in the column title row.
Key resources table
| Reagent type (species) or resource | Designation | Source or reference | Identifiers | Additional information |
|---|---|---|---|---|
| cell line (human) | HeLa | ATCC | ATCC Cat# CRM-CCL-2; RRID:CVCL_0030 | Cell line maintained in A. Risinger lab. Authenticated by STR profiling (Genetica). |
| cell line (human) | Panc-1 | ATCC | ATCC Cat# CRL-1469; RRID:CVCL_0480 | Cell line maintained in A. Risinger lab. Authenticated by STR profiling (Genetica). |
| cell line (human) | MDA-MB-231 | ATCC | ATCC Cat# CRM-HTB-26; RRID:CVCL_0062 | Cell line maintained in A. Risinger lab. Authenticated by STR profiling (Genetica). |
| cell line (human) | SK-OV-3 | ATCC | ATCC Cat# HTB-77; RRID:CVCL_0532 | Cell line maintained in A. Risinger lab. Authenticated by STR profiling (Genetica). |
| cell line (human) | SK-N-BE(2) | ATCC | ATCC Cat# CRL-2271; RRID:CVCL_0528 | Cell line maintained in A. Risinger lab. Authenticated by STR profiling (Genetica). |
| cell line (rat) | A1A1 | PMID:8190100 | Cell line maintained in W. Clarke lab | |
| antibody | anti-PGP9.5 (mouse monoclonal) | Encor Biotechnology | EnCor Biotechnology Cat# MCA-BH7-AP; RRID:AB_2572395 | (1:1000) |
| antibody | anti-collagen type IV (goat polyclonal) | Southern Biotechnology | Southern Biotechnology Cat# 1340–01 | (1:200) |
| antibody | anti-ATF3 (rabbit polyclonal) | Santa Cruz Biotechnology | Santa Cruz Biotechnology Cat# sc-188; RRID:AB_2258513 | (1:400) |
| antibody | anti-NeuN (mouse monoclonal) | Millipore (Chemicon) | Millipore Cat# MAB377; RRID:AB_2298772 | (1:250) |
| antibody | anti-poly(ADP-ribose)10 hr (mouse monoclonal) | Enzo Life Sciences | Enzo Life Sciences Cat# ALX-804–220, RRID:AB_2272987 | (1:300) |
| antibody | anti-β-tubulin (mouse monoclonal) | Sigma | Sigma Cat# T8328; RRID:AB_1844090 | (1:400) |
| antibody | anti-mouse Alexa Fluor 488 secondary (donkey polyclonal) | Jackson ImmunoResearch | Jackson ImmunoResearch Code# 715-545-150 | (1:500) |
| antibody | anti-rabbit Alexa Fluor 594 secondary (donkey polyclonal) | Jackson ImmunoResearch | Jackson ImmunoResearch Code# 711-585-152 | (1:500) |
| antibody | anti-goat Alexa Fluor 594 secondary (donkey polyclonal) | Jackson ImmunoResearch | Jackson ImmunoResearch Code# 705-585-147 | (1:500) |
| antibody | anti-mouse IRDye 800CW secondary (goat polyclonal) | LI-COR Biosciences | LI-COR Biosciences Cat# 827–08364; RRID:AB_10793856 | (1:10,000) |
| antibody | anti-mouse FITC secondary (sheep polyclonal) | Sigma | Sigma Cat# F6257; RRID:AB_259692 | (1:200) |
| other | DAPI stain | Sigma (Roche) | Sigma Cat# 10236276001 | (0.1 μg/ml) |
| other | VECTASHIELD HardSet Mounting Medium | Vector Laboratories | Vector Laboratories Cat# H-1400; RRID:AB_2336787 | |
| commercial assay, kit | NAD/NADH-Glo Assay | Promega Corporation | Promega Cat# G9071 | |
| commercial assay, kit | Tubulin polymerization assay, OD based - Porcine | Cytoskeleton, Inc. | Cytoskeleton Cat# BK006P |
Additional files
-
Transparent reporting form
- https://doi.org/10.7554/eLife.29626.023
-
Reporting standard 1
- https://doi.org/10.7554/eLife.29626.024
Download links
A two-part list of links to download the article, or parts of the article, in various formats.
Downloads (link to download the article as PDF)
Open citations (links to open the citations from this article in various online reference manager services)
Cite this article (links to download the citations from this article in formats compatible with various reference manager tools)
Pharmacological augmentation of nicotinamide phosphoribosyltransferase (NAMPT) protects against paclitaxel-induced peripheral neuropathy
eLife 6:e29626.
https://doi.org/10.7554/eLife.29626


