Intrinsic adaptive value and early fate of gene duplication revealed by a bottom-up approach
- CSIC – UPV, Spain
- CSIC – UV, Spain
- University of Dublin, Ireland
Figures
Figure 1
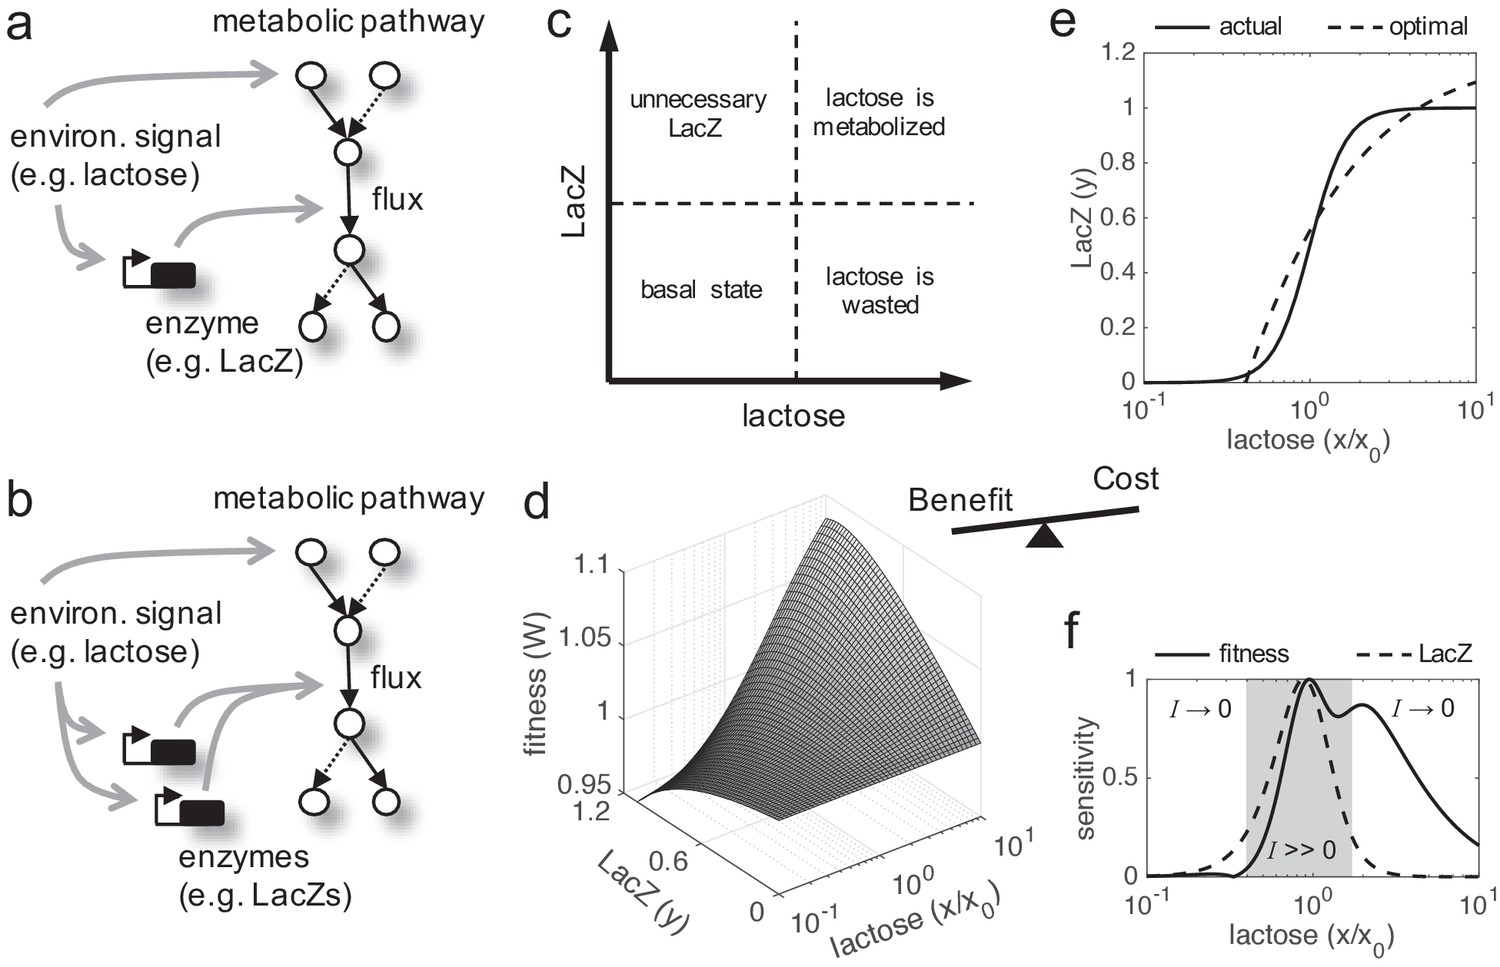
Fitness trade-off related to metabolic benefit and expression cost.
(a) Scheme of a paradigmatic genetic system, coupling regulation and metabolism, where a given environmental signal determines the physiology of the cell. The environmental molecule can be metabolized by the cell, and it can also activate transcriptionally the expression of enzymes. A particular case is the lactose utilization system of E. coli. (b) Scheme of the same system with gene duplication. (c) Illustrative chart of the fitness trade-off showing four different cellular regimes. When the signal molecule (lactose) is not present in the medium, the expression of the enzyme (LacZ) is not required. However, when the signal molecule is present, the enzyme is required for its metabolic processing. (d) Fitness (W) landscape as a function of lactose (contributing to the benefit, x denotes its concentration) and LacZ (contributing to both the benefit and the cost, y denotes its concentration). This was experimentally determined. x0 denotes the lactose EC50 on LacZ expression, so x/x0 is a normalized lactose concentration. (e) Dose-response curve between lactose and LacZ. The solid line corresponds to the actual regulation (experimentally determined), whilst the dashed line corresponds to a hypothetical optimal regulation (obtained by imposing dW/dy = 0). (f) Sensitivity to changes in lactose dose, either in fitness (dW/dx, solid line) or in LacZ (dy/dx, dashed line), characterizing the nonlinear phenotypic plasticity of the cell. Each curve is normalized by its maximum. This also measures sensitivity to molecular noise. The region where information transfer is high is shaded.
Figure 2
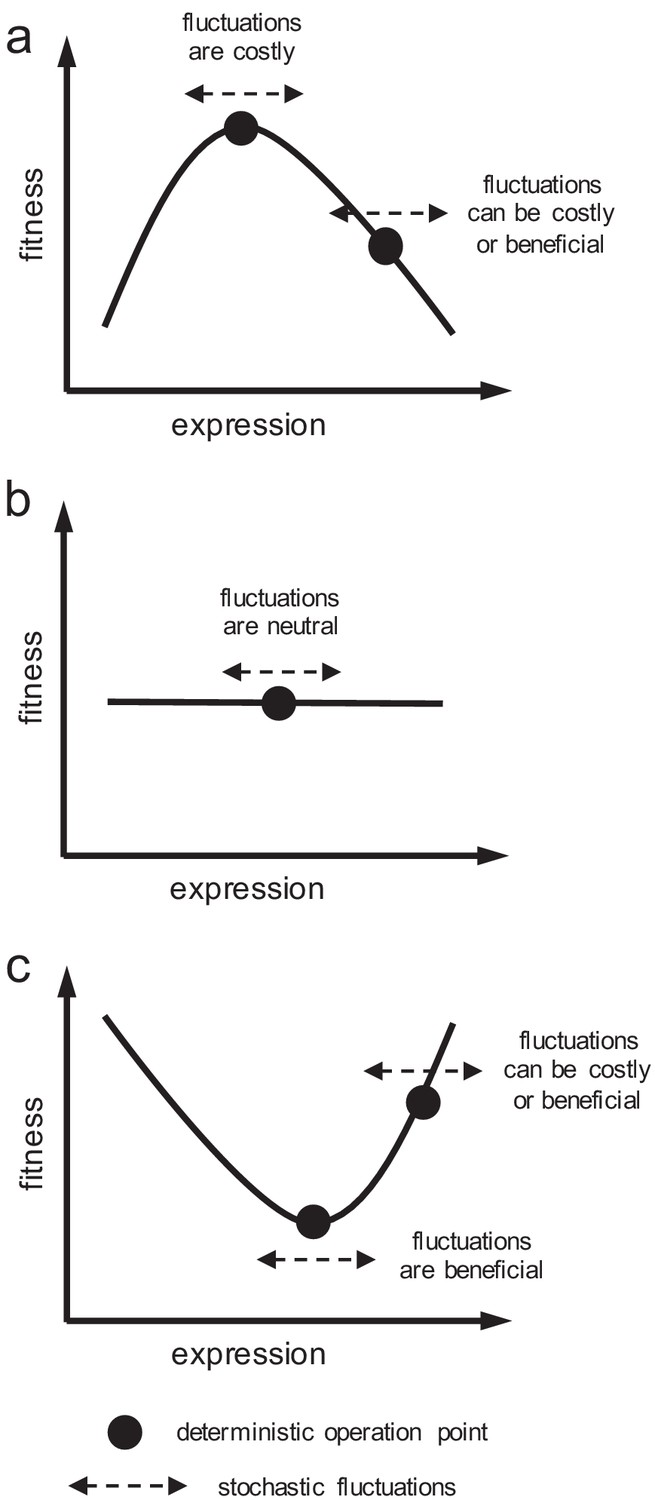
Schematics of cell fitness as a function of gene expression.
Fitness function can (a) present a maximum, (b) be flat, or (c) present a minimum. Depending on the local shape, stochastic fluctuations in expression can be costly, beneficial, or neutral.
Figure 3

Selective advantage of gene duplication.
(a) Block diagram of the system. Gene expression is calculated by means of a stochastic function, whilst fitness by means of a deterministic one. (b, c) Single-cell responses at different lactose doses (stochastic simulations, noise amplitudes of ηin = 0.5 and ηex = 0). Lactose and LacZ concentrations are denoted by x and y, respectively. The solid white line corresponds to the deterministic simulation. In b) the genotype contains a single copy of lacZ gene, whilst in c) it contains two copies. The value of mutual information (I) is shown in both cases: 1.29 bits of information in case of a singleton and 1.58 bits in case of a duplicate (about 25% increase in fidelity, significance assessed by a z-test, p ≈ 0 with 104 points). (d) Selection coefficient (S) of a genotype with two copies of lacZ gene over another with just one copy. The mean selection coefficient is shown (dashed line). Skewness coefficient of 2.63. W values calculated from x, y values shown in b, c). (e) Fitness (W) as a function of LacZ (constant x = 0.2 mM), showing the distributions of expression (boxplots) in case of one or two gene copies. The actual LacZ expression is shown (dashed line). (f) Dose-response curve between lactose concentration and the median LacZ expression (⟨y⟩). The solid lines correspond to the actual responses in case of one (black) or two (gray) gene copies (ηin = 0.5 and ηex = 0), whilst the dashed line corresponds to the optimal response. (g) Mean selection coefficient (⟨S⟩) landscape of gene duplication as a function of the median lactose dose (⟨x⟩, fluctuating dose) and the amplitude of intrinsic noise (ηin, with fixed ηex = 0.3). In all these plots, the expression levels of the duplicates with respect to the singletons are equal (ymax,1 = ymax,2 = 0.5).
Figure 4

In silico evolution experiments.
(a) Scheme of an evolutionary procedure, where serial dilution passages are applied, to assess the performance in a cell population of a genotype with two copies of lacZ gene over another with just one copy. (b) Time-dependent frequency of cells with gene duplication (f). Open circles and error bars correspond to experiments of in silico evolution (mean and standard deviation of three replicates) with an initial frequency of f0 = 0.5, fluctuating lactose dose, and noise levels of ηin = 0.5 and ηex = 0. The solid line corresponds to the theoretical prediction. (c) f at 1000 generations (f1000) as a function of the amplitude of intrinsic noise (ηin). Experiments and prediction with f0 = 0.5 and ηex = 0. The dashed line corresponds to the theoretical prediction with ηex = 1. (d) f1000 as a function of the median lactose dose (⟨x⟩). Experiments and prediction with f0 = 0.5, ηin = 0.5 and ηex = 0.5. (e) f1000 as a function of the lactose fluctuation amplitude (Δx). Δx = 0 corresponds to constant lactose dose. Experiments and prediction with the same values of f0, ηin and ηex as in d). Three replicates were also considered in c, d, e). In all these plots, the expression levels of the duplicates with respect to the singletons are equal (ymax,1 = ymax,2 = 0.5).
Figure 5
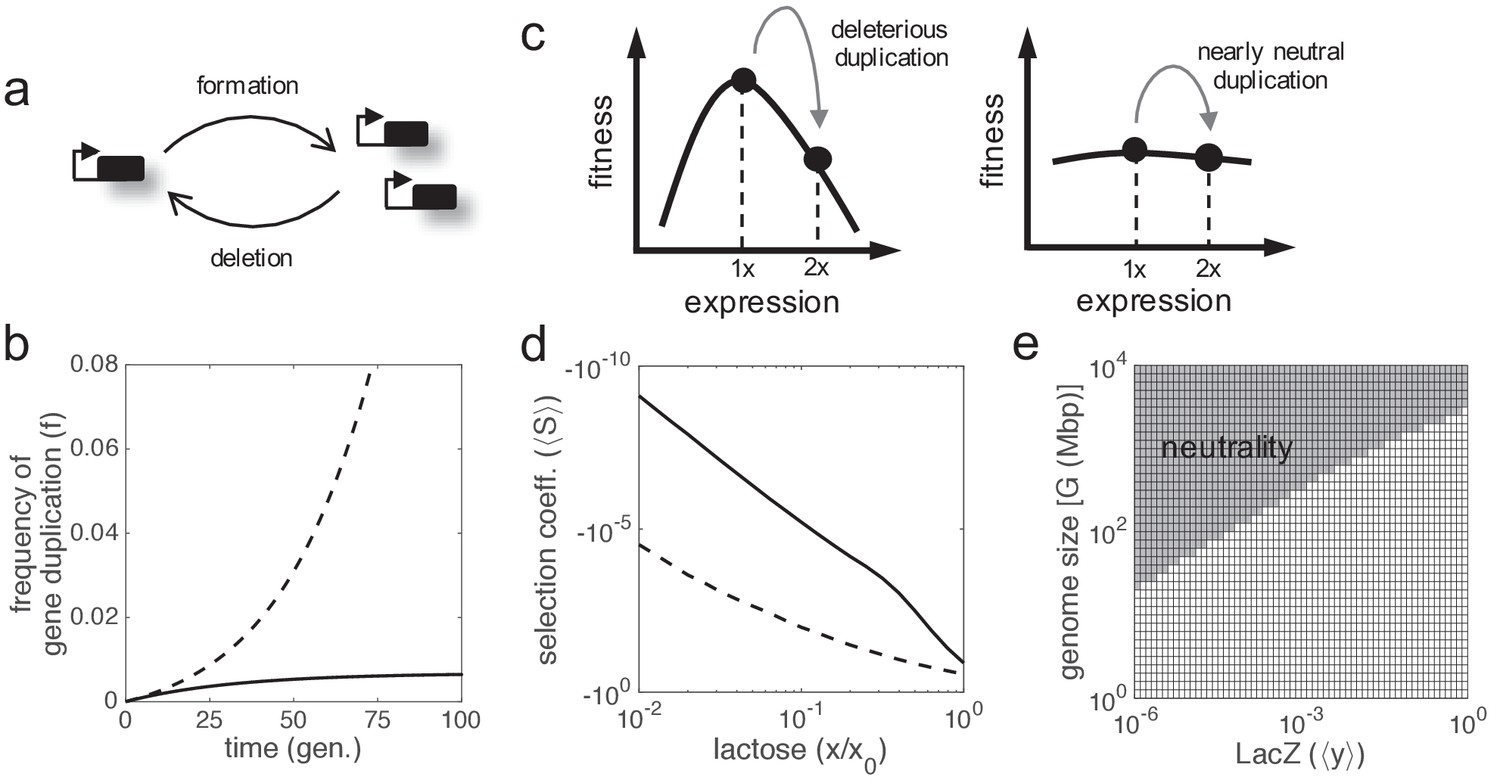
Gene duplication leading to double expression.
(a) Scheme of the formation-deletion balance in gene duplication. (b) Time-dependent frequency of cells with gene duplication (f) when the formation and deletion rates of a second lacZ copy are considered. Sequence remodeling was not taken into account. The solid line corresponds to a scenario of neutrality, whilst the dashed line corresponds to a scenario of positive selection (with S = 10%). (c) Schematics of fitness as a function of expression showing the effect of gene duplication. Two scenarios are considered: deleterious duplication (left; hill-like fitness landscape) and nearly neutral duplication (right; quasi-flat fitness landscape). (d) Mean selection coefficient (⟨S⟩) as a function of lactose dose upon lacZ duplication doubling gene expression (ymax,1 = ymax,2 = 1). The solid line corresponds to noise levels of ηin = ηex = 0.3 (moderate), whilst the dashed line corresponds to ηin = ηex = 1 (high). (e) Identification of effectively neutral selective conditions (when |⟨N⟩·⟨S⟩|<1, region shaded) in terms of gene expression (y) and genome size (G), which determines the effective population size (⟨N⟩). In this context, no benefit was considered (a = 0), with moderate noise levels.
Figure 6
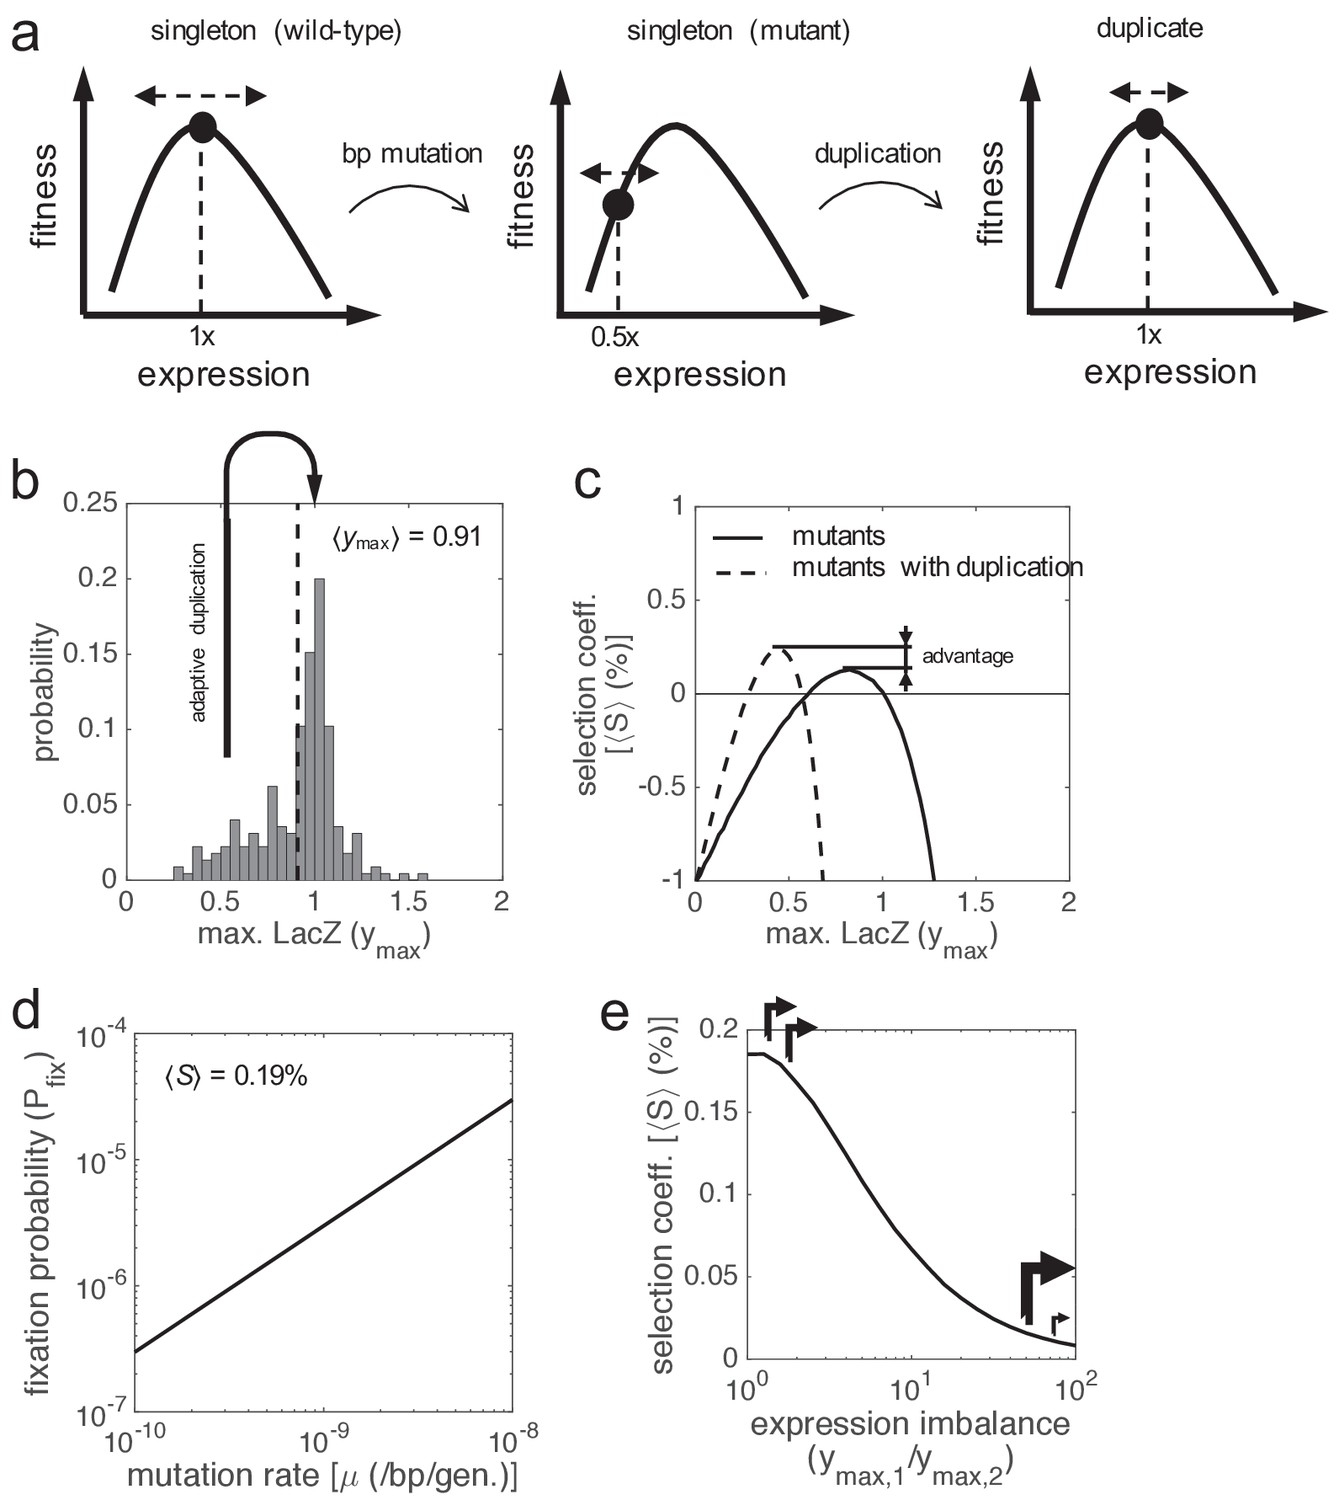
Gene duplication leading to maintained expression.
(a) Schematics of fitness as a function of expression showing a path to reach adaptive gene duplications without the need for more expression. Two steps are considered: first a base-pair mutation that reduces in half the expression level, and then a duplication that recovers the ancestral level. (b) Distribution of the activity of lac promoter mutants based on experimental data, as the maximal LacZ expression (ymax, irrespective of lactose dose). The mean activity is shown (dashed line). Skewness coefficient of −0.68. (c) ⟨S⟩ of the promoter mutants versus the wild-type system (solid line), with fluctuating lactose dose and high noise levels. The dashed line corresponds to the comparative between promoter mutants that duplicated the lacZ gene and the wild-type system. (d) Fixation probability (Pfix) of gene duplication as a function of the mutation rate of the cell (μ), with ⟨S⟩ = 0.19% and ⟨N⟩ = 2·108. (e) ⟨S⟩ as a function of the expression imbalance between the two lacZ copies (ymax,1 / ymax,2), when the system recovers its ancestral expression levels (ymax,1 = ymax,2 = 0.5), with constant x = 0.13 mM and high noise levels. Arrows illustrate the corresponding promoter strengths.
Figure 7
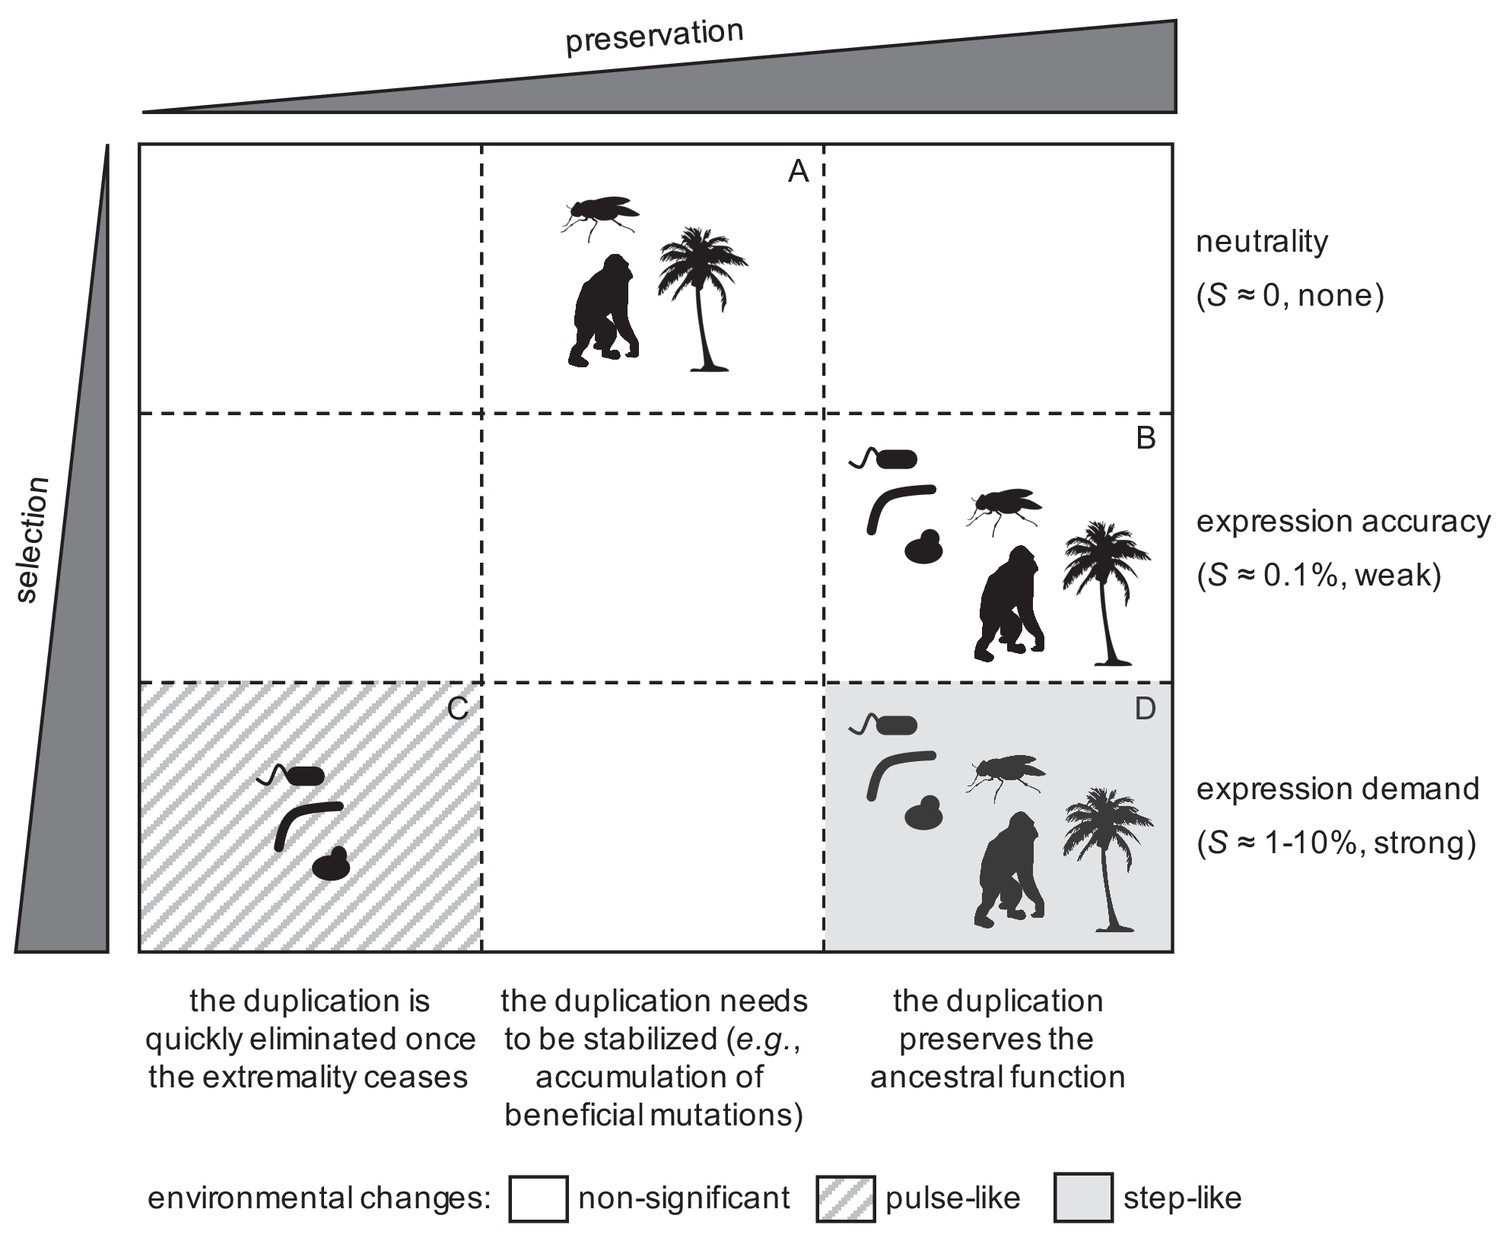
General model to explain the fixation of duplicated genes as a function of the degree of selection in the population and preservation in the genome for long time.
Representative silhouettes correspond to bacteria (prokaryotes), yeasts (lower eukaryotes), insects, plants, and mammals (higher eukaryotes).
Additional files
-
Transparent reporting form
- https://doi.org/10.7554/eLife.29739.009
Download links
A two-part list of links to download the article, or parts of the article, in various formats.
Downloads (link to download the article as PDF)
Open citations (links to open the citations from this article in various online reference manager services)
Cite this article (links to download the citations from this article in formats compatible with various reference manager tools)
Intrinsic adaptive value and early fate of gene duplication revealed by a bottom-up approach
eLife 7:e29739.
https://doi.org/10.7554/eLife.29739


