Epidemiological and ecological determinants of Zika virus transmission in an urban setting
- University of Oxford, United Kingdom
- FIOCRUZ, Brazil
- UMI 233, INSERM U1175 and Institut de Biologie Computationnelle, LIRMM, Université de Montpellier, France
- Universidade Estadual de Feira de Santana, Brazil
- University of Exeter, United Kingdom
Figures
Figure 1
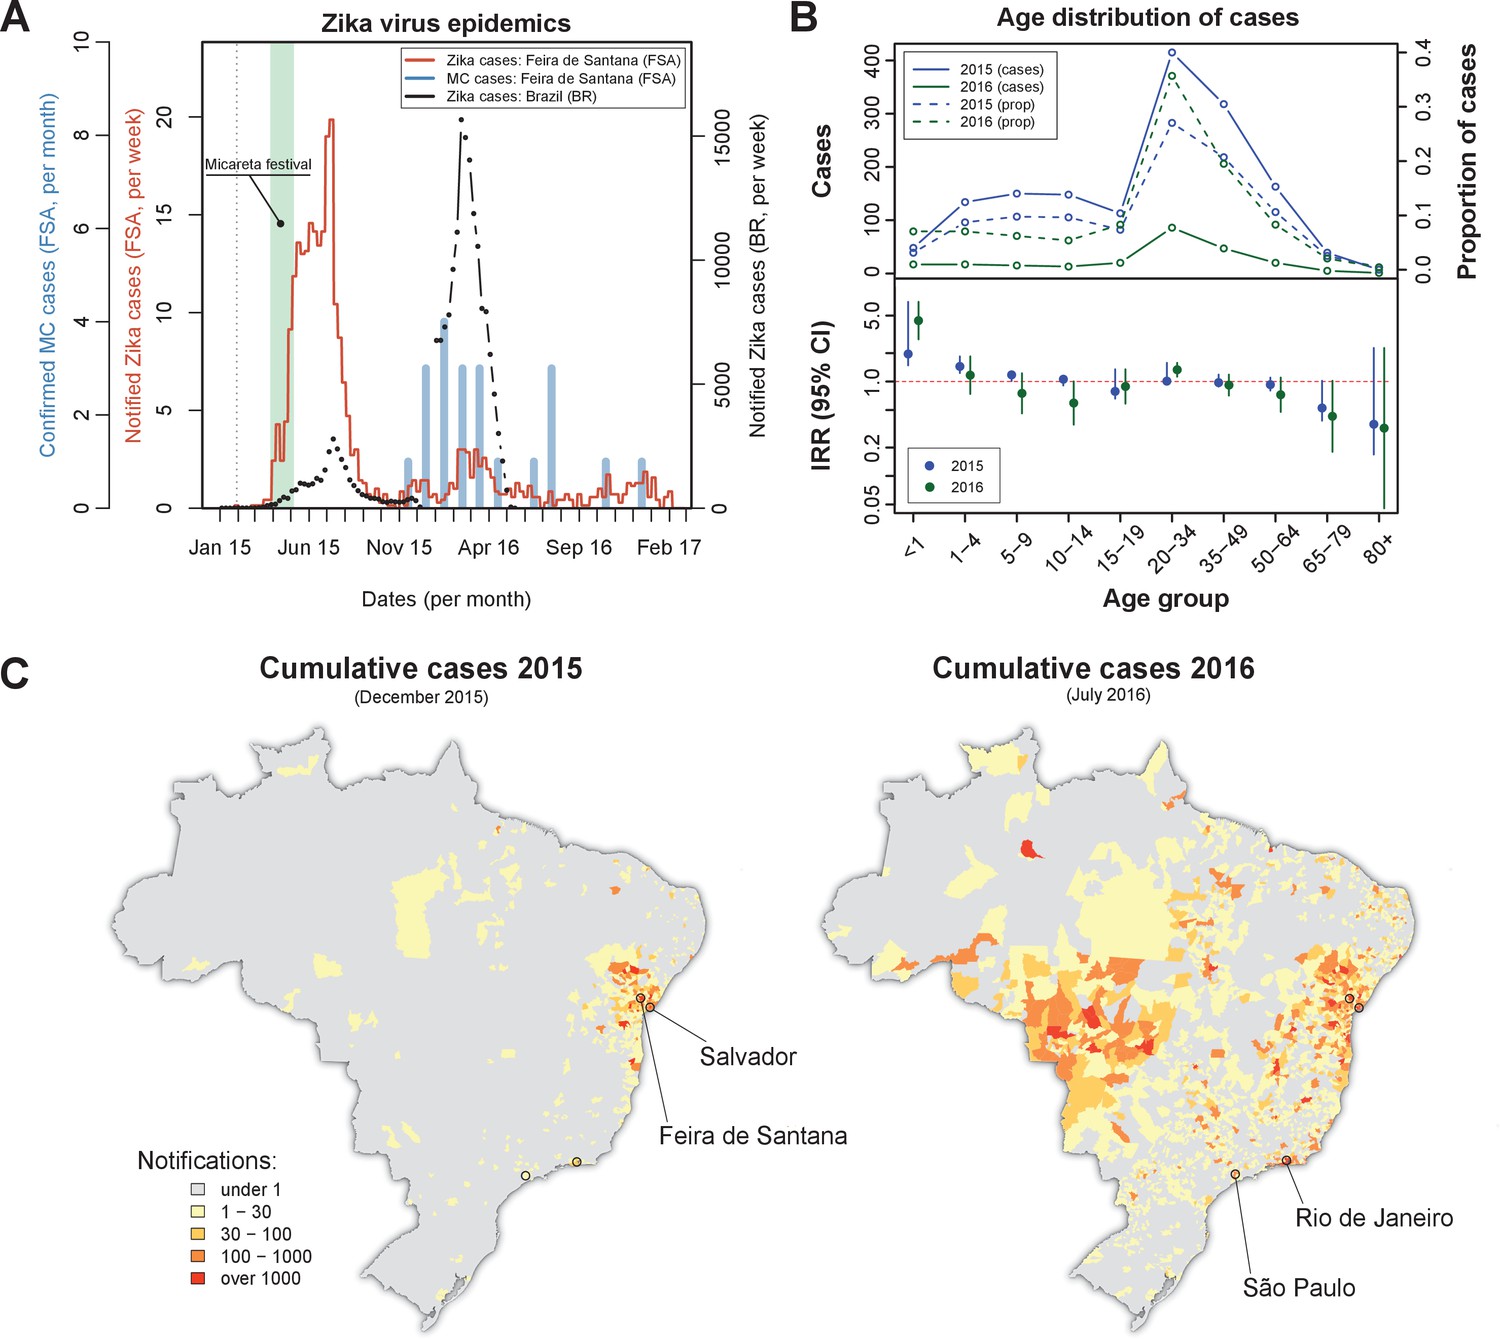
Zika virus epidemics in Feira de Santana and Brazil (2015–2016).
(A) Comparison of weekly notified Zika cases (full red line) with monthly Microcephaly cases (blue bars) in Feira de Santana (FSA), overimposed with total Zika cases at the level of the country (BR, black dotted line). BR data for weeks 50–52 was missing. Green area highlights the time period for the Micareta festival and the dotted grey line the date of first notification. Incidence series is available as Dataset 3 and Microcephaly series as Dataset 4. (B) Age distribution and incidence rate ratio (IRR) for the 2015 (blue) and 2016 (green) FSA epidemics (data available as Dataset 2). The top panel shows the number of cases per age (full lines) and the proportion of total cases per age class (dashed lines), which peak at the age range 20–50. The bottom panel shows the age-stratified incidence risk ratio (IRR, plus 95% CI ), with the red dotted line indicating . (C) Spatial distribution of cumulative notified cases in BR at the end of 2015 (left) and mid 2016 (right). Two largest urban centres in the Bahia state (Salvador, Feira de Santana) and at the country level (São Paulo, Rio de Janeiro) are highlighted.
Figure 2 with 3 supplements
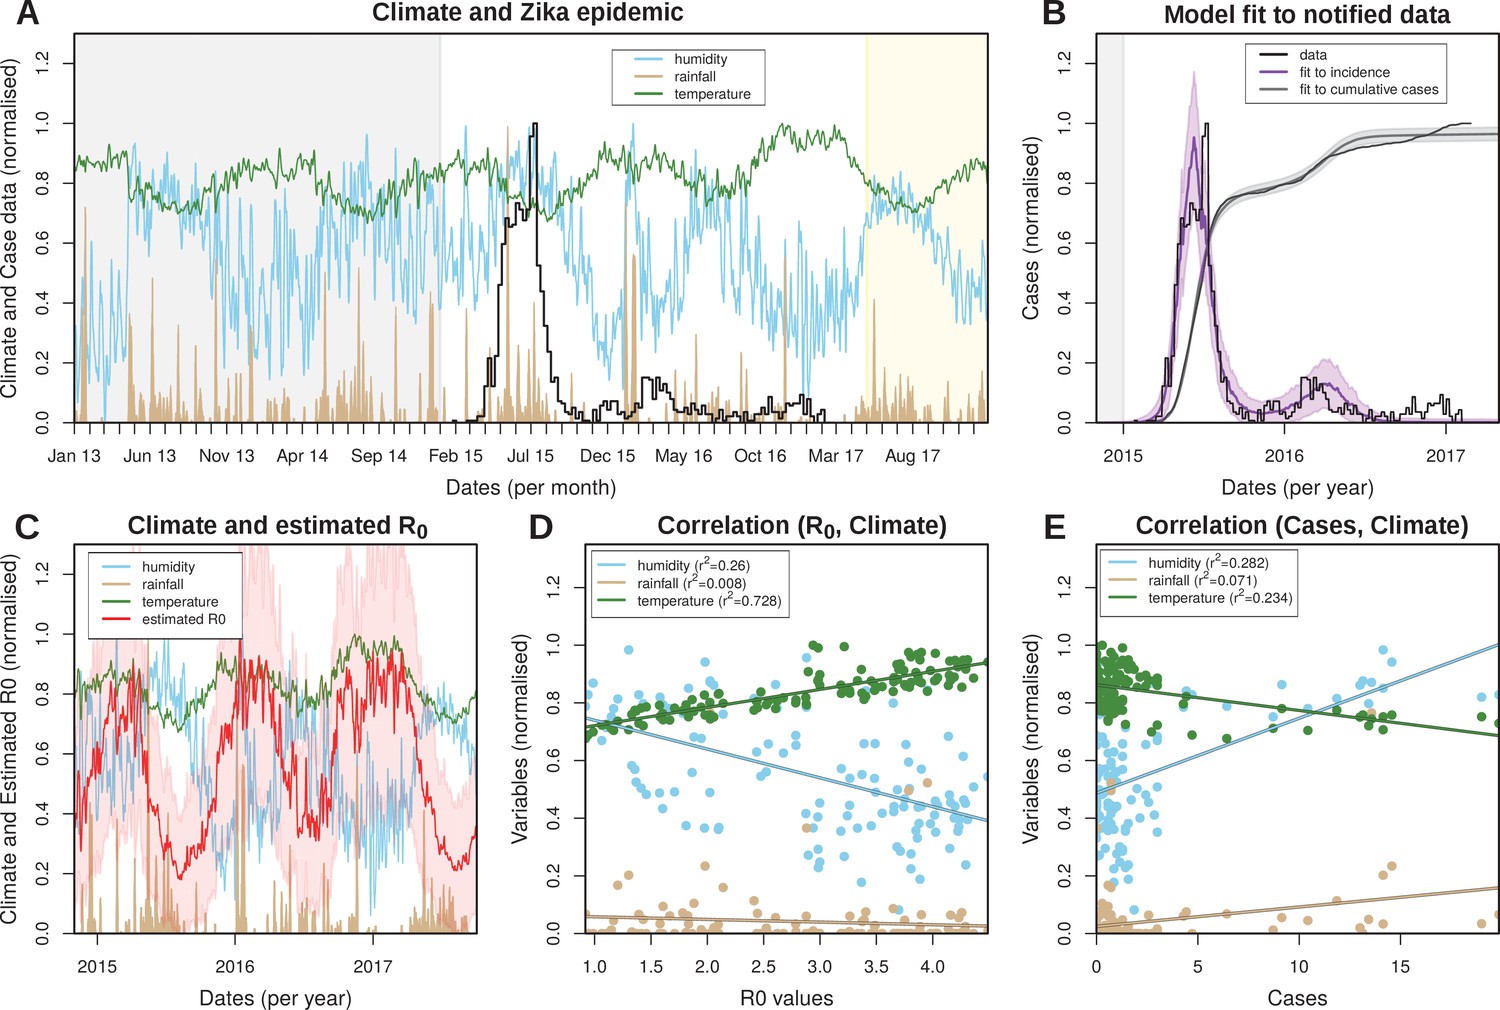
Eco-epidemiological factors and model fit to notified cases.
(A) Zika case data (black) and daily climatic series for rainfall (gold), humidity (blue) and mean temperature (green) for Feira de Santana (FSA). Climate data available as Dataset 1. (B) Resulting Bayesian MCMC fit to weekly (black line: data, purple line: model fit) and cumulative incidence (black line: data, grey line: model fit). (A,B) The grey areas highlight the period before the Zika outbreak, the white areas highlight the period for which notified case data was available, and the yellow shaded areas highlight the period for which mean climatic data was used (see Materials and Methods). (C) Climatic series as in A and estimated for the period of the outbreak (2015–2017) ( absolute values in Figure 2—figure supplement 3). (D) Correlations between the estimated and climatic variables (intercepts: 0.839 for humidity, 0.067 for rainfall and 0.658 for temperature). (E) Correlations between the case counts and climatic variables (intercepts: 0.487 for humidity, 0.024 for rainfall and 0.862 for temperature). (D,E) Points presented are from timepoints (weeks) for which incidence was notified. (A–E) Y-axis normalised between 0 and 1 for visualisation purposes.
Figure 2—figure supplement 1
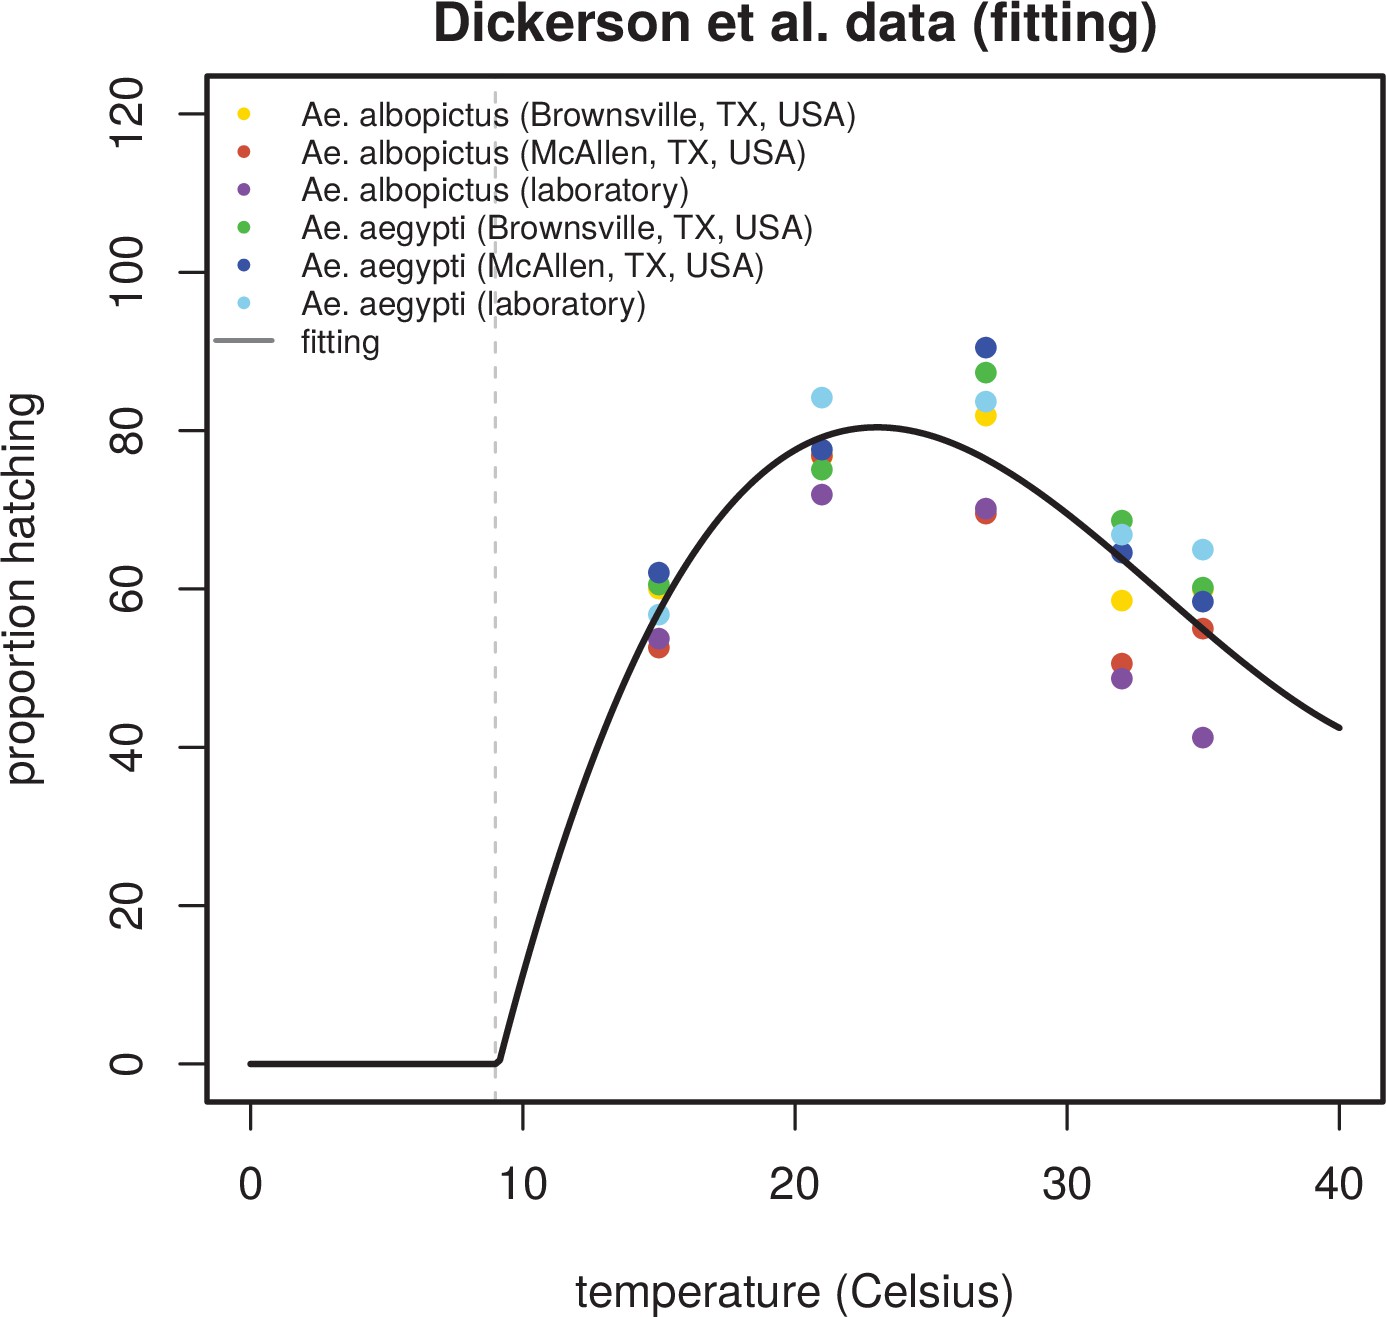
Relationship between temperature and egg hatching success.
Empirical data on Aedes aegypti’s and albopictus’s egg hatching success (in the model ) is taken from (Dickerson, 2007). Data includes measurements of hatching for 5 different temperatures above 15 Celsius, including 2 wild and 1 laboratory populations for each of the vector-species. Fitting implemented with a third degree polynomial. When modelling, negative proportions below 10 Celsius are manually corrected to zero (left of shaded grey line).
Figure 2—figure supplement 2
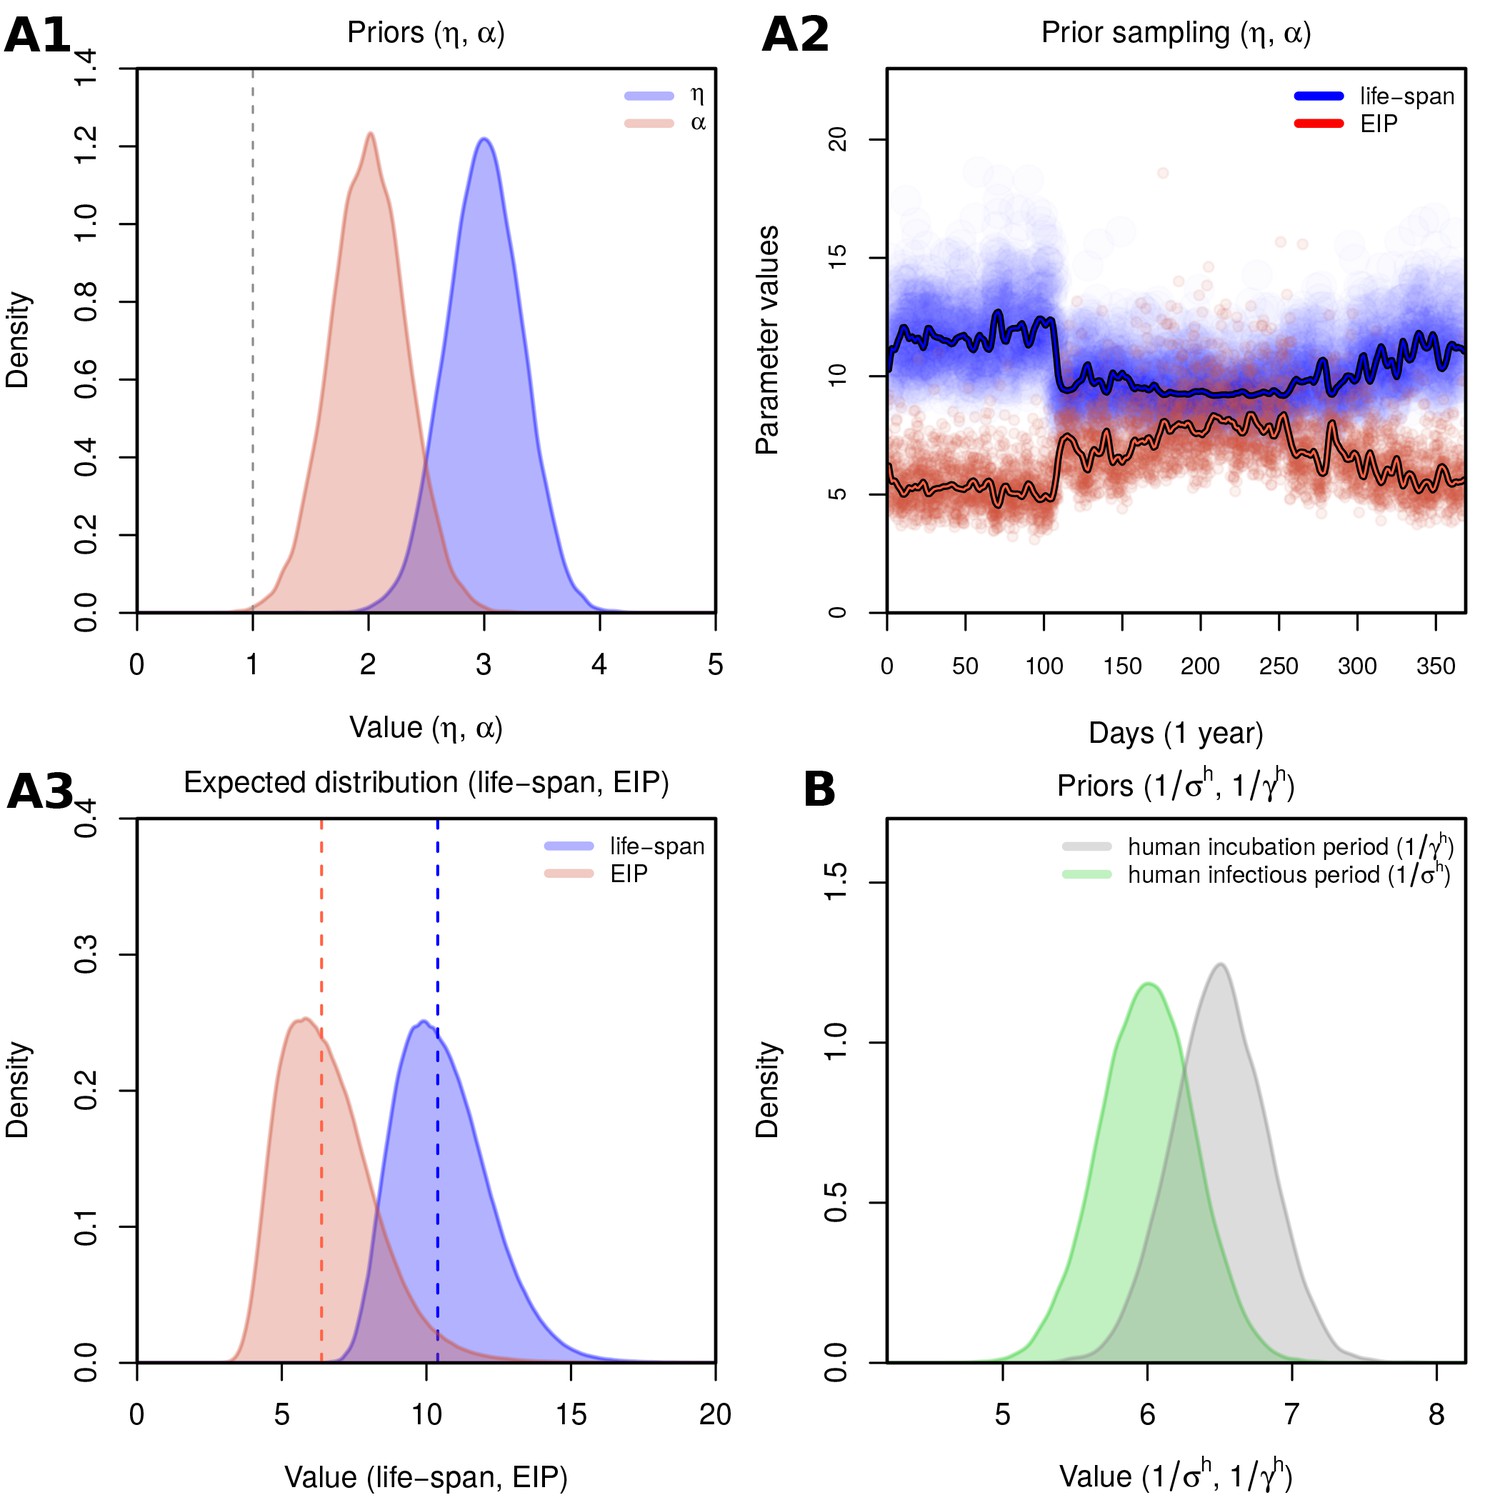
Prior selection and sensitivity.
(A1) Priors for the linear coefficients (scaling factor for effect of temperature on mosquito incubation period - EIP) and (scaling factor for effect of temperature on mosquito mortality - life-span). Priors follow Gaussian distributions: with and (standard deviation); with and . Means and SDs are chosen to obtain biologically relevant ranges on the parameters being scaled (see subplots A2-A3). (A2) With prior set for each coefficient () as in A1, temperature values of one year from Feira de Santana are used to demonstrate expected variation in the scaled parameters in time. Lines represent the expected mean per day. (A3) Distributions of life-span and EIP for the time period presented in A2. (A1–A3) The selected priors derive into life-span and EIP ranges that are biologically relevant for Aedes mosquitoes, namely that on average the EIP is assumed to be days and the life-span just below 2 weeks (Trpis et al., 1995; Trpis and Hausermann, 1986; Andraud et al., 2012; Hugo et al., 2014 and Table 3). It should be noted that the priors have been set to be above 1, as we assume that the effects of climate are stronger outside the ideal laboratory conditions for which mathematical relationships have been formulated (see description of the model). (B) Priors for the human incubation and infectious period. Means and SDs based on previous estimations (Ferguson et al., 2016). (A1–A3, B) Distributions are drawn using 20,000 samples. Representative samples of 500 MCMC chain states are available in Supplementary files 1–6.
Figure 2—figure supplement 3
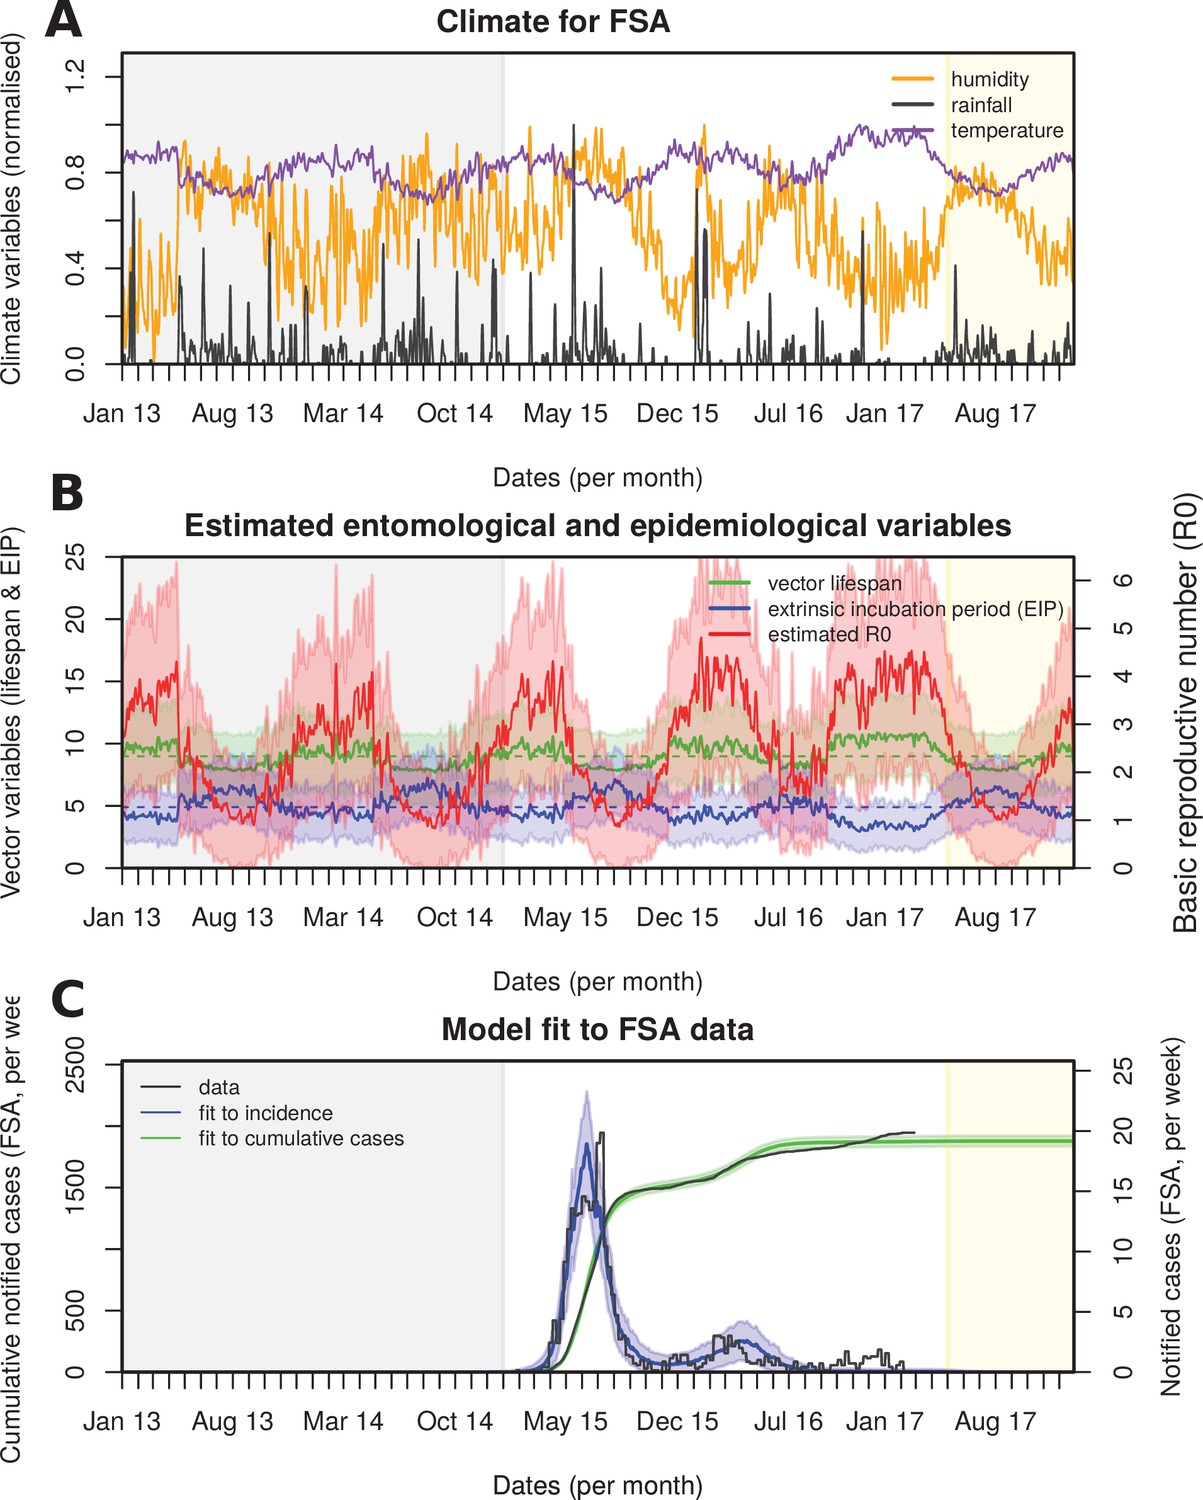
Eco-epidemiological factors and model fit to notified cases.
(A) Daily climatic series for rainfall (black), humidity (orange) and mean temperature (purple) for Feira de Santana (FSA). (B) Estimated vector lifespan (green), extrinsic incubation period (EIP, blue) and basic reproduction number (, red). Median values are represented by horizontal dashed lines, with around 9 days for the mosquito lifespan, 5 days for the EIP and 2.5 for . (C) Resulting Bayesian MCMC fit to weekly (black line: data, blue line: model fit) and cumulative incidence (black line: data, green line: model fit). The grey areas highlight the period before the Zika outbreak, the white areas highlight the period for which Zika virus (ZIKV) notified case data was available, and the yellow shaded areas highlight the period for which mean climatic data was used.
Figure 3 with 2 supplements
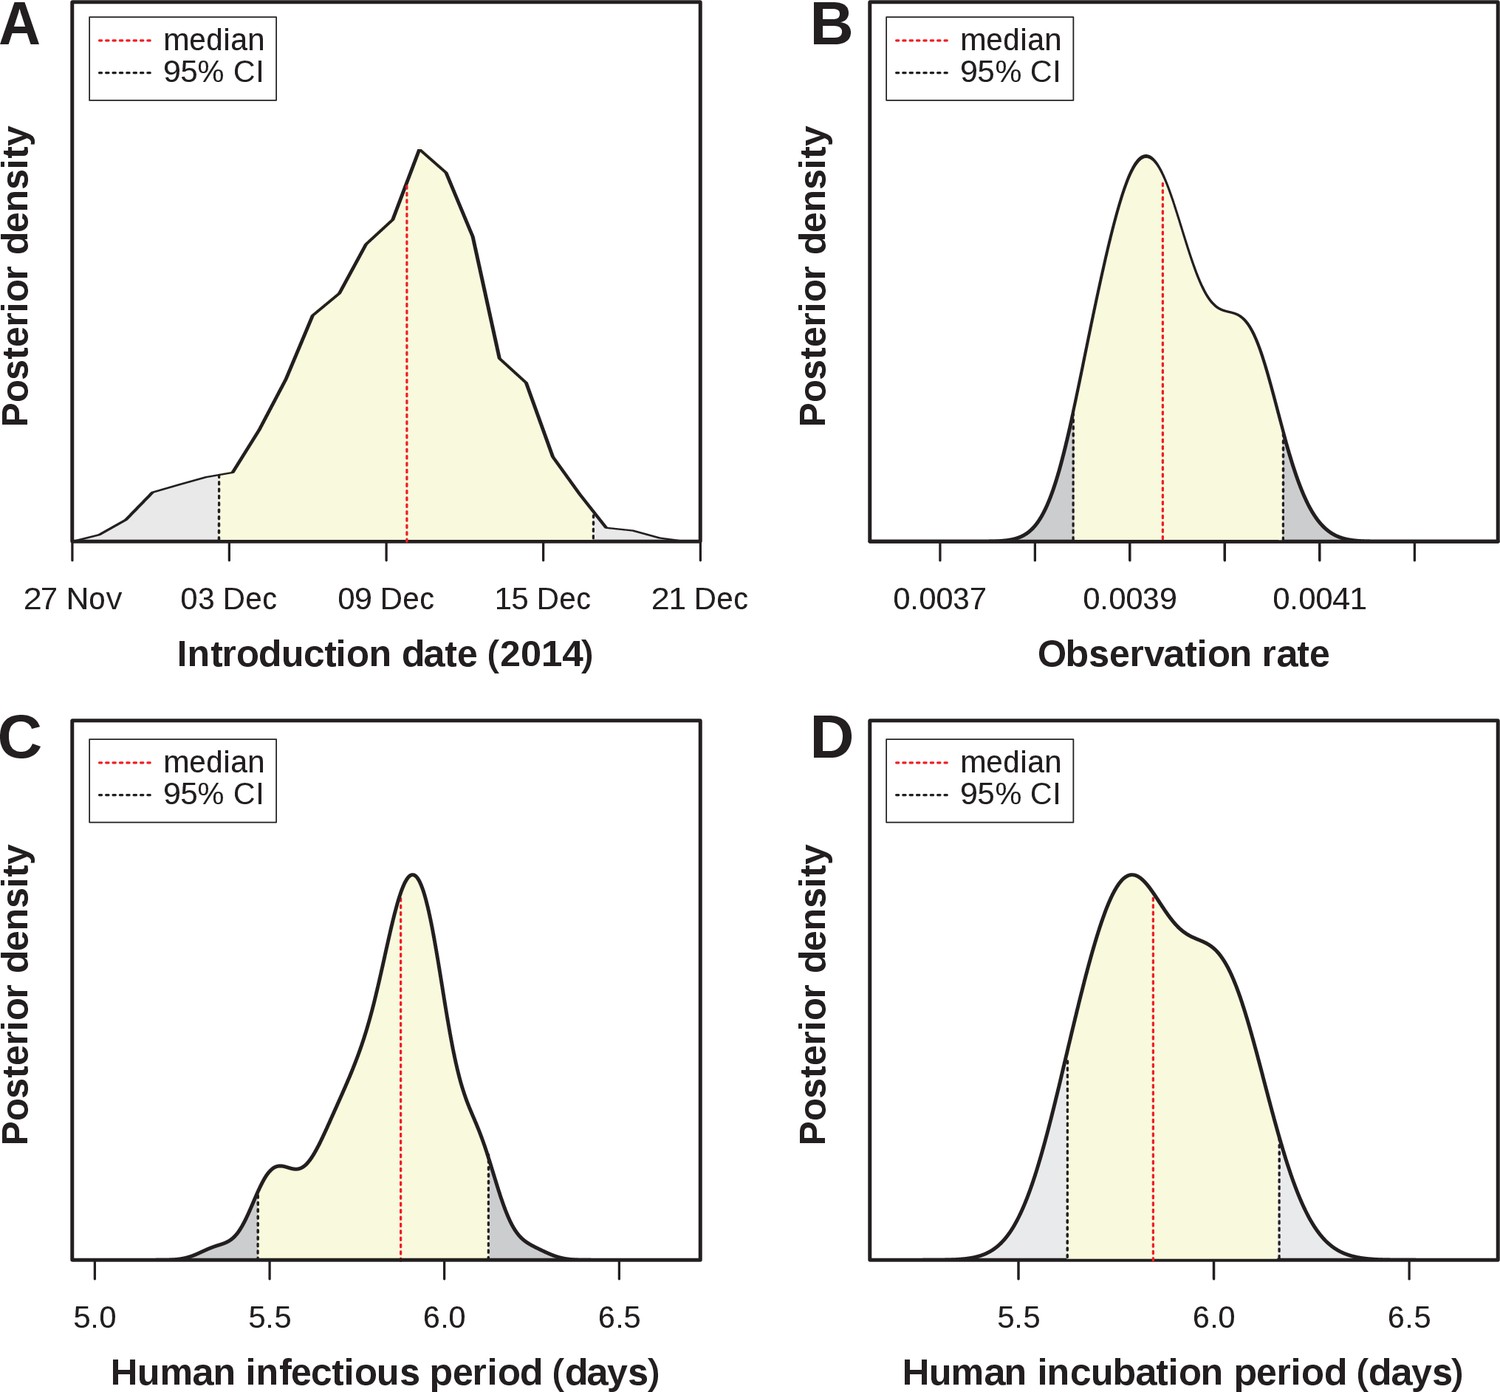
Estimated epidemiological and ecological parameters.
MCMC posterior distributions, based on model fitting to notified case data between 2015–2017 and obtained from sampling 1 million MCMC steps after burn-in. (A) Posterior of the introduction date with median December 2014 (95% CI [01–16 Dec]). (B) Posterior of the observation rate with median 0.0039 (95% CI [0.0038–0.0041])). (C) Posterior of the human infectious period with median 5.9 days (95% CI [5.47–6.14]). (D) Posterior of the human (intrinsic) incubation period with median 5.8 days (95% CI [5.6–6.15]). Representative samples of 500 MCMC chain states are available in Supplementary files 1–6. See Figure 3—figure supplement 1 for sample chain behaviour.
Figure 3—figure supplement 1
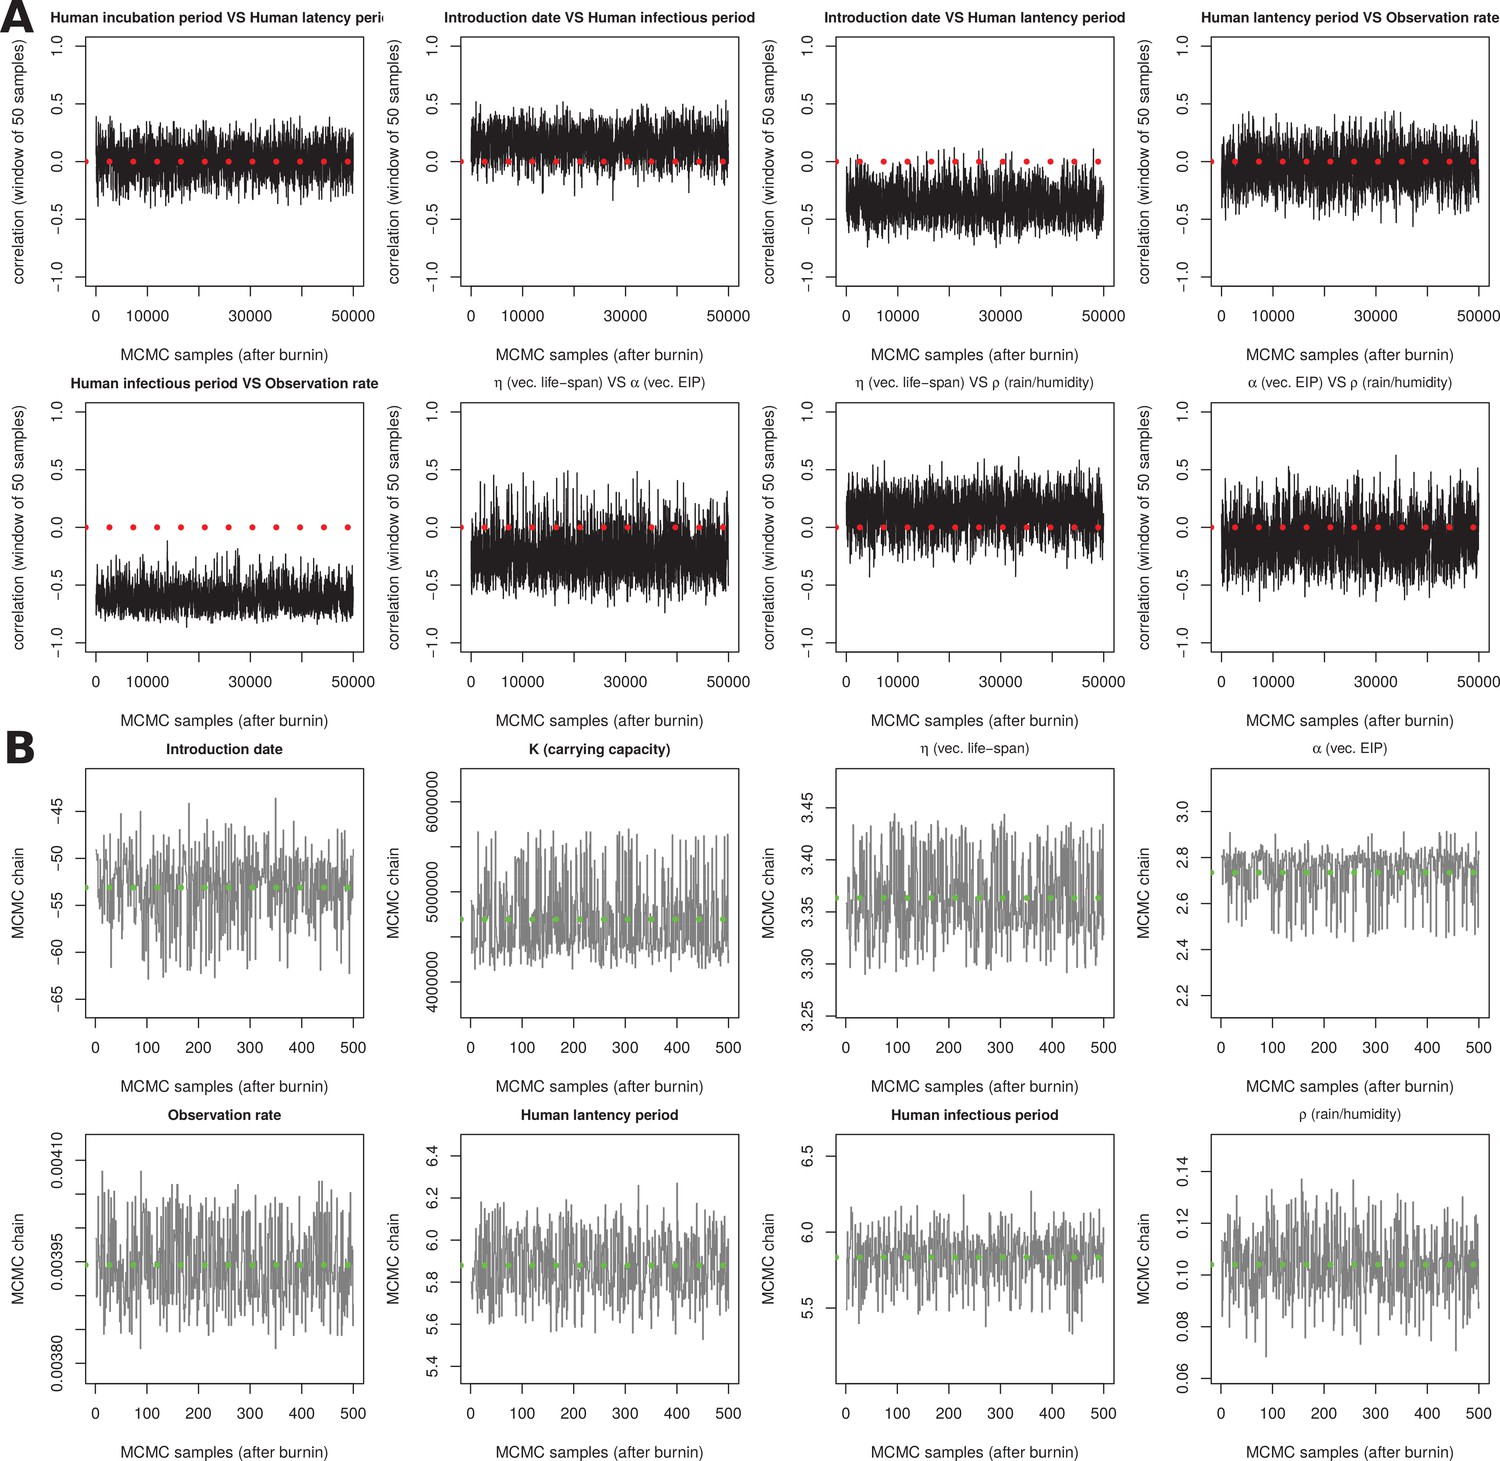
Sensitivity output for MCMC chains.
(A) The last 1.5 million states of a 5 million run were sampled (25,000 samples), and the correlation of the states was calculated between the chains of particular parameters (windows of 50 samples for visualization purposes). The correlations present a highly stable behaviour in the MCMC chains. Some parameters, such as the human infectious and latency periods, show no correlation; others show consistently positive or negative correlation. The non-zero correlation is expected between some of the parameters, since fine tuning of certain parameters by the MCMC can be balanced by similar/opposite changes in other parameters, resulting in the same dynamic output; i.e. small identifiability issues are difficult to eliminate from complex ODE models. These correlations may have biological meaning as similar changes in the natural system could follow the relationships herein found. Red dotted lines mark correlation equal to zero. (B) MCMC chains for the 8 estimated parameters. The last 1.5 million states of a 5 million run were sampled (1000 samples). The green dotted lines mark the mean. A subsample of 500 was used to run deterministic and stochastic simulations, submitted in spreadsheet tables as supplementary material.
Figure 3—figure supplement 2
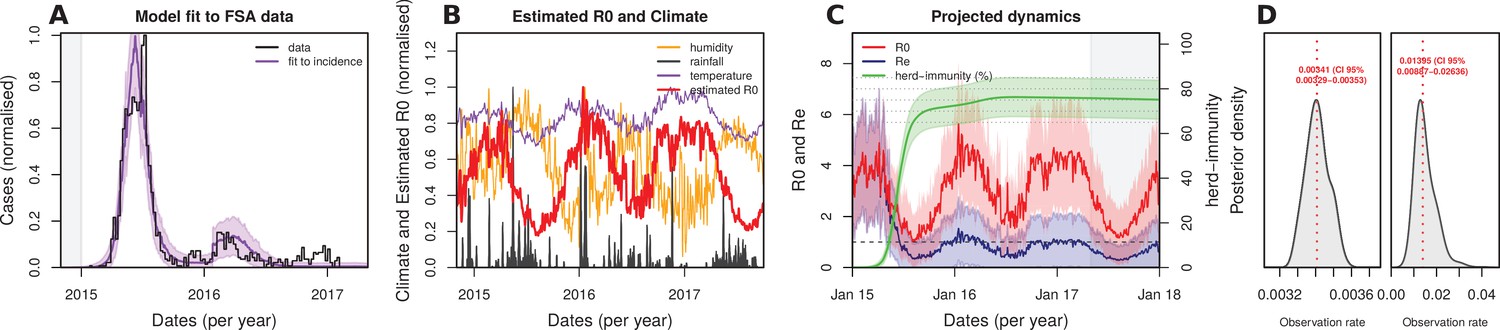
Eco-epidemiological factors and model fit to notified cases when using 2 observation rates.
(A) Resulting Bayesian MCMC fit to weekly (black line: data, purple line: model fit) and cumulative incidence (black line: data, grey line: model fit). The grey area highlights the period before the Zika outbreak, the white areas highlight the period for which notified case data was available.(B) Climatic series and estimated for the period of the outbreak (2015–2017), normalised to 1 for visualization purposes ( absolute values in suplot B). (C) Fitted and projected epidemic attack rate ( population infected, green), basic reproduction number (, red) and effective reproduction number (, blue). Grey shaded area represents the period after the last available notified case. (D) Posteriors for the observation rate of 2015 (left) with median 0.0034 (95% CI [0.0033–0.0035]) and the observation rate for 2016 and onwards (right) with median 0.01395 (95% CI [0.0089–0.0264])).
Figure 4
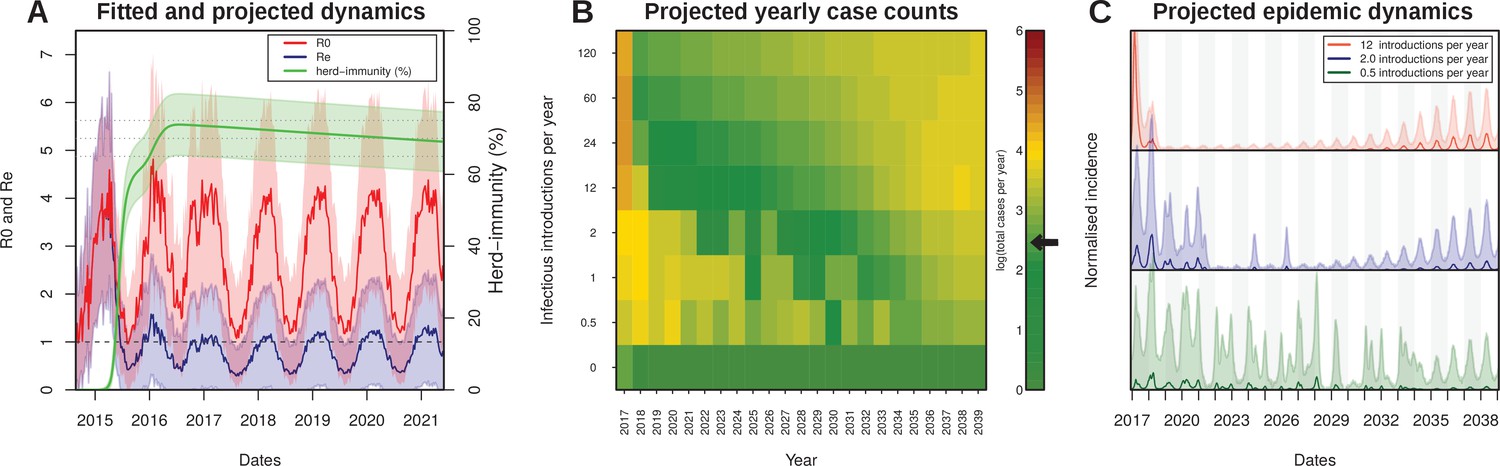
Projected Zika virus dynamics and transmission potential.
(A) Fitted and projected epidemic attack rate (% population infected, or herd-immunity, green), basic reproduction number (, red) and effective reproduction number (, blue).(B) Colourmap showing the projected total number of annual cases depending on rate of external introduction of infectious individuals.The black arrow in the color scale marks the total number of real cases necessary for 1 notified case to be reported in FSA. (C) Projected incidence dynamics when considering less than 1 (green), 2 (blue) and 12 (red) external introductions per year. Grey and white shaded areas delineate different years. The Y-axes are normalised to 1 in each subplot for visualisation purposes. In (B, C) results are based on 1000 stochastic simulations with parameters sampled from the posterior distributions (Figure 3). Representative model solutions for incidence, R0 and Re from 500 MCMC chain samples are available in Supplementary files 1–6 (both deterministic and stochastic).
Figure 5
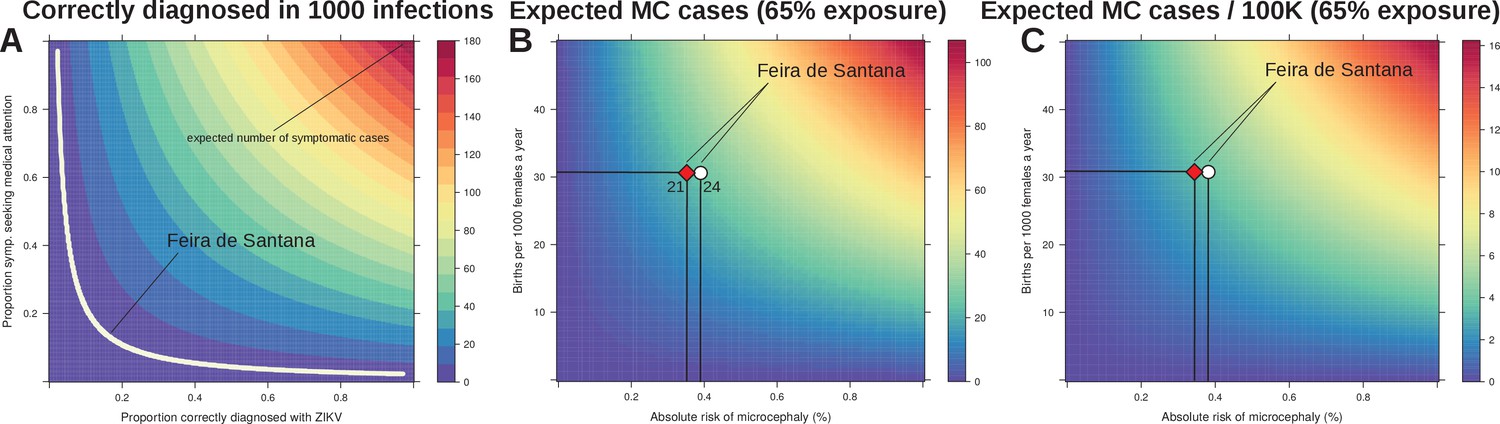
Sensitivity to reporting and microcephaly risk in Feira de Santana (FSA).
(A) The observation rate (OR) can be expressed as the product of the proportion of cases that are symptomatic (0.18 [Duffy et al., 2009]), with the proportion of symptomatic that seek medical attention, and the proportion of symptomatic that upon medical attention get correctly diagnosed with Zika. In the white area the expected number of notified cases is the range obtained from fitting FSA case data (OR = 0.0039, 95% CI [0.0038–0.0041], Figure 3). (B) Expected number of cases of microcephaly (MC) for theoretical ranges of birth rate (per 1000 females) and risk of MC assuming 65% exposure of all pregnancies as estimated by our model for 2015 in FSA. (C) Expected number of MC per 100,000 individuals under the same conditions as in B. The symbols in B and C represent the total confirmed MC cases (21, red diamond), and the 21 MC plus 3 fetal deaths with confirmed Zika infection (24, white circle); the dashed horizontal line marks the number of births for FSA in 2015, and the vertical lines are the estimated risks per pregnancy.
Tables
Table 1
Model climate-dependent parameters.
https://doi.org/10.7554/eLife.29820.003| Notation | Description |
|---|---|
| transition rate from aquatic to adult mosquito life-stages | |
| mortality rate of aquatic mosquito life-stage | |
| mortality rate of adult mosquito life-stage | |
| (human) intrinsic oviposition rate of adult mosquito life-stage | |
| (vector) extrinsic incubation period of adult mosquito life-stage | |
| vector-to-human probability of transmission per infectious bite | |
| egg hatching success | |
| adult vector biting rate |
Table 2
Model constant parameters.
https://doi.org/10.7554/eLife.29820.004| Notation | Value | Description | References |
|---|---|---|---|
| 0.25 per day | mosquito biting rate | [ 76, 88 ] | |
| 0.5 | proportion of females (sex ratio) | [ 52, 59 ] | |
| 0.5 | human-to-vector probability of transmission per infectious bite | – | |
| 75 years | human mean lifespan | [ 83 ] |
Table 3
Literature-based reports on key ZIKV epidemiological and entomological parameters.
https://doi.org/10.7554/eLife.29820.010| Parameter/Function | Values and ranges reported | References |
|---|---|---|
| Intrinsic incubation period | 6.5, 5.9 days | [ 34, 50 ] |
| Human infectious period | 4.7, 9.9 days | [ 34, 50 ] |
| Extrinsic incubation period | 8.2, , days | [ 34, 51, 84 ] |
| Attack rates | 74, 50, 73, 94, 52% | [ 17, 26, 47, 28 ] |
| 3.2, 2.5, 4.8, 2.05, 2.6–4.8, 4.3–5.8, 1.8–2.0 | [ 17, 37, 38, 47, 64 ] | |
| Observation rate | 0.024, 0.06, 0.03, 0.11 | [ 17, 37, 47 ] |
Table 4
Model estimated parameters.
https://doi.org/10.7554/eLife.29820.011| Notation | Description | Ranges / priors |
|---|---|---|
| time point of first case (in a human) | (, ) | |
| aquatic carrying capacity | (0, ) | |
| linear factor for mosquito mortality | (0, ) | |
| linear factor for extrinsic incubation period | (0, ) | |
| non-linear factor for effects of humidity and rainfall | (0, ) | |
| human infectious period | (0, 15) | |
| human (intrinsic) incubation period | (0, 15) | |
| observation rate | (0, 1) |
Additional files
-
Source data 1
Dataset 1.
Climate time series for Feira de Santana (2013–2017), including daily temperature, humidity and rainfall (FSA_climate_series.xls).
- https://doi.org/10.7554/eLife.29820.017
-
Source data 2
Dataset 2.
Age-related data for Feira de Santana (2015), including case counts per age, total population numbers and gender ratios (FSA_age_data.xls).
- https://doi.org/10.7554/eLife.29820.018
-
Source data 3
Dataset 3.
Total weekly notified cases in Feira de Santana (2015–2017) (FSA_incidence_series.xls).
- https://doi.org/10.7554/eLife.29820.019
-
Source data 4
Dataset 4.
Total notified cases of Microcephaly in Feira de Santana (2015–2017), including confirmed and suspected/not confirmed (FSA_Microcephaly_series.xls).
- https://doi.org/10.7554/eLife.29820.020
-
Supplementary file 1
Sample model deterministic solutions for incidence (Incidence_detsolution.csv).
- https://doi.org/10.7554/eLife.29820.021
-
Supplementary file 2
Sample model deterministic solutions for R0 (R0_detsolution.csv).
- https://doi.org/10.7554/eLife.29820.022
-
Supplementary file 3
Sample model deterministic solutions for Re (Re_detsolution.csv).
- https://doi.org/10.7554/eLife.29820.023
-
Supplementary file 4
Sample model stochastic solutions for incidence (Incidence_stosolution.csv).
- https://doi.org/10.7554/eLife.29820.024
-
Supplementary file 5
Sample model stochastic solutions for R0 (R0_stosolution.csv).
- https://doi.org/10.7554/eLife.29820.025
-
Supplementary file 6
Sample model stochastic solutions for Re (Re_stosolution.csv).
- https://doi.org/10.7554/eLife.29820.026
-
Transparent reporting form
- https://doi.org/10.7554/eLife.29820.027
Download links
A two-part list of links to download the article, or parts of the article, in various formats.
Downloads (link to download the article as PDF)
Open citations (links to open the citations from this article in various online reference manager services)
Cite this article (links to download the citations from this article in formats compatible with various reference manager tools)
Epidemiological and ecological determinants of Zika virus transmission in an urban setting
eLife 6:e29820.
https://doi.org/10.7554/eLife.29820


