A transgenic toolkit for visualizing and perturbing microtubules reveals unexpected functions in the epidermis
- Duke University Medical Center, United States
Figures
Figure 1 with 2 supplements
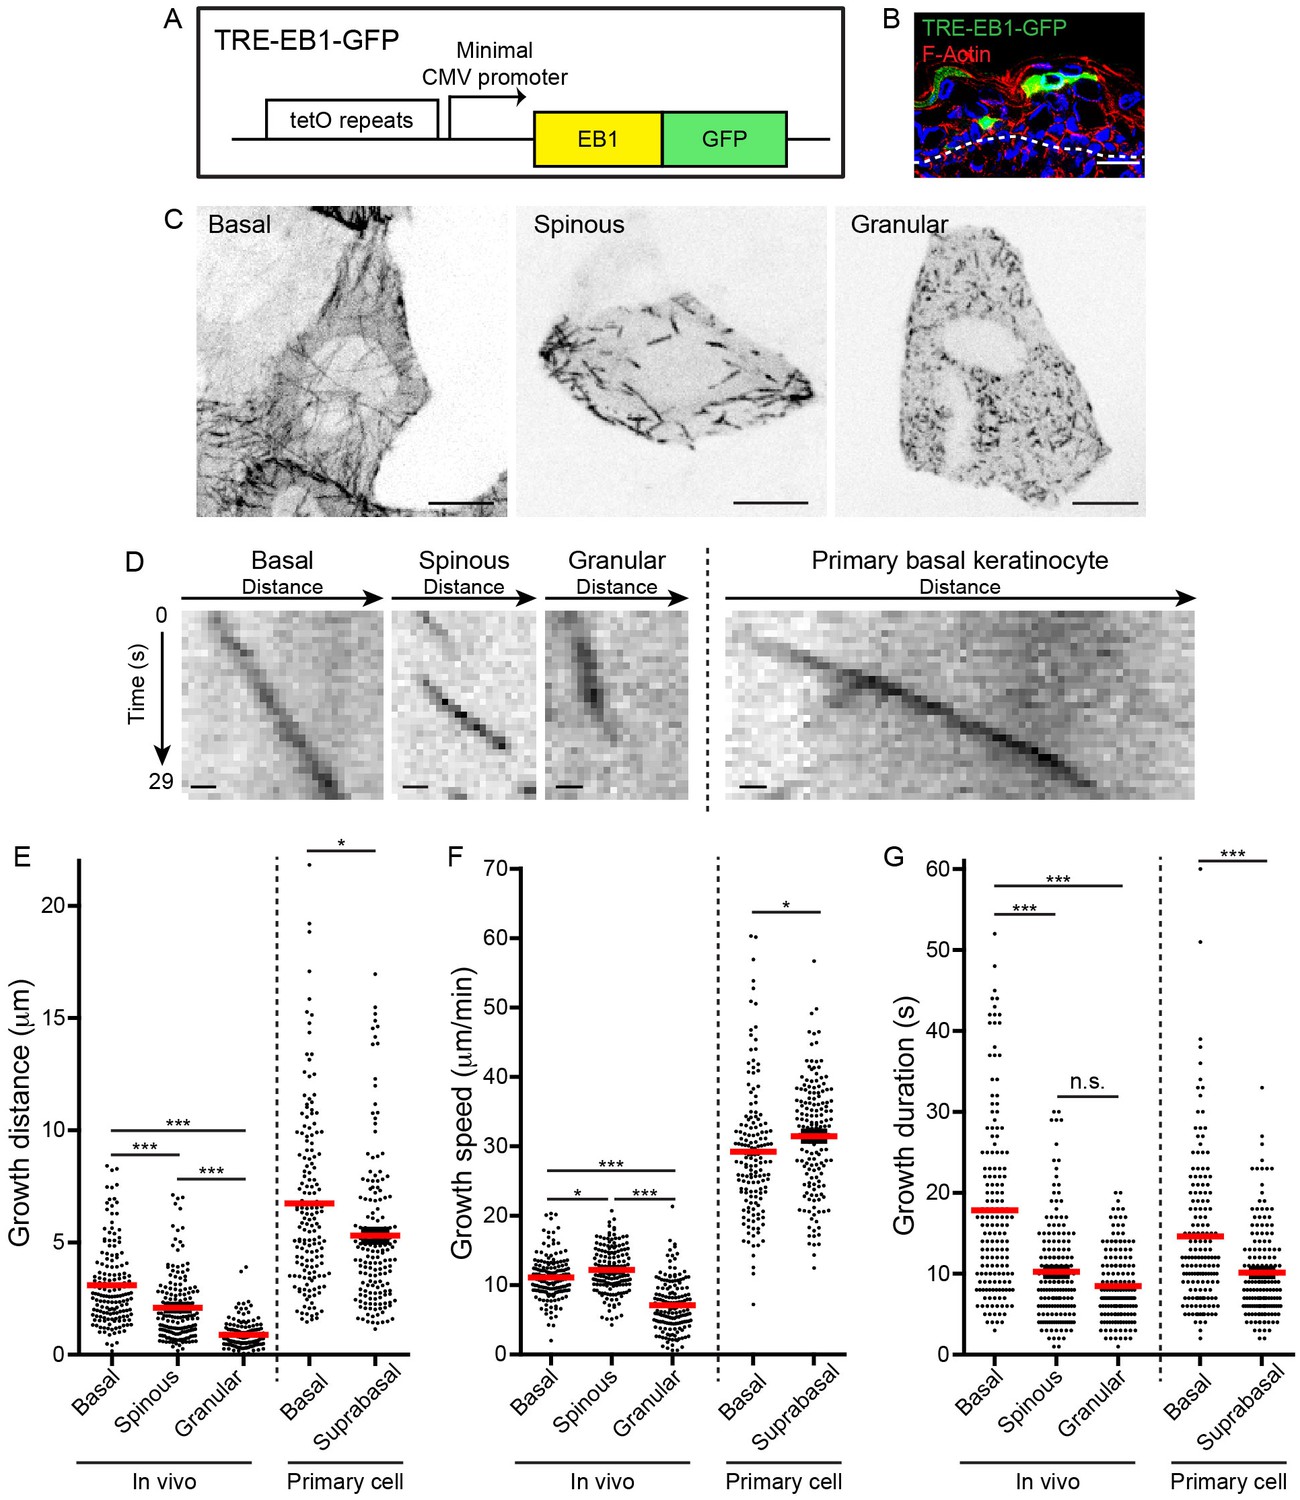
TRE-EB1 mouse line permits visualization of microtubule dynamics in vivo.
(A) Diagram of the TRE-EB1-GFP transgene. (B) Cross-section of e17.5 CMV-rtTA; TRE-EB1 epidermis. Scale-20μm. (C) Representative standard deviation projections of a basal, spinous, and granular keratinocyte. Scale-10μm. (D) Kymographs of EB1-GFP in indicated cell types. Scale-1µm. (E) Quantification of microtubule growth distance. (F) Quantification of microtubule growth speed. (G) Quantification of duration of microtubule growth. n = 160 microtubules for each stage. Data are presented as mean ± S.E.M. n.s.-p>0.05, *p<0.05. ***p<0.001.
Figure 1—figure supplement 1
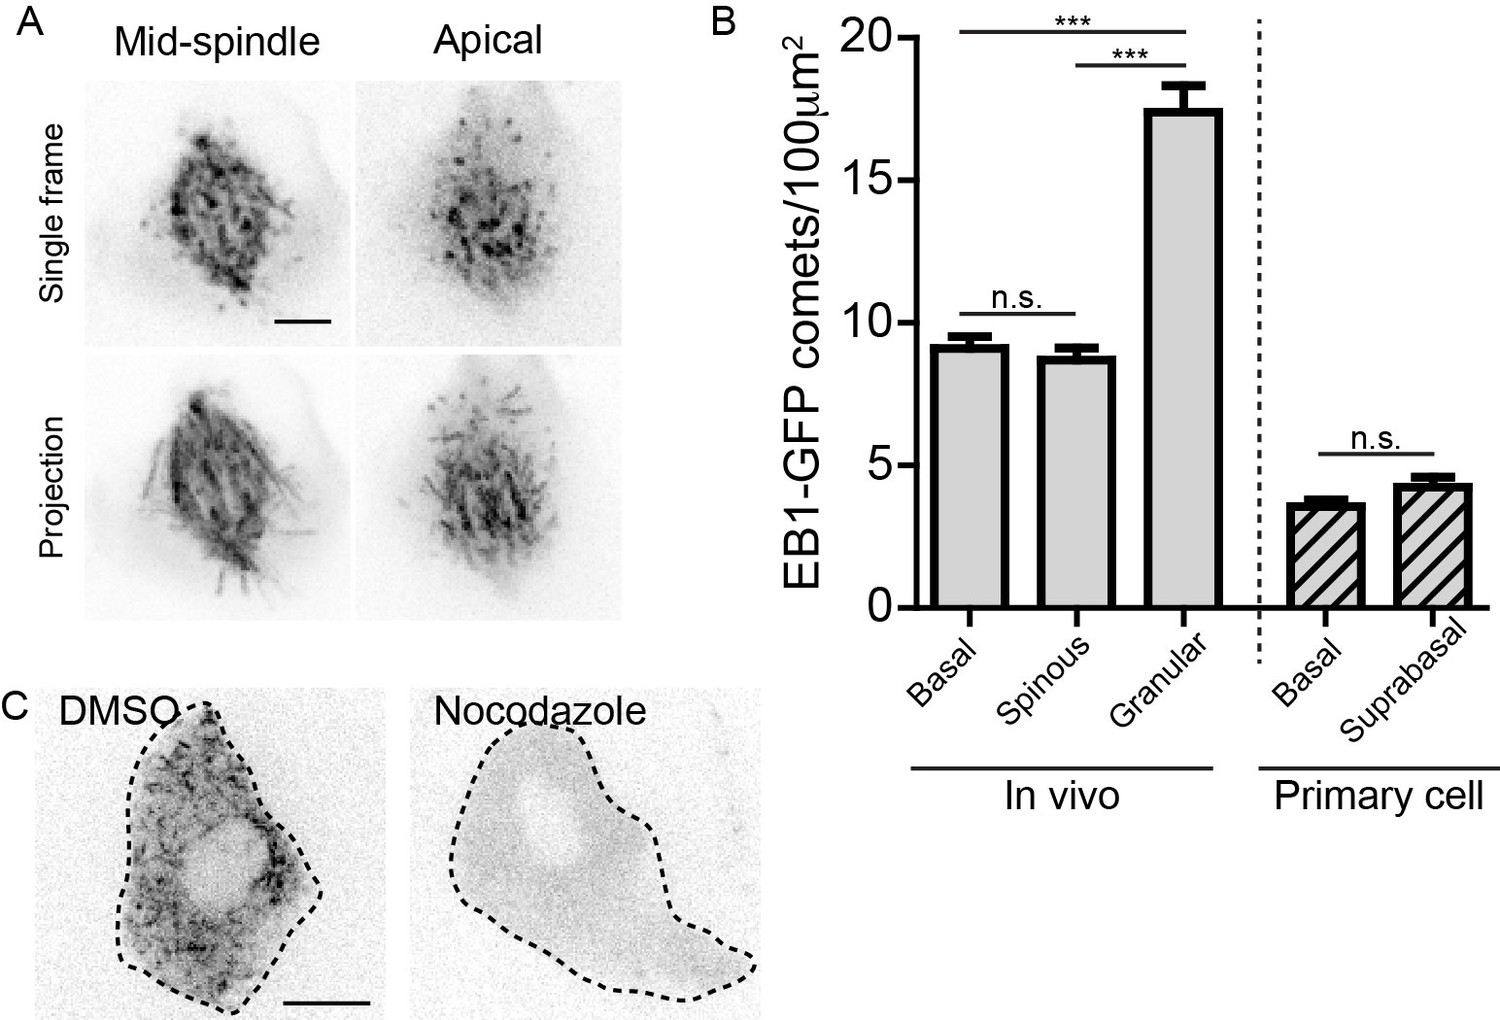
Validation of EB1-GFP line and characterization of microtubule density.
(A) EB1-GFP labeling of a mitotic spindle at sub-cellular resolution in a basal keratinocyte. Scale-5µm. (B) Quantification of EB1-GFP density in indicated cell types. n = 25 cells for each cell type. (C) Single frame of EB1-GFP in granular cells in e17.5 embryos treated with either DMSO or nocodazole. Scale-10µm. Data are represented as mean ± S.E.M. n.s.-p>0.05, ***p<0.001.
Figure 1—figure supplement 2
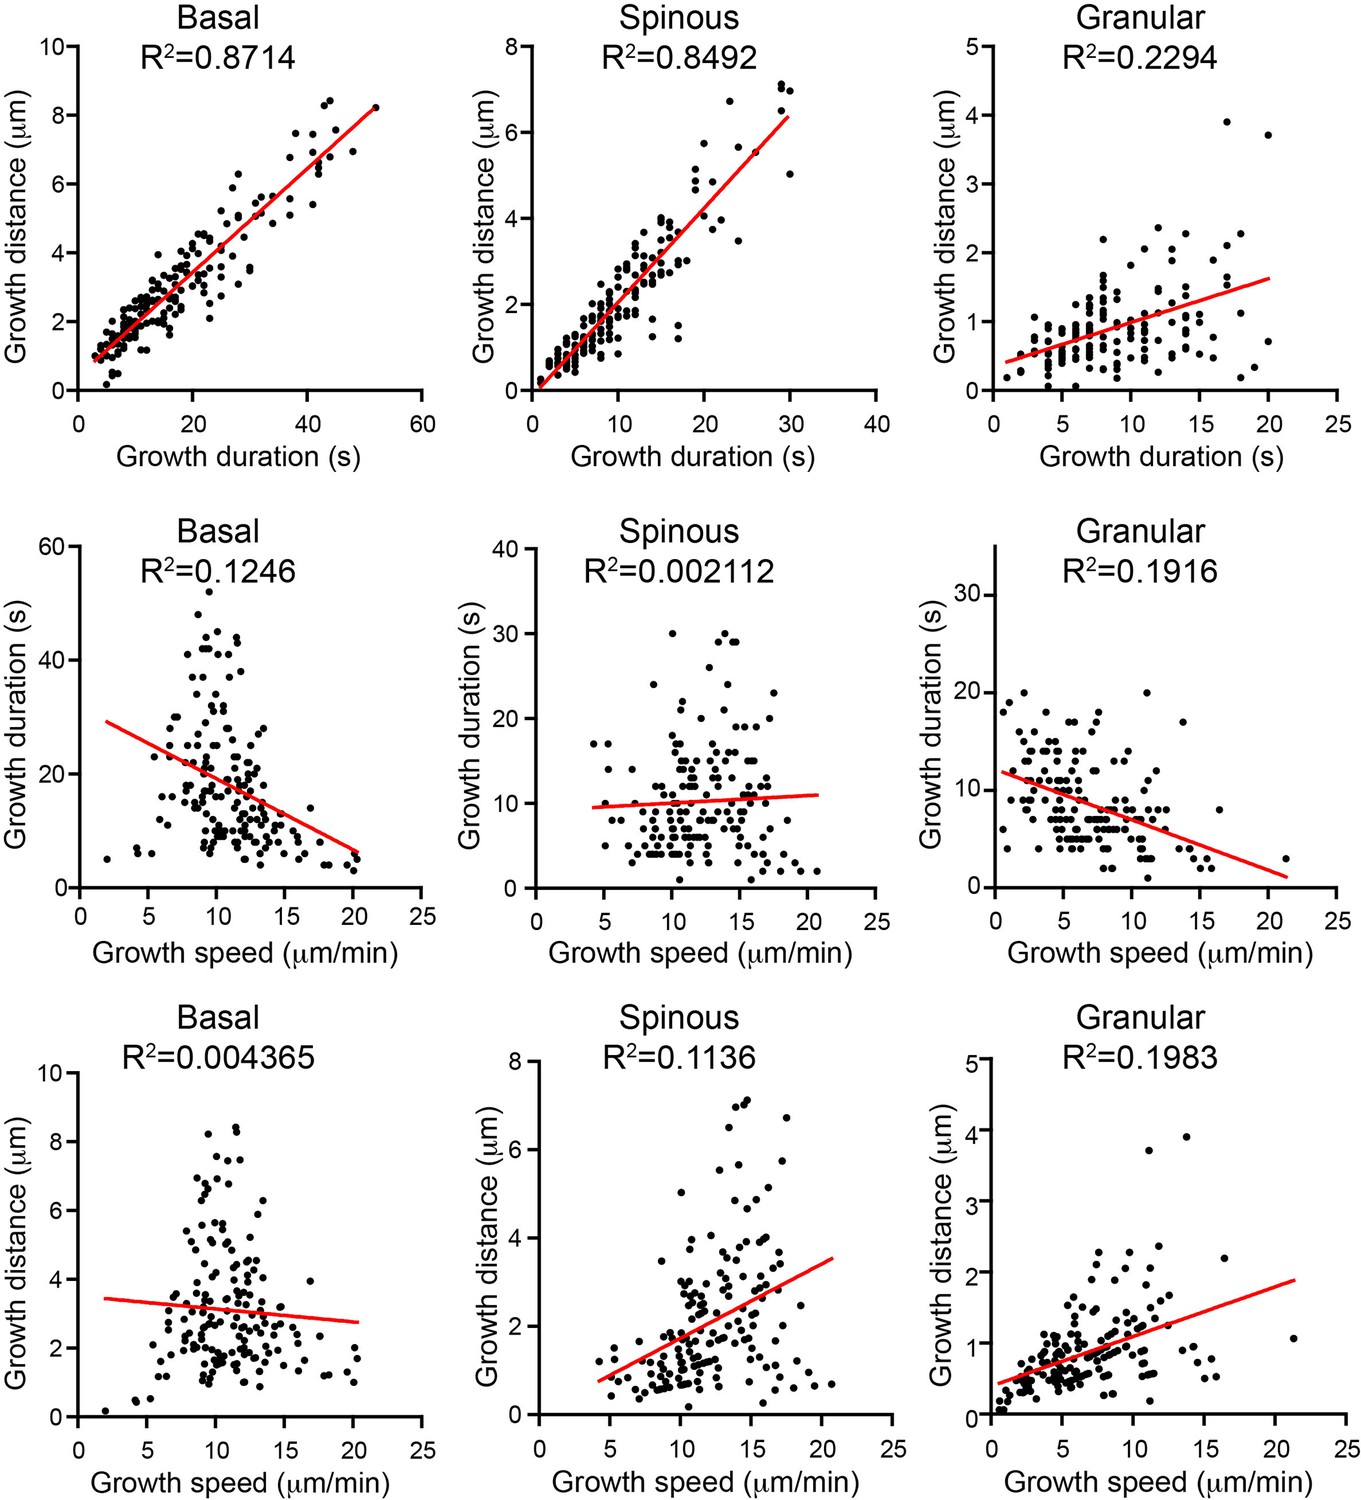
Correlation analysis of microtubule parameters for individual microtubules in the indicated cell types.
Note the loss of correlation between growth distance and duration in granular cells.
Figure 2
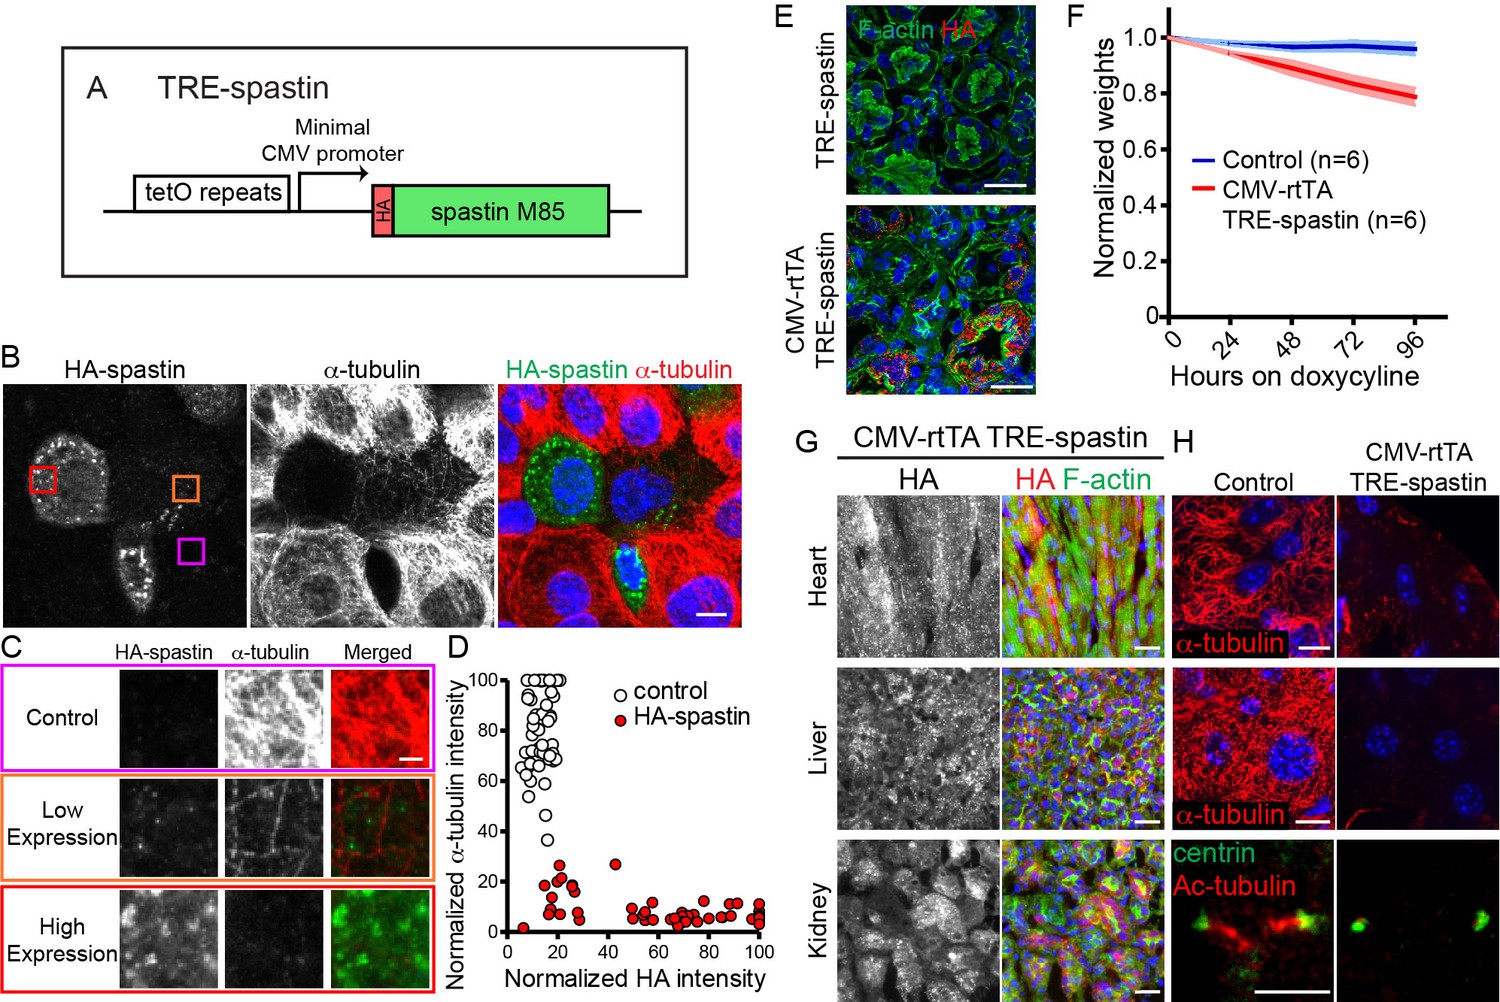
TRE-spastin expression perturbs microtubules in vitro and in vivo.
(A) Diagram of the TRE-spastin transgene. (B) Spastin OE perturbs microtubules in cultured cells. Scale-10µm. (C) Insets from (B) showing microtubule density within individual cells based on spastin expression. Scale-2µm. (D) Quantification of microtubule perturbation following spastin OE. n = 50 cells each from two independent experiments. (E) Spastin expression was observed within 24 hr of doxycycline exposure and no leaky expression was detected in TRE-spastin mice. Scale-25µm. (F) Weights of CMV-rtTA; TRE-spastin mice and control littermates following doxycycline exposure. (G) HA-spastin expression in various tissues after 96 hr of doxycycline exposure. Scale-25µm. (H) Effects of spastin OE on microtubule density in vivo. Note that the cilia in the kidney are dramatically shortened. Scale for the heart and liver microtubules-10µm. Scale for the cilia-5µm.
Figure 3
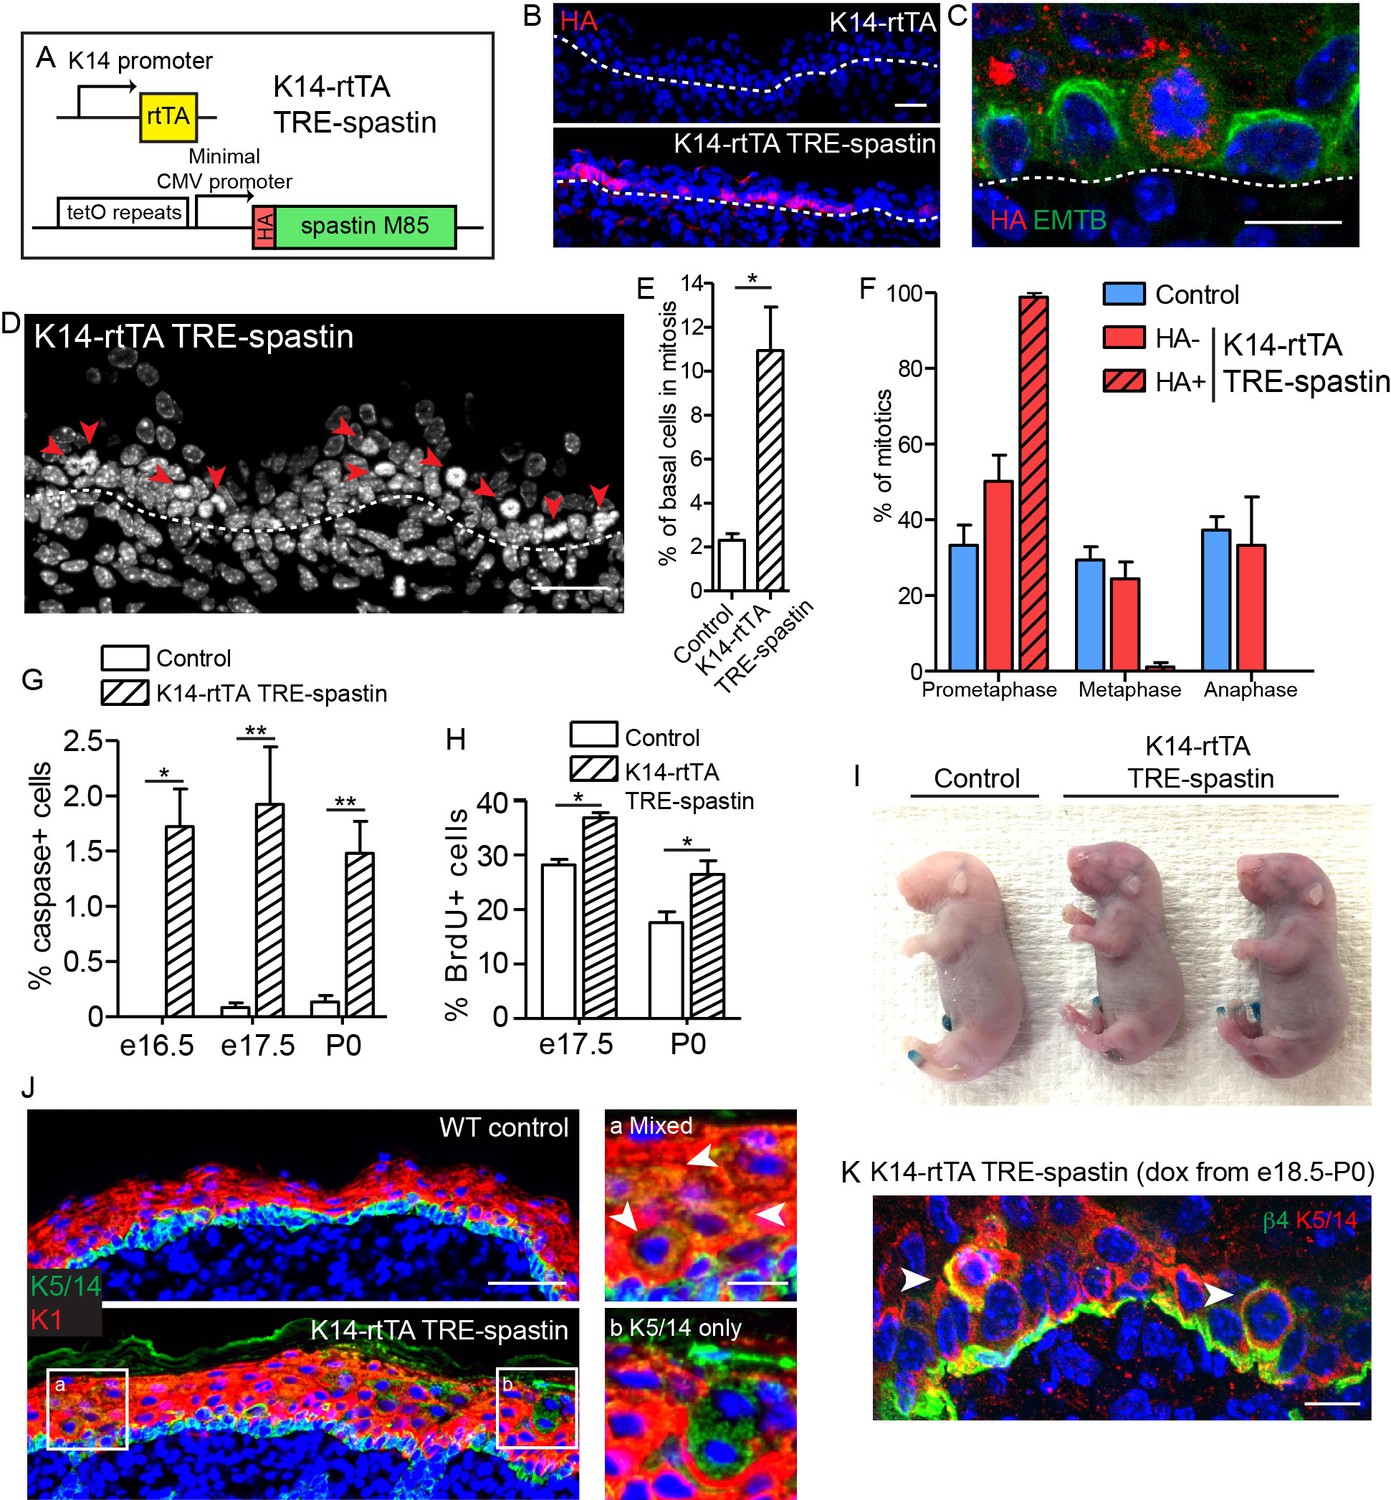
Spastin OE in basal keratinocytes induces mitotic arrest but does not alter epidermal architecture.
(A) Alleles used to induce spastin overexpression in basal keratinocytes. (B) HA-spastin expression in e16.5 embryonic epidermis. Scale-25µm. (C) Spastin OE causes microtubule loss, assayed using the 3xGFP-ensconcin microtubule-binding domain (EMTB) mouse (Lechler and Fuchs, 2007), and mitotic arrest. Scale-10µm. (D) Arrows indicate mitotically arrested cells in K14-rtTA; TRE-spastin epidermis. Scale-25µm. (E) Quantification of the number of basal keratinocytes in mitosis. n = 3 mice per genotype. (F) Quantification of mitotic stage in control back skin and spastin-negative and spastin-positive cells in K14-rtTA; TRE-spastin back skin. n = 3 mice per genotype. (cell type x mitotic stage interaction, p<0.0001). (G) Quantification of cleaved-caspase-3-positive cells at the indicated stages. (H) Quantification of BrdU+ basal cells in control and mutant back skin at the indicated stages. (I) X-gal barrier assay in e18.5 embryos. (J) Expression of keratins 5/14 and keratin 1 in control and K14-rtTA; TRE-spastin epidermis. Scale-50µm. Insets show zoomed regions illustrating cells expressing both K5/14 and K1 (white arrows) and also suprabasal cells that are only K5/14+. Scale-10µm. (K) Delaminating mitotic cells in K14-rtTA; TRE-spastin epidermis. Scale-10µm. Data are presented as mean ± S.E.M. *p<0.05. **p<0.01.
Figure 4 with 5 supplements
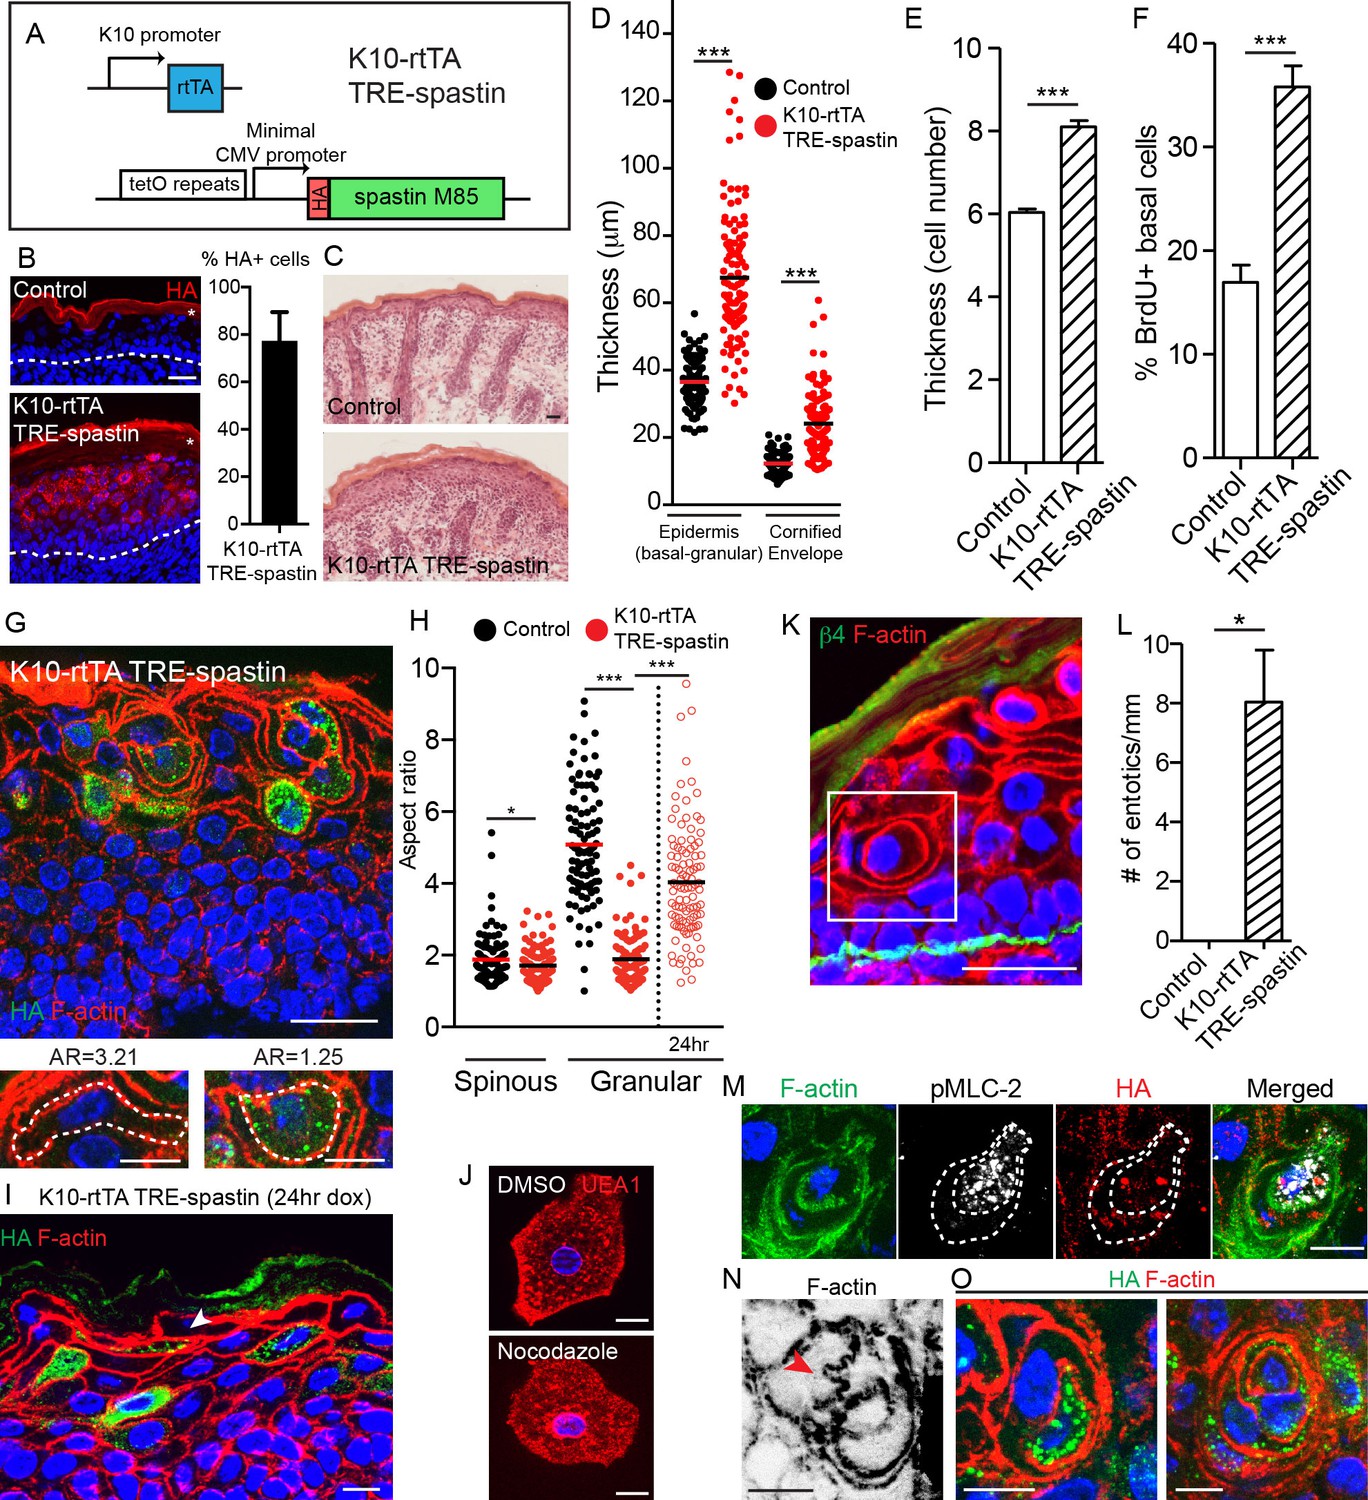
Spastin OE in differentiated keratinocytes induces cell-shape changes and entosis.
(A) Alleles used to overexpress spastin in suprabasal keratinocytes. (B) Images and quantification of HA-spastin expression in control and K10-rtTA; TRE-spastin epidermis. Asterisks indicate autofluorescence of the cornified envelope. Scale-25µm. Quantification is the percentage of suprabasal cells expressing spastin averaged over 5 different mice. (C) Hematoxylin and eosin staining of control and K10-rtTA; TRE-spastin tissue. Note the cornified envelope thickness. Scale-25µm. (D) Quantification of epidermal thickness in control and K10-rtTA; TRE-spastin mice. Each column is 120 measurements from 4 mice per genotype. (E) Quantification of the number of cell layers present in control and K10-rtTA; TRE-spastin epidermis. n = 100 measurements from 4 mice per genotype. (F) Quantification of BrdU+ basal cells in control and K10-rtTA; TRE-spastin epidermis. n = 4 mice per genotype. (G) Cell rounding is observed in a cell-autonomous manner in K10-rtTA; TRE-spastin tissue. Scale-25μm. Zoomed regions show a spastin-negative and a spastin-positive cell within K10-rtTA; TRE-spastin tissue. Note the accompanying aspect ratios (AR). Scale-10μm. (H) Quantification of the aspect ratio of individual control and spastin-positive cells. n = 100 cells for each group. (I). Spastin-positive granular cells remain flattened after short spastin induction. Scale-10µm. (J) Isolated granular cells treated with DMSO or nocodazole. Scale-10µm. (K) Example of an entotic cell in K10-rtTA; TRE-spastin epidermis. Scale-25μm. (L) Quantification of the number of entotics per mm of basement membrane. n = 4 mice per genotype. (M) Example of an entosis where the invading cell has up-regulated phospho-myosin light chain II. The dotted line marks the cell outlines. Scale-10μm. (N) Example of cell potentially invading its neighbor. Scale-10µm. (O) Examples of types of entosis observed in K10-rtTA; TRE-spastin epidermis. Scale-10μm. Data are presented as mean ± S.E.M. *p<0.05, ***p<0.001.
Figure 4—figure supplement 1
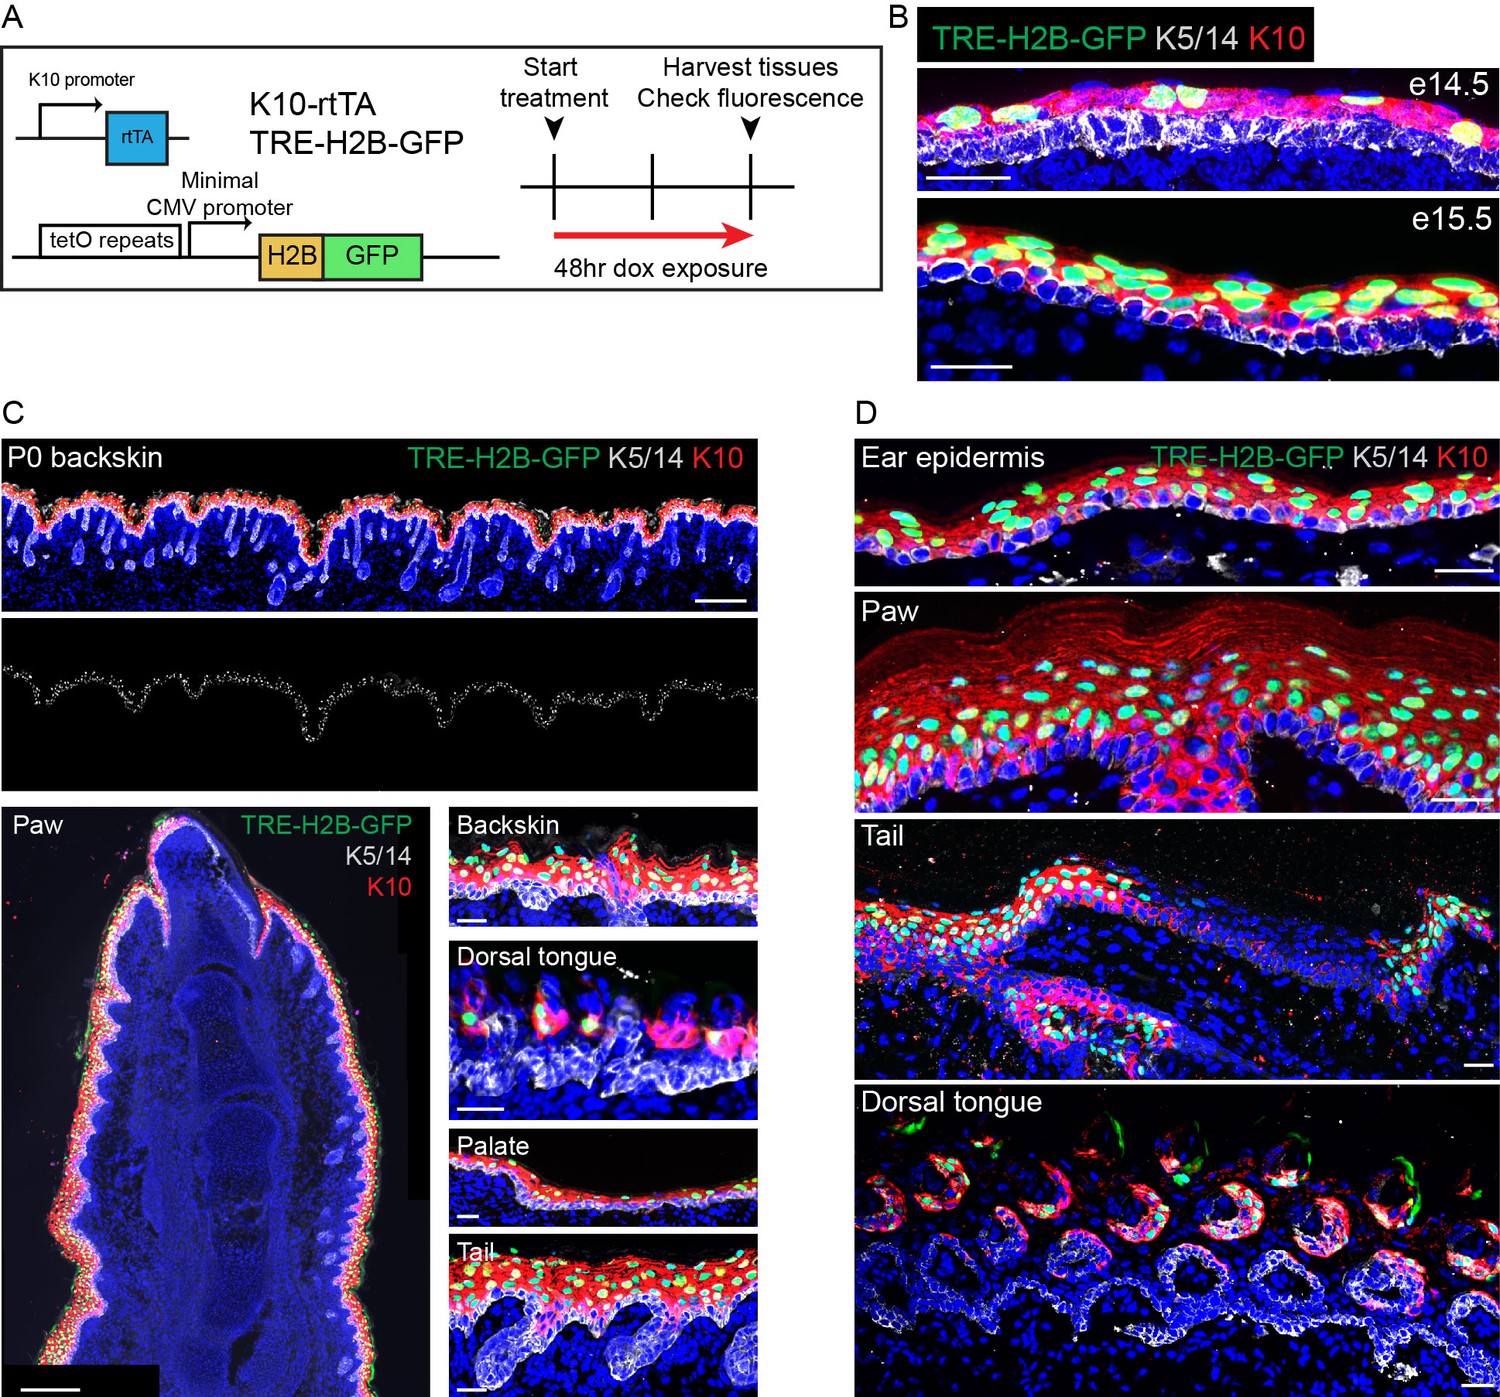
K10-rtTA expression faithfully recapitulates endogenous K10 expression.
(A) Alleles and experimental scheme used to validate K10-rtTA expression. (B) K10-rtTA induction begins at e14.and is uniform by e15.5. Scale-25μm. (C) Examples of robust K10-rtTA induction in multiple tissues in P0 pups. Scale (backskin, top)−200 μm. Scale (paw, bottom left)−200 μm. Scale (back skin, tongue, palate, tail, bottom right)−25 μm. (D) Examples of robust K10-rtTA induction across multiple tissues in adult (P30) mice. Note that in the tail, where endogenous K10 is restricted to the interscale region, H2B-GFP expression is only observed in interscale regions. Scale-25μm.
Figure 4—figure supplement 2
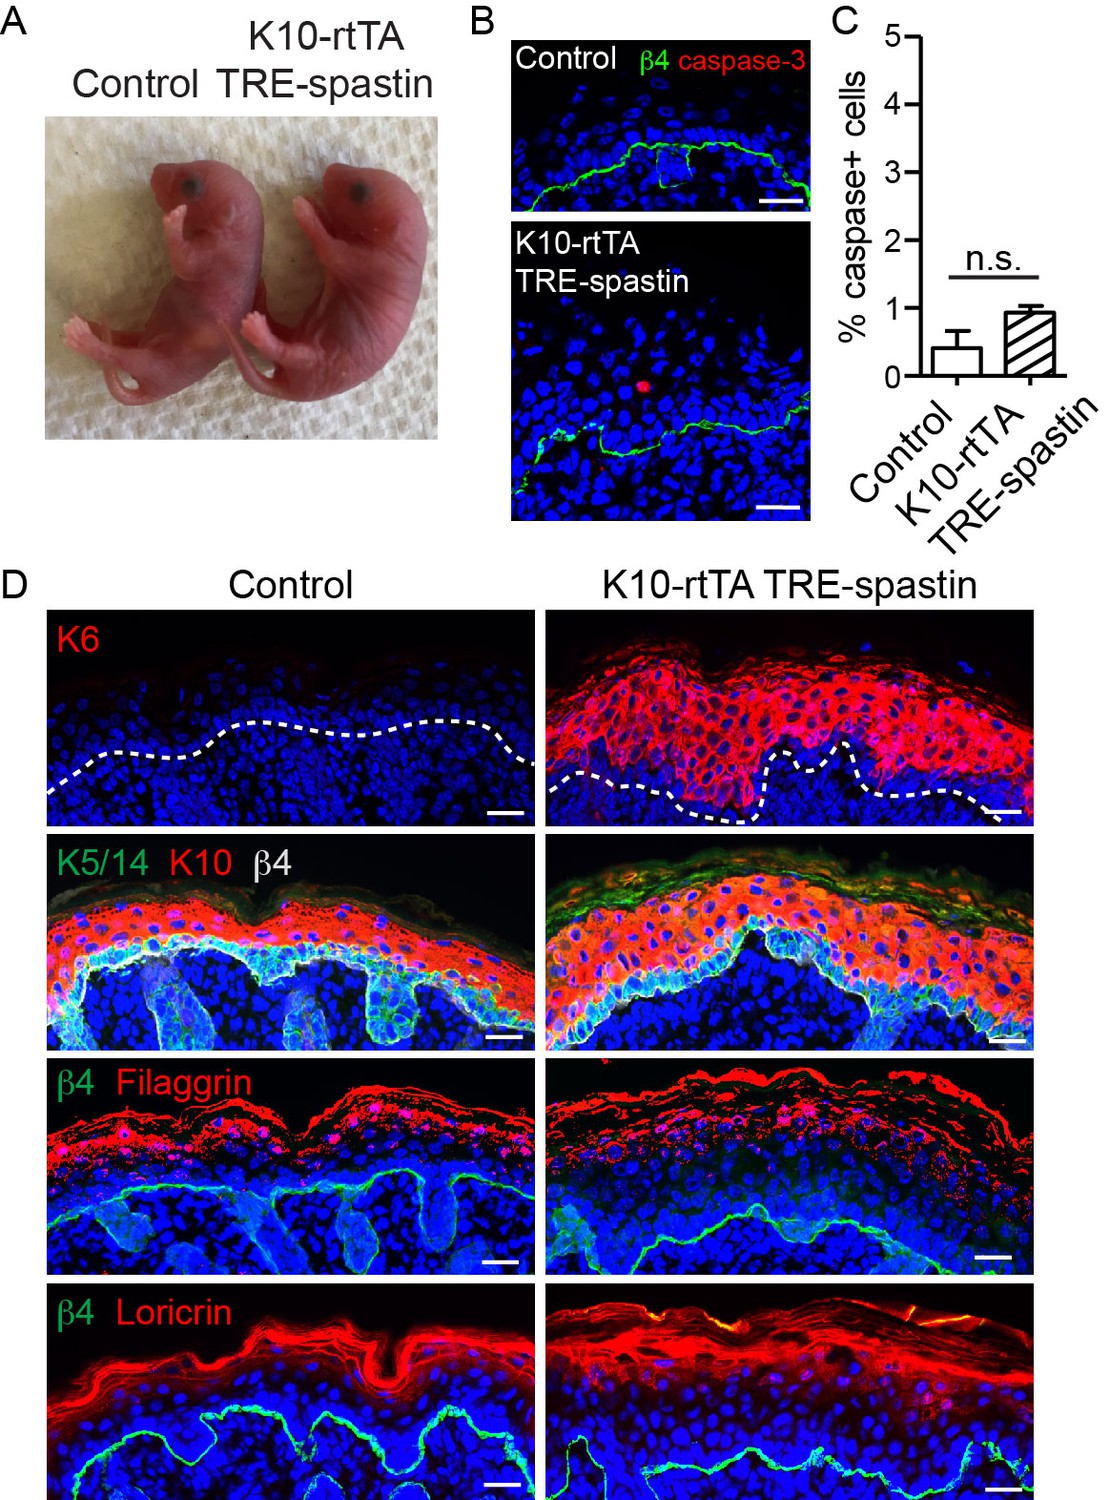
Characterization of K10-rtTA; TRE-spastin epidermis.
(A) P0 control and K10-rtTA; TRE-spastin mice. (B) Cleaved caspase-3 staining in control and K10-rtTA; TRE-spastin epidermis. (C) Quantification of cleaved-caspase-3-positive cells in control and K10-rtTA; TRE-spastin epidermis. n = 4 mice for each genotype. (D) Epidermal cross-sections stained for markers of stress (K6), stratification (K5/14 and K10), and terminal differentiation (loricrin and filaggrin). All scale bars are 25 μm. Data are presented as mean ± S.E.M. n.s.-p>0.05.
Figure 4—figure supplement 3

Granular cells fail to flatten in the K14-rtTA; TRE-spastin epidermis.
(A) HA-spastin cells in the K14-rtTA; TRE-spastin epidermis fail to flatten, in contrast to their wild-type neighbors. Asterisk indicates autofluorescence from cornified envelope. Scale-25µm. Zoomed regions with associated aspect ratios for outlined cells are shown below. Scale-10µm. (B) Quantification of the aspect ratio of individual control and spastin-positive cells. n > 100 cells for each group. *p<0.05, ***p<0.001.
Figure 4—figure supplement 4

Localization of E-cadherin in control and K10-rtTA; TRE-spastin epidermis.
Scale-25µm.
Figure 4—figure supplement 5
Spastin OE in suprabasal keratinocytes in adult mice perturbs epidermal homeostasis.
(A) Cross-section of adult (P45) epidermis in control and K10-rtTA; TRE-spastin mice demonstrating epidermal thickening in the mutant. (B) Spastin OE in adult mice causes a thickening of the suprabasal, K10-positive layers of the interfollicular epidermis. Dashed lines indicate the basement membrane. All scale bars are 10 µm.
Figure 5 with 1 supplement
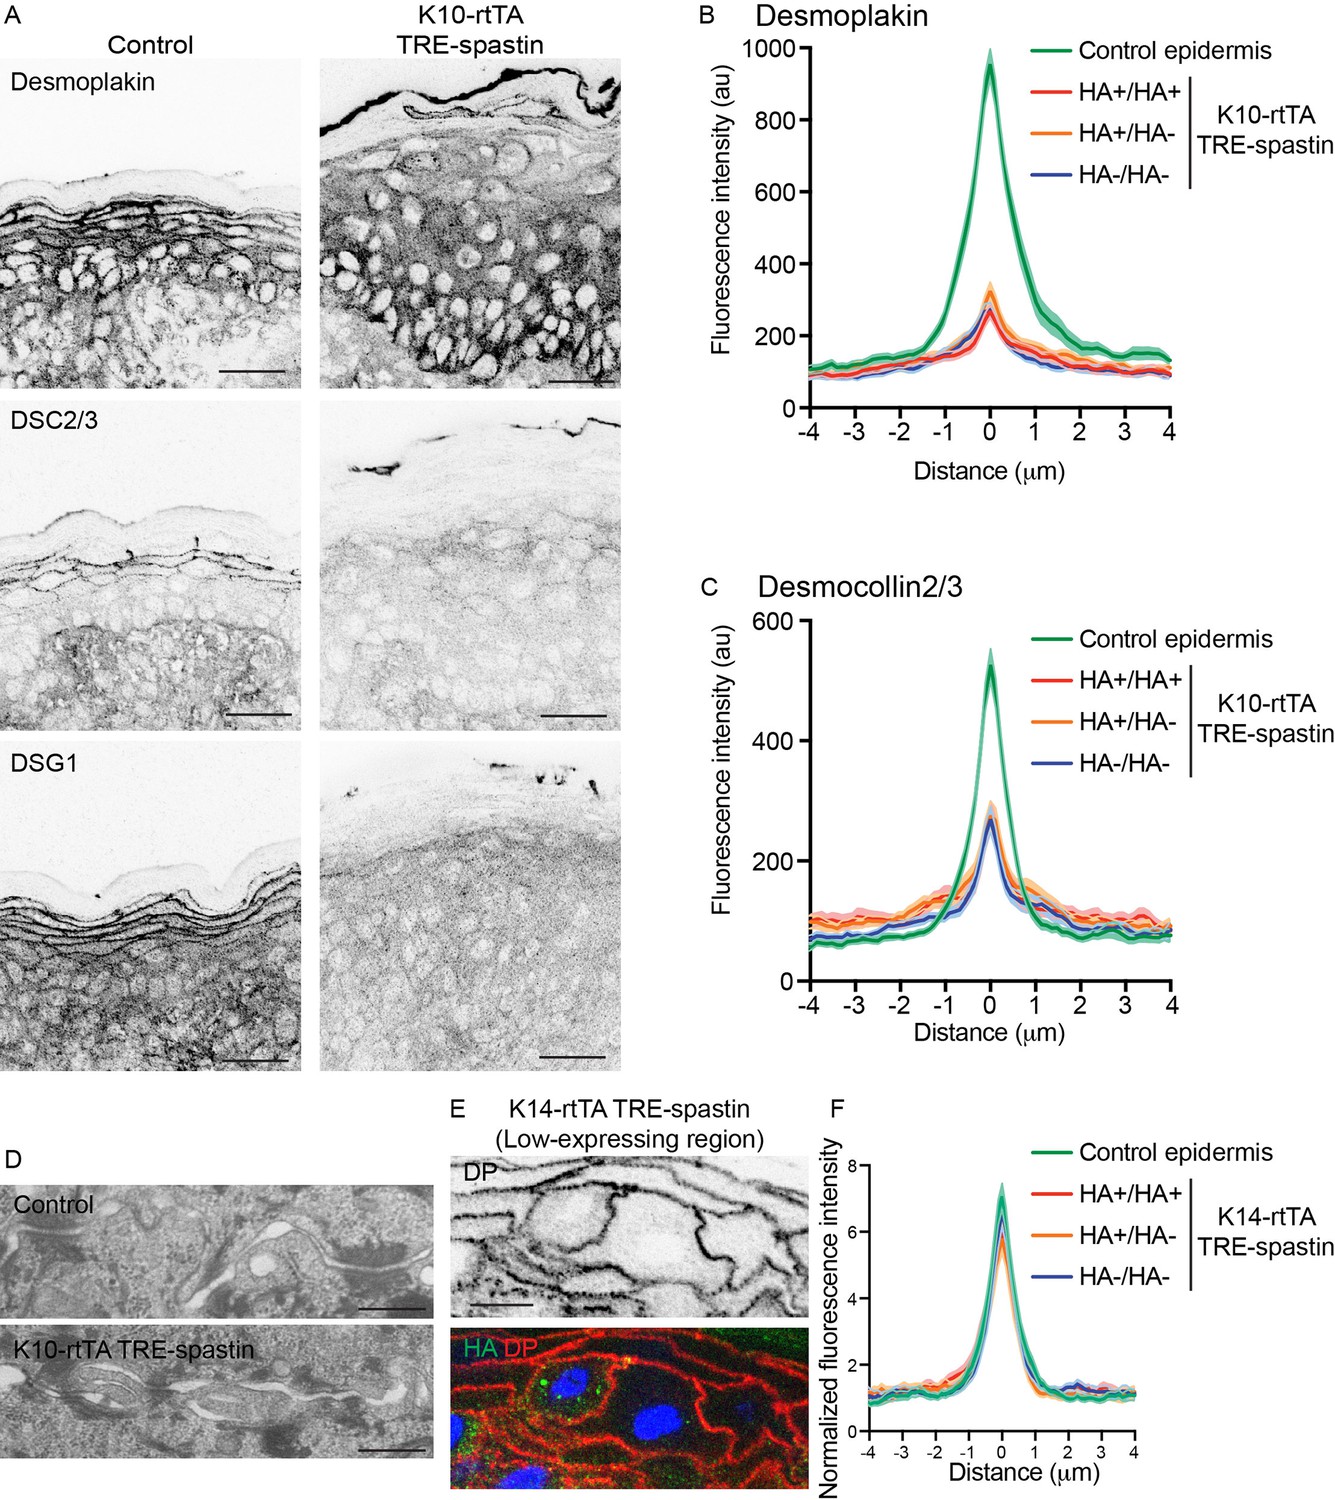
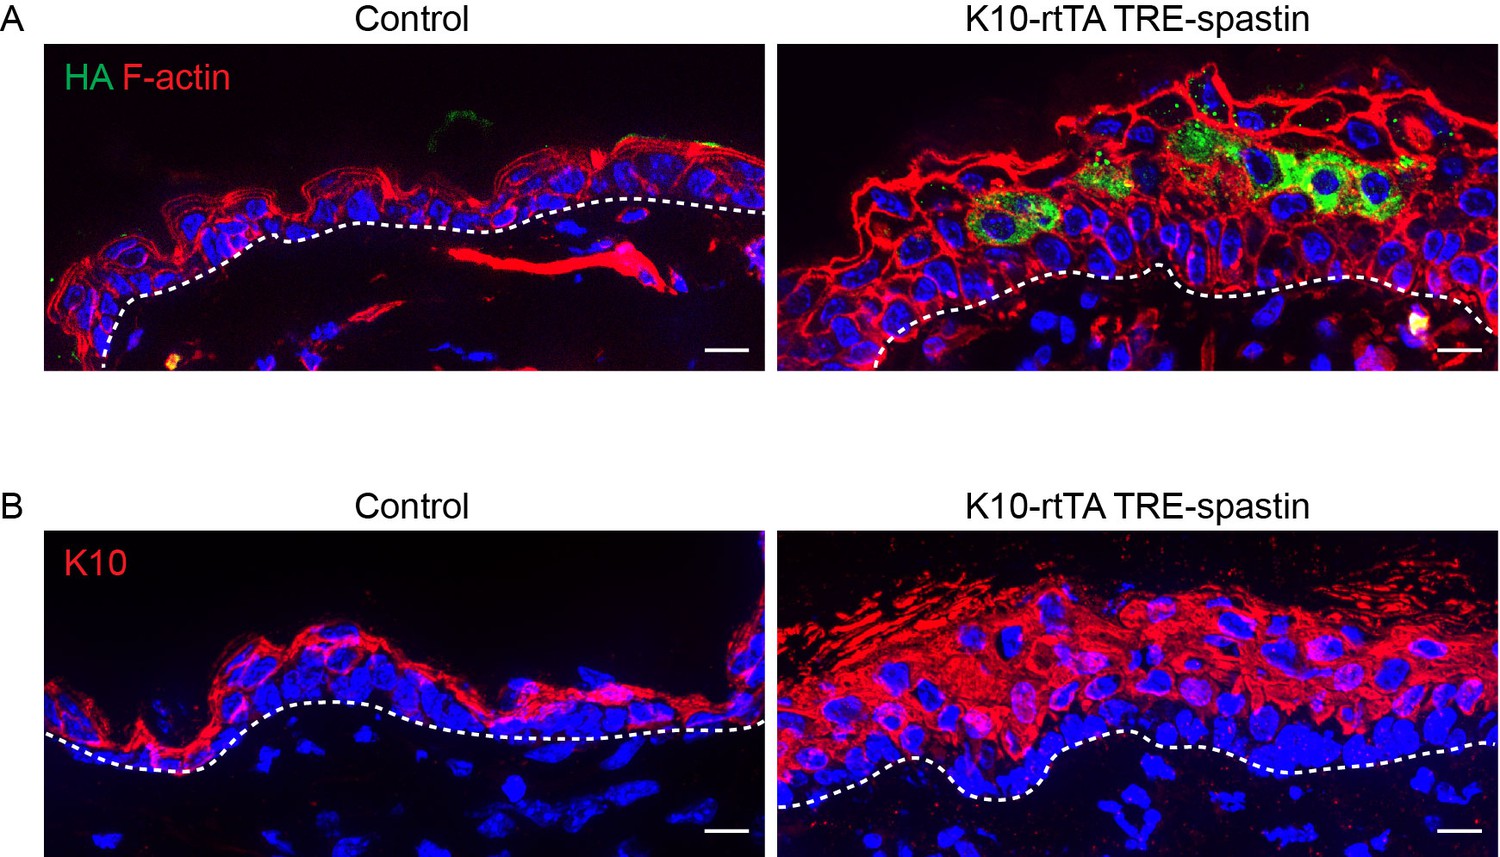
Non-cell-autonomous desmosome defects in K10-rtTA; TRE-spastin epidermis.
(A) Immunofluorescence of desmosome components in control and K10-rtTA; TRE-spastin epidermis. Scale-25µm. (B,C) Quantifications of desmoplakin and DSC2/3 immunofluorescence at cell-cell boundaries between indicated cell pairs in K10-rtTA; TRE-spastin epidermis. n = 40 pairs from 2 mice for each pair type. (D) Transmission electron micrographs of desmosomes in control and K10-rtTA; TRE-spastin epidermis. Scale-500nm. (E) A pair of spastin-positive cells in K14-rtTA; TRE-spastin epidermis showing that spastin expression does not intrinsically alter cortical desmoplakin localization. Scale-10µm. (F) Quantification of desmoplakin immunofluorescence at cell-cell boundaries between indicated cell pairs in K14-rtTA; TRE-spastin epidermis with sparse HA-spastin suprabasal cells. Control (n = 25 pairs), HA+/HA+ (n = 15 pairs), HA+/HA- (n = 26 pairs), and HA-/HA- (n = 36 pairs) from 2 mice for each pair type.
Figure 5—figure supplement 1
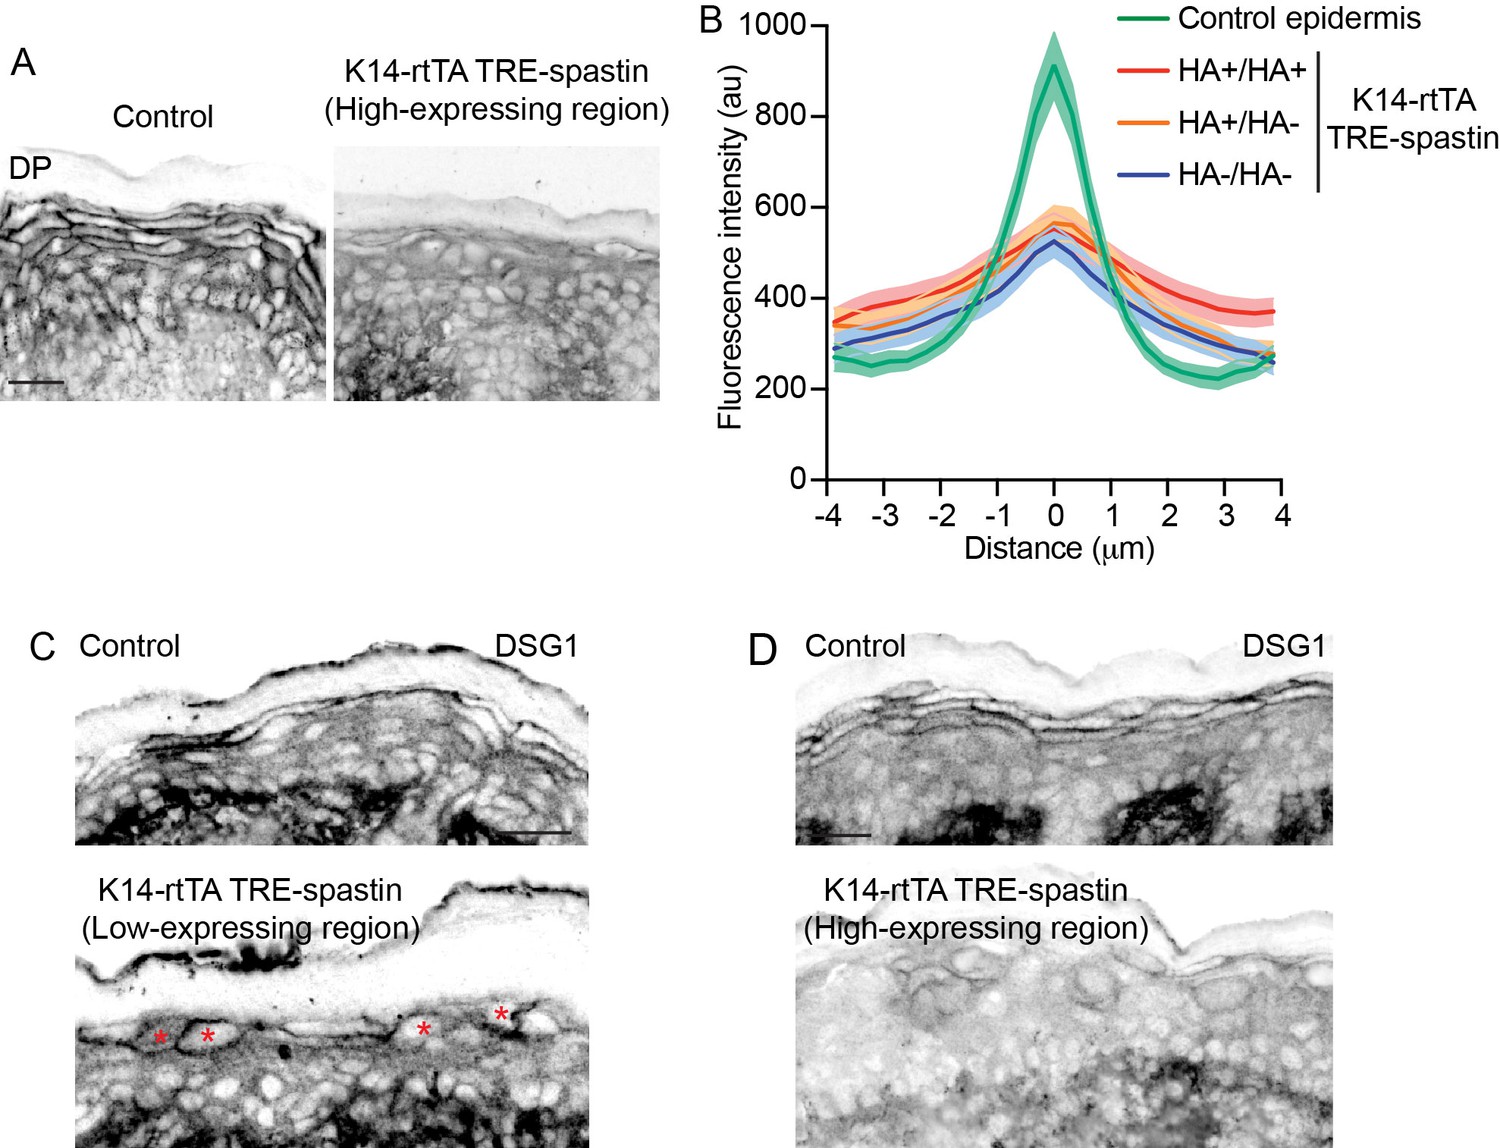
Characterization of desmosomes in K14-rtTA; TRE-spastin epidermis.
(A) Desmoplakin immunofluorescence in P0 control and K14-rtTA; TRE-spastin epidermis with a high number of spastin-expressing suprabasal cells. (B) Quantification of desmoplakin immunofluorescence between indicated cell pairs in control or K14-rtTA; TRE-spastin epidermis with many suprabasal spastin-positive cells. Control (n = 33 pairs), HA+/HA+ (n = 32 pairs), HA+/HA- (n = 33 pairs), HA-/HA- (n = 28 pairs) from 2 mice for each cell pair. (C) Cortical DSG1 localization is maintained in individual spastin-positive suprabasal cells (indicated by asterisks). (D) Cortical DSG1 expression is perturbed in K14-rtTA; TRE-spastin epidermis when a large number of suprabasal cells overexpress spastin. All scale bars are 25 µm.
Figure 6 with 1 supplement
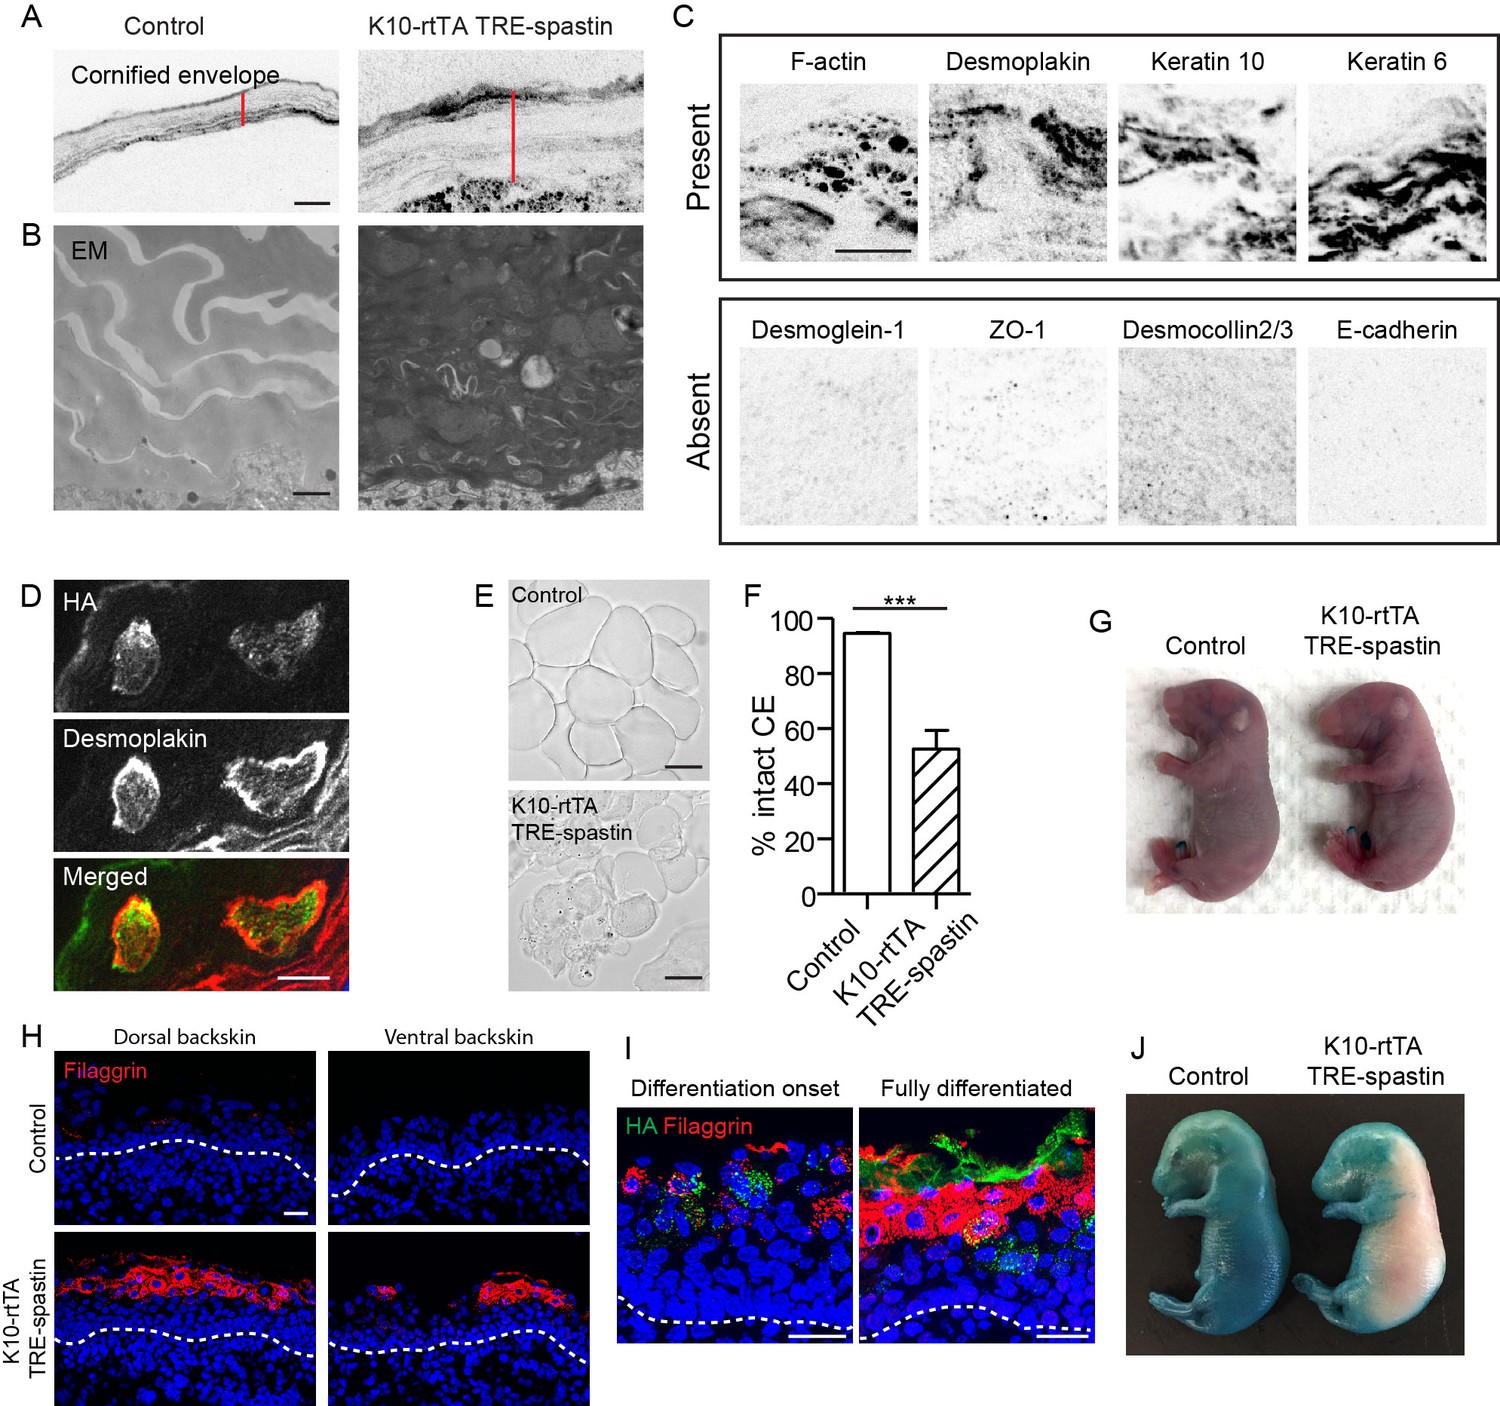
Proper corneocyte formation requires microtubules, but microtubule loss does not impair epidermal barrier function.
(A) CE is thickened in K10-rtTA; TRE-spastin tissue. Red lines indicate CE thickness. Scale-10µm. (B) Transmission electron micrographs of cornified envelopes in control and K10-rtTA; TRE-spastin epidermis. Scale-500nm. (C) Examples of protein localization in the corneocytes of K10-rtTA; TRE-spastin mice. All images are inverted fluorescence (black indicates signal). All of the indicated proteins are absent in wild-type corneocytes. Scale-10µm. (D) Spastin expression cell-autonomously causes abnormal retention of cytoplasmic proteins. Scale-10μm. (E) Isolated corneocytes from control and K10-rtTA; TRE-spastin mice. Scale-25μm. (F) Quantification of isolated cornified envelopes. n = 40 random fields from 4 mice for each genotype. (G) X-gal barrier assay on e18.5 control and K10-rtTA; TRE-spastin embryos. (H) Epidermal cross-sections from e16.5 control and K10-rtTA TRE-spastin embryos, stained for the differentiation marker filaggrin. Scale-25μm. (I) Premature differentiation is non-cell autonomous in K10-rtTA; TRE-spastin epidermis. Filaggrin is induced in both spastin-positive and spastin-negative cells in prematurely differentiating K10-rtTA; TRE-spastin epidermis. Spastin-positive cells in the spinous layer do not induce filaggrin. Scale-25μm. (J) K10-rtTA; TRE-spastin e16.5 embryos prematurely form an epidermal barrier. Data are presented as mean ± S.E.M. ***p<0.001.
Figure 6—figure supplement 1
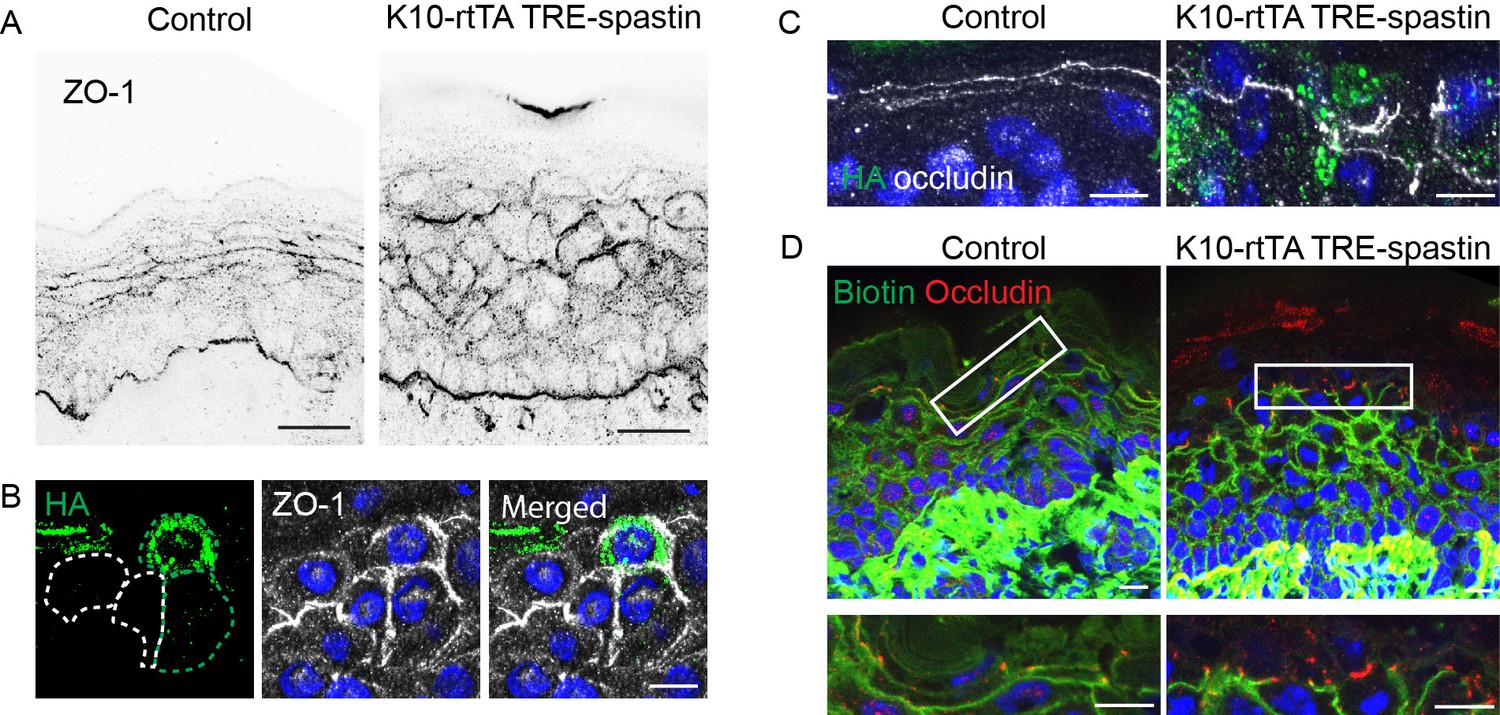
Spastin OE does not impair tight junction localization or function.
(A) ZO-1 localization in control and K10-rtTA; TRE-spastin epidermis. Scale-25µm. (B) Region where spastin-positive cells are next to spastin-negative cells in K10-rtTA; TRE-spastin tissue. Note that ZO-1 is still cortically localized in spastin-positive cells. Scale-10µm. (C) Localization of occludin at the cell cortex is maintained in K10-rtTA; TRE-spastin epidermis. Scale-10µm. (D) Biotin diffusion is blocked by occludin in K10-rtTA; TRE-spastin epidermis. Scale-10µm.
Videos
Video 1
EB1-GFP dynamics in a proliferative, basal keratinocyte in a mouse embryo.
https://doi.org/10.7554/eLife.29834.002
Video 2
EB1-GFP dynamics in a differentiated, spinous keratinocyte in a mouse embryo.
https://doi.org/10.7554/eLife.29834.003
Video 3
EB1-GFP dynamics in a differentiated, granular keratinocyte in a mouse embryo.
https://doi.org/10.7554/eLife.29834.004
Video 4
Z-stack of an example of entosis in K10-rtTA; TRE-spastin epidermis.
Phalloidin marks the cell outlines.
Tables
Table 1
Quantifications of microtubule parameters in indicated cell types.
Data are represented as mean ± standard deviation. n = 160 microtubules for each cell type.
| EB1 density (puncta/100 µm2) | Mean growth distance (µm) | Mean growth speed (µm/min) | Mean growth duration (s) | ||
|---|---|---|---|---|---|
| In vivo | Basal | 9.1 ± 2.1 | 3.1 ± 1.77 | 11.09 ± 3.11 | 17.84 ± 10.98 |
| Spinous | 8.68 ± 2.3 | 2.1 ± 1.5 | 12.2 ± 3.27 | 10.24 ± 6.32 | |
| Granular | 17.39 ± 4.64 | 0.89 ± 0.57 | 7.1 ± 3.66 | 8.49 ± 4.33 | |
| Primary | Basal | 3.56 ± 1.17 | 6.74 ± 3.9 | 29.23 ± 9.19 | 14.63 ± 9.11 |
| Suprabasal | 4.23 ± 1.76 | 5.31 ± 3.34 | 31.46 ± 7.97 | 10.15 ± 5.62 |
Additional files
-
Transparent reporting form
- https://doi.org/10.7554/eLife.29834.022
Download links
A two-part list of links to download the article, or parts of the article, in various formats.
Downloads (link to download the article as PDF)
Open citations (links to open the citations from this article in various online reference manager services)
Cite this article (links to download the citations from this article in formats compatible with various reference manager tools)
A transgenic toolkit for visualizing and perturbing microtubules reveals unexpected functions in the epidermis
eLife 6:e29834.
https://doi.org/10.7554/eLife.29834


