CRISPRi is not strand-specific at all loci and redefines the transcriptional landscape
- University of Oxford, United Kingdom
- Suez University, Egypt
Figures
Figure 1 with 1 supplement
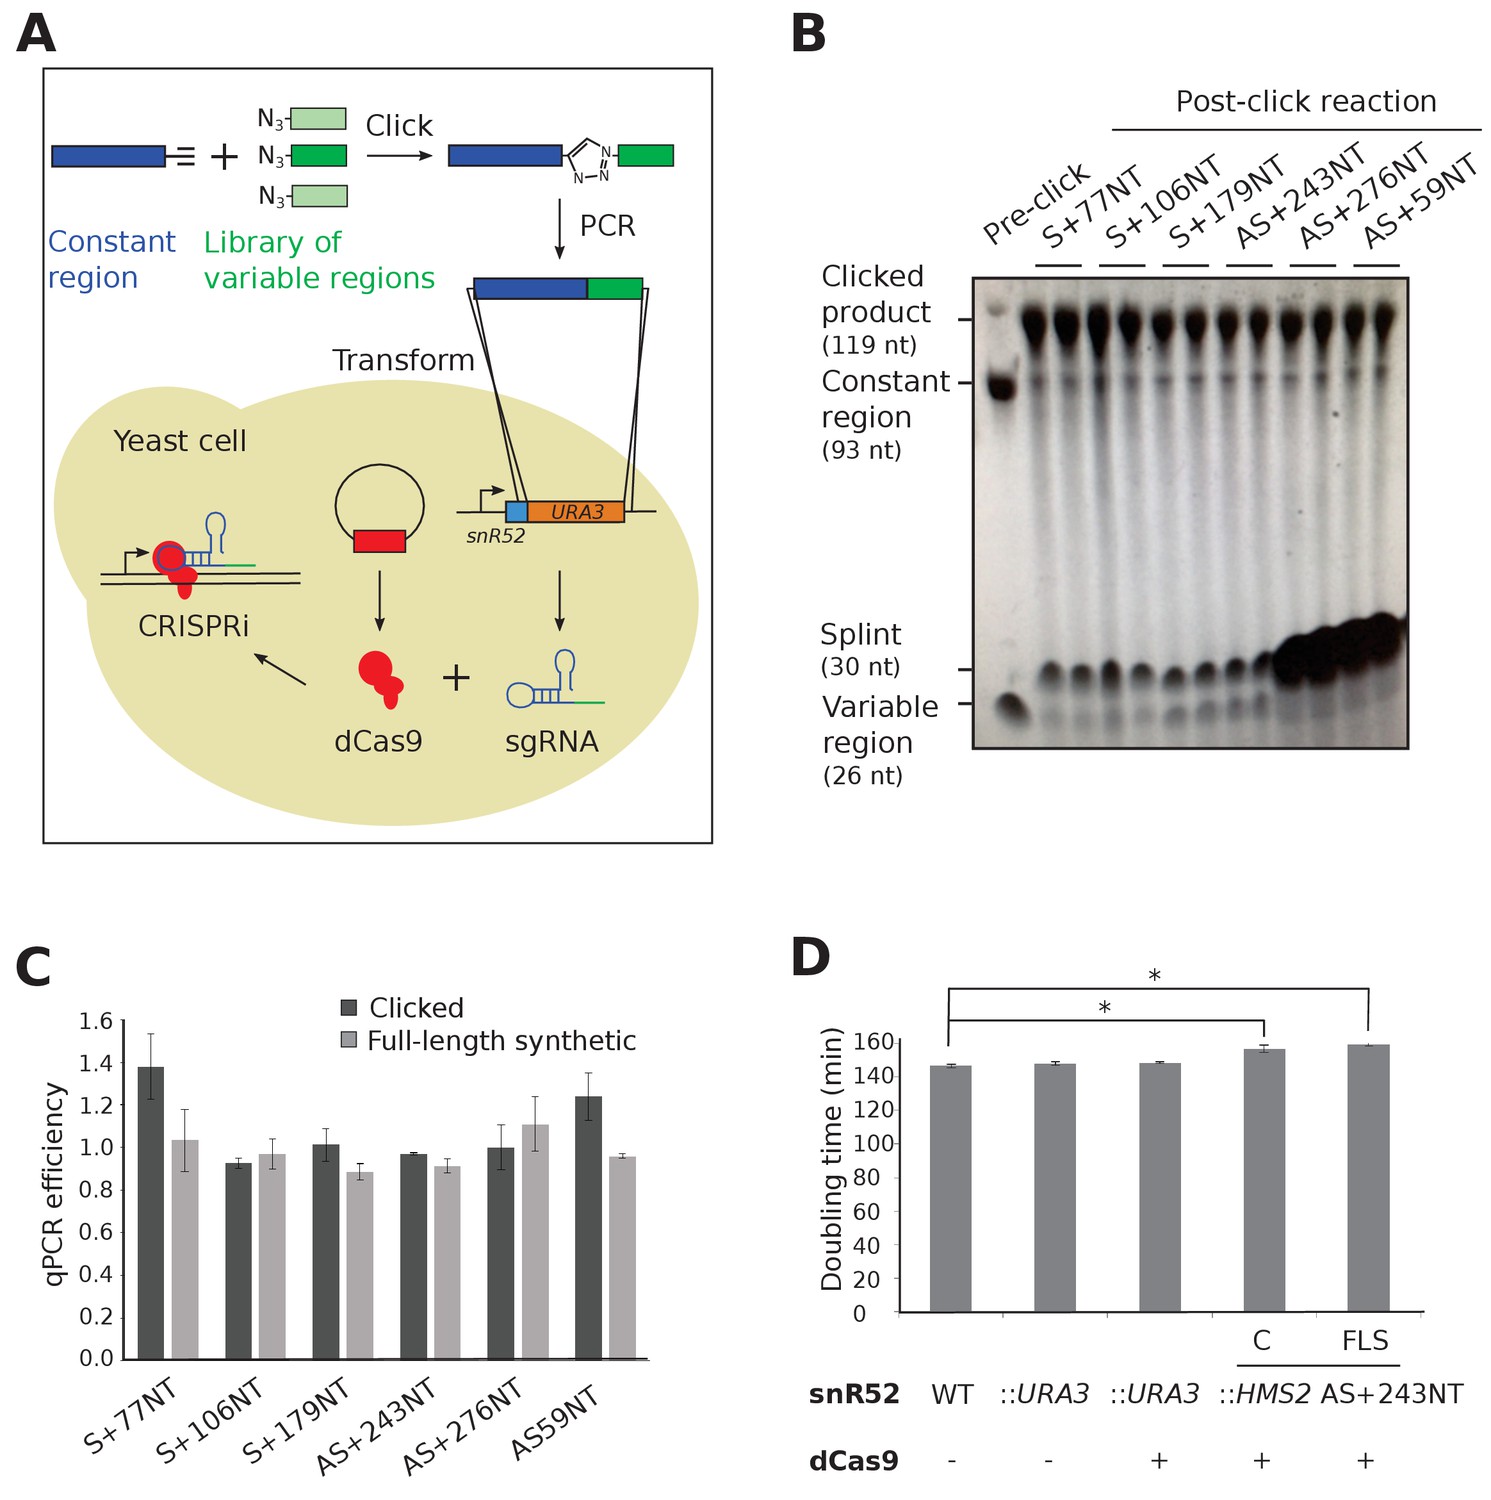
Experimental strategy for sgRNA template synthesis and incorporation into yeast.
(A) An outline of the experiment. DNA templates for sgRNA production were generated using a click chemistry reaction between a single-stranded DNA oligonucleotide with a 3’ alkyne group encoding the constant region (dark blue) and a number of single-stranded DNA oligonucleotides with 5’ azido groups encoding the different variable regions (green). The resulting single-stranded DNA oligonucleotide was purified, amplified by PCR and transformed into yeast to replace the URA3 selection cassette that had previously been introduced into the endogenous snR52 locus. Correct insertion was confirmed by Sanger sequencing. The expression of the sgRNA is driven from the endogenous RNA polymerase III snR52 promoter and processed to produce a mature sgRNA. The sgRNA couples with enzymatically dead Cas9 (dCas9, red), expressed under the control of the TDH3 promoter off a plasmid, to block transcription. See Materials and methods for more detail. (B) A polyacrylamide gel visualised by UV shadowing reveals a high efficiency of the click reaction for all the HMS2 constructs (see Figure 2E and Figure 3—figure supplement 1 for positions of the sgRNA binding sites). The sizes of the variable region, DNA splint, constant region and clicked product are indicated. (C) PCR efficiencies of the clicked and full-length synthetic DNA oligonucleotides as measured by qPCR with a serial dilution series. N = 3, errors are standard error of the mean (SEM), all differences are not significant p>0.05. See Source data 1, tab 2. (D) Doubling times (min) of the indicated yeast strains grown in complete synthetic media minus leucine. C, strains constructed using clicked oligonucleotides; FLS, strains constructed using full-length synthetic oligonucleotides. N = 10, errors are SEM, *p<0.05. See Source data 1, tabs 3–4.
Figure 1—figure supplement 1
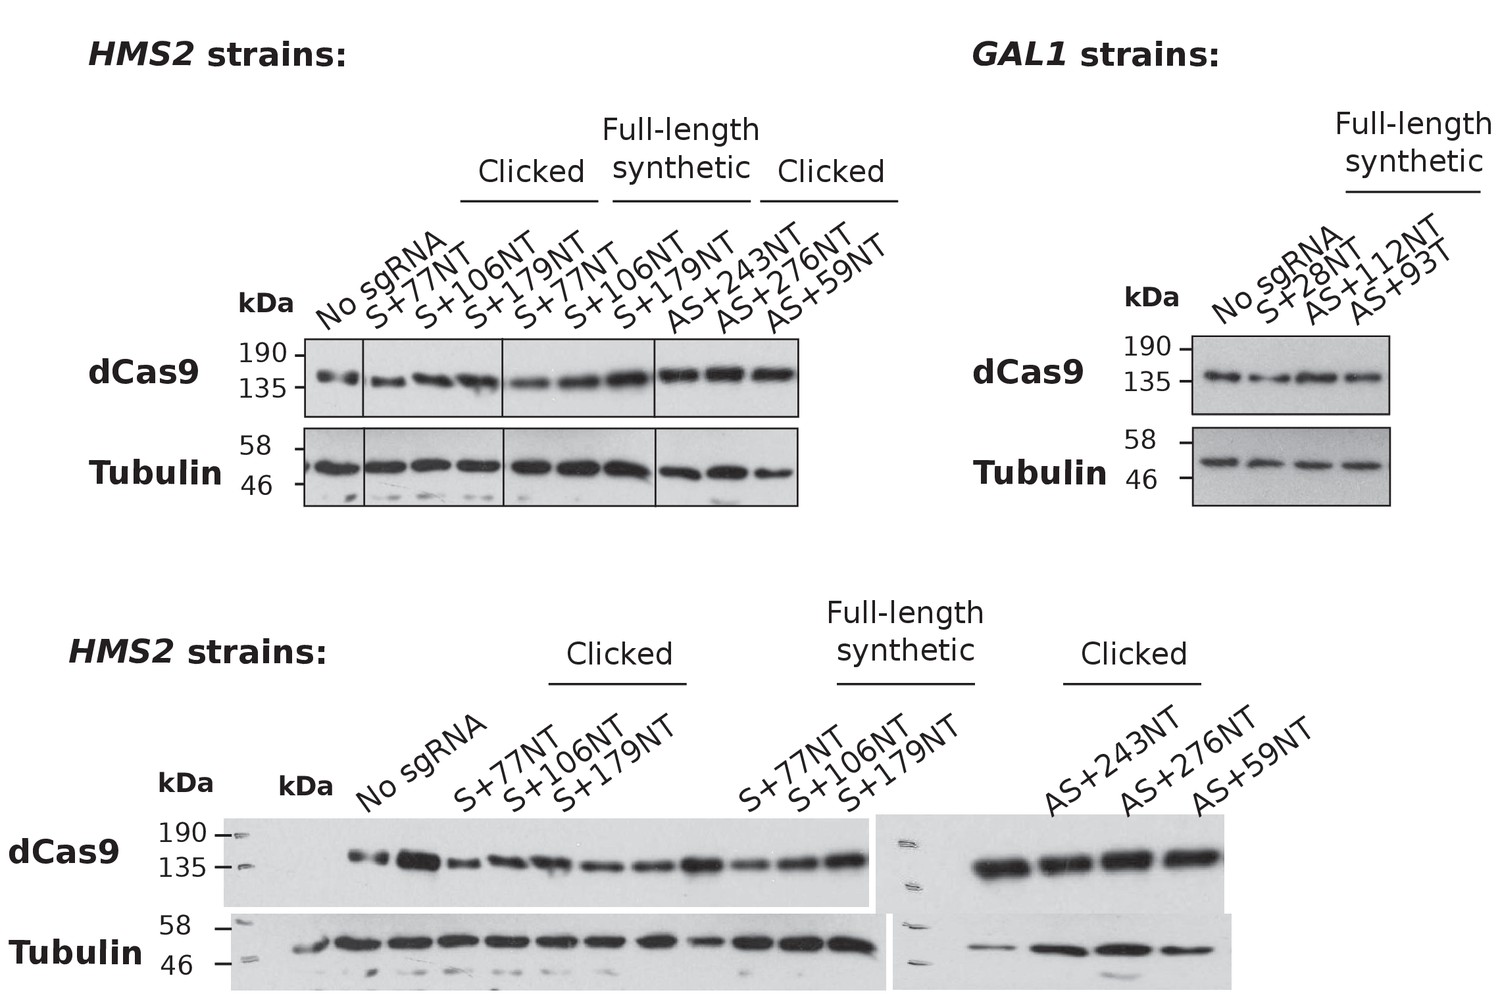
Levels of dCas9 protein in the experimental strains.
Western blots showing levels of dCas9 produced in the strains expressing the indicated sgRNAs against HMS2 (left panel) and GAL1 (right panel). HMS2 strains constructed using the clicked and control full-length synthetic DNA oligos are shown. Tubulin levels are used as a loading control. Images are taken from the same gels with the same exposure times but with some lanes spliced out (indicated with vertical lines).
Figure 2 with 3 supplements

CRISPRi reduces antisense transcripts at GAL1 and HMS2.
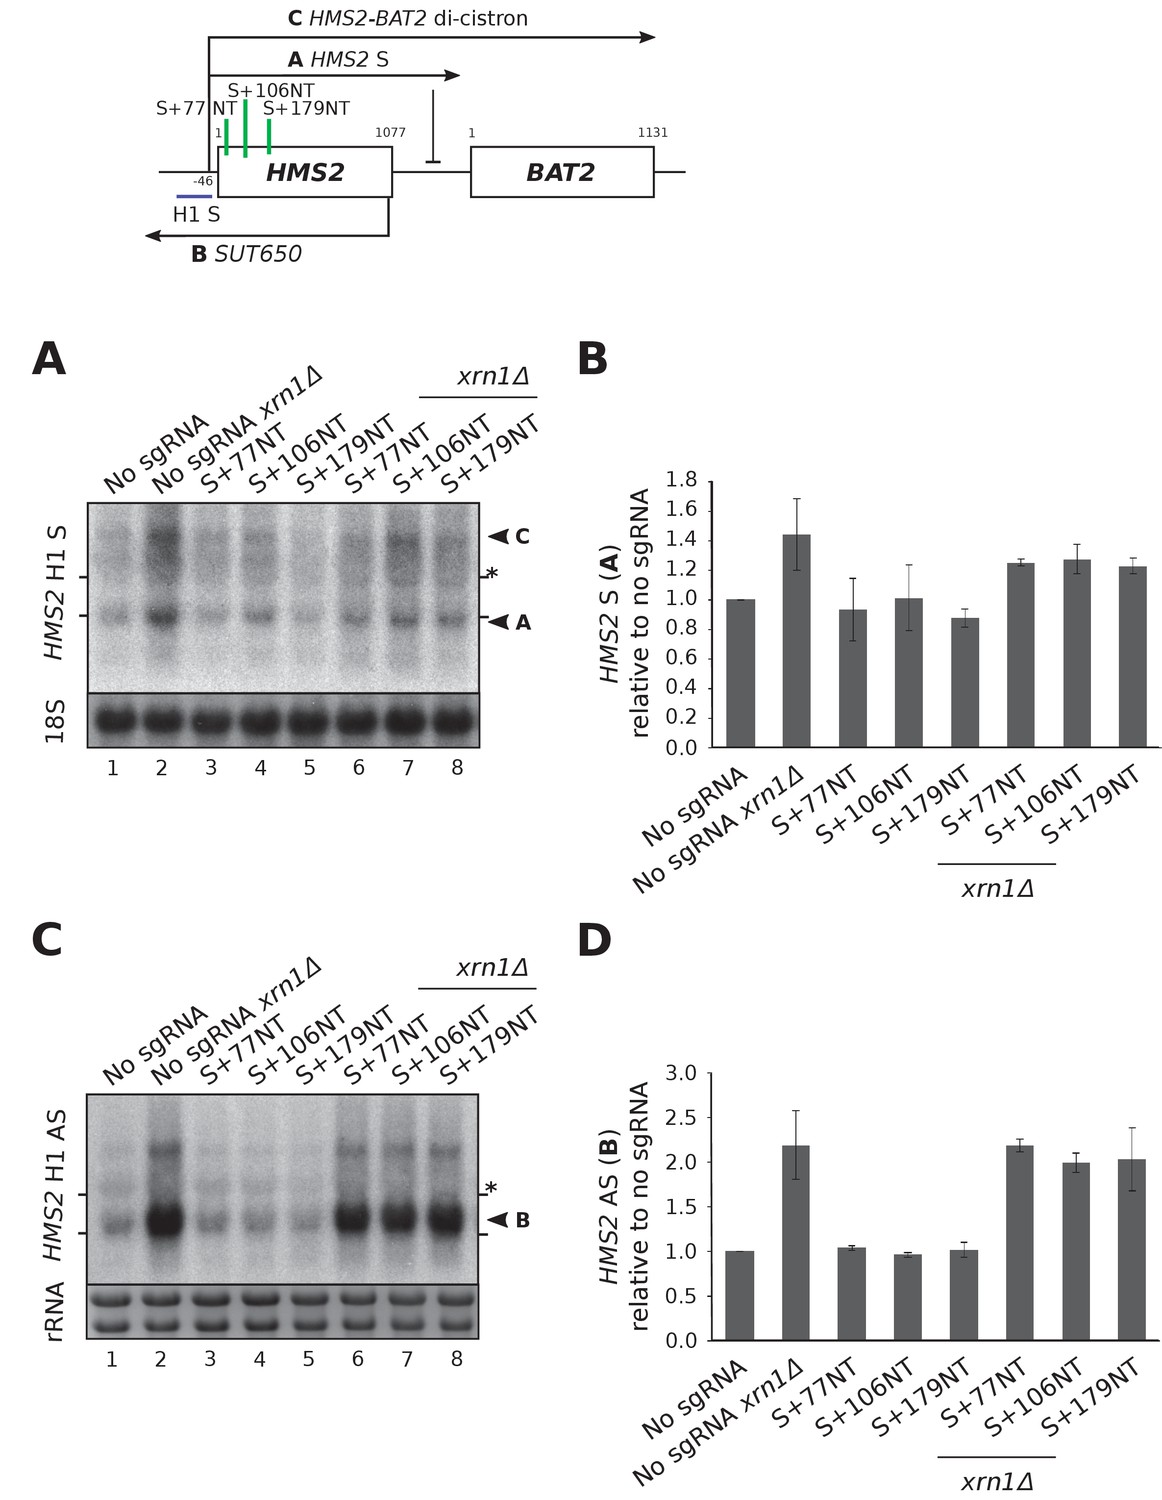
(A) A schematic demonstrating the previously reported requirement of non-template strand targeting by the sgRNA/dCas9 complex for strand-specific transcriptional repression. Arrows indicate the direction of transcription. NT, non-template; T, template; red, dCas9; PAM, protospacer adjacent motif; green/blue, sgRNA. (B) A schematic of the engineered GAL1 locus showing the site of insertion of the ADH1 terminator (T, red box), the transcription start site for the stable GAL1 antisense transcript and the positions of the designed sgRNAs (green vertical lines) targeting the non-template (AS+28NT, AS+112NT) and template (AS+93NT) strands with respect to antisense transcription. The position of the Northern blotting probe detecting the GAL1 AS transcript is shown in purple. (C) A Northern blot showing the reduction in GAL1 antisense transcript (black arrowhead) in the strain expressing sgRNA AS+112NT/dCas9 relative to the no sgRNA control (GAL1:ADH1t snR52::URA3 with dCas9). sgRNAs AS+28NT and AS+93T do not alter GAL1 AS levels. Samples were taken from cells grown in glucose (t = 0) and at the indicated times after transfer to galactose-containing media (min). Positions of the rRNA are indicated by the short horizontal lines. Ethidium-bromide-stained rRNA is used as loading control. (D) Quantification of Northern blotting for the GAL1 AS transcript at t = 0 in the control no sgRNA strain and the strain with sgRNA AS+112NT. N = 6, errors are SEM, *p=0.004. See Source data 1, tabs 10–12. (E) A map of the HMS2 locus showing the HMS2 AS transcript, SUT650 (black arrow, transcript B) and positions of the three sgRNAs targeting SUT650 (green vertical lines). The position of the Northern blotting probe to detect SUT650 (H1 AS) is shown by the purple line. (F) A Northern blot probed with HMS2 antisense probe H1 (see schematic in (E)) showing the level of SUT650 (black arrowhead, transcript B) in the no sgRNA control (snR52::URA3 with dCas9) strain and strains expressing the indicated antisense-targeting sgRNAs. Deletion of XRN1 allows detection of a shorter antisense transcript (Bt) in the strain expressing AS+243NT. Positions of the rRNA are indicated by the short horizontal lines. *Represents cross-hybridisation with the 25S rRNA. A blot probed for the 18S rRNA is used as loading control. (G) Quantification of the level of SUT650 (transcript B) reduction in the strains expressing each of the three antisense sgRNAs relative to the control no sgRNA strain. N = 4–8, errors represent SEM, *p<0.05. Click-linked and full-length synthetic sgRNA AS+243NT templates behave similarly. See Source data 1, tabs 5–9. (H) Northern blots with a series of HMS2 antisense-specific probes. A new shorter antisense transcript (Bt) can be detected upon XRN1 deletion in the strains expressing sgRNA AS+243NT/dCas9. Two clones of the CRISPRi strains produced using clicked (C) or full-length synthetic (FLS) DNA oligos for strain construction are shown. Positions of the antisense-specific probes (purple) and the site of sgRNA AS+243NT/dCas9 binding (green vertical line) are shown in the schematic. Positions of the rRNA on the Northern blot are indicated by the short horizontal lines. *Represents cross-hybridisation with the 25S rRNA. Ethidium-bromide-stained rRNA is used as loading control.
Figure 2—figure supplement 1

TIF-seq data showing the heterogeneity in SUT650 transcript start site.
Transcript start and end sites on the Crick strand of Chromosome X for SUT650 as mapped by Transcript Isoform Sequencing (TIF-seq) (Pelechano et al., 2013). The main SUT650 transcript start site at position 705,244 bp was used in the positioning of the HMS2 AS-targeting sgRNAs shown in the schematic below.
Figure 2—figure supplement 2
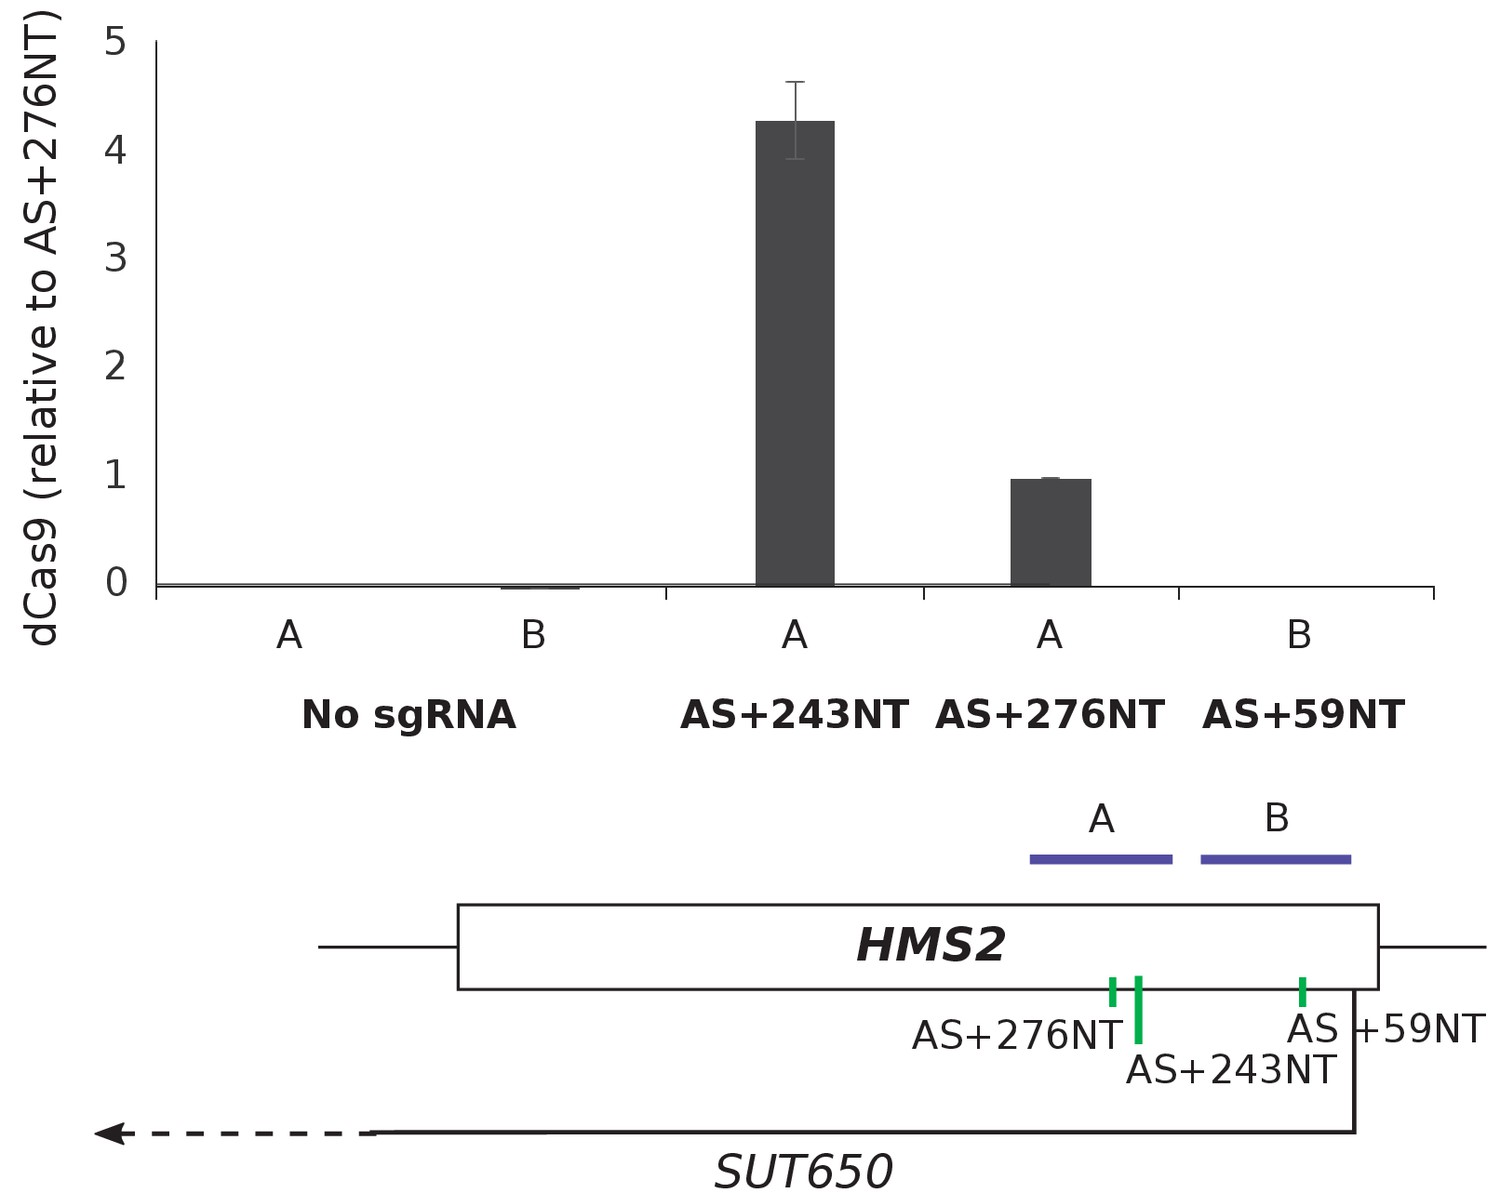
dCas9 is only detected at the HMS2 AS+243NT sgRNA binding site.
Chromatin immunoprecipitation for dCas9 in the control strain with no sgRNA (snR52::URA3 with dCas9) and in the strains with the indicated SUT650-targeting sgRNAs at the predicted sites of SUT650-targeting sgRNA binding in HMS2 (sites A and B). Primer positions for qPCR are shown in purple on the locus map. Robust dCas9 signal is only detected at the binding site of the repressive sgRNA AS+243NT. Signal normalised to input and sgRNA AS+276NT. N = 3, error are SEM. See Source data 1, tabs 13–17.
Figure 2—figure supplement 3
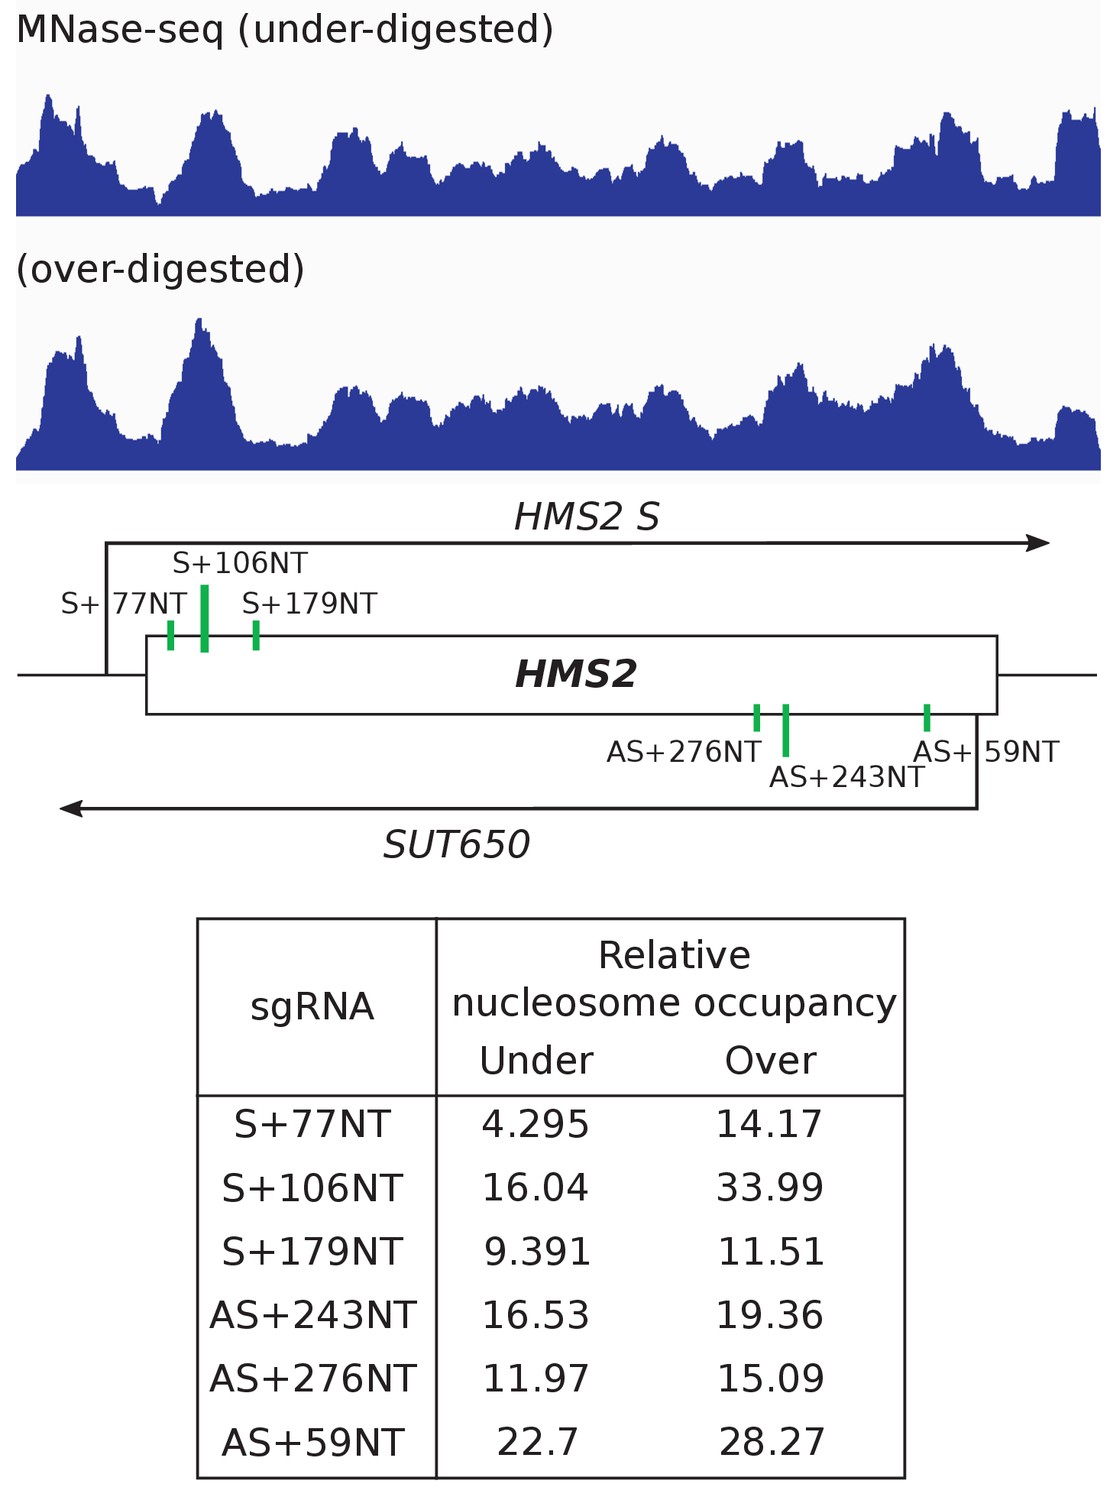
Nucleosome occupancy over the HMS2 sgRNA target sites does not anti-correlate with level of repression.
Nucleosome occupancy map for HMS2 as measured by sequencing of a sample that has been under- and over-digested with MNase (Knight et al., 2014). The schematic underneath shows the positions of the sgRNA targeting sites. Relative nucleosome occupancy at each sgRNA binding site is shown in the table for the under- and over-digested samples.
Figure 3 with 1 supplement
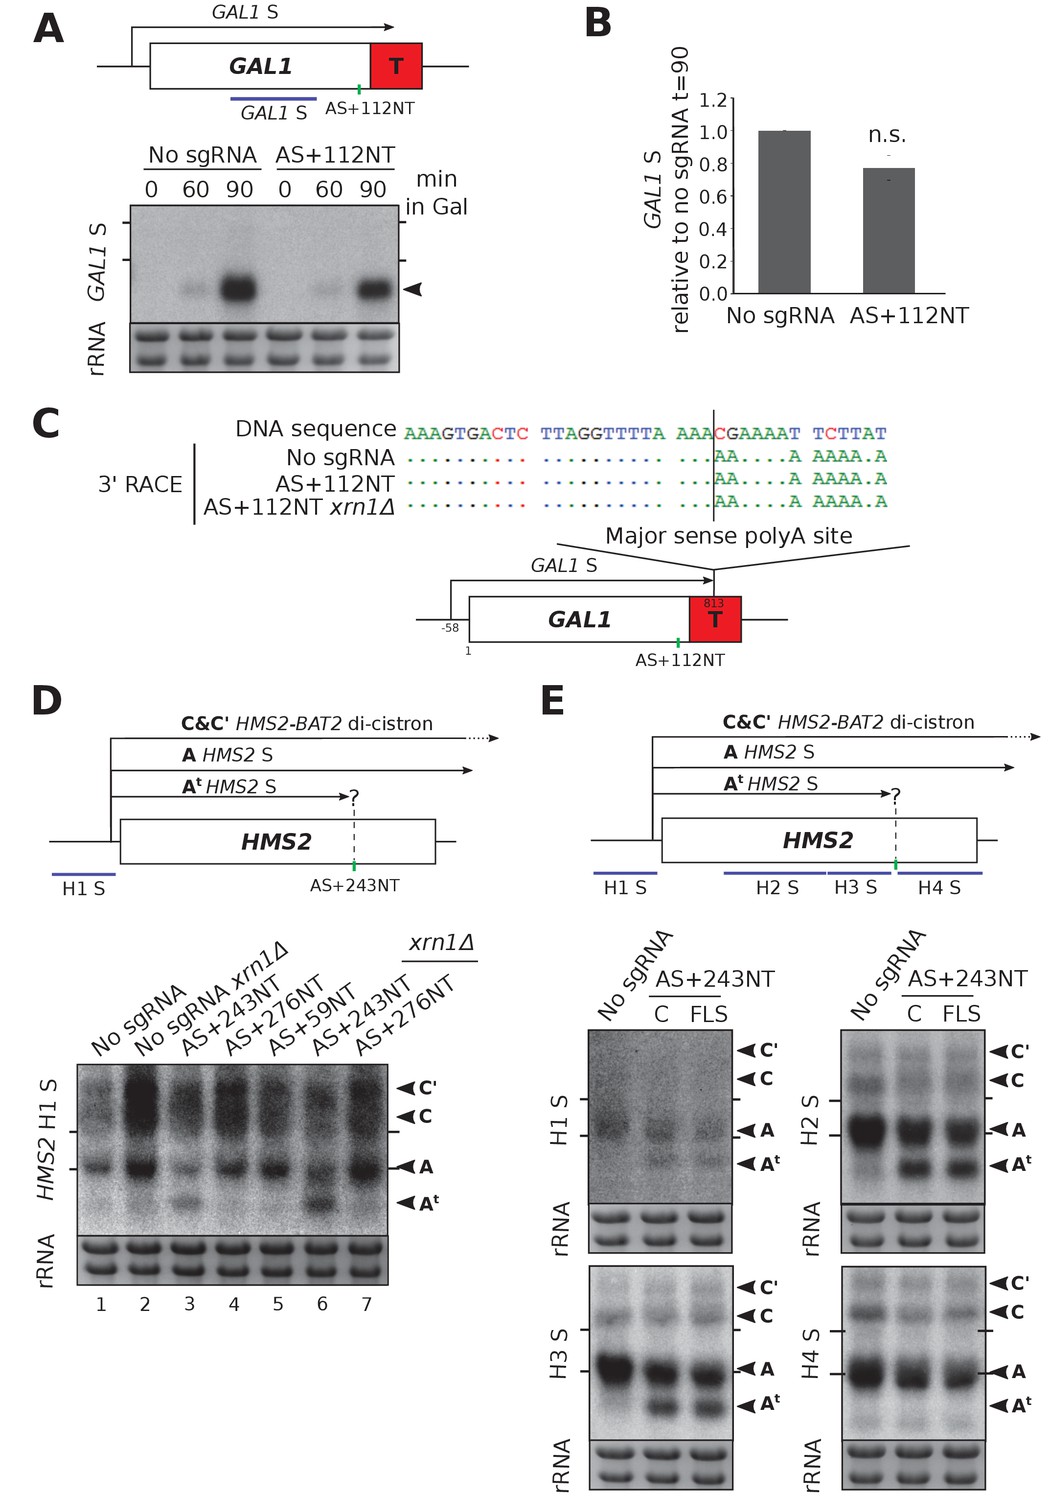
HMS2 and GAL1 sense transcripts are differently affected by blocking of their respective antisense transcripts.
(A) A Northern blot probed for the GAL1 sense transcript (black arrow) in the control strain with no sgRNA (GAL1 ADH1t snR52::URA3 with dCas9) and in the strain expressing sgRNA AS+112NT/dCas9. Samples were taken from cells grown in glucose (t = 0) and at the indicated times after transfer to galactose-containing media (min). Ethidium-bromide-stained rRNA is used as a loading control. (B) Quantification of the Northern blot shown in (A) at t = 90. N = 4, error bars represent SEM, change is statistically non-significant (n.s.) p=0.062. See Source data 1, tabs 10–12. (C) A schematic showing the results of GAL1 sense transcript 3’ end mapping by RACE in the strains indicated. All distances are shown relative to the sense TSS. Transcript cleavage and polyadenylation occurs beyond the position of the GAL1 AS-blocking AS+112NT sgRNA shown (green vertical line). (D) A Northern blot probed with HMS2 sense probe H1 (purple) showing the level of HMS2 sense (black arrowhead, transcript A) in the no sgRNA control (snR52::URA3 with dCas9) strain and strains expressing the indicated antisense-targeting sgRNAs. A truncated sense transcript (At) was also detected in the strain expressing AS+243NT. C and C’ are read-through HMS2-BAT2 transcripts (see [Nguyen et al., 2014]). Positions of the rRNA are indicated by the short horizontal lines. Ethidium-bromide-stained rRNA is used as loading control. (E) Northern blots with a series of HMS2 sense-specific probes detecting the regions indicated in the schematic. The position of the sgRNA AS+243NT/dCas9 binding site is shown (green vertical line). Positions of the rRNA are indicated by the short horizontal lines. Ethidium-bromide-stained rRNA is used as loading control.
Figure 3—figure supplement 1
HMS2 sense-targeting sgRNAs/dCas9 are not effective at repressing HMS2 sense and do not alter antisense transcript levels.
(A) A Northern blot probed with HMS2 sense probe H1 (purple) showing the level of HMS2 sense (black arrowhead, transcript A) in the no sgRNA control (snR52::URA3 with dCas9) strain and strains expressing the indicated sense-targeting sgRNAs in the presence or absence of XRN1. Positions of the rRNA are indicated by the short horizontal lines. The 18S rRNA is used as loading control. *Represents cross-hybridisation with the 25S rRNA. (B) Quantification of the Northern blot in (A). N = 2, errors represent the SEM. See Source data 1, tab 6. (C) A Northern blot as (A) but probed with HMS2 antisense-specific probe H1. Ethidium-bromide-stained rRNA is used as loading control. (D) Quantification of the Northern blot in (C). N = 2, errors represent the SEM. See Source data 1, tab 6.
Figure 4
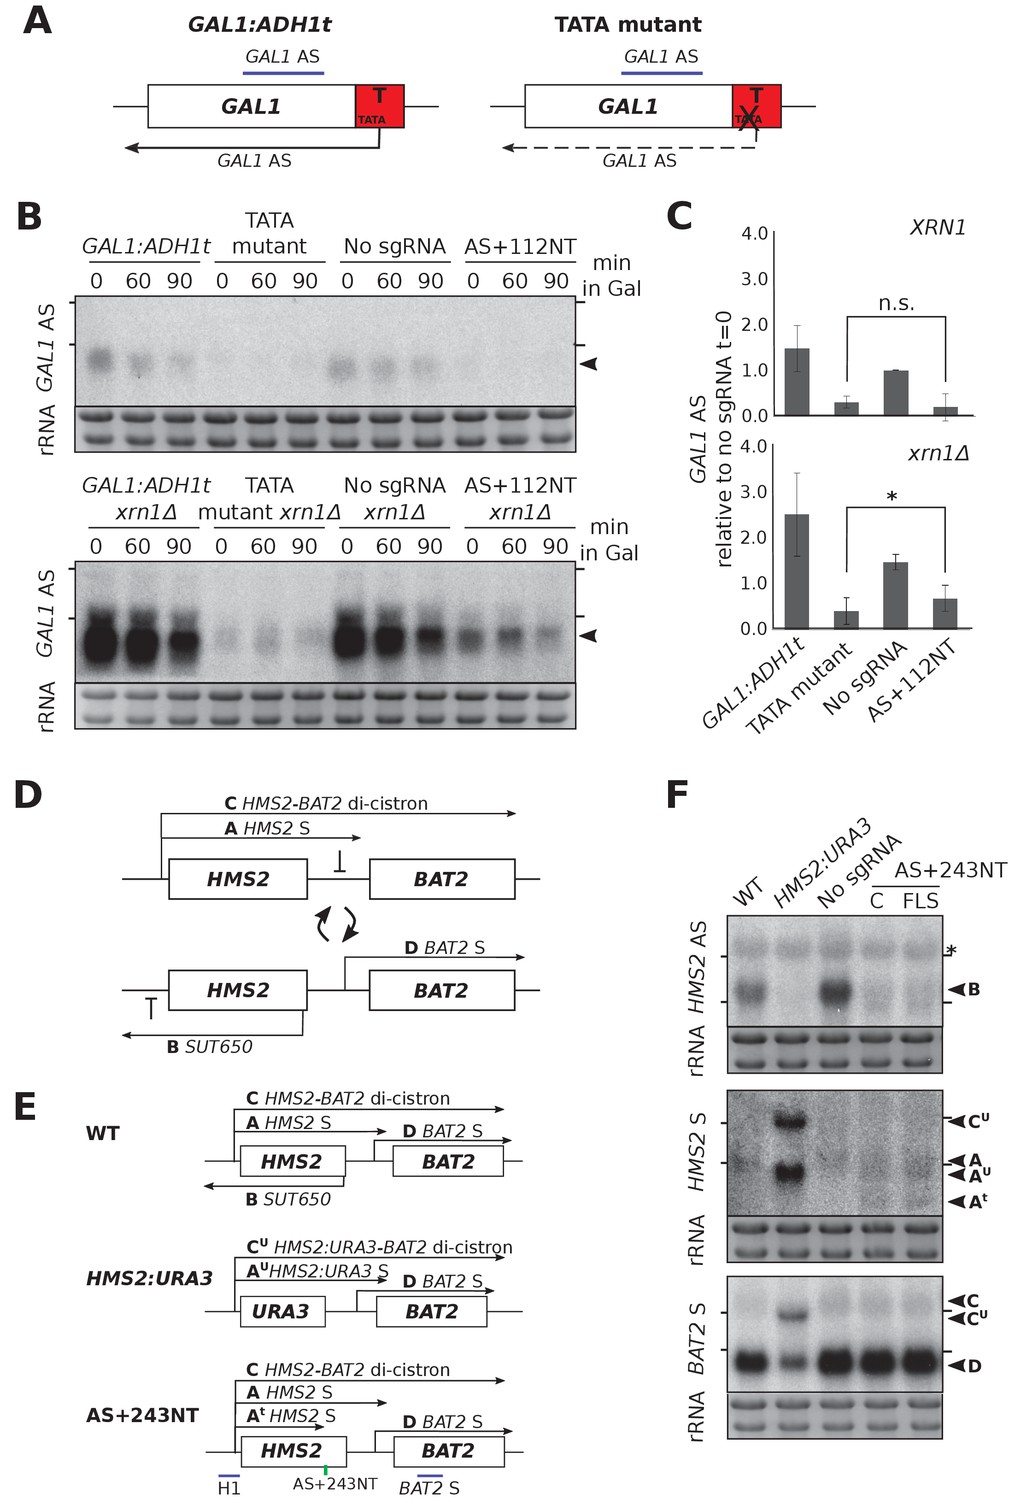
CRISPRi block of SUT650 and GAL1 AS is not as efficient as previous genetic interventions.
(A) A schematic showing the previously used genetic intervention to repress the GAL1 AS transcript (Murray et al., 2015). In the TATA mutant construct, a TATA box within the engineered ADH1 terminator (T) is scrambled and the level of GAL1 antisense transcript is reduced. (B) A Northern blot probed for the GAL1 antisense transcript (black arrowhead) comparing the two methods of reducing antisense at this locus in the presence (top blot) or absence (bottom blot) of XRN1. All samples were run on the same gel and the blots were exposed to film for the same time. Samples were taken from cells grown in glucose (t = 0) and at the indicated times after transfer to galactose-containing media (min). Positions of the rRNA are indicated by the short horizontal lines. Ethidium-bromide-stained rRNA is used as loading control. (C) Quantification of the Northern blot in (B) at t = 0. N = 2, errors represent the SEM, *p=0.026, n.s. non-significant. See Source data 1, tab 12. (D) A schematic of the HMS2-BAT2 locus, showing the HMS2 sense and antisense transcripts (A and B), the HMS2-BAT2 di-cistronic transcripts (C and C’) and the BAT2 sense transcript (D). Cells switch between sense- and antisense-dominant states in which the indicated transcripts are produced (Nguyen et al., 2014). (E) The HMS2-BAT2 locus and associated transcripts in the wild-type (WT) strain and strains that repress the SUT650 transcript. In the HMS2:URA3 strain, the entire coding region of HMS2 is replaced by that of URA3. (F) Northern blots comparing the efficiency of SUT650 reduction by replacement of the HMS2 coding region with that of URA3 versus CRISPRi with sgRNA AS+243NT and the relative effects of these two strategies on the HMS2 sense and BAT2 transcripts shown in (E). The WT (BY4741) and HMS2.URA3 strains have been transformed with plasmid pRS315 to allow for growth on complete synthetic media lacking leucine and thus comparisons with the CRISPRi strains. Positions of the rRNA are indicated by the short horizontal lines. *Represents cross-hybridisation with the 25S rRNA. Ethidium-bromide-stained rRNA is used as loading control.
Tables
Key resource table
| Reagent type (species) or resource | Designation | Source or reference | Identifiers | Additional information |
|---|---|---|---|---|
| Gene (Sacccharomyces cerevisiae) | HMS2 | YJR147W; SGD ID S000003908; RRID:SCR_003093; SGD, RRID:SCR_004694 | ||
| Gene (S. cerevisiae) | GAL1 | YBR020W; SGD ID S000000224; RRID:SCR_003093; SGD, RRID:SCR_004694 | ||
| Gene (S. cerevisiae) | BAT2 | YJR148W; SGD ID S000003909 RRID:SCR_003093; SGD, RRID:SCR_004694 | ||
| Gene (S. cerevisiae) | snR52 | SGD ID S000006443; RRID:SCR_003093; SGD, RRID:SCR_004694 | ||
| Strain, strain background (S. cerevisiae) | see Supplementary file 1C | see Supplementary file 1C | Saccharomyces cerevisiae, NCBITaxon:1247190; SGD, RRID:SCR_004694 | see Supplementary file 1C |
| Genetic reagent (S. cerevisiae) | see Supplementary file 1C | see Supplementary file 1C | see Supplementary file 1C | see Supplementary file 1C |
| Antibody | Tubulin (rat monoclonal YL1/2) | Abcam | Abcam ab6160 RRID:AB_305328 | (1:3333) |
| Antibody | Cas9 (rabbit polyclonal) | Diagenode | C15310258 RRID:AB_2715516 | (1:5000 Western blot); 5 µl/ChIP |
| Recombinant DNA reagent | see Supplementary file 1A | Eurofins Genomics | see Supplementary file 1A | see Supplementary file 1A |
| Recombinant DNA reagent | Plasmid with pTDH-dCas9 | (Qi et al., 2013) Addgene | Addgene #46920 RRID:SCR:002037 | PMID:23849981 |
| Sequence-based reagent | single-stranded DNA templates for variable and constant sgRNA regions | This study | see Supplementary file 1A | synthesised by phosphoramidite oligonucleotide synthesis with 3’-alkyne or 5’-azido modifications (El-Sagheer et al., 2011) |
| Sequence-based reagent | see Supplementary files 1A,B,D,E,F | Eurofins Genomics | see Supplementary files 1A,B,D,E,F | see Supplementary files 1A,B,D,E,F |
| Commercial assay or kit | QIAquick PCR Purification Kit | Qiagen; RRID:SCR_008539 | Cat# 28106 | |
| Chemical compound, drug | SYBR green qPCR master mix | Bioline | Cat# QT605-20 | |
| Software, algorithm | Off-spotter sgRNA algorithm | https://cm.jefferson.edu/Off-Spotter// | ||
| Software, algorithm | Rotor-Gene Q Series Software | https://www.qiagen.com/us/resources/ | ||
| Software, algorithm | Fiji/Image J | https://imagej.net/Fiji | ImageJ, RRID:SCR_003070 |
Additional files
-
Source data 1
Numerical data for all graphs (referenced in Figure Legends) Tab 1.
Notes about yeast strain names Tab 2. Data supporting Figure 1C Tab 3. Data supporting Figure 1D Tab 4. Analysis of data in Tab 3 for Figure 1D Tab 5. Quantitation of all Northern blots for CRISPRi of HMS2 AS transcripts supporting Figure 2–4 Tab 6. Quantitation of all Northern blots for CRISPRi of HMS2 S transcripts experiments 1 and 2 supporting Figure 3—figure supplement 1. Tab 7. Quantitation of all Northern blots for CRISPRi of HMS2 S transcripts experiments 3 and 4 supporting Figure 3—figure supplement 1. Tab 8. Data analysis of comparison of CRISPRi versus genetic intervention (URA3) for HMS2 supporting Figure 4D–F Tab 9. HMS2 sliding probes supporting Figure 3E and 4F Tab 10. GAL1 AS CRISPRi data supporting Figure 3A–B Tab 11. All data for GAL1 CRISPRi supporting Figure 2-4 Tab 12. Data analysis of comparison of CRISPRi versus genetic intervention (TATA mutant) for GAL1 supporting Figure 4B–C Tab 13. Normalised dCas9 ChIP data at HMS2 supporting Figure 2—figure supplement 2. Tab 14. Combined dCas9 ChIP data at HMS2 for replicates 1–3 supporting Figure 2—figure supplement 2. Tab 15. Raw Ct data for dCas9 ChIP at HMS2 replicate one supporting Figure 2—figure supplement 2. Tab 16. Raw Ct data for dCas9 ChIP at HMS2 replicate two supporting Figure 2—figure supplement 2. Tab 17. Raw Ct data for dCas9 ChIP at HMS2 replicate three supporting Figure 2—figure supplement 2. All raw data can be found at Mendeley Data: http://dx.doi.org/10.17632/p2652vcdz8.2.
- https://doi.org/10.7554/eLife.29878.011
-
Supplementary file 1
Supplementary Tables (referenced in the Materials and methods).
(A) Templates for sgRNAs (B) Primers for strain construction (C) Saccharomyces cerevisiae strains used in this study (D) Primers for construction of Northern blot probe templates (E) Primers for real-time qPCR at HMS2 (F) Primers for 3’ RACE mapping of the GAL1 sense transcript.
- https://doi.org/10.7554/eLife.29878.012
-
Transparent reporting form
- https://doi.org/10.7554/eLife.29878.013
Download links
A two-part list of links to download the article, or parts of the article, in various formats.
Downloads (link to download the article as PDF)
Open citations (links to open the citations from this article in various online reference manager services)
Cite this article (links to download the citations from this article in formats compatible with various reference manager tools)
CRISPRi is not strand-specific at all loci and redefines the transcriptional landscape
eLife 6:e29878.
https://doi.org/10.7554/eLife.29878


