Synaptic up-scaling preserves motor circuit output after chronic, natural inactivity
- University of Missouri-Columbia, United States
- Wright State University, United States
Figures
Figure 1
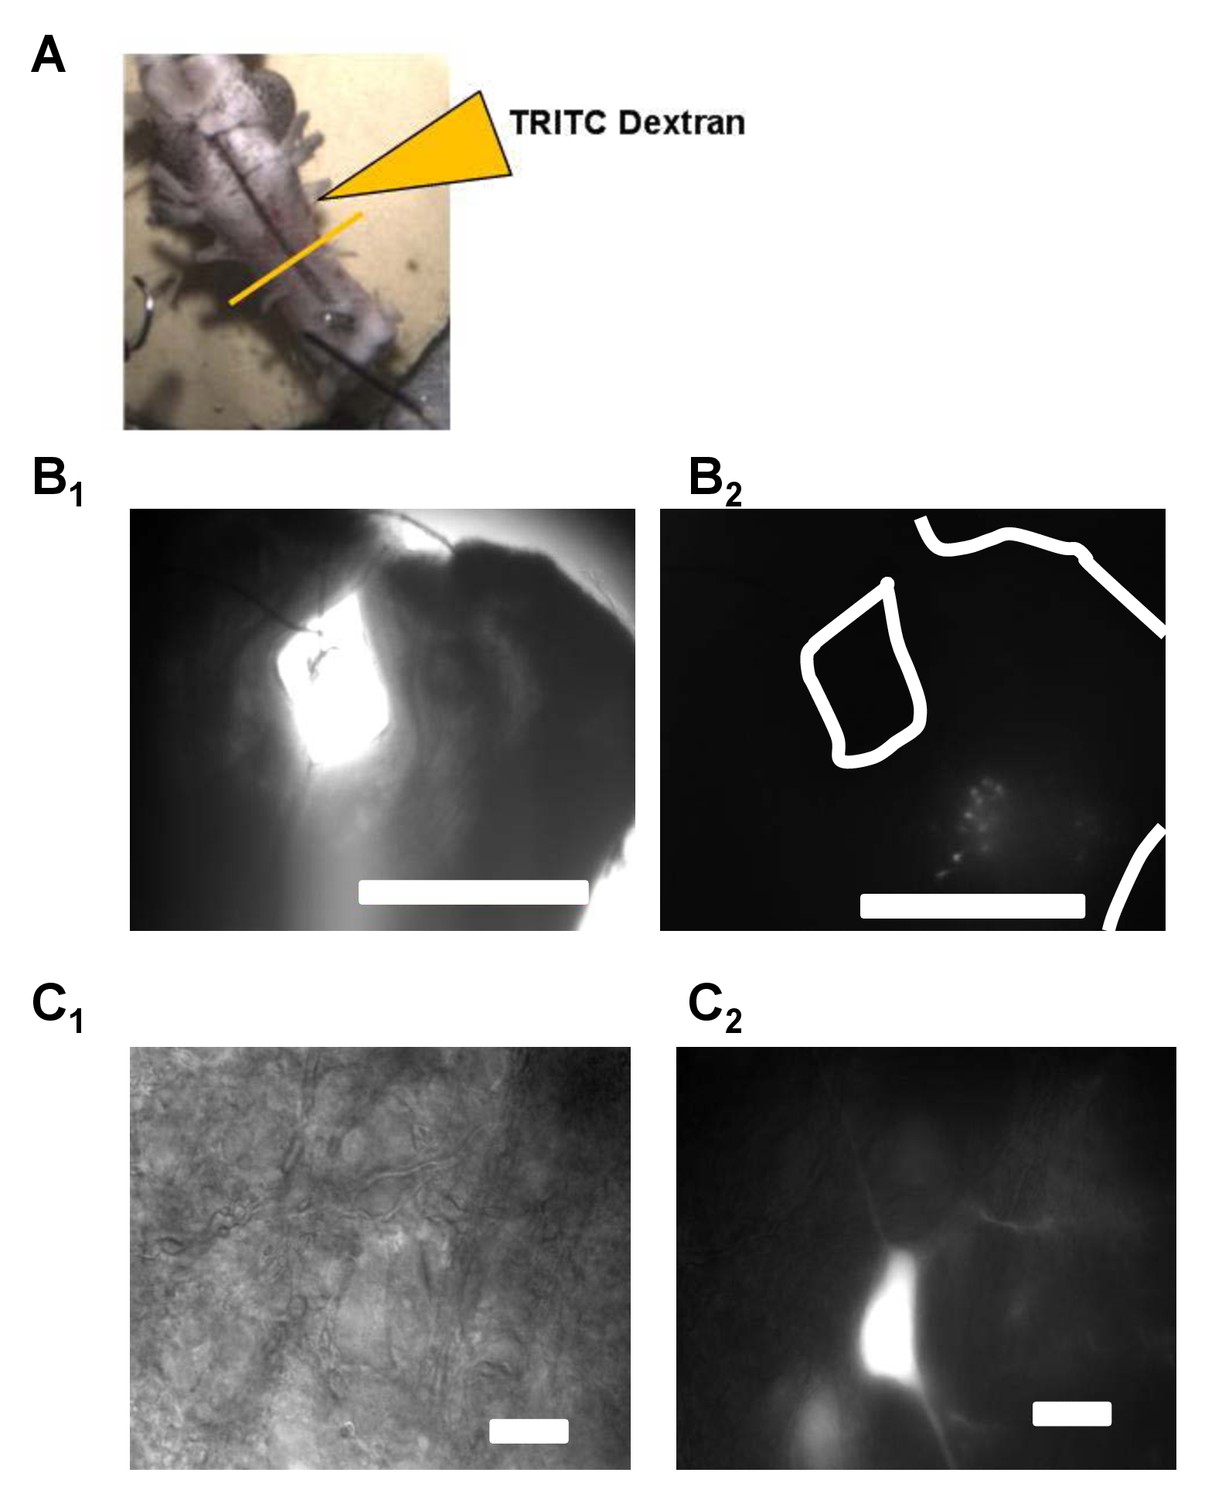
Vagal motoneurons predominately innervating the glottal dilator were labeled by backfilling the 4th (most caudal) root of the IX-X cranial nerve complex.
(A) illustrates the tetramethylrhodamine-dextran (TRITC) backfill procedure. Orange line across brainstem approximates where brainstem slices were taken for experiments. (B and C) show examples fluorescent images of backfilled motoneurons loaded with TRITC-dextran at 4X and 60X. Bar markers are 1 mm (B) and 20 μm (C).
Figure 2
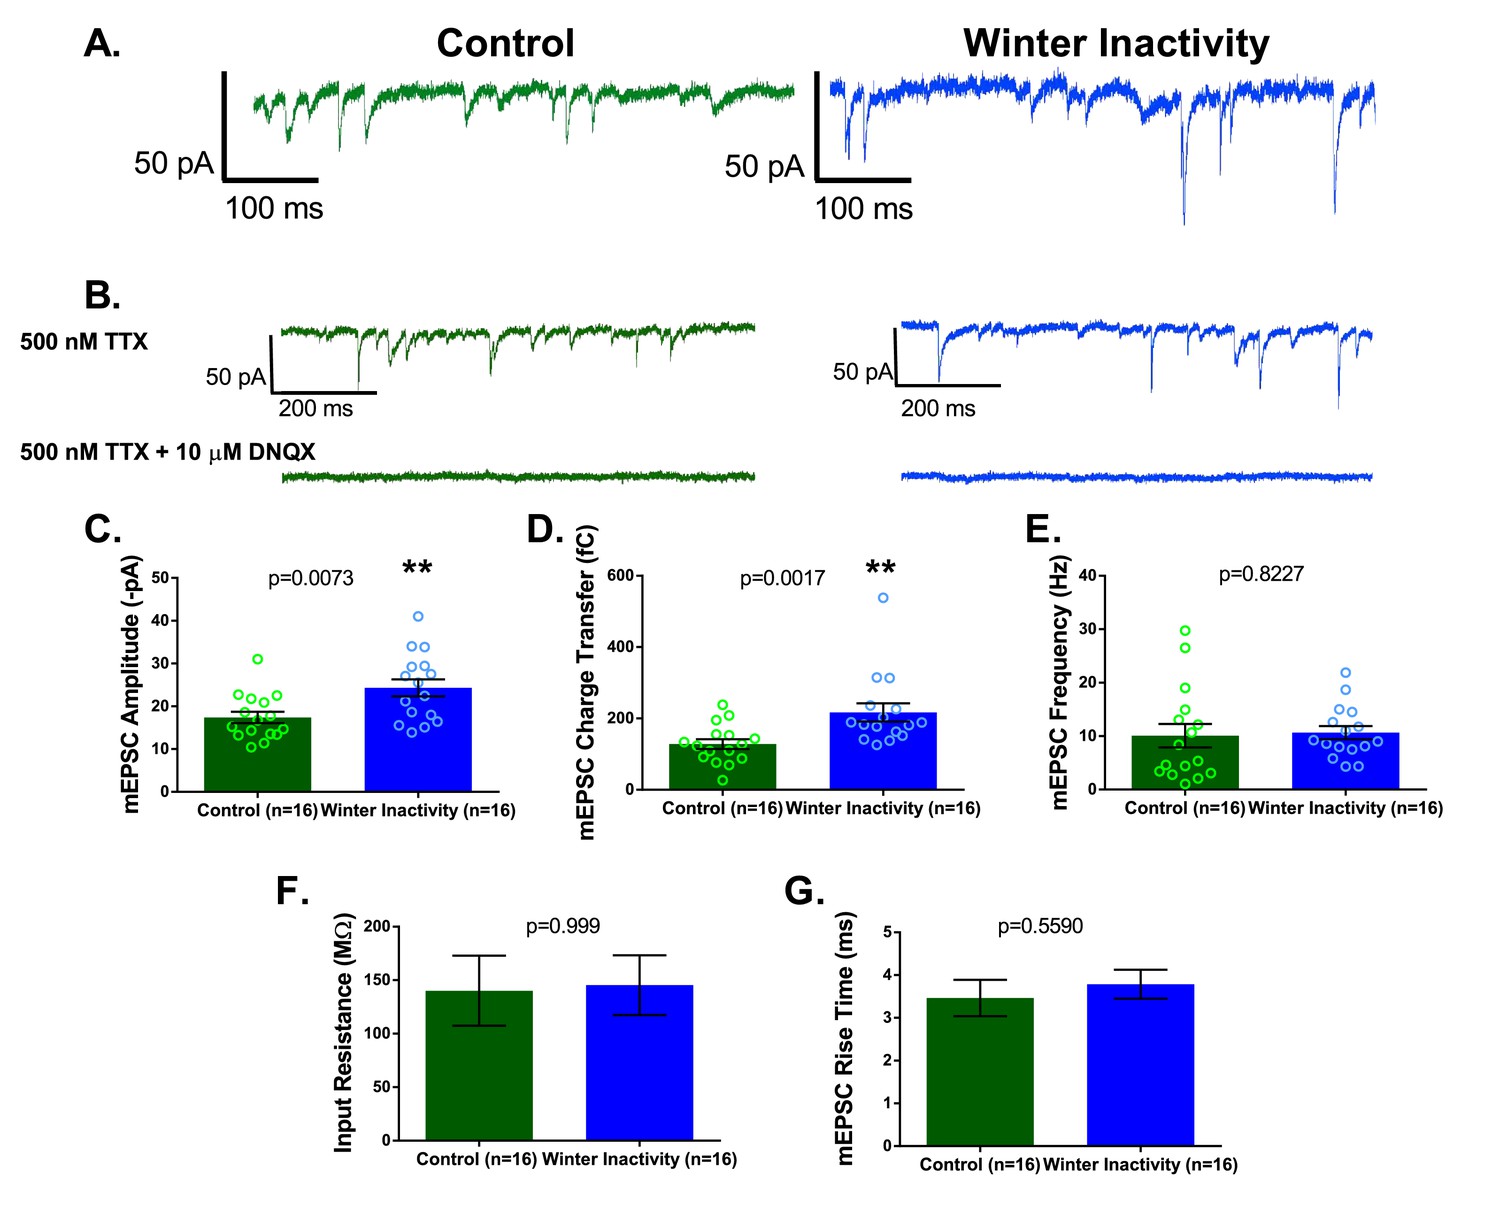
Respiratory motoneurons have increased synaptic strength after winter inactivity.
1A shows example voltage clamp traces of miniatures excitatory postsynaptic currents (mEPSCs; holding potential= −80 mV; 500 nM TTX) in control (green) and winter inactivity (blue) frogs. 2B shows that mEPSCs recorded at −80 mV are mediated by AMPA-glutamate receptors. The top panel of 1B shows example recordings one control and one winter inactivity motoneuron (different neurons than 2A) before (top panel) and after application of 10 μM DNQX, an AMPA-glutamate receptor antagonist (bottom panel). All mEPSCs that we could detect were blocked by DNQX. 2 C-E presents mean data for mEPSC amplitude (C; two-tailed unpaired t test), charge transfer (D; two-tailed unpaired t test with Welch’s correction), and frequency (E; Two-tailed Mann Whitney test). mEPSC values for each neuron were obtained by averaging 1 min of data. Winter inactivity resulted in elevated mEPSC amplitude and charge transfer, but not frequency. Scattered circles in each bar graph are individual points that generate the mean. 2F-G shows mean data for input resistance (F; Two-tailed Mann Whitney test) and mEPSC rise time (G; Two-tailed unpaired t test). 2C-G analyzed n = 16 neurons for control (represented in green) and winter inactivity (represented in blue). N = 9 control frogs and N = 7 winter inactivity bullfrogs. Error bars are standard error of the mean (SEM). **p<0.01.
Figure 3

Winter inactivity scales up mEPSCs in respiratory motoneurons.
Figure 3A shows linear, but not exponential, scaling of mEPSC amplitudes. Control and winter inactivity mEPSC amplitudes were rank ordered (50 mEPSCs in n = 16 neurons from each group; 800 total points) and fit with a linear regression (dashed blue line; r2 = 0.99). The rank ordered plot was not well-fit by an exponential curve (dashed black line; r2 = 0.73). The gray unity line with a slope of 1 represents the relationship if winter inactivity did not result in increased mEPSC amplitude; however, the linear regression fit of ranked ordered mEPSCs produced a slope of 1.51. Figure 3B shows cumulative probably histograms of mEPSC amplitudes from control neurons (solid green line), winter inactivity neurons (solid blue line), and the winter inactivity distribution down-scaled by the scaling factor, 1.51 (dashed blue line). Because down-scaled mEPSCs below the detection threshold (7.5 pA in our analysis) cannot overlap with the control distribution (Kim et al., 2012), scaled mEPSCs below 7.5 pA were not included in analysis. Kolomogorov-Smirnov tests revealed that control and winter inactivity are significantly different (p<2.2×10⁻¹⁶), but control and scaled winter-inactivity distributions were not significantly different (p=0.1403). This provides evidence that multiplicative synaptic scaling occurred across the distribution of measurable mEPSCs.
Figure 4
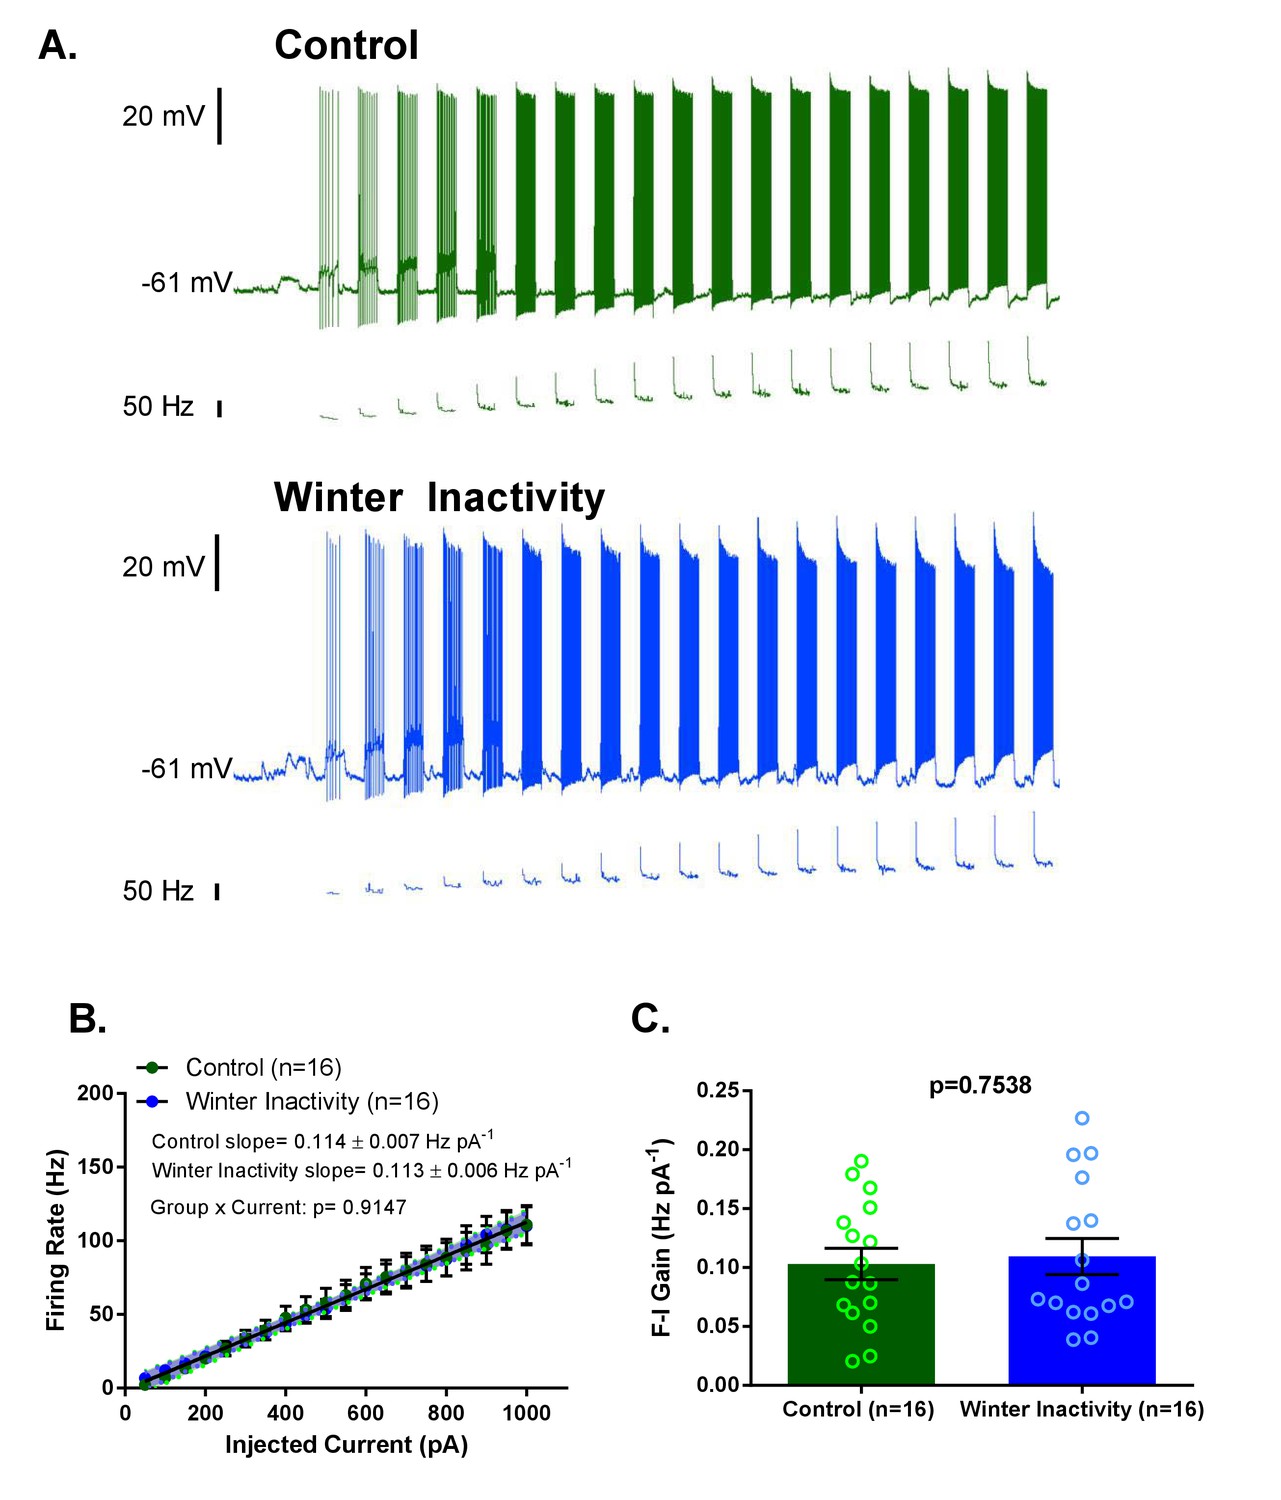
Increases in F-I (frequency-current) gain do not accompany up-scaling of excitatory synapses.
Figure 4A shows example current clamp recordings of control (green) and winter inactivity (blue) motoneurons during step current injections (+50 pA X 20 steps; 0.5 s per step). Figure 4B shows mean firing rates during 0.5 s, step increases in current in control and winter inactivity motoneurons (n = 16 neurons for each group). There was no difference in in the slope of mean firing frequency-current relationship (p=0.9147; Analysis of Covariance). The shaded area around the linear regression lines are 95% confidence bands. Figure 4C shows that mean firing frequency-current relationships (F-I gain) from individual neurons do not different between groups (two-tailed unpaired t test). Figure 4B–C analyzed n = 16 neurons for control (represented in green) and winter inactivity (represented in blue). N = 9 control frogs and N = 7 winter inactivity bullfrogs. Scattered circles in each bar graph are individual points that generate the mean. Error bars are standard error of the mean (SEM).
Figure 5 with 1 supplement

Increases in AMPA-glutamate receptors sustain motor output from the respiratory network after winter inactivity.
Figure 5A illustrates the bullfrog in vitro brainstem-spinal cord preparation. In bullfrogs in vivo, lung ventilation cycles involve activation of both glottal dilator (value to the lung) and buccal floor pump muscles. The general motor behavior associated with breathing persists in the isolated brainstem-spinal cord in vitro and can be recorded with extracellular suction electrodes through cut spinal nerve II (hypoglossal nerve; top) that innervates the buccal floor, and the caudal portion of cranial nerve X (vagus; bottom) that innervates the glottis (Sakakibara, 1984a). Since activation of both groups of motoneurons are required for lung ventilation, coactivation of buccal floor and glottal-related motor outflow confirms respiratory-related central pattern generator activity associated with lung ventilation (i.e. a fictive lung breath; Figure 5A) (Sanders and Milsom, 2001). Here, we analyzed respiratory bursts recorded from the CN X nerve root as it contains the glottal dilator motoneurons (Kogo et al., 1994) that we showed to exhibit up-scaling of AMPA receptors. Figure 5B shows example CN X root recordings from control (green; top) and winter inactivity (blue; bottom) in vitro brainstem-spinal cord preparations before (left) and after application of 4 μM DNQX (right). Dashed boxes across the compressed recordings represent minimum and maximum burst amplitudes with each preparation. Both control and winter inactivity preparations underwent relatively similar decreases in respiratory burst frequency during bath application of DNQX; however, only preparations from winter inactivity bullfrogs experienced a decreased in burst amplitude. This can be further observed in the expanded example integrated motoneuron population burst in the inset. Figure 5C1–E1 shows mean changes in fictive lung burst amplitude, area, and frequency in response to 4 μM DNQX expressed as a percent of baseline (n = 4 brainstems per group; two-tailed Mann Whitney test). In winter inactivity bullfrogs, DNQX led to a significant decrease in burst amplitude and area compared to control bullfrogs. Figure 5C2–E2 show raw values used to generate each of the means in Figure 5C1–E1. DNQX caused a decrease in fictive lung burst frequency in both groups of frogs despite winter inactivity frogs starting from a higher baseline (Figure 5E2). Absolute comparisons for burst amplitude and area characteristics were not performed as these are only relative measures. Means for each analysis are shown as a solid green or blue line. Scattered circles in each graph are individual points that generate the mean. Error bars are standard error of the mean (SEM). *p<0.05.
Figure 5—figure supplement 1
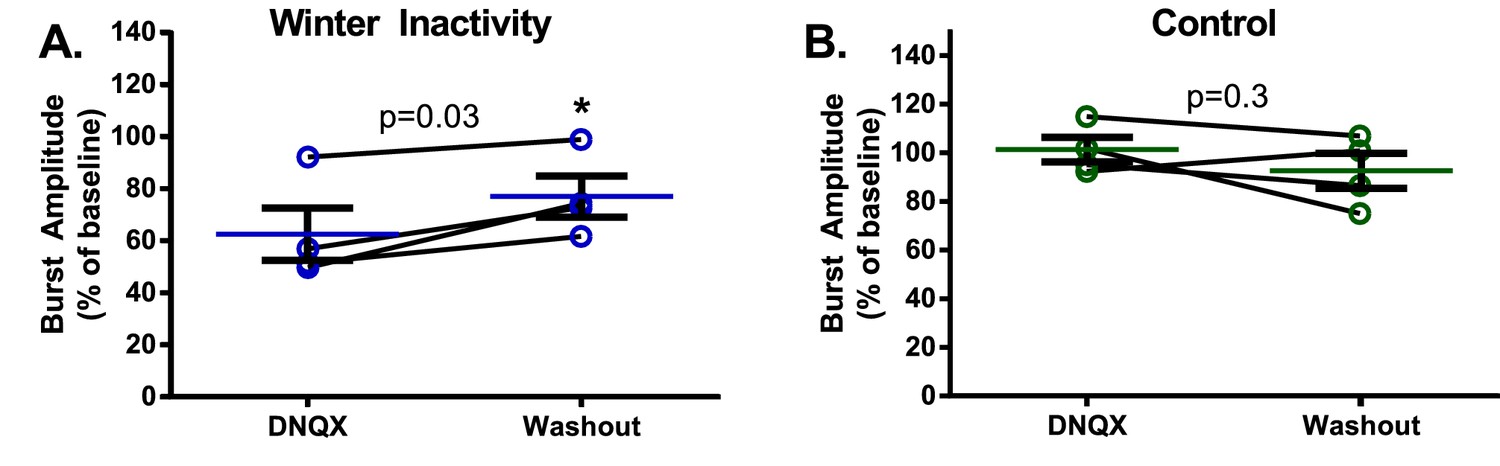
Respiratory burst amplitude from each winter inactivity bullfrog tends to recover upon washout (A. winter inactivity group: paired t test; p=0.0351; DNQX vs. washout) and returns to near-control values (one sample t test; p=0.0333 compared to 100% during DNQX and p=0.0609 during washout, n = 4).
Burst amplitudes from control frogs do not differ between DNQX and washout (B. DNQX vs. washout; p=0.3113) and were not different than 100% of baseline during DNQX or washout (one sample t test; p=0.7998 during DNQX and p=0.3808 during washout, n = 4). Error bars are standard error of the mean (SEM).
Additional files
-
Supplementary file 1
Statistical information for all analyses performed in the paper.
- https://doi.org/10.7554/eLife.30005.009
-
Transparent reporting form
- https://doi.org/10.7554/eLife.30005.010
Download links
A two-part list of links to download the article, or parts of the article, in various formats.
Downloads (link to download the article as PDF)
Open citations (links to open the citations from this article in various online reference manager services)
Cite this article (links to download the citations from this article in formats compatible with various reference manager tools)
Synaptic up-scaling preserves motor circuit output after chronic, natural inactivity
eLife 6:e30005.
https://doi.org/10.7554/eLife.30005


