Extended low-resolution structure of a Leptospira antigen offers high bactericidal antibody accessibility amenable to vaccine design
- Cornell University, United States
- Wadsworth Center, New York State Department of Health, United States
Figures
Figure 1 with 2 supplements
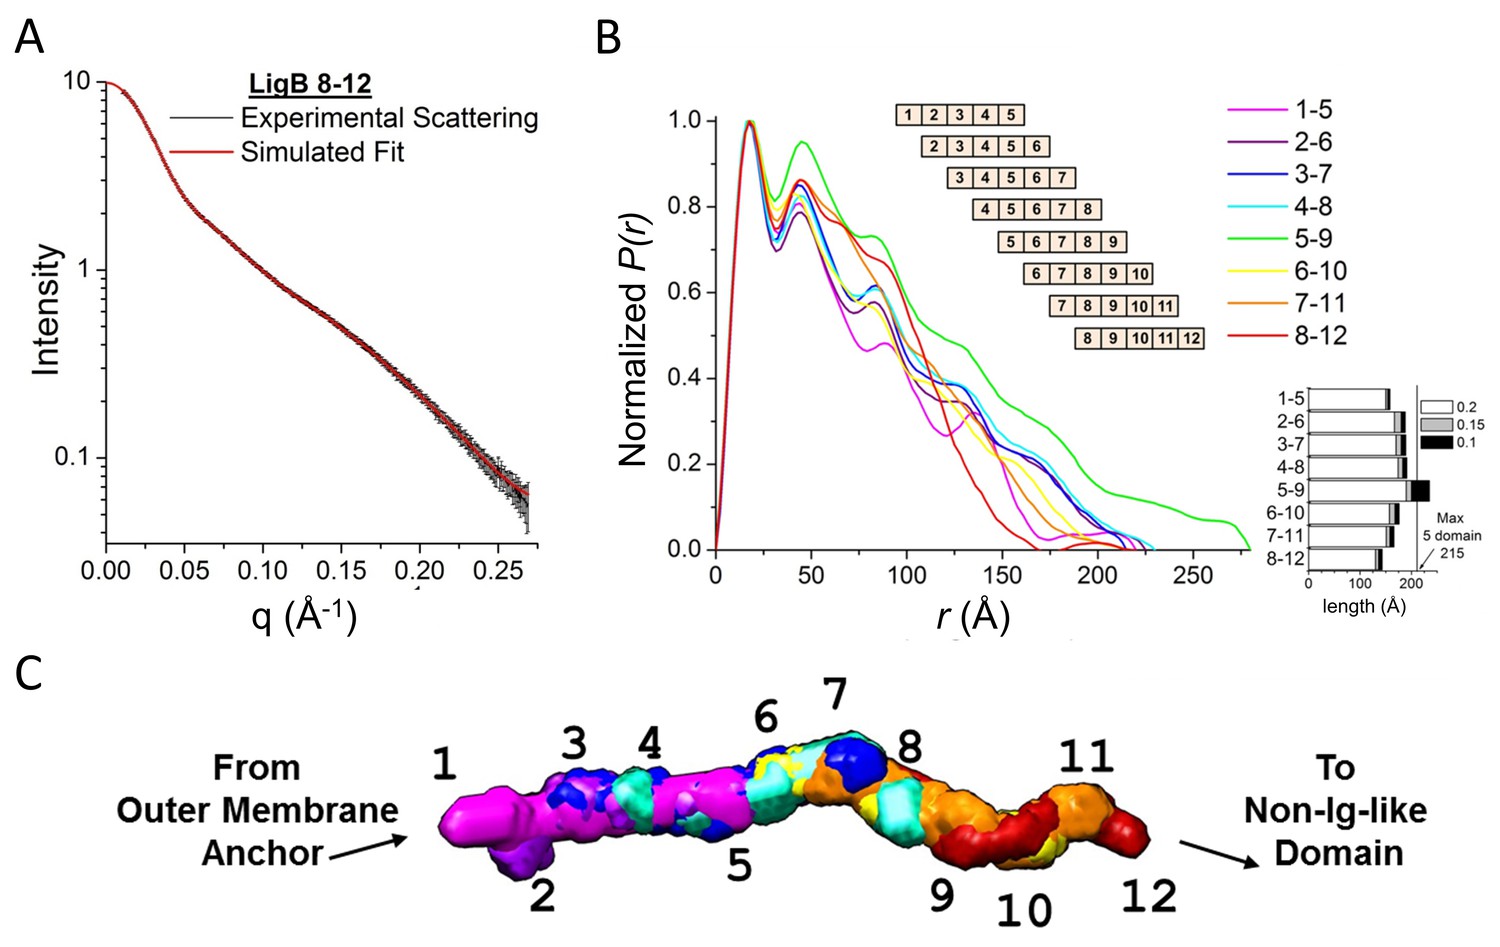
Full LigB Ig-like domain region (LigB1-12) determined from experimental SAXS data of 5-domain constructs.
(A) The experimental scattering data for LigB8-12 (black) is shown with the simulated fit (red). The scattering curve is an average of 15 scans ± S.D. (B) The pair distance distributions, P(r), were calculated from SAXS plots of all possible 5-domain LigB Ig-like domains using GNOM. A representation of the 5-domain constructs is shown in the inset. An estimate of construct length based on the longest atomic distances at 20%, 15%, and 10% max population height are shown. (C) DAMFILT envelopes were combined to create a representative envelope of the twelve Ig-like domains. Construct LigB5-9 was not included because the maximum distance distribution exceeds the expected length of a 5-domain construct.
-
Figure 1—source data 1
LigB five domain construct SAXS profile values.
- https://doi.org/10.7554/eLife.30051.006
Figure 1—figure supplement 1

SAXS construct design.
(A) Schematic of the full length LigB protein. The set of LigB constructs used to test the optimal number of Ig-like domains and the set of 5-domain constructs used for SAXS analysis. (B) SAXS atomic pair distance distributions, P(r), for 8, 5, 2, and 1 domain constructs (LigB5-12, LigB8-12, LigB11-12, and LigB12, respectively) were calculated from SAXS plots using GNOM. The P(r) was normalized at the first peak (15–20 Å) for each of the distributions. (C) The normalized spatial discrepancy (NSD) derived using the DAMAVER program suite is plotted for multi-domain LigB constructs shown in B. Error bars show S.D. for the for the 10 computed bead models. NSD values > 1 are indicative of heterogeneity in the DAMAVER models.
Figure 1—figure supplement 2
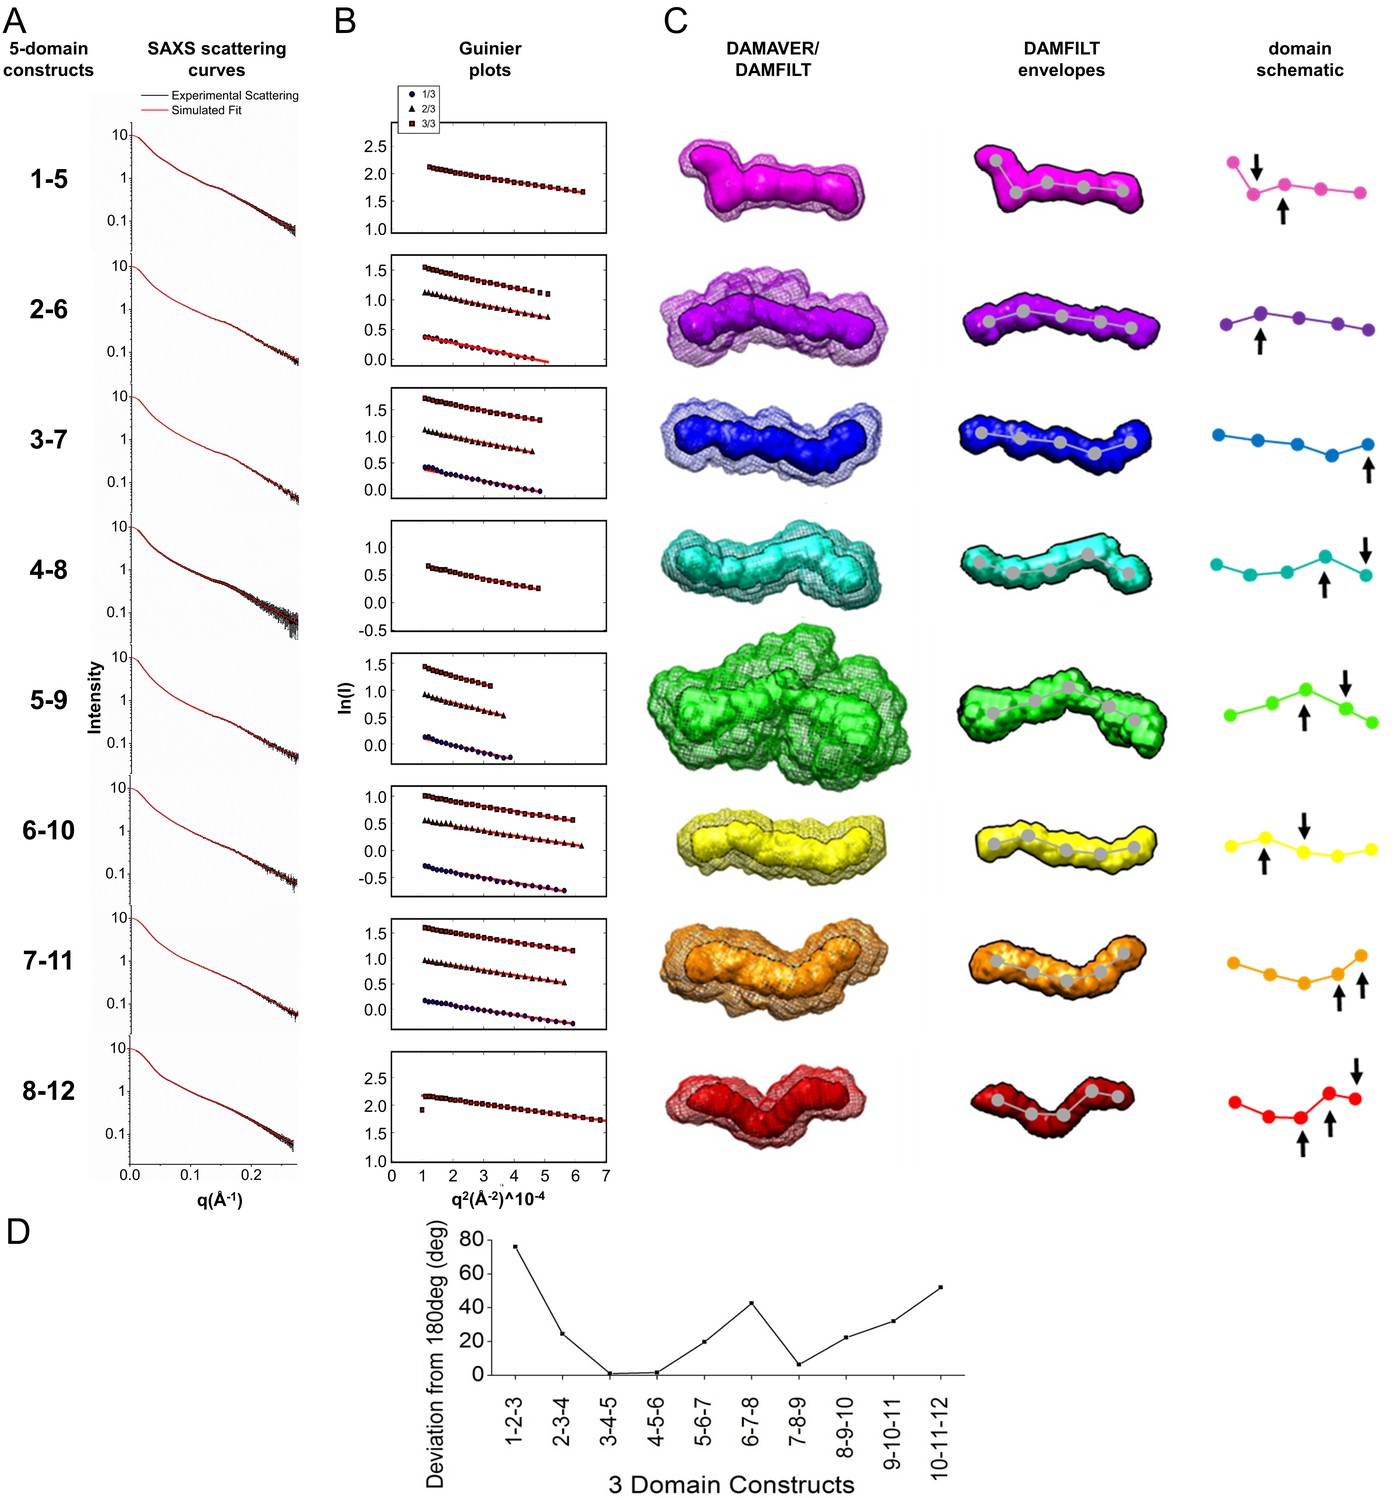
Experimental SAXS data and structures for all LigB Ig-like domain 5-domain constructs.
(A) The experimental scattering data (black line, error bars) are shown for solutions containing LigB1-5, LigB2-6, LigB3-7, LigB4-8, LigB5-9, LigB6-10, LigB7-11, and LigB8-12. The scattering curves are an average of 15 scans ± S.D. A simulated curve (red line) was fit to the data. (B) Guinier plots for the experimental scattering data were calculated with the RAW software using standard cutoffs. Fits (red lines) indicate a short but reasonable linear region characteristic of elongated structures. For data collected on samples after dilution, the relative concentration is indicated as the fraction of original protein stock (3/3, 2/3, 1/3; exact concentrations listed in Figure 1—source data 1). (C) Curves fitted to the SAXS data were used to generate ab initio models for all possible 5-domain stretches of LigB Ig-like domains with DAMMIF. DAMAVER/DAMFILT envelopes, DAMFILT envelopes, and dots depicting domain positions are arranged in rows for the 5-domain constructs. Envelopes were positioned to draw attention to the most significant bends within the stretch of domains. Arrows indicate positions where bending is occurring on the dot representations. (D) The angles created from three neighboring dots within the dot representations were averaged and illustrate the degree to which the neighboring domains deviate from a linear (180°) arrangement.
Figure 2 with 1 supplement
ELISA screen of anti-LigB mAb library.
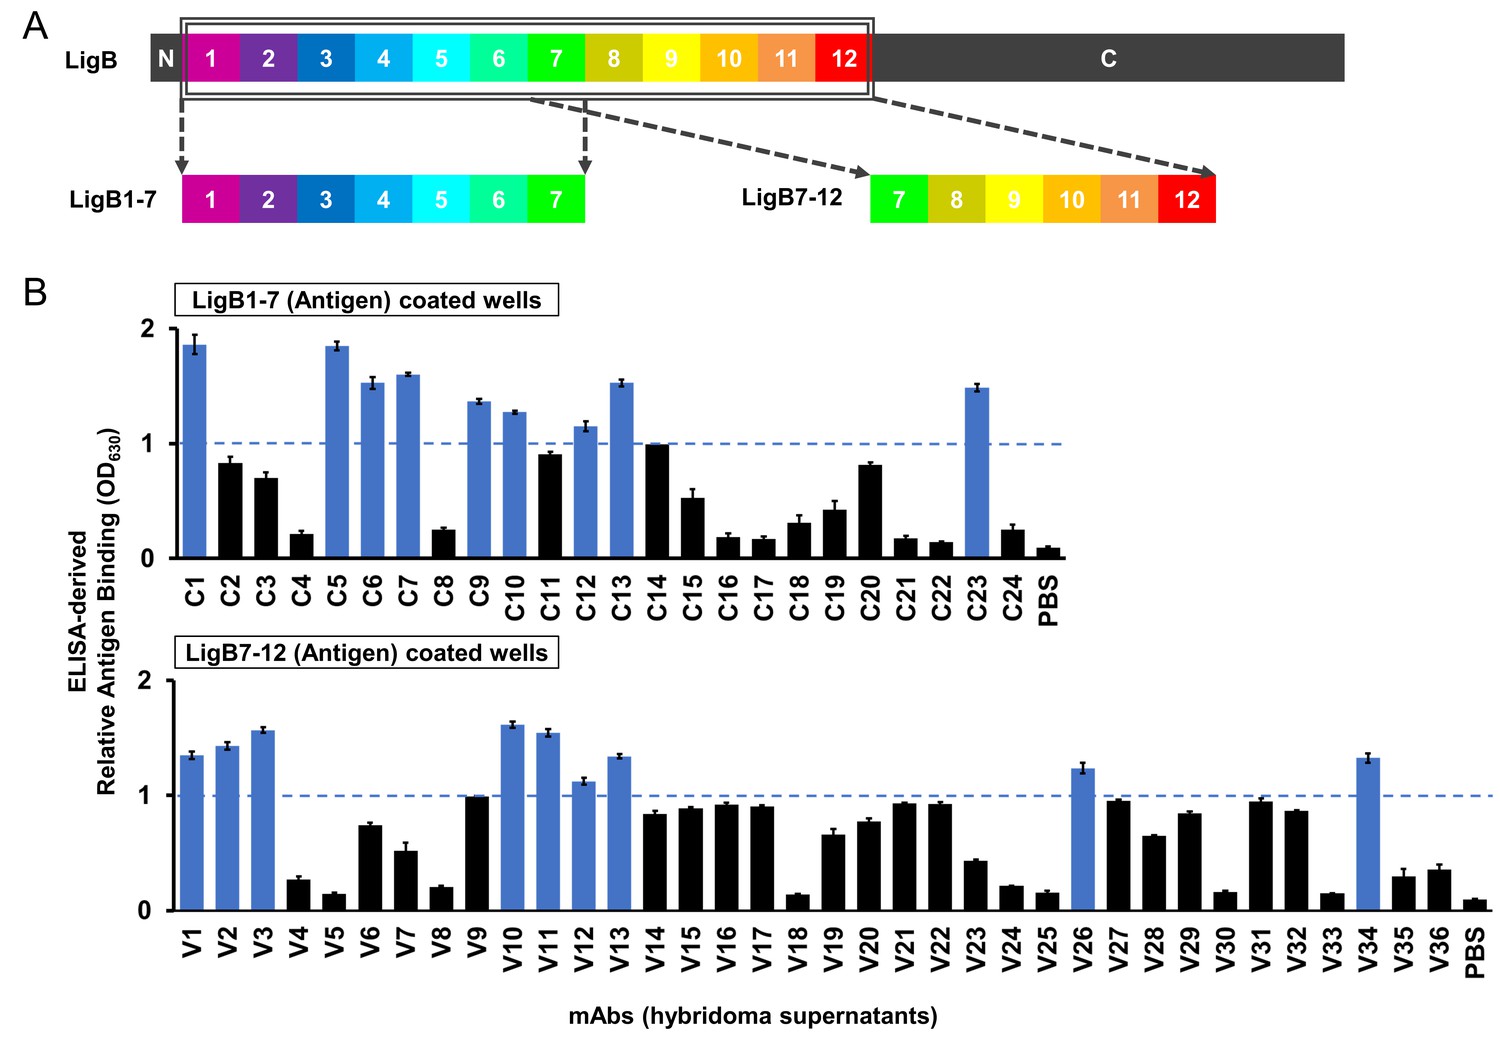
(A) Depiction of the full length LigB antigen and LigB-derived antigens used for mAb generation. (B) The degree of mAb binding to the respective LigB antigens was indirectly measured by colorimetic (λ630) TMB-ELISA using rabbit anti-mouse IgG antibody conjugated with HRP (1:5000). Each value represents the mean ±S.D. from three individual trials of two replicates. Additional mAb characterization was limited to mAbs with binding efficiencies resulting in OD630 >1.0 (blue).
Figure 2—figure supplement 1

Histogram of relative antigen binding strength for the anti-LigB mAb libraries.
Hybridoma supernatants containing individual mAbs were screened for efficient antigen binding using ELISA. The frequency of relative binding strength for both library C and V is depicted for each 0.1 OD630 range. The distribution can be grouped into populations of non-binding mAbs (0 < OD630< 0.5), weak binding mAbs (0.5 < OD630< 1.0), and moderate to high binding mAbs (1.0 < OD630< 2.0). Additional characterization was only pursued for the mAbs with moderate to high binding efficiencies. The division between weak and moderate binding efficiency also corresponded to the average between the lowest and highest OD630 for hybridoma supernatants in the ELISA screen.
Figure 3 with 1 supplement
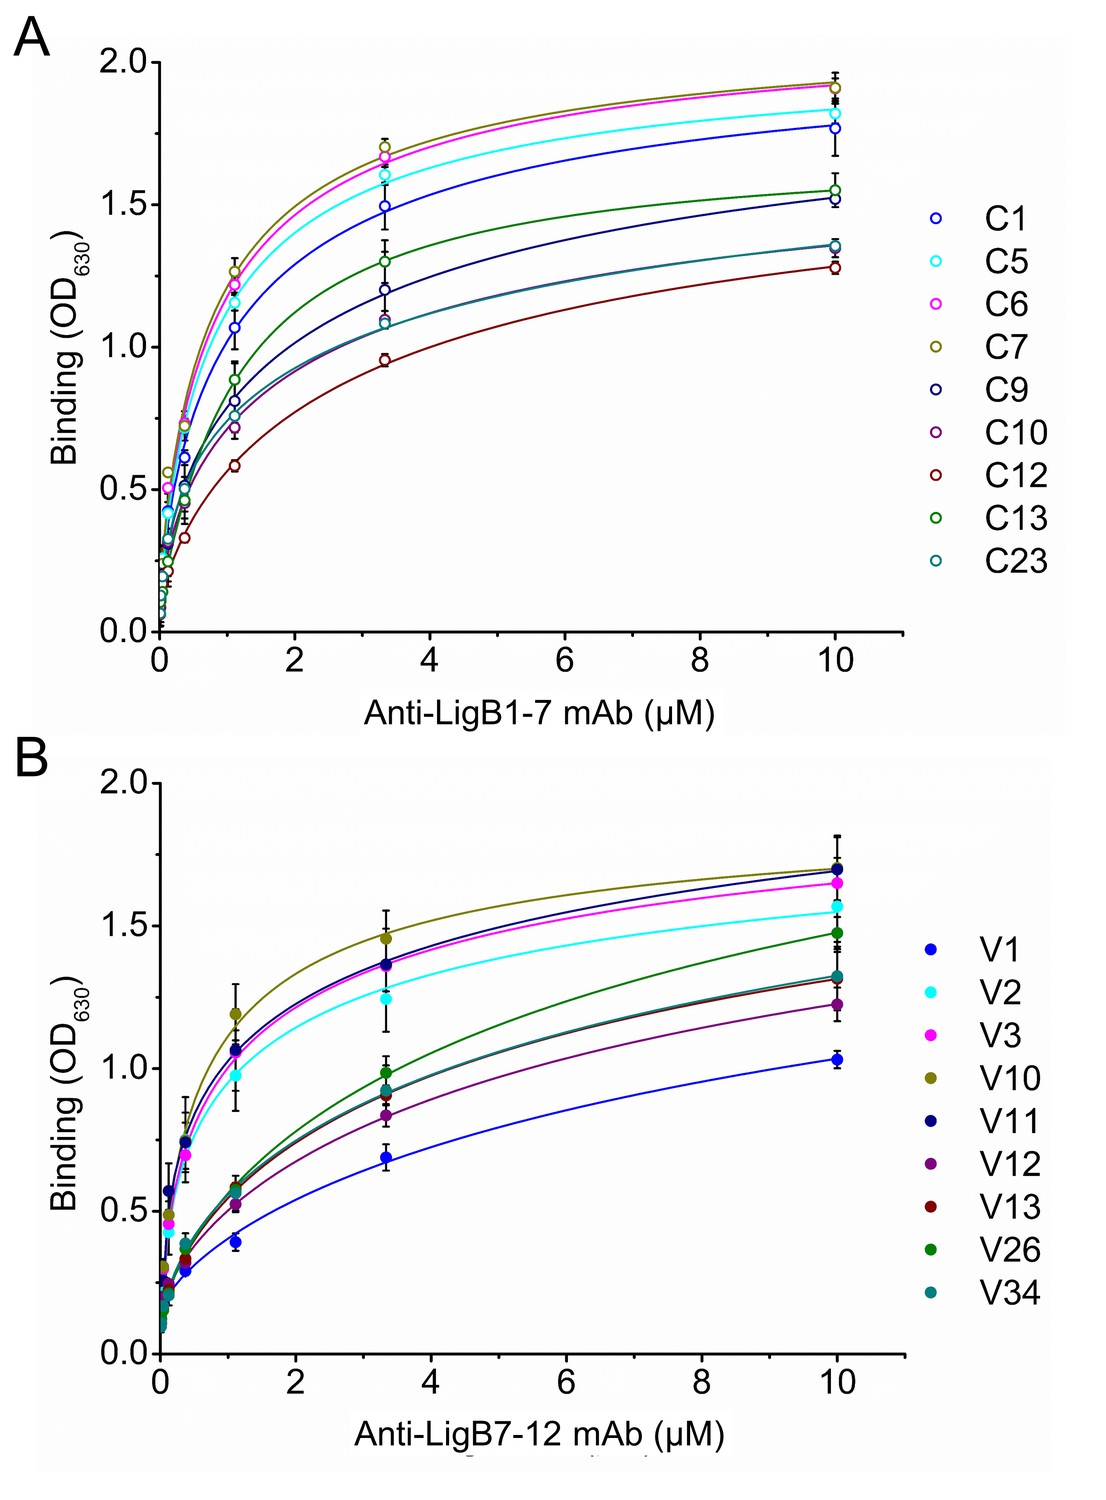
Equilibrium binding for anti-LigB mAbs.
The equilibrium dissociation constants (KD) for mAbs from library C (A) and library V (B) were determined from dose-dependent binding curves. Increasing concentrations of purified anti-LigB mAbs (0.00686, 0.0137, 0.0412, 0.123, 0.370, 1.11, 3.33 and 10 µM) were incubated with LigB antigen (1 μM) immobilized on microtiter plates. The binding interaction was subsequently detected by ELISA using HRP-conjugated anti-mouse antibodies. All experiments were conducted in three trials, the mean ±S.D. of which were shown in bar charts.
Figure 3—figure supplement 1

KD values of anti-LigB mAbs.
KD values for library C (A) and library V (B) mAbs were calculated by fitting the ELISA-derived dose-dependent binding curves to a dose-response equation using Origin software. Errors for the KD values obtained from nonlinear curve fitting are shown.
Figure 4 with 2 supplements
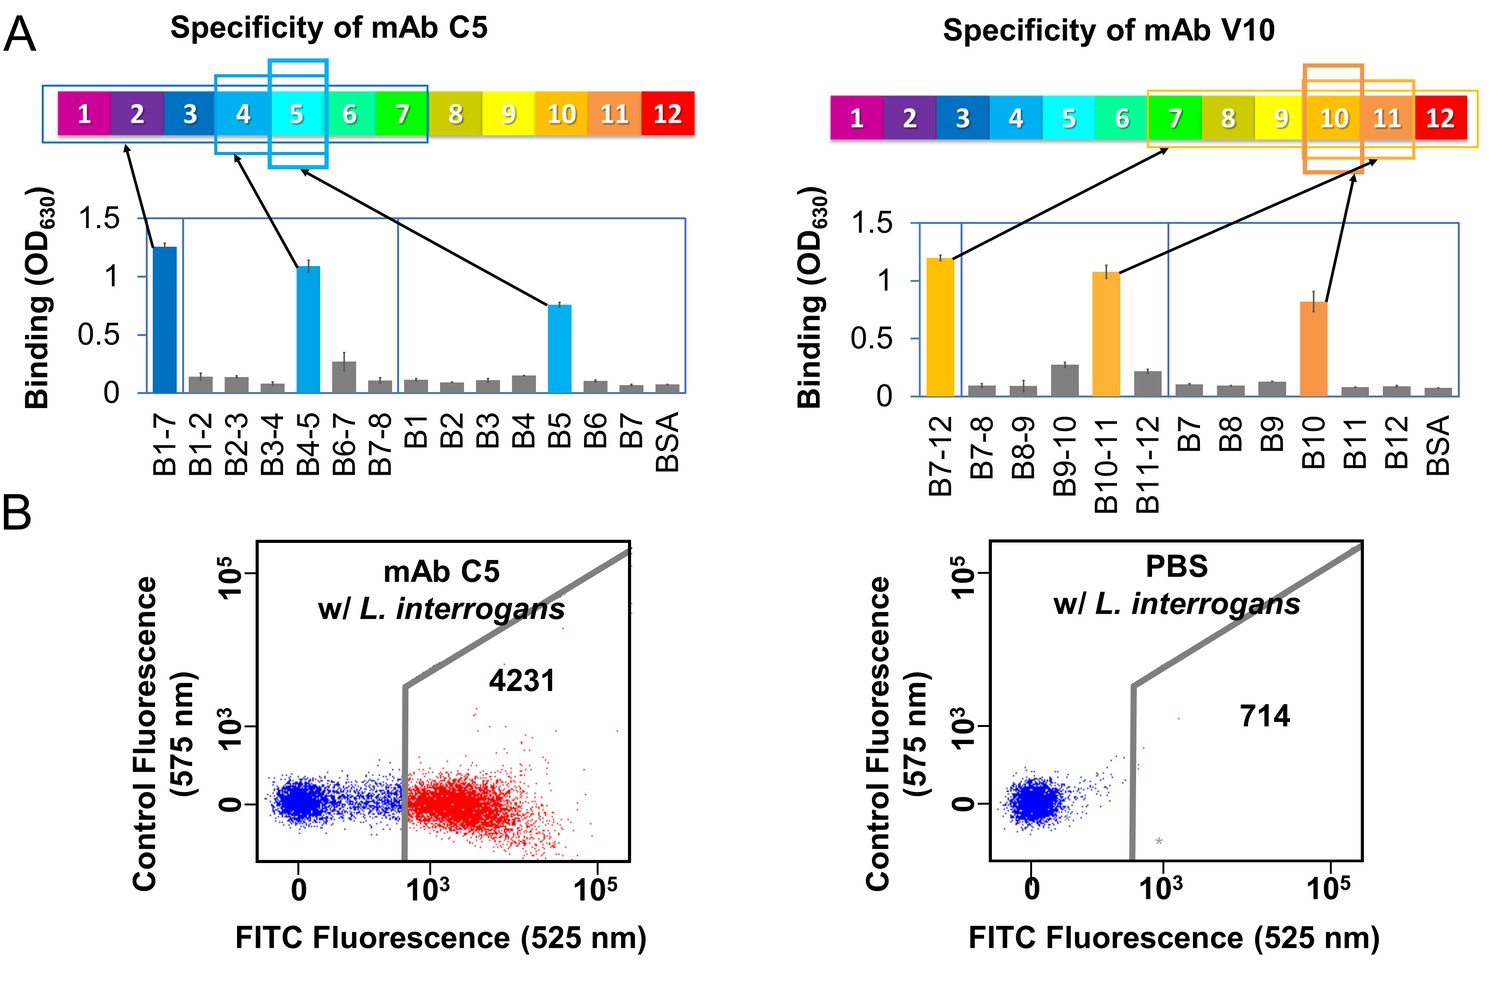
Anti-LigB mAb binding characterization.
(A) A representative example of domain-level epitope ELISA-based mapping for anti-LigB mAbs (full dataset Figure 4—figure supplement 1). The mean ±S.D. for three trials is displayed. (B) Flow cytometry was used to measure the ability of anti-LigB mAbs to bind directly to live Leptospira (Figure 4—figure supplement 2B). The representative fluorescence emission displays the relative binding of fluorescently-labelled secondary anti-mouse IgG antibodies to PBS-treated cells (negative control, right panel) and to mAb C5-treated cells (left panel).
Figure 4—figure supplement 1
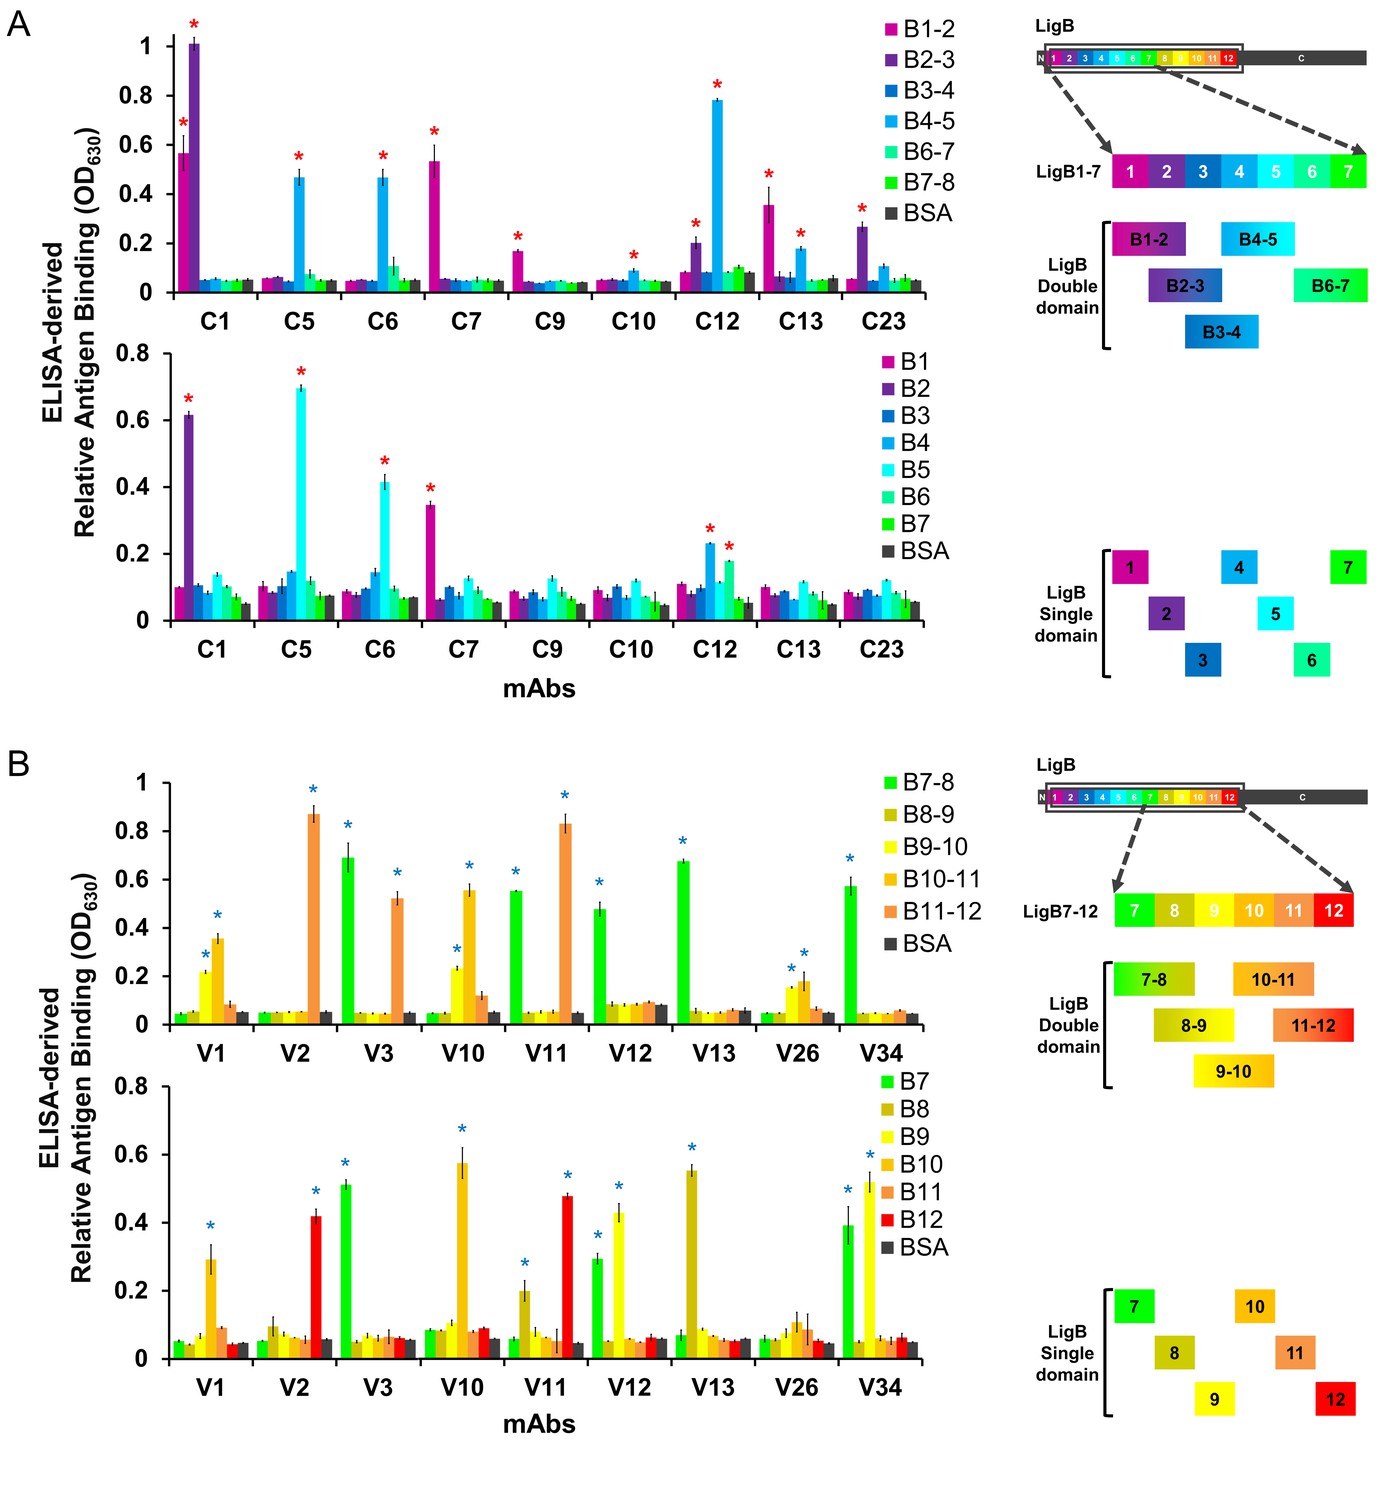
Domain-level epitope mapping of anti-LigB mAb library determined by ELISA.
An array of double and single Ig-like domains from (A) LigB1-7 (1 μg/well) or (B) LigB7-12 (1 μg/well) and BSA (negative control) were coated on the microtiter plates for epitope mapping of mAbs. A fixed concentration (1 μM) of individual mAbs was applied to the LigB-coated wells. The binding levels of the mAbs were measured by rabbit anti-mouse IgG antibody conjugated with HRP (1:5000). Colors correspond to relative domain position. All experiments were conducted in three trials, the mean ±S.D. of which were shown in bar charts. Positive binding domains were identified by comparing with BSA and statistically significant (t-test; p<0.05) differences were marked by an asterisk and indicated in Table 1.
Figure 4—figure supplement 2

Cell surface binding of anti-LigB mAbs.
(A) Flow cytometry was used to generate light scatter plots to obtain the mean fluorescence index (MFI) of FITC-positive cells from two negative control experiments (positive experiment displayed in Figure 4B). The mAb C22 (no binding to LigB1-7) binds poorly to live Leptospira interrogans Pomona (upper panel). The anti-LigB1-7 mAb C5 binds poorly to live non-pathogenic Leptospira biflexa, which does not express LigA or LigB proteins (lower panel). (B) The mean FITC-positive (MFI) count was obtained for a set of mAbs from libraries C and V. Each value represents the mean ± S.D. from two individual trials of two replicates. Statistically significant (t-test; p<0.05) differences were calculated from the comparisons between bacteria bound mAbs and corresponding weakly bound mAbs (*; C22, upper panel; V33, lower panel) or PBS control (#; both panels).
Figure 5 with 4 supplements

Anti-LigB mAb bactericidal properties.
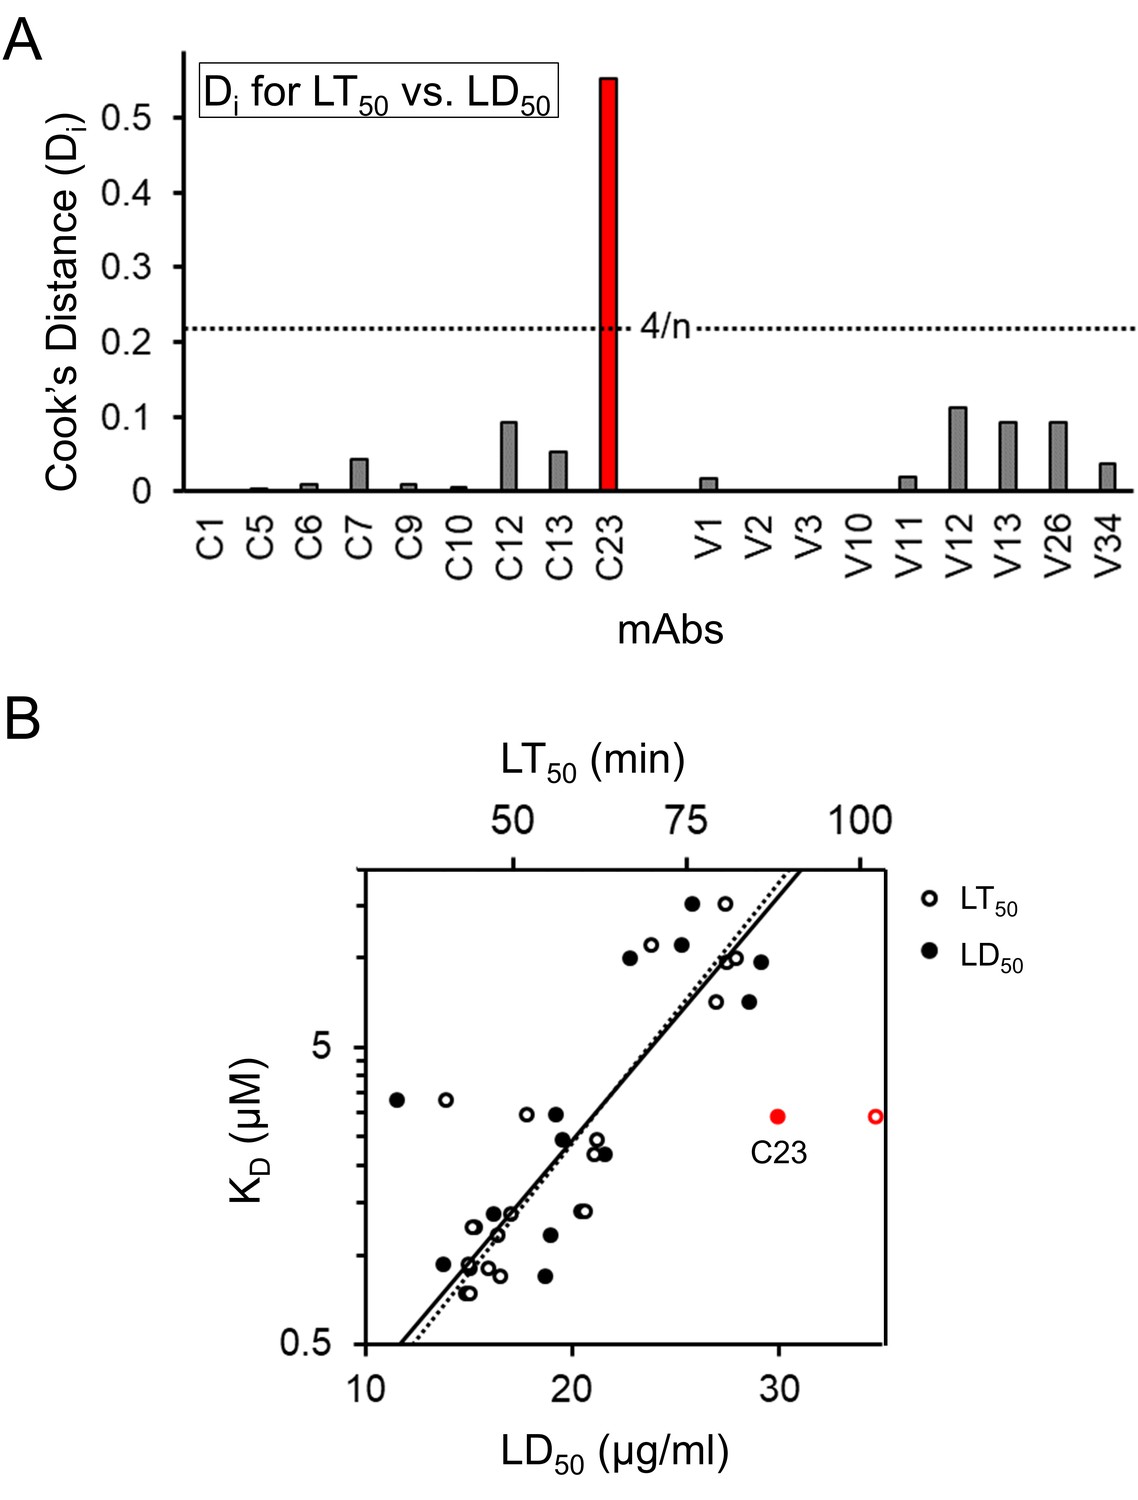
(A, B) Leptospira survival assays were used to assess mAb bactericidal activity. (A) After incubation with individual mAbs, the survival rate of L. interrogans Pomona was observed using dark-field microscopy (B) while the survival rate of bioluminance-producing L. interrogans Manilae was measured using a 96-well luminometer-based assay (full dataset Figure 5—figure supplement 1). Each value represents the mean ± S.D. from three individual trials of two replicates. Statistically significant (t-test; p<0.05) differences were calculated from the comparisons between mAb-treated groups and the control group (*) or between mAb-treated groups and the pAb group (#). (C) A schematic is shown for the SAXS-derived LigB structure. (D) For the set of mAbs, the ELISA antigen binding value is plotted against the LD50. Points for mAbs are colored to match the three domain regions defined in the schematic. Statistically-determined outliers are labelled and data was fit with and without outliers (dashed line, R²=0.508 and solid line, R²=0.773, respectively). (E) For mAbs measured for cell surface binding, the FACS cell binding value is plotted against the LD50 and data is fit with and without outlier, mAb C23 (dashed line, R²=0.312 and solid line, R²=0.466, respectively).
Figure 5—figure supplement 1
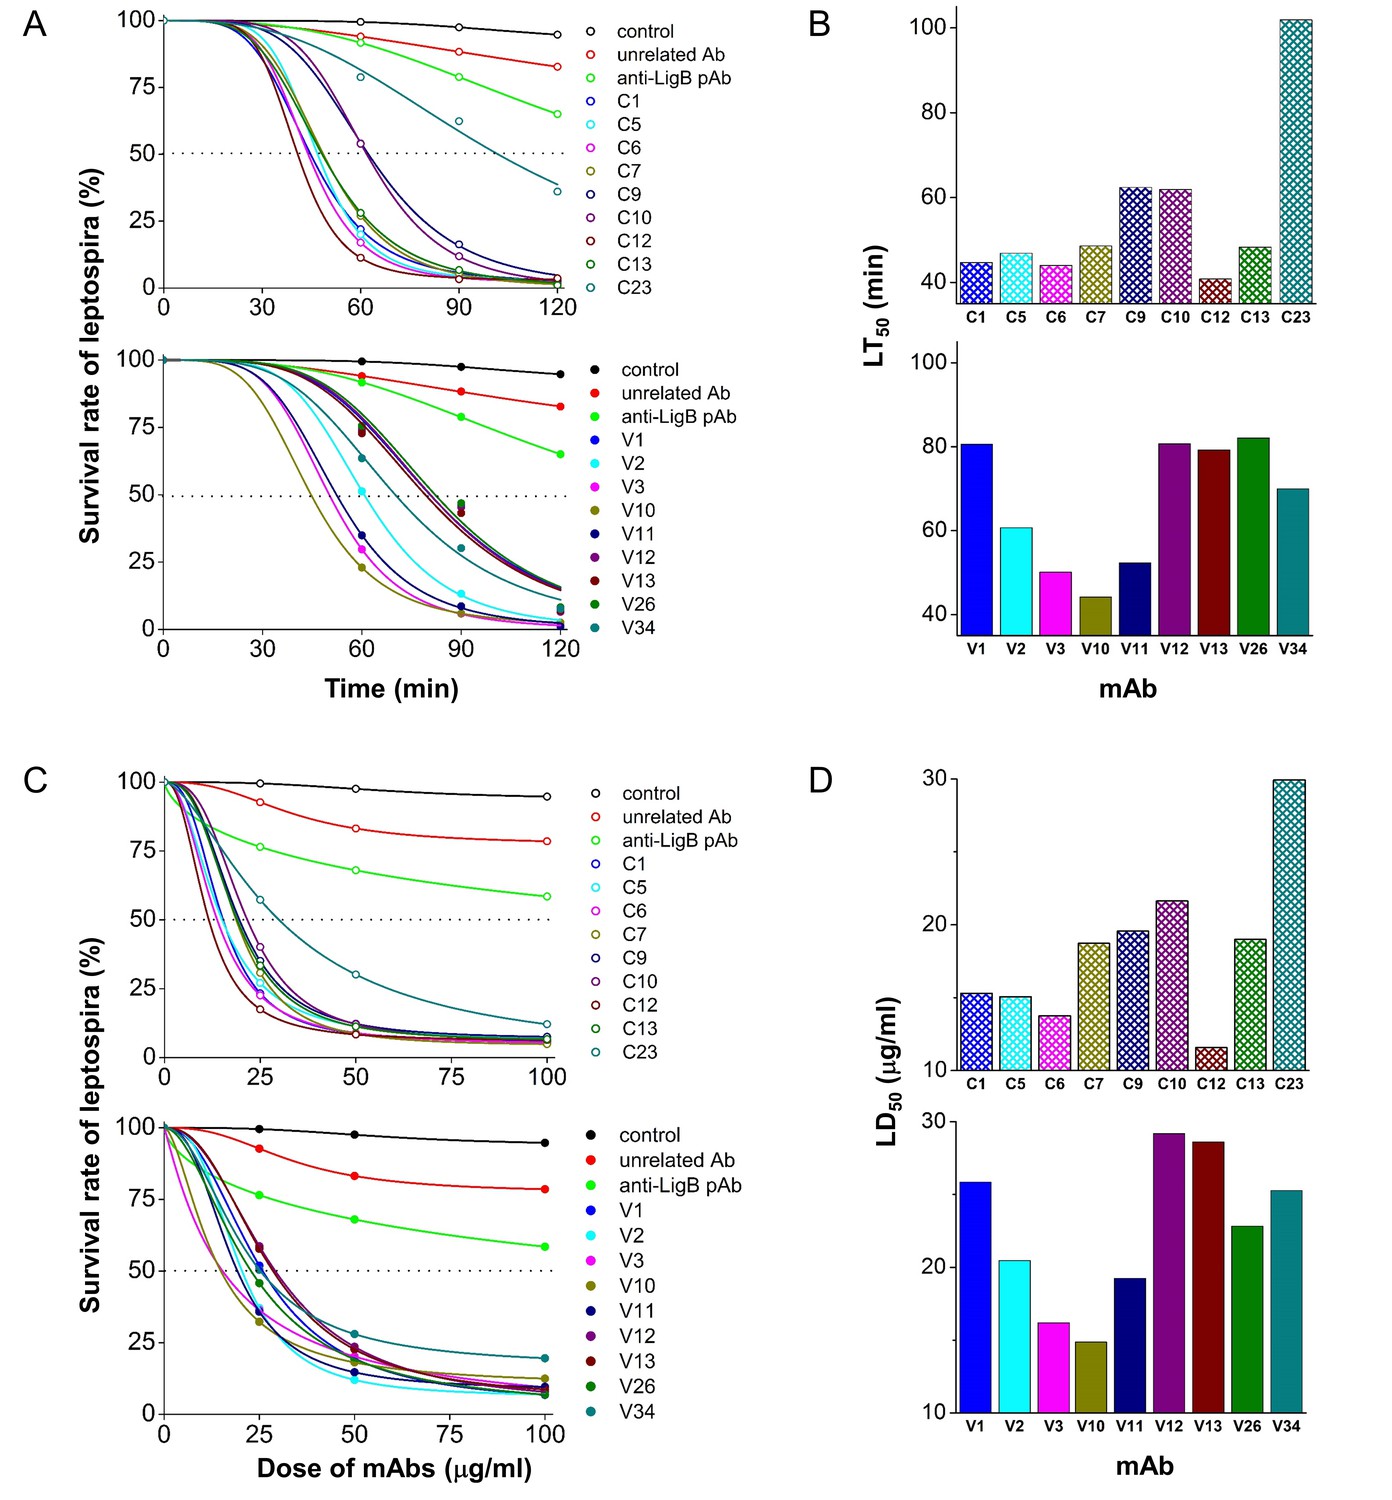
Serum bactericidal activity characterization of anti-LigB mAb library.
(A) Time-dependence of mAb serum bactericidal activity. Bioluminance-producing L. interrogans Manilae were incubated with individual mAbs at 100 μg/ml. The leptospiral survival rates in the presence of mAbs and human serum complements were measured using a luminometer at different time points (60, 90, and 120 min). Negative controls were measured in the presence of no antibody (control) and an isotypic mouse IgG (unrelated Ab). Survival measurements for hamster anti-LigB polyclonal antibodies (anti-LigB pAb) are also shown. The data were fit using a standard logistic equation. (B) The median lethal time (LT50) was calculated for individual mAbs from the fitted logistic curve using Origin software. (C) Dose-dependence of mAb serum bactericidal activity. Bioluminance-producing L. interrogans Manilae were incubated with individual mAbs at various mAb concentrations (25, 50, and 100 μg/ml). The leptospiral survival rates in the presence of mAbs and human serum complements were measured at 90 min. The data were fit using a dose inhibition equation using Origin software. (D) The median lethal dose (LD50) was calculated for individual mAbs from the fitted dose inhibition curve.
Figure 5—figure supplement 2
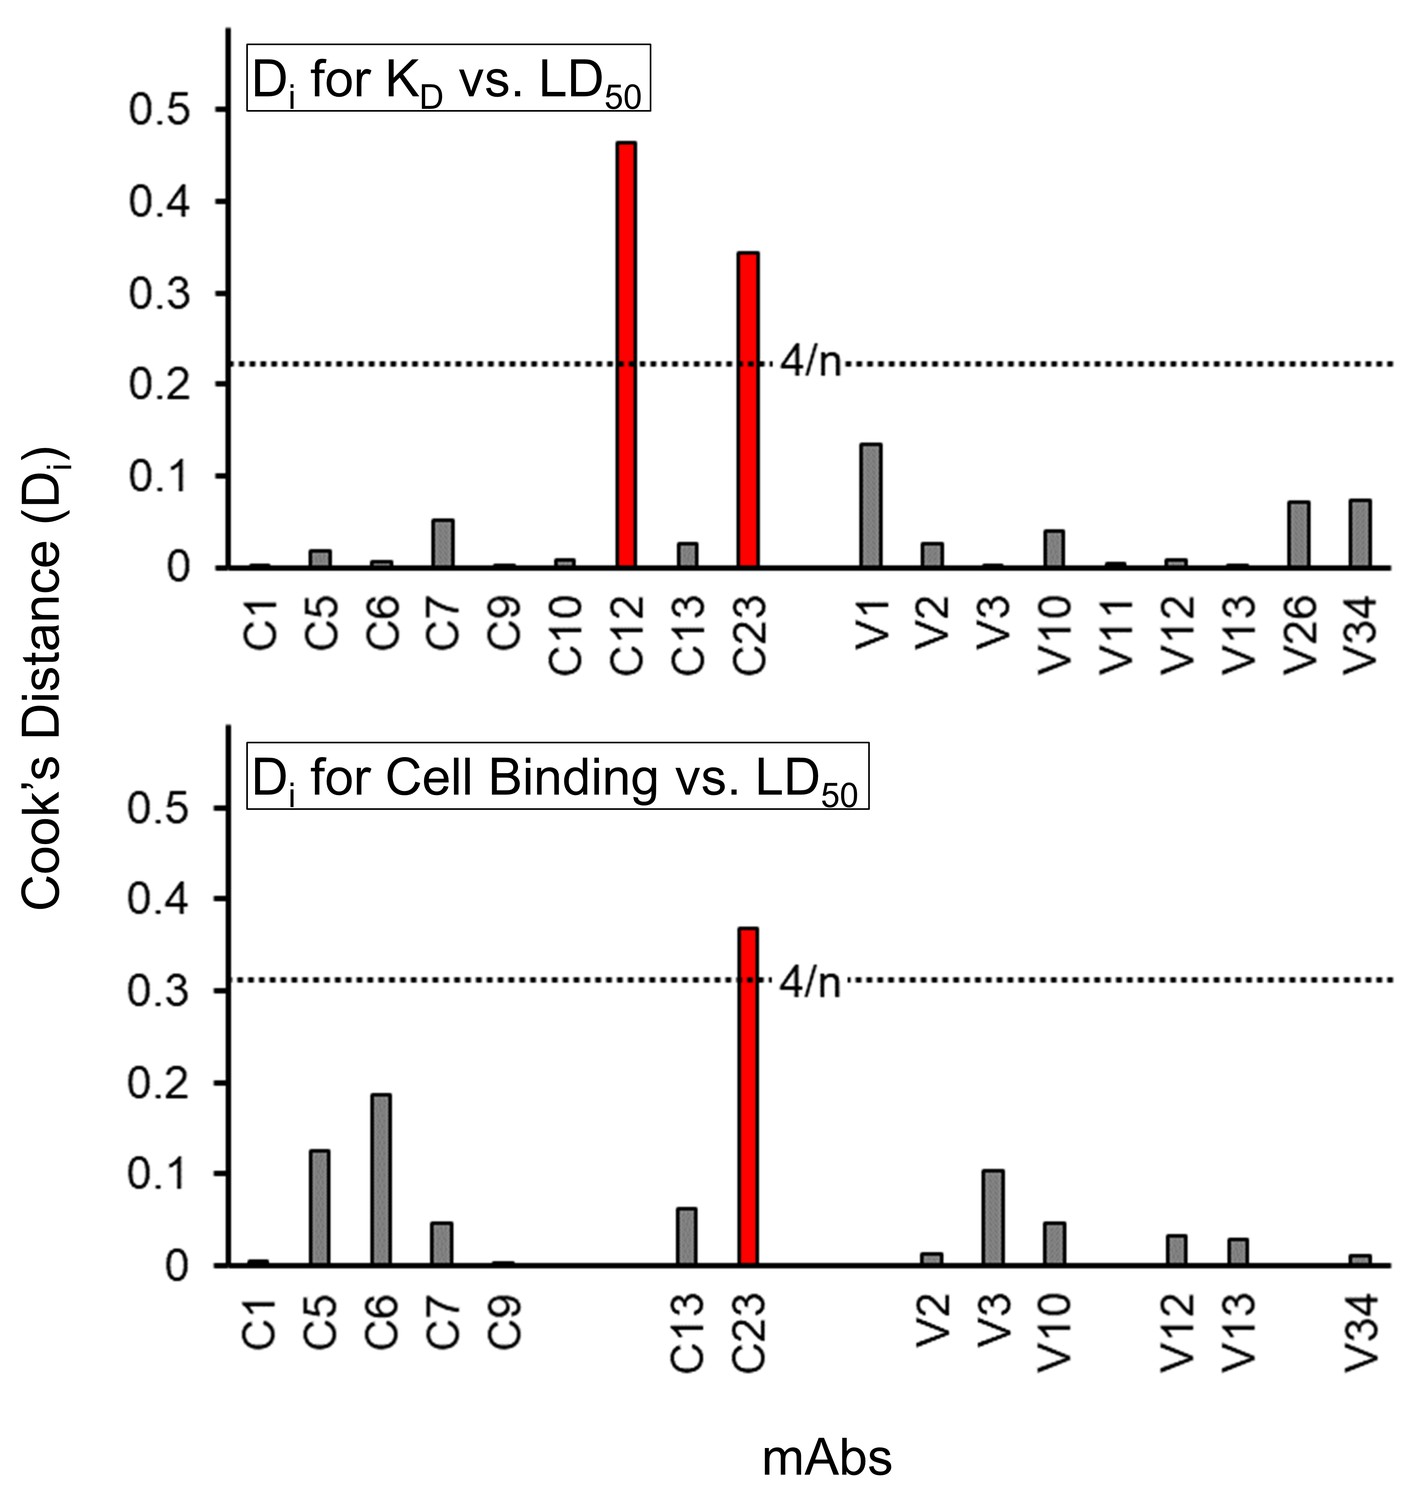
Statistically determined outliers for scatter plots.
Cook’s distance (Di) demonstrates the influence of a point on a defined correlation. For the linear correlations of LOG(KD) vs. LD50 (Figure 5D) and FACS Cell Binding vs. LD50 (Figure 5E), Di was determined for each data point. Di values above the threshold of 4/n (red) deviate from the expected relationship between binding and bactericidal activity and were considered to be outliers.
Figure 5—figure supplement 3
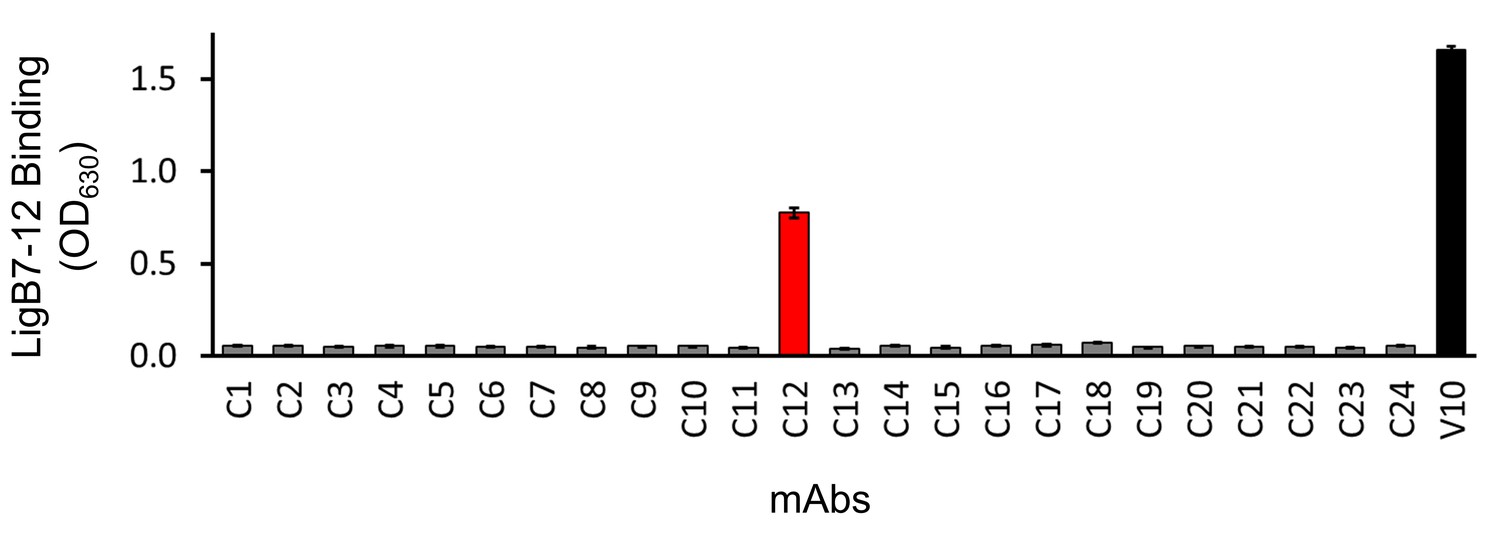
Binding of library C mAbs to LigB7-12.
Library C mAbs were generated from hybridoma cell lines exposed to LigB1-7. The ability of library C mAbs to bind LigB7-12 was also assessed by colorimetic (λ630) TMB-ELISA. LigB7-12 binding was identified for C12 and V10 (positive control). Each value represents the mean ± S.D. from two individual trials of two replicates.
Figure 5—figure supplement 4
Comparison of bactericidal activity values, LT50 and LD50.
(A) The Cook’s Distance (Di) was determined for the linear correlation of LT50 and LD50 (R2 = 0.867). C23 (red) was the only mAb with a Di value above the outlier threshold. (B) Plots of KD vs. LD50 and KD vs. LT50 are overlaid and centered on fits with C12 and C23 removed (solid line: LD50R2 = 0.773, dashed line: LT50R2 = 0.872). The LT50 value of C23 (open red) is shifted farther away from the expected value than the LD50 value of C23 (solid red).
Figure 6 with 1 supplement
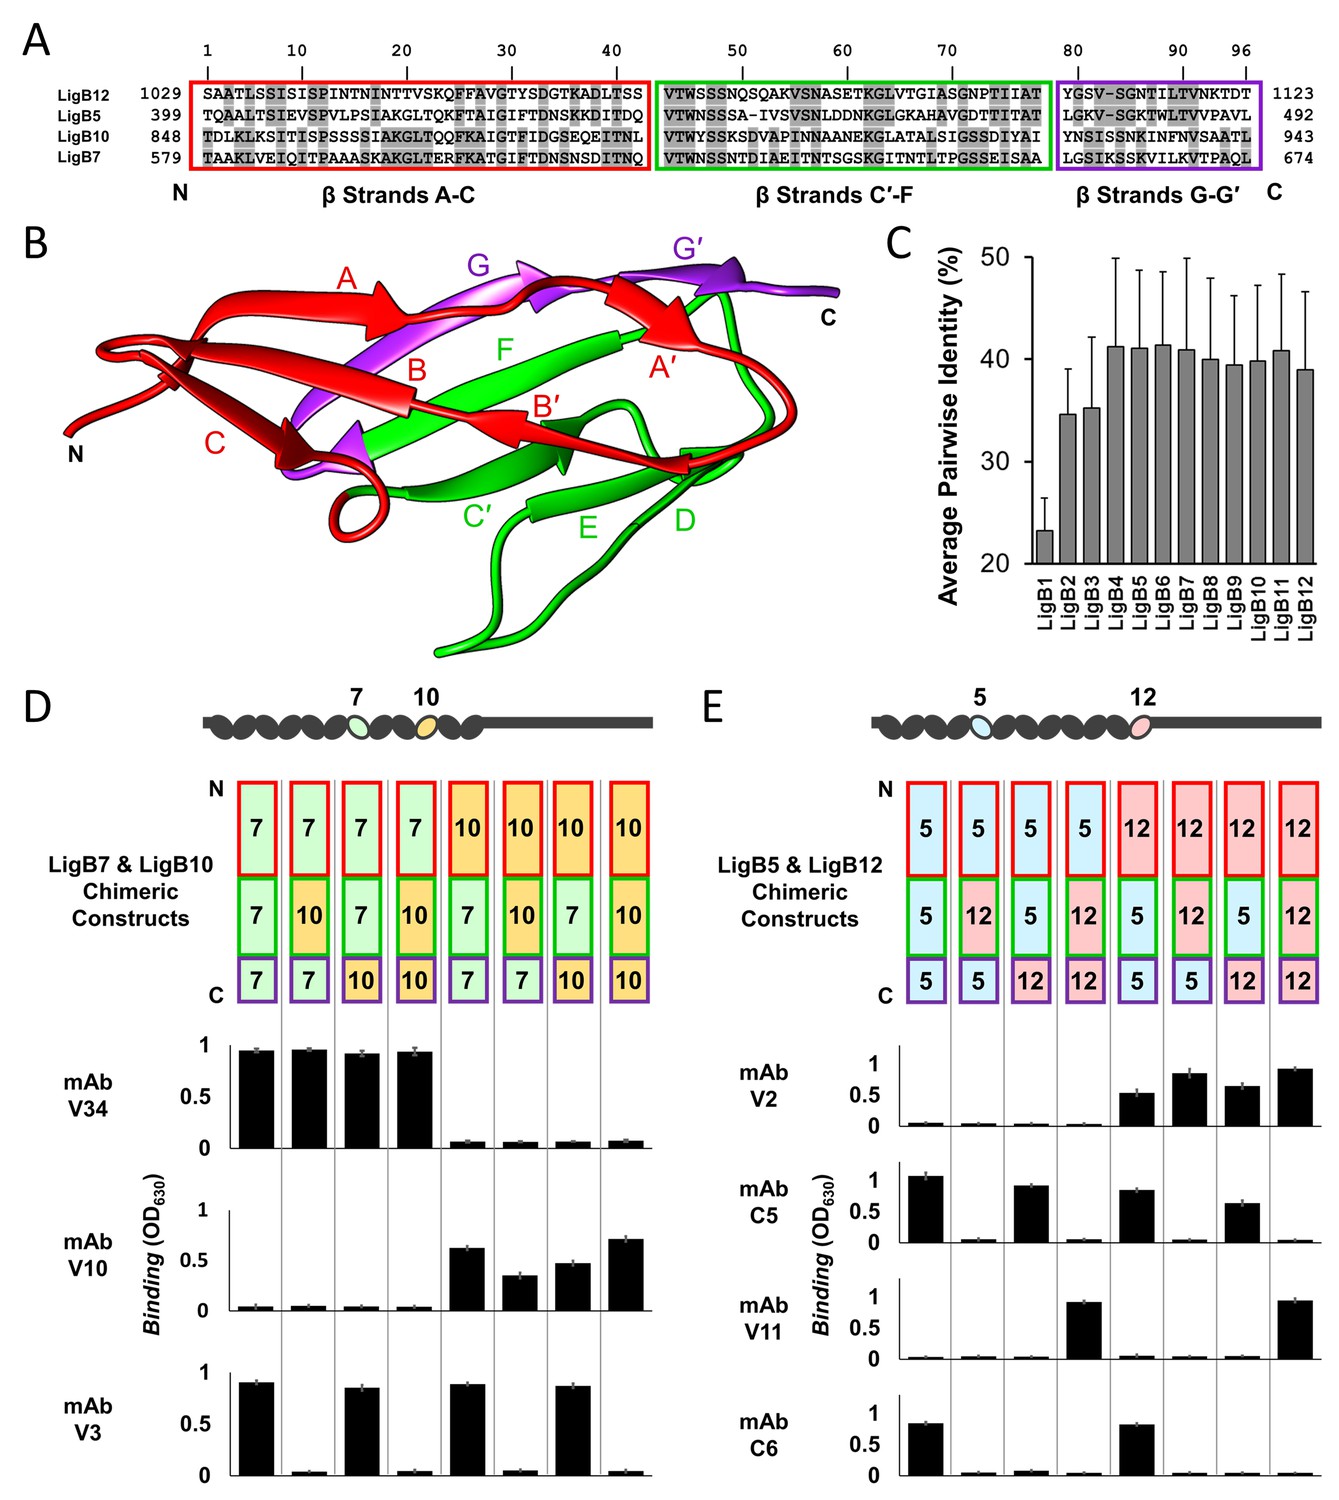
Dissection of mAb binding surfaces using chimeras.
(A) Sequence alignment of LigB Ig-like domains used for generating chimeras. The chimeric swap regions are divided into colored boxes. Residues that are identical in either LigB5 and LigB12 or LigB7 and LigB10 pairs are shaded. (B) The structure of LigB12 (PDB ID 2MOG) is correspondingly colored by chimeric swap regions. (C) Average percent identity ± S.D. for each LigB Ig-like domain based on a pairwise matrix. (D) The set of LigB7 and LigB10 single domain chimeric constructs which cover all variations for the three swapped regions (schematic representation shown) were tested for binding to mAbs with LigB7-binding specificity (V34 and V3) or LigB10-binding specificity (V10) using an ELISA assay. (E) LigB5 and LigB12 chimeras were similarly tested for binding to mAbs with LigB5-binding specificity (C5 and C6) or LigB12-binding specificity (V2 and V11). The ELISA binding values correspond to the chimeric construct representation at the top of the column. All ELISA experiments were conducted in three trials, the mean ± S.D. of which were shown in bar charts.
Figure 6—figure supplement 1
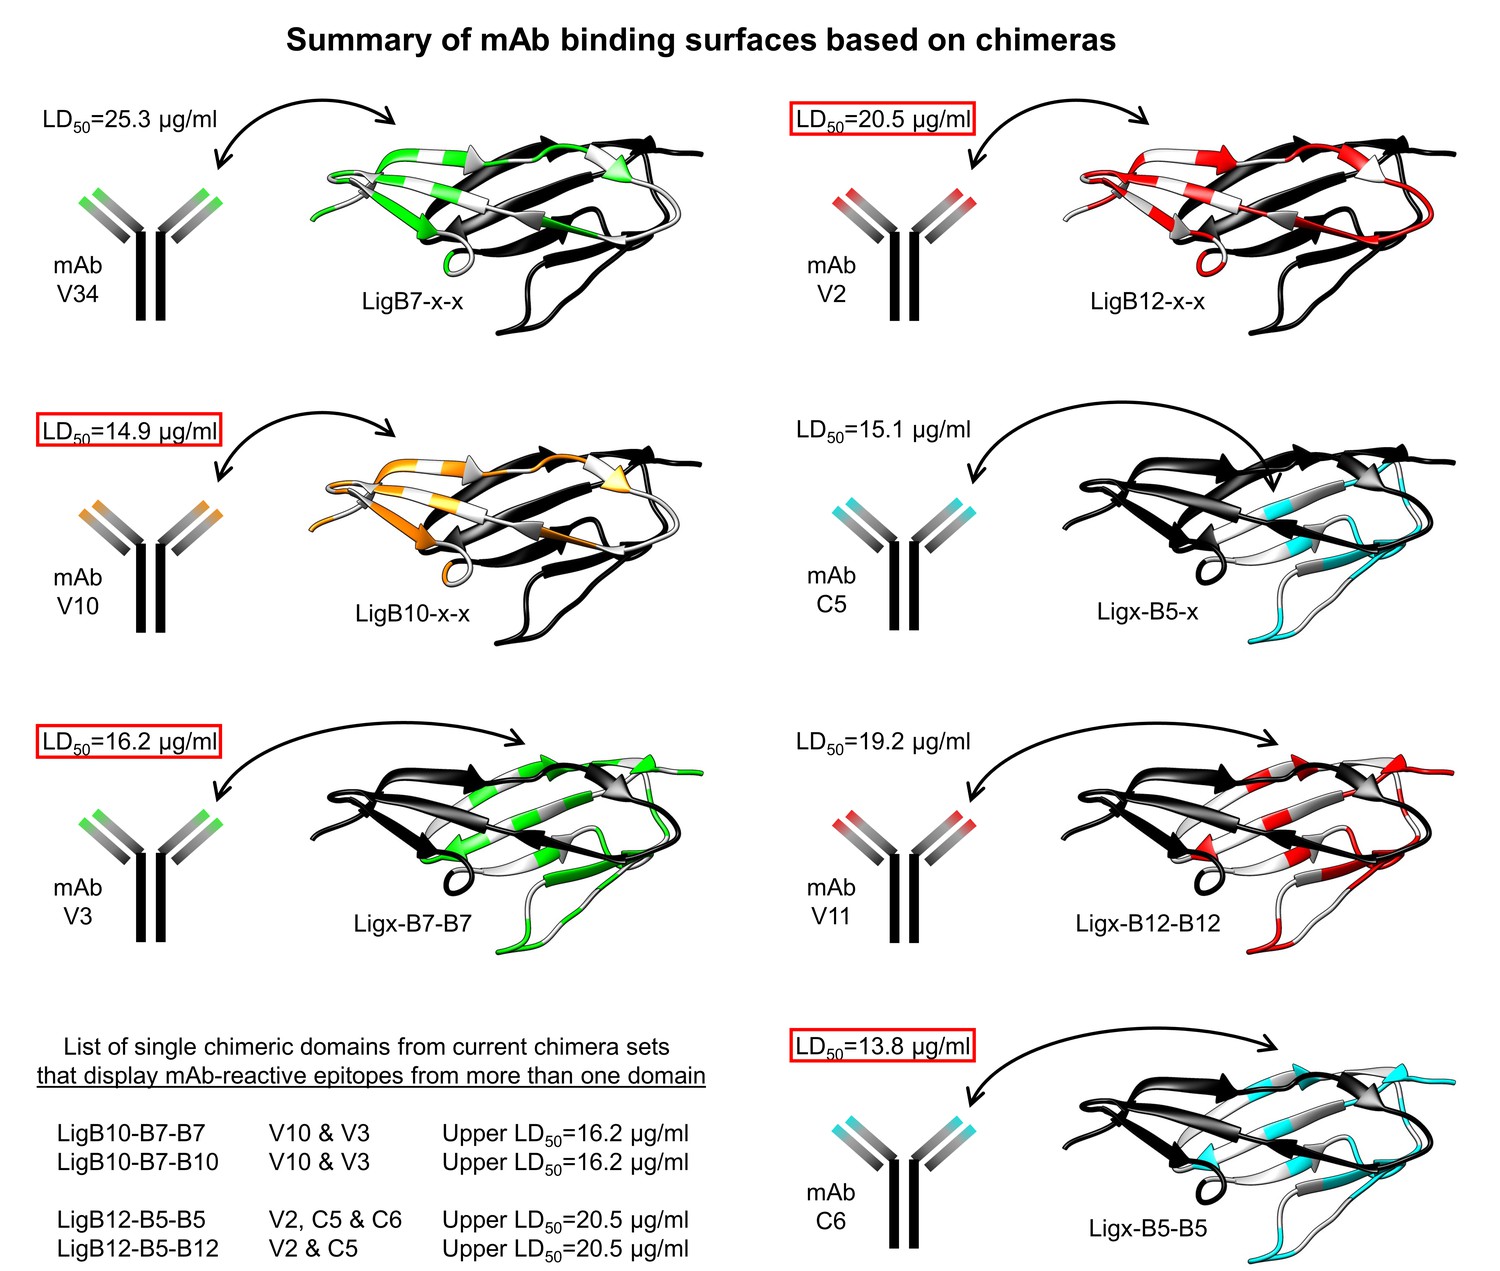
Summary of mAb binding surfaces based on chimeras.
LigB Ig-like domain chimeras were used to screen which protein surfaces possessed immunoreactivity to the library of LigB mAbs. The Ig-like domain region of mAb specificity is mapped to the corresponding residue location of the LigB12 structure (PDB ID 2MOG). Colored residues (green, LigB7; orange, LigB10; red, LigB12; cyan, LigB5) indicate the location of non-identical residues within the chimera set (LigB7/B10 or LigB5/B12), while white residues indicate identical residues in the chimera parent alignments. The mAb LD50 (Table 1) is listed with the lowest value specific to the N-terminal sheet (strands A-C) and the C-terminal sheet (strands C′-G′) for each chimera set boxed in red. The upper LD50 is also listed (lower left) for chimeric domains that can be detected with dual-parent domain mAb specificity.
Figure 7 with 4 supplements
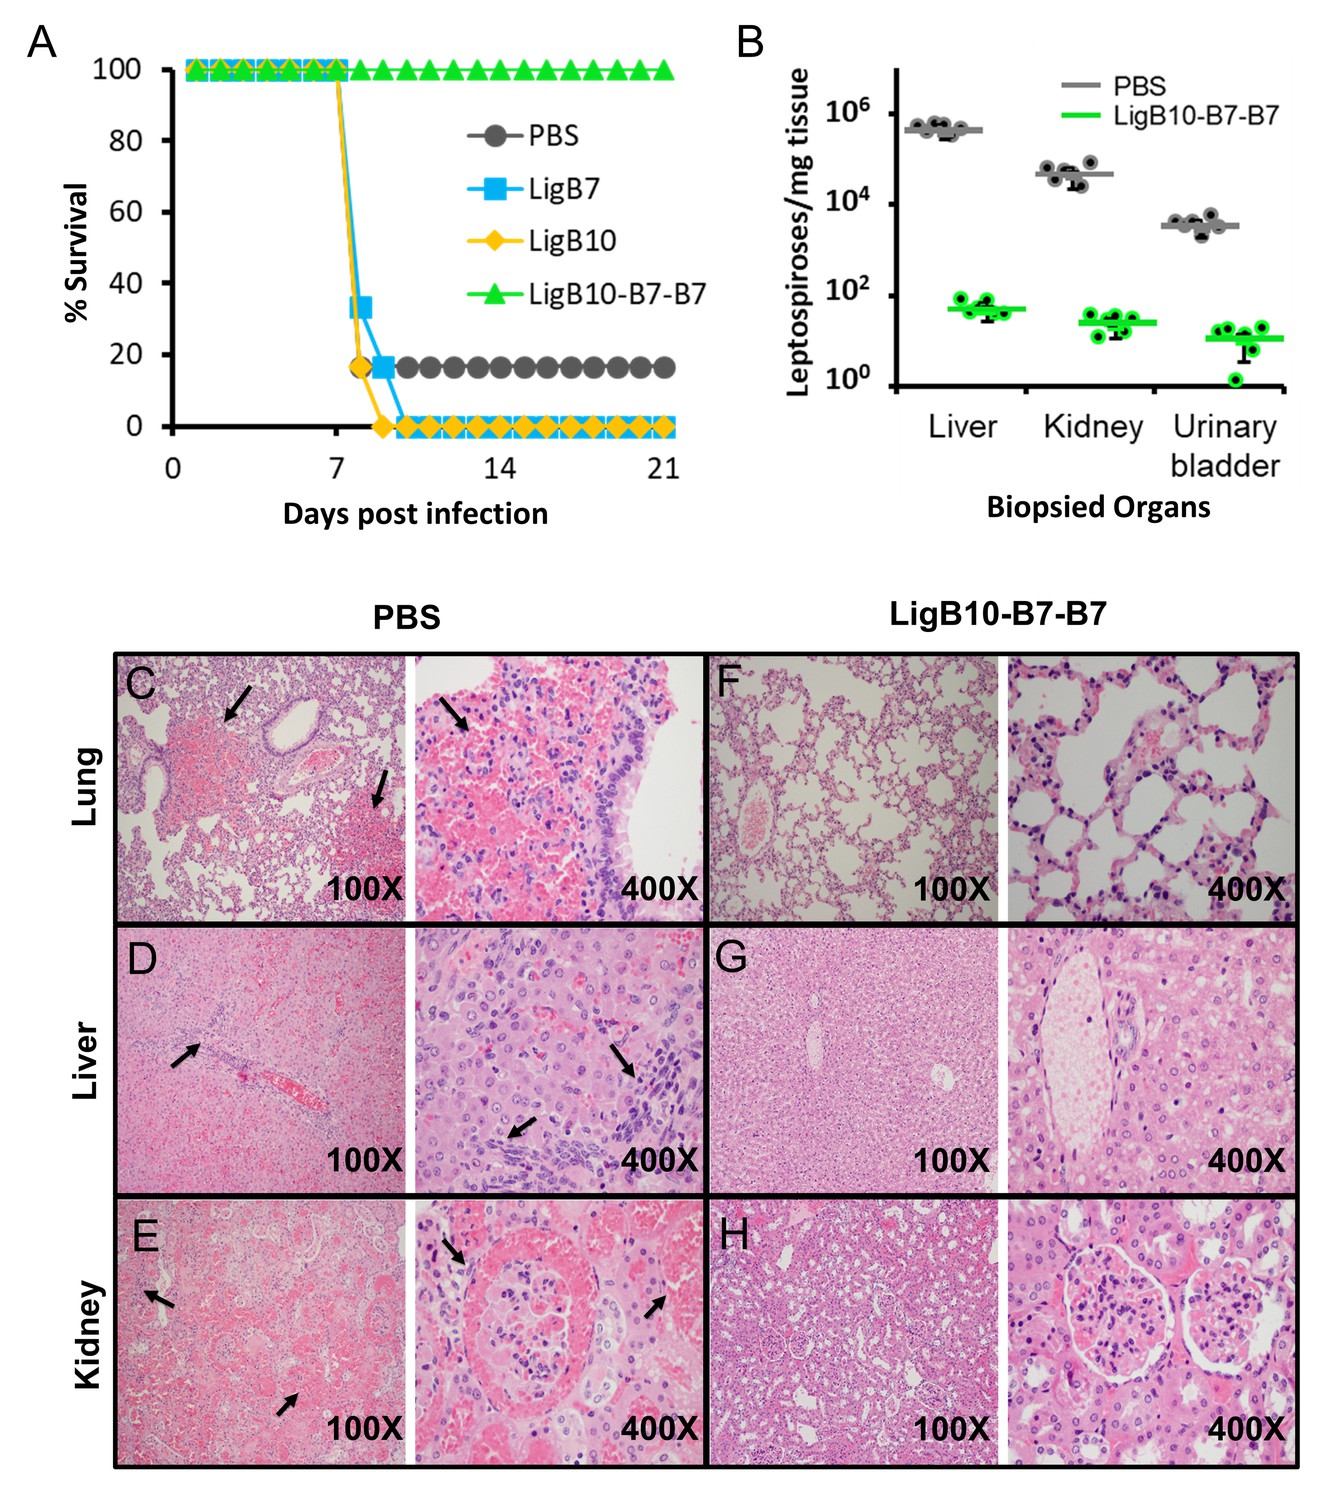
Leptospira lethal challenge of hamsters immunized with LigB Ig-like domains.
(A) Survival rates for groups of six immunized hamsters are shown for the 3 weeks post leptospiral challenge. Inoculations and boosters with specific LigB Ig-like domains occurred 3 and 6 weeks prior to leptospiral infection. Sera from immunized hamsters were tested for domain-specific immunoreactivity (Figure 7—figure supplement 2). (B) The indicated organ tissues were biopsied from post-challenged hamsters immunized with PBS (control) or LigB10-B7-B7. The leptospiral load of hamster tissue was determined by RT-qPCR for the Leptospira specific gene, LipL32. Each point depicts the mean value obtained from duplicate analysis of individual tissue samples. Bars indicate the mean bacterial loads ± S.D. (six hamsters per group). Leptospiral loads for the PBS group are significantly higher than those of the LigB10-B7-B7 group in all three tissues. (C-H) Post-challenged hamster tissues that are targets for spirochete infection were fixed by formalin and stained by hematoxylin and eosin. PBS (control) immunized hamster tissue exhibited (C) multifocal lung hemorrhage, (D) liver inflammation and necrosis, and (E) tubulointerstitial nephritis and hemorrhage in the kidneys (each indicated by arrows). (F-H) Tissue from the LigB10-B7-B7 immunized group were all within normal limits.
Figure 7—figure supplement 1
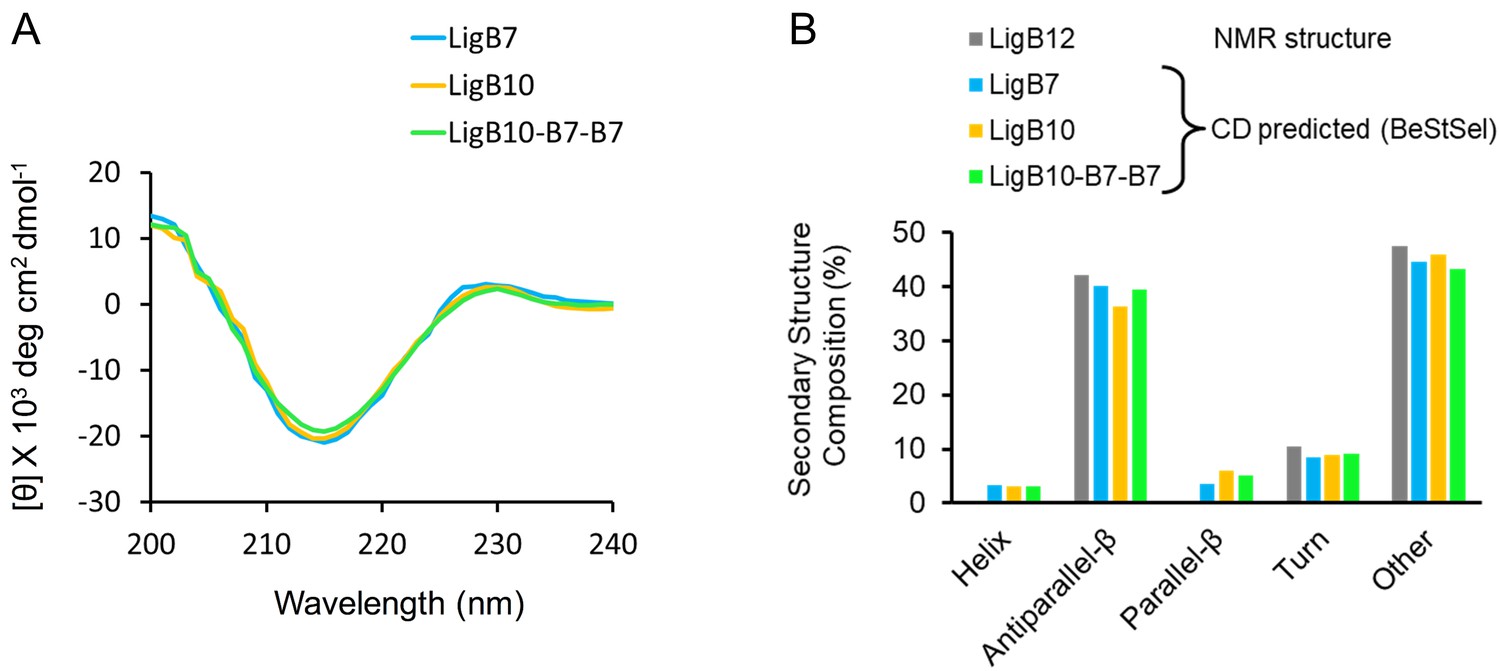
Secondary structure analysis for LigB Ig-like domains utilized in immunization trials.
(A) Far-UV circular dichroism (CD) spectra were measured for LigB7, LigB10, and LigB10-B7-B7. The molar ellipticity, θ, was measured from 200 nm to 240 nm for 10 μM of each protein at room temperature. Mean values from three independent measurements were used to generate the spectra. (B) Using the experimental CD spectra, the secondary structure compositions for LigB7, LigB10, and LigB10-B7-B7 were predicted with the BeStSel webserver. The top Class, Architecture, and Topology predictions for all three LigB proteins were Mainly Beta, Sandwich, and Immunoglobulin-like, respectively. The BeStSel-derived secondary structure composition of LigB12 obtained from the NMR structure (PDB ID 2MOG) is reported for comparison.
Figure 7—figure supplement 2
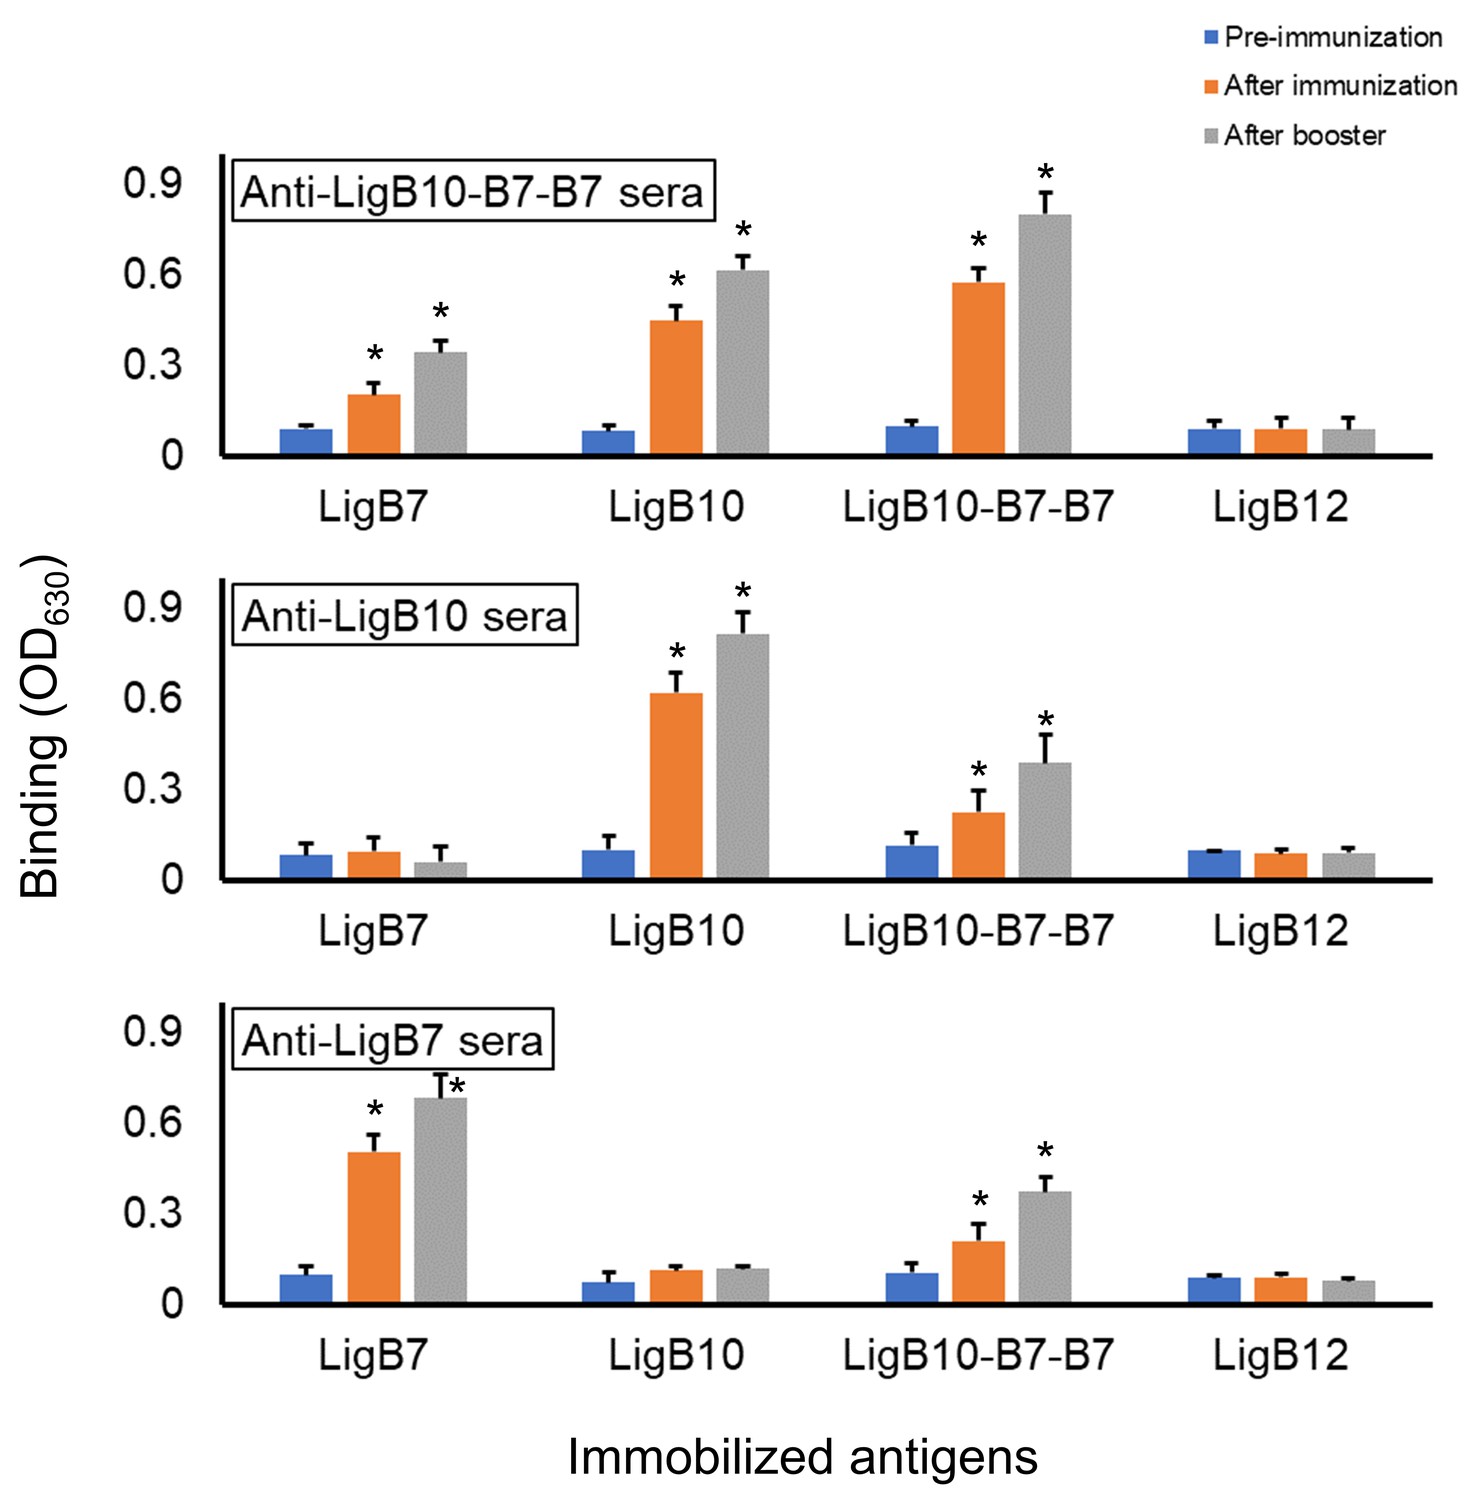
Detection of humoral response.
The serological fluid of hamsters immunized with recombinant LigB Ig-like domain vaccines showed strong antibody generation against the corresponding domain antigens in an ELISA assay (orange, after immunization; gray, after booster). Anti-LigB10 and Anti-LigB7 sera exhibited immunoreactivity against LigB10-B7-B7 but not LigB12 (negative control) while Anti-LigB10-B7-B7 sera exhibited immunoreactivity against LigB10 and LigB7 but not LigB12 (negative control). All experiments were conducted in three trials, the mean ± S.D. of which were shown in bar charts. Positive sera immunoreactivities were identified by comparing with LigB12 and statistically significant (t-test; p<0.05) differences were marked by an asterisk.
Figure 7—figure supplement 3
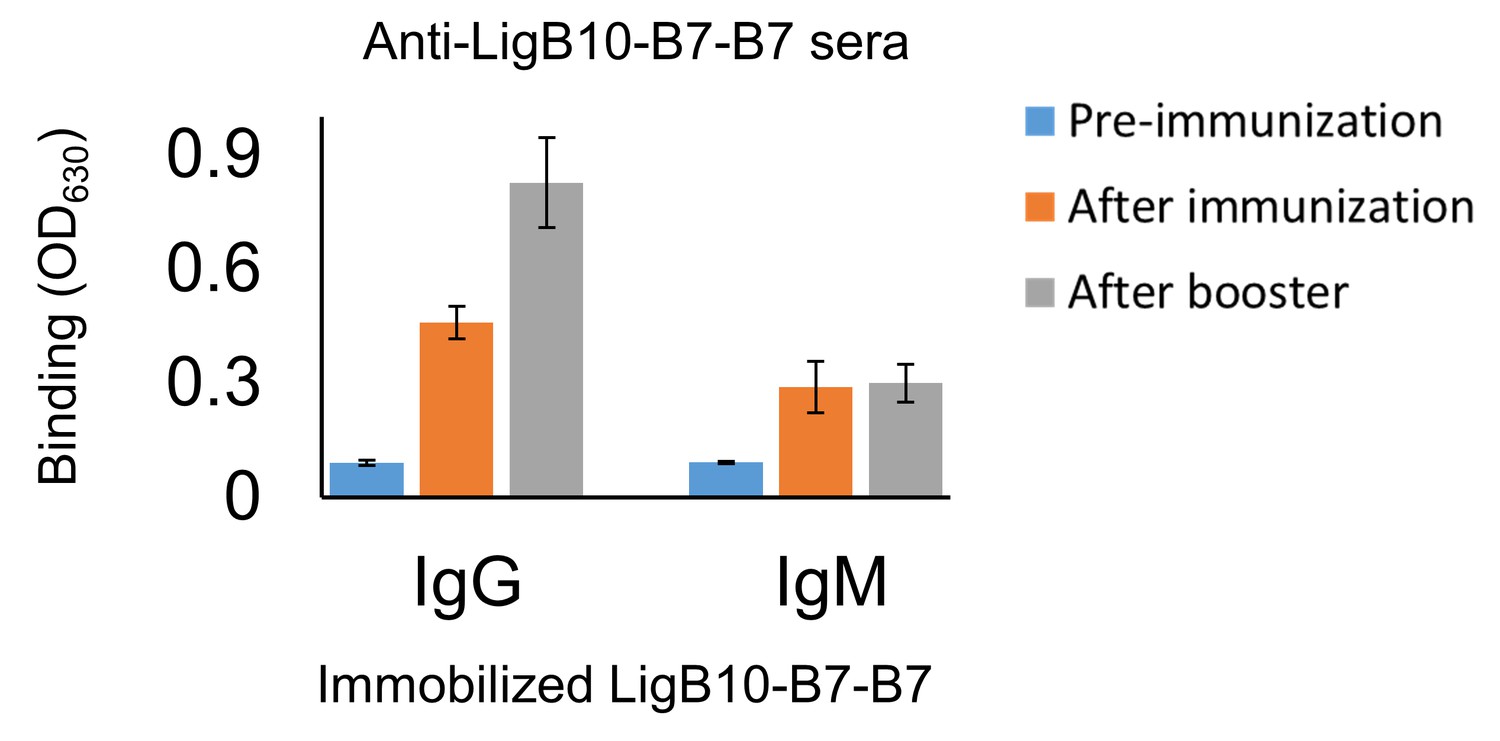
Memory response triggered by LigB10-7-7 chimera.
The serological fluid of hamsters immunized with recombinant LigB10-7-7 antigen was collected before immunization, after immunization (primary response), and after the booster (secondary response). Anti-LigB10-B7-B7 sera was applied to recombinant LigB10-7-7 coated microtiter plates and tested for antigen-specific IgG or IgM using secondary antibodies (anti-hamster IgG or IgM conjugated with HRP). All experiments were conducted in three trials, the mean ± S.D. of which were shown in bar charts.
Figure 7—figure supplement 4
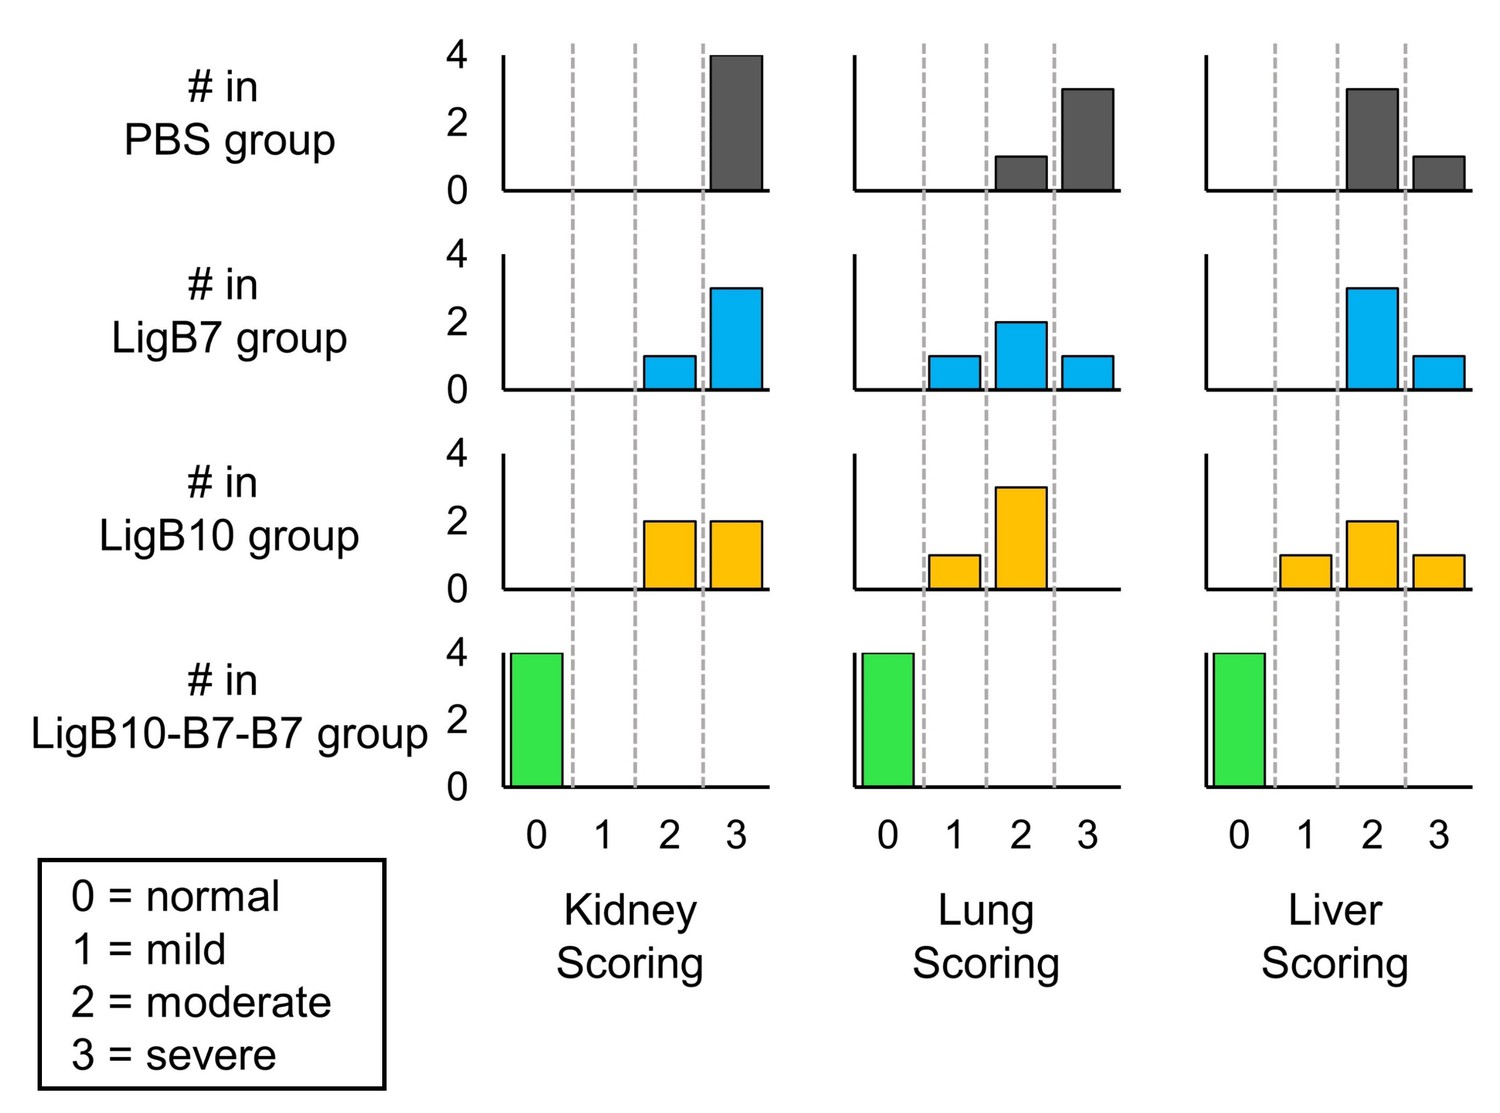
Histograms of post-challenged hamster tissue scores for PBS, LigB7, LigB10, and LigB10-7-7 inoculated groups.
Respective tissues from four hamsters in each immunization group were individually harvested and fixed. Histopathological scoring was performed by a board certificated veterinary pathologist. Kidney tissues were graded for severity of renal lesions (0 = normal, 1 = mild, 2 = moderate, 3 = severe tubulointerstital nephritis). Lung tissues were graded for severity of hemorrhage (0 = normal, 1 = focal, 2 = multifocal, 3 = locally extensive areas of hemorrhage). Liver tissues were graded for the number of inflammatory foci (0 = normal, 1 = 1–3, 2 = 4–7, 3 =>7).
Tables
Table 1
Anti-LigB mAb characterization summary.
Mean values for the dissociation constant (KD), FACS cell binding propensity (MFI), and lethal dose (LD50) are listed for mAbs against LigB1-7 (library C) and LigB7-12 (library V). Double and single domain specificities for mAbs are also noted.
| Anti-LigB mAbs | KD (μM) | Cell binding (MFI) | LD50 (μg/ml) | LigB domain specificity | |
|---|---|---|---|---|---|
| Library C (Anti-LigB1-7) | Double domain | Single domain | |||
| C1 | 1.232 | 3497.5 | 15.29 | LigB1-2 LigB2-3 | LigB2 |
| C5 | 0.896 | 4499.5 | 15.07 | LigB4-5 | LigB5 |
| C6 | 0.923 | 4644.5 | 13.76 | LigB4-5 | LigB5 |
| C7 | 0.848 | 2722.5 | 18.72 | LigB1-2 | LigB1 |
| C9 | 2.440 | 3530.0 | 19.56 | LigB1-2 | n.s. |
| C10 | 2.162 | 21.63 | LigB4-5 | n.s. | |
| C12 | 3.301 | 11.57 | LigB2-3 LigB4-5 | LigB4 LigB6 | |
| C13 | 1.166 | 4186.0 | 18.98 | LigB1-2 LigB4-5 | n.s. |
| C23 | 2.916 | 3469.5 | 29.92 | LigB2-3 | n.s. |
| C22 | n.b. | 1121.5 | |||
| Library V (Anti-LigB7-12) | Double Domain | Single Domain | |||
| V1 | 15.151 | 25.85 | LigB9-10 LigB10-11 | LigB10 | |
| V2 | 1.391 | 2889.0 | 20.45 | LigB11-12 | LigB12 |
| V3 | 1.367 | 2568.5 | 16.19 | LigB7-8 LigB11-12 | LigB7 |
| V10 | 0.738 | 3211.0 | 14.87 | LigB9-10 LigB10-11 | LigB10 |
| V11 | 2.956 | 19.24 | LigB7-8 LigB11-12 | LigB8 LigB12 | |
| V12 | 9.574 | 2333.5 | 29.18 | LigB7-8 | LigB7 LigB9 |
| V13 | 7.064 | 2376.0 | 28.60 | LigB7-8 | LigB8 |
| V26 | 9.915 | 22.83 | LigB9-10 LigB10-11 | n.s. | |
| V34 | 11.011 | 2665.0 | 25.28 | LigB7-8 | LigB7 LigB9 |
| V33 | n.b. | 910.5 | |||
| Source of relevant data | Figure 3, Figure 3—figure supplement 1 | Figure 4B, Figure 4—figure supplement 2 | Figure 5, Figure 5—figure supplement 1 | Figure 4A, Figure 4—figure supplement 1 | |
-
n.b. no significant binding.
n.s. no significant binding partner was determined.
Key resources table
| Reagent type (species) or resource | Designation | Source or reference | Identifiers | Additional information |
|---|---|---|---|---|
| gene (Leptospira interrogans serovar Pomona) | LigB (1-12) | GenBank | GenBank:FJ030916 | |
| recombinant DNA reagent | pET28-His-Sumo (plasmid) | other | Re-engineered by Dr. Mao's lab (Manford et al., 2010) | |
| strain, strain background (Escherichia coli) | E. coli Rosetta strain | Novagen | Novagen:70954 | |
| commercial assay or kit | Ni-NTA resin | Qiagen | ||
| peptide, recombinant protein | Sumo protease (Ulp-1) | other | protein expression by Dr. Chang's lab utilizing pET28-His- Sumo vector provided by Dr. Mao's lab, and IPTG induction in Rosetta strain E. coli | |
| commercial assay or kit | Superdex75 (size exclusion chromatography) | GE Healthcare | GE_Life_Sciences: 17517401 | |
| software, algorithm | BeStSel | DOI:10.1073/pnas.1500851112 | Uses CD spectra obtained from Aviv-201 spectropolarimeter | |
| software, algorithm | Clustal Omega | DOI:10.1093/nar/gkt376 | RRID:SCR_001591 | |
| software, algorithm | ATSAS Suite (GNOM; DAMMAVER; DAMMIF; AMBIMETER) | DOI:10.1107/S1600576717007786 | RRID:SCR_015648 | |
| software, algorithm | RAW | DOI:10.1107/S1600576717011438 | ||
| biological sample (L. interrogans) | LigB1-7 | this lab | protein expression utilizing pET28-His- Sumo vector and IPTG induction in Rosetta strain E. coli | |
| biological sample (L. interrogans) | LigB7-12 | this lab | protein expression utilizing pET28-His- Sumo vector and IPTG induction in Rosetta strain E. coli | |
| biological sample (L. interrogans) | LigB5-12 | this lab | protein expression utilizing pET28-His- Sumo vector and IPTG induction in Rosetta strain E. coli | |
| commercial assay or kit | Protein A/G Chromatography | ThermoFisher Scientific Pierce | ||
| cell line (Mus musculus) | hybridoma clones | William Davis Laboratory | mAb-producing cell lines generated from BALB/c mice immunized with recombinant LigB antigen | |
| antibody | HRP-conjugated anti-mouse IgG (goat polyclonal) | Invitrogen | RRID:AB_2533947 | (1:5000) |
| antibody | anti-LigB1-7 (mouse monoclonal) | this lab | (1:500) | |
| antibody | anti-LigB7-12 (mouse monoclonal) | this lab | (1:500) | |
| antibody | HRP-conjugated anti-hamster IgG goat polyclonal) | KPL | https://www.seracare.com/products/kpl-antibodies-and-conjugates/secondary-antibodies/anti-hamster-igg--h-l--antibody/ | (1:1000) |
| antibody | HRP-conjugated anti-hamster IgM goat polyclonal) | SouthernBiotech | https://www.southernbiotech.com/?catno=6060-05&type=Polyclonal | (1:1000) |
| antibody | FITC-conjugated anti-mouse IgG (goat polyclonal) | ThermoFisher Scientific | RRID:AB_2533946 | (1:1000) |
| antibody | isotypic control IgG (mouse Fc fragment) | ThermoFisher Scientific | RRID:AB_10959891 | |
| strain, strain background (Leptospira biflex) | Leptospira biflex | other | Colony maintained in Dr. Chang's lab | |
| strain, strain background (L. interrogans) | Leptospira interrogans serovar Pomona | this lab | Colony maintained in Dr. Chang's lab | |
| strain, strain background (L. interrogans) | Leptospira interrogans serovar Manilae M1307 | other | Colony maintained in Dr. Gerald Murray and Dr. Ben Adler's labs, provided as a gift | |
| biological sample (Homo sapiens sapiens) | Normal human serum | ImmunoReagents | ImmunoReagents: SP-001-VX10 | |
| biological sample (Mesocricetus auratus) | Golden Syrian Hamster | Harlan Sprague Dawley Laboratory | 5 weeks old at initial subcutaneous vaccination | |
| chemical compound, drug | Adjuvant 2% Alhydrogel | InvivoGen |
Additional files
-
Transparent reporting form
- https://doi.org/10.7554/eLife.30051.027
Download links
A two-part list of links to download the article, or parts of the article, in various formats.
Downloads (link to download the article as PDF)
Open citations (links to open the citations from this article in various online reference manager services)
Cite this article (links to download the citations from this article in formats compatible with various reference manager tools)
Extended low-resolution structure of a Leptospira antigen offers high bactericidal antibody accessibility amenable to vaccine design
eLife 6:e30051.
https://doi.org/10.7554/eLife.30051


