Control of plant cell fate transitions by transcriptional and hormonal signals
- University of Heidelberg, Germany
- Heidelberg University, Germany
- University of California, San Diego, United States
Figures
Figure 1
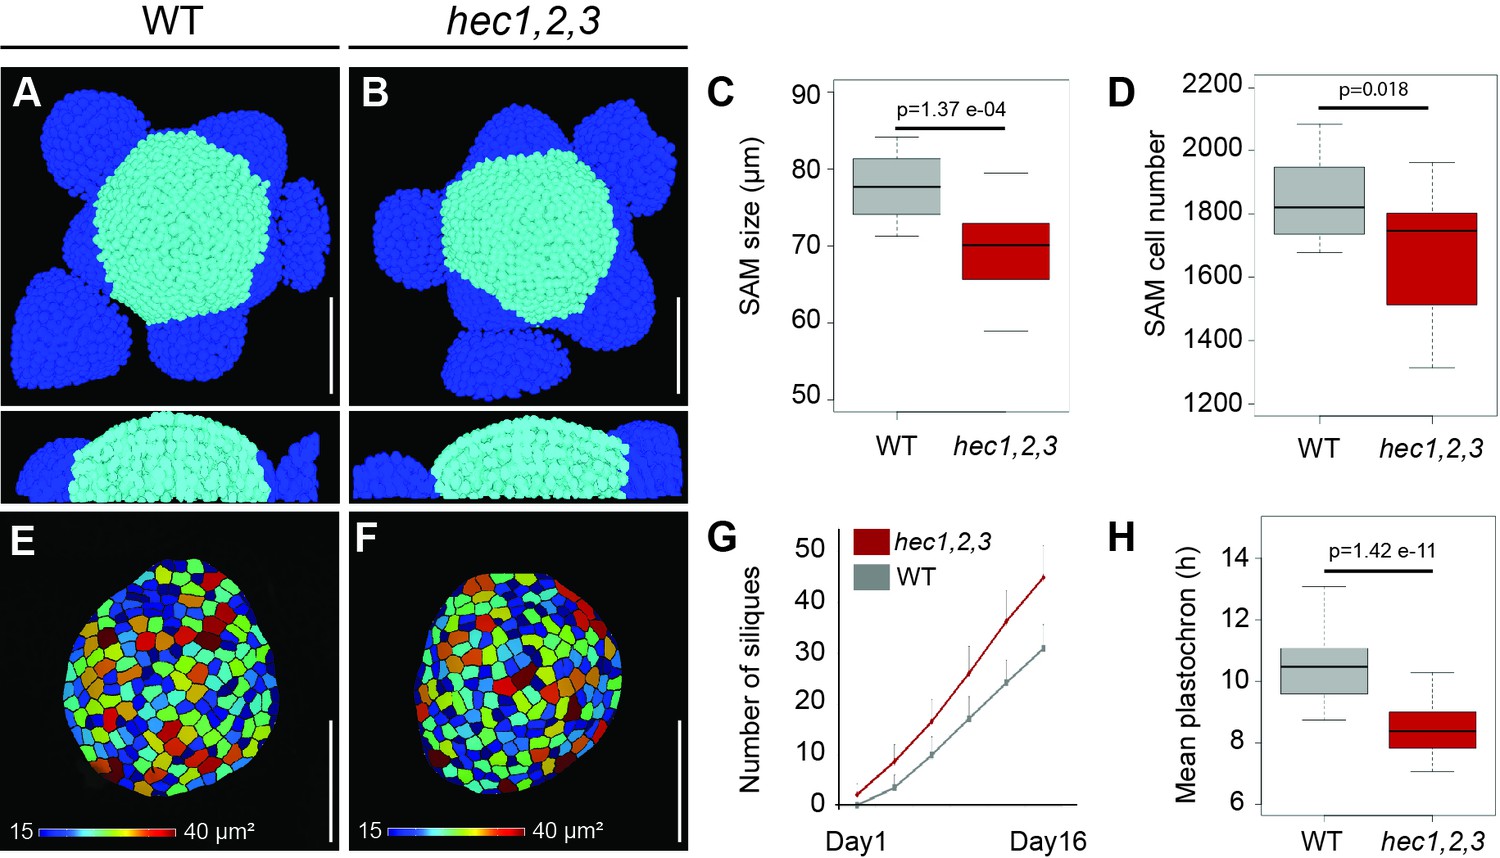
SAM size and organ initiation rate are uncoupled in hec1,2,3.
(A–B) Representative views of 3D-reconstructed shoot meristems after nuclei segmentation from WT (A) and hec1,2,3 (B). Light blue: SAM cells; dark blue: primordia cells. (C) Shoot apical meristem size at 28 days after germination (DAG) (n = 15) (D) Quantification of SAM cell number in WT (n = 19) and hec1,2,3 (n = 21). (E–F) Representative cell area of segmented L1 layer from WT (E) and hec1,2,3 (F) SAM (n > 3) (G) Cumulated number of siliques over time in WT (n = 46) and hec1,2,3 (n = 42). (H) Mean inflorescence plastochron in WT (n = 46) and hec1,2,3 (n = 42). Scale bars: 50 µm. Statistical test: Student t- test (C,H), Wilcoxon signed-ranked test (D).
-
Figure 1—source data 1
SAM size quantification (panel C);
SAM cell number quantification (panel D); Quantification silique number (panel G); Mean plastochron quantification (panel H).
- https://doi.org/10.7554/eLife.30135.004
Figure 2 with 6 supplements
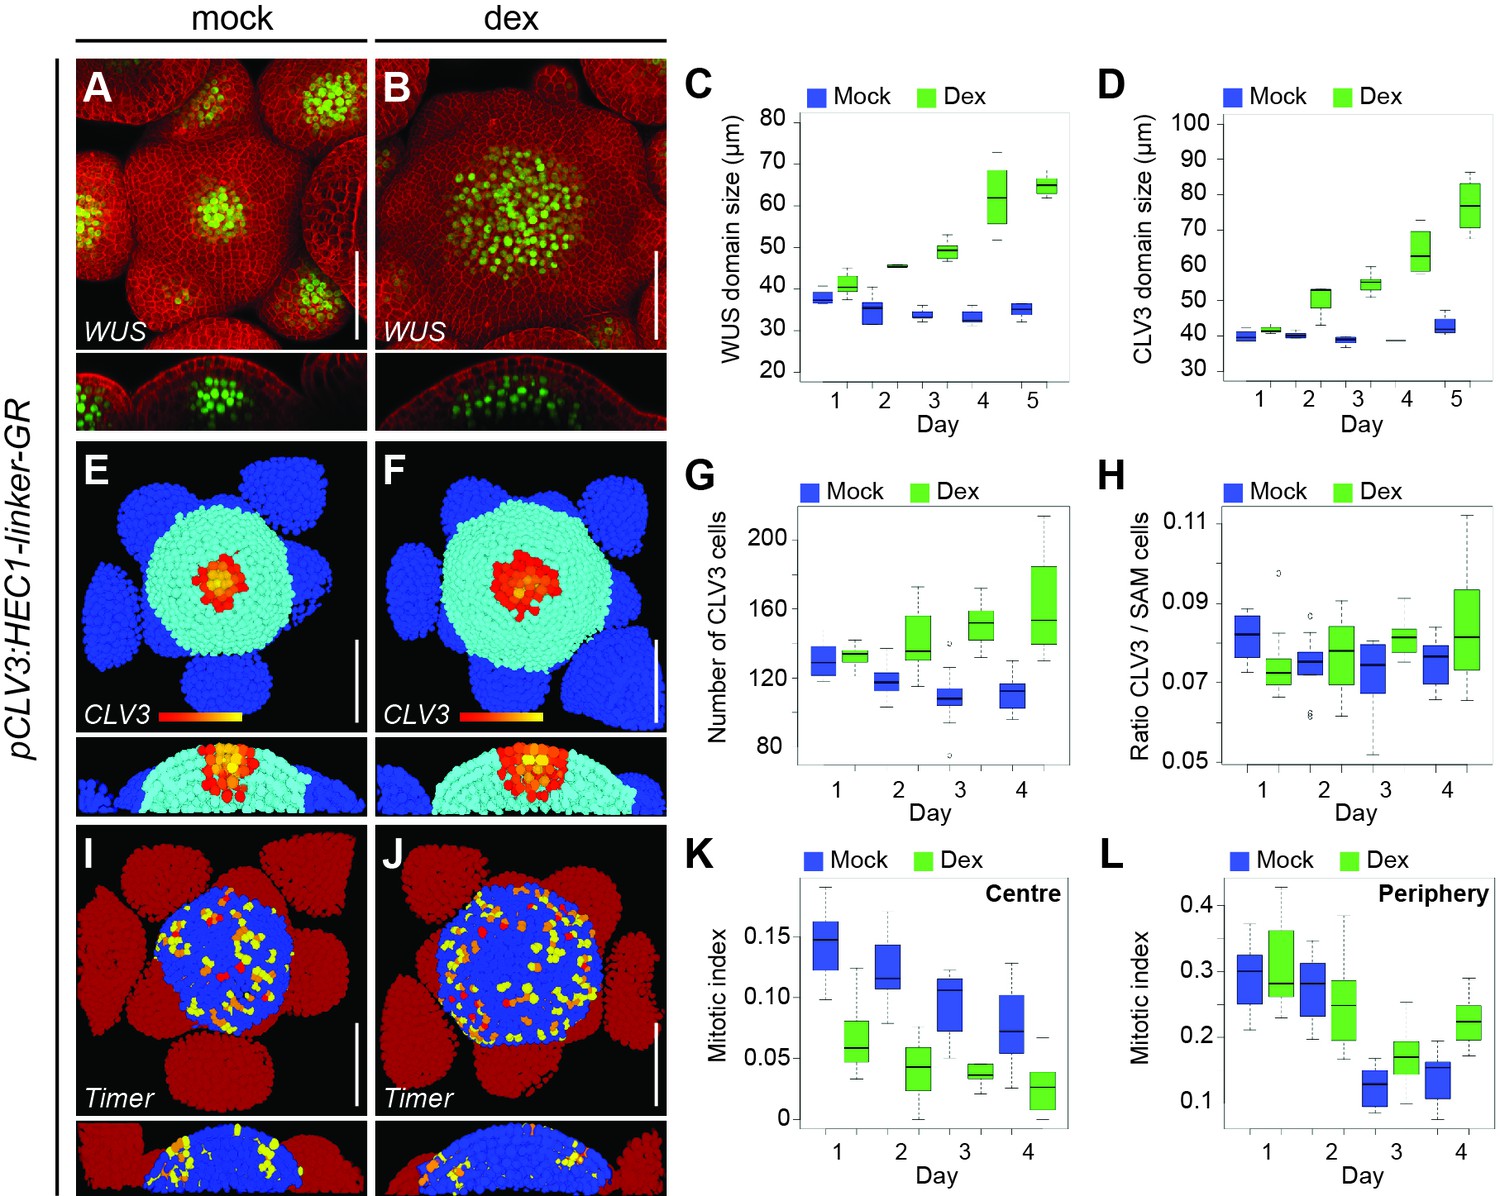
HEC function controls CZ to PZ fate transition.
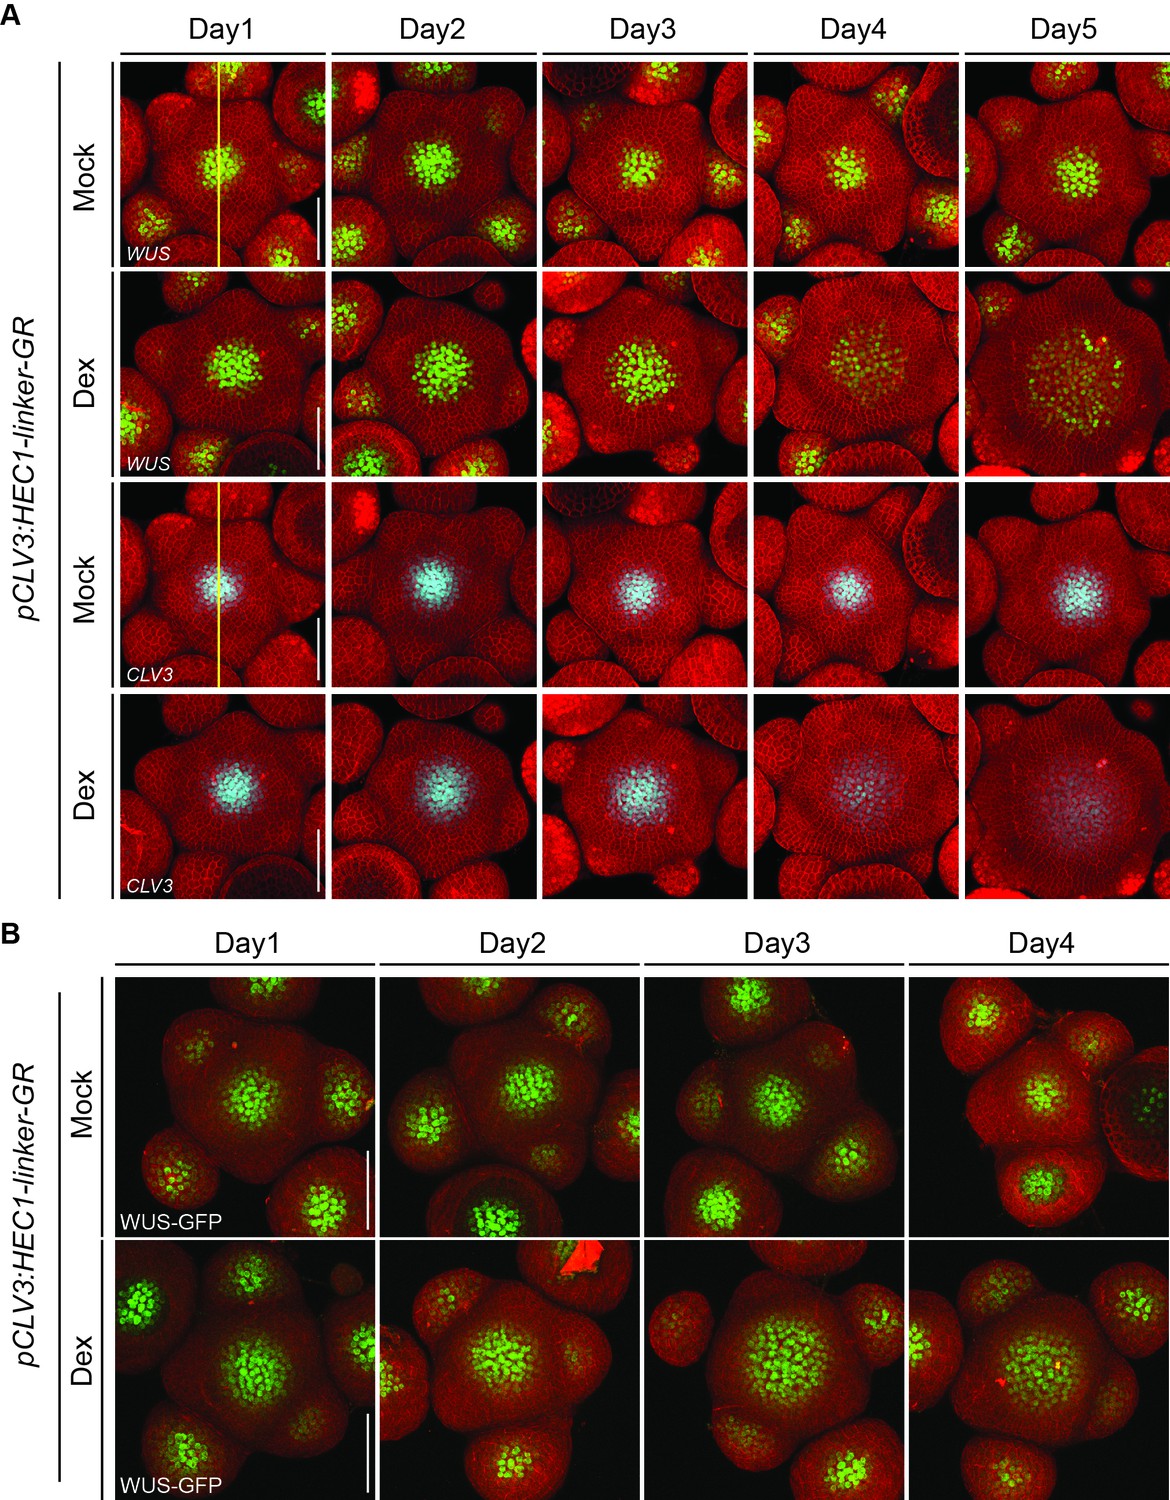
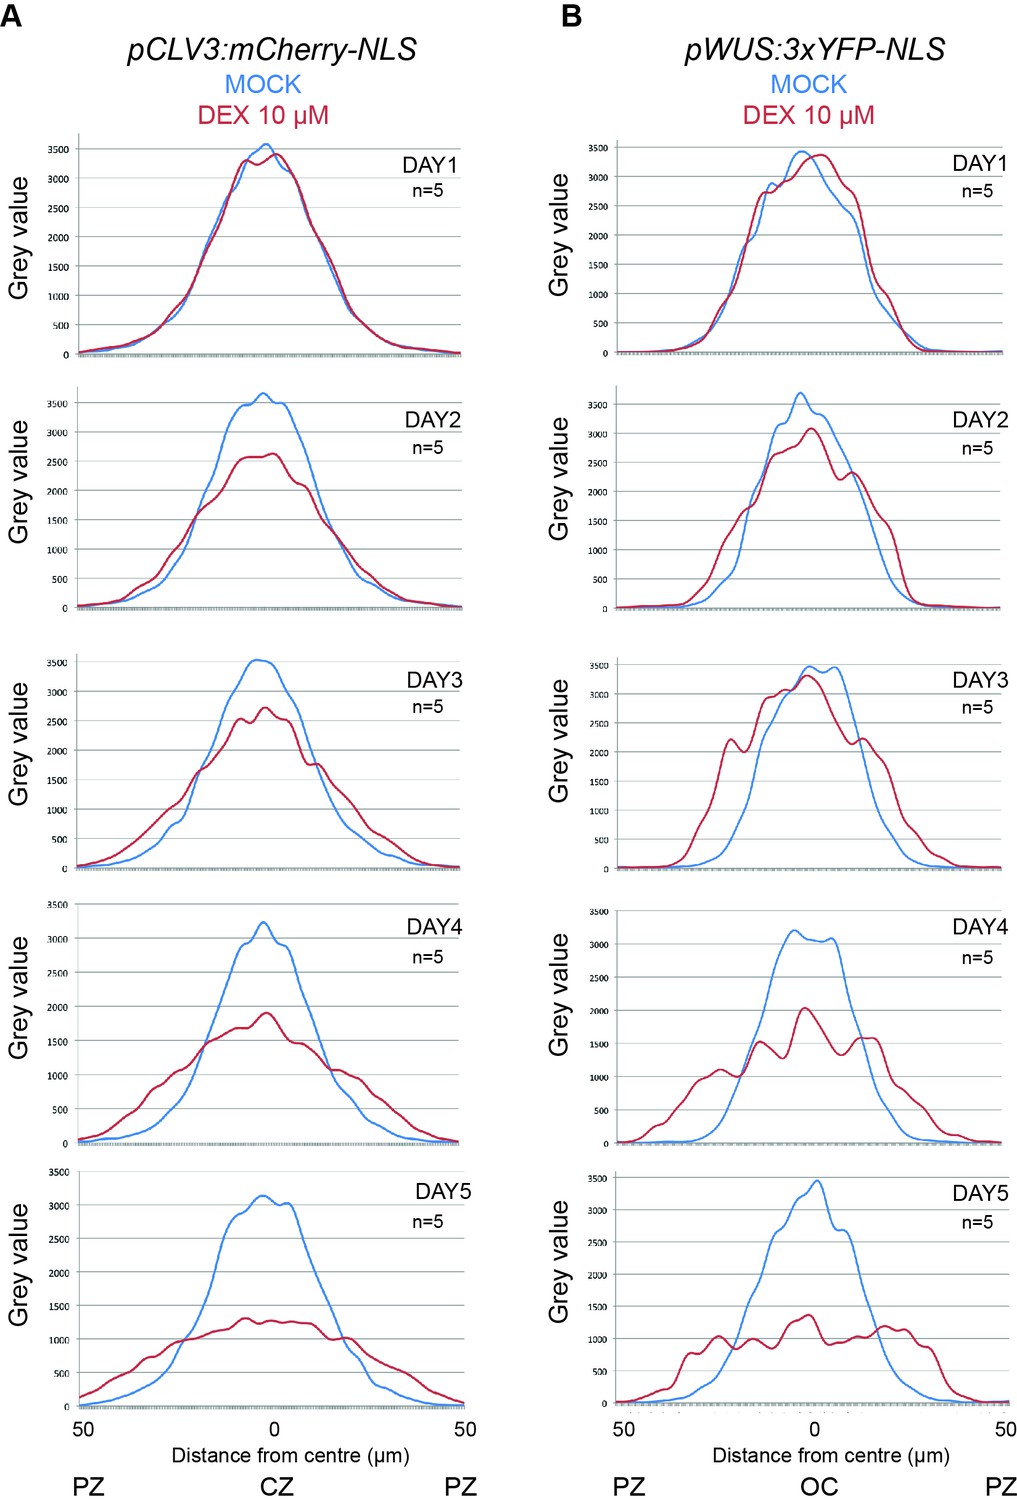
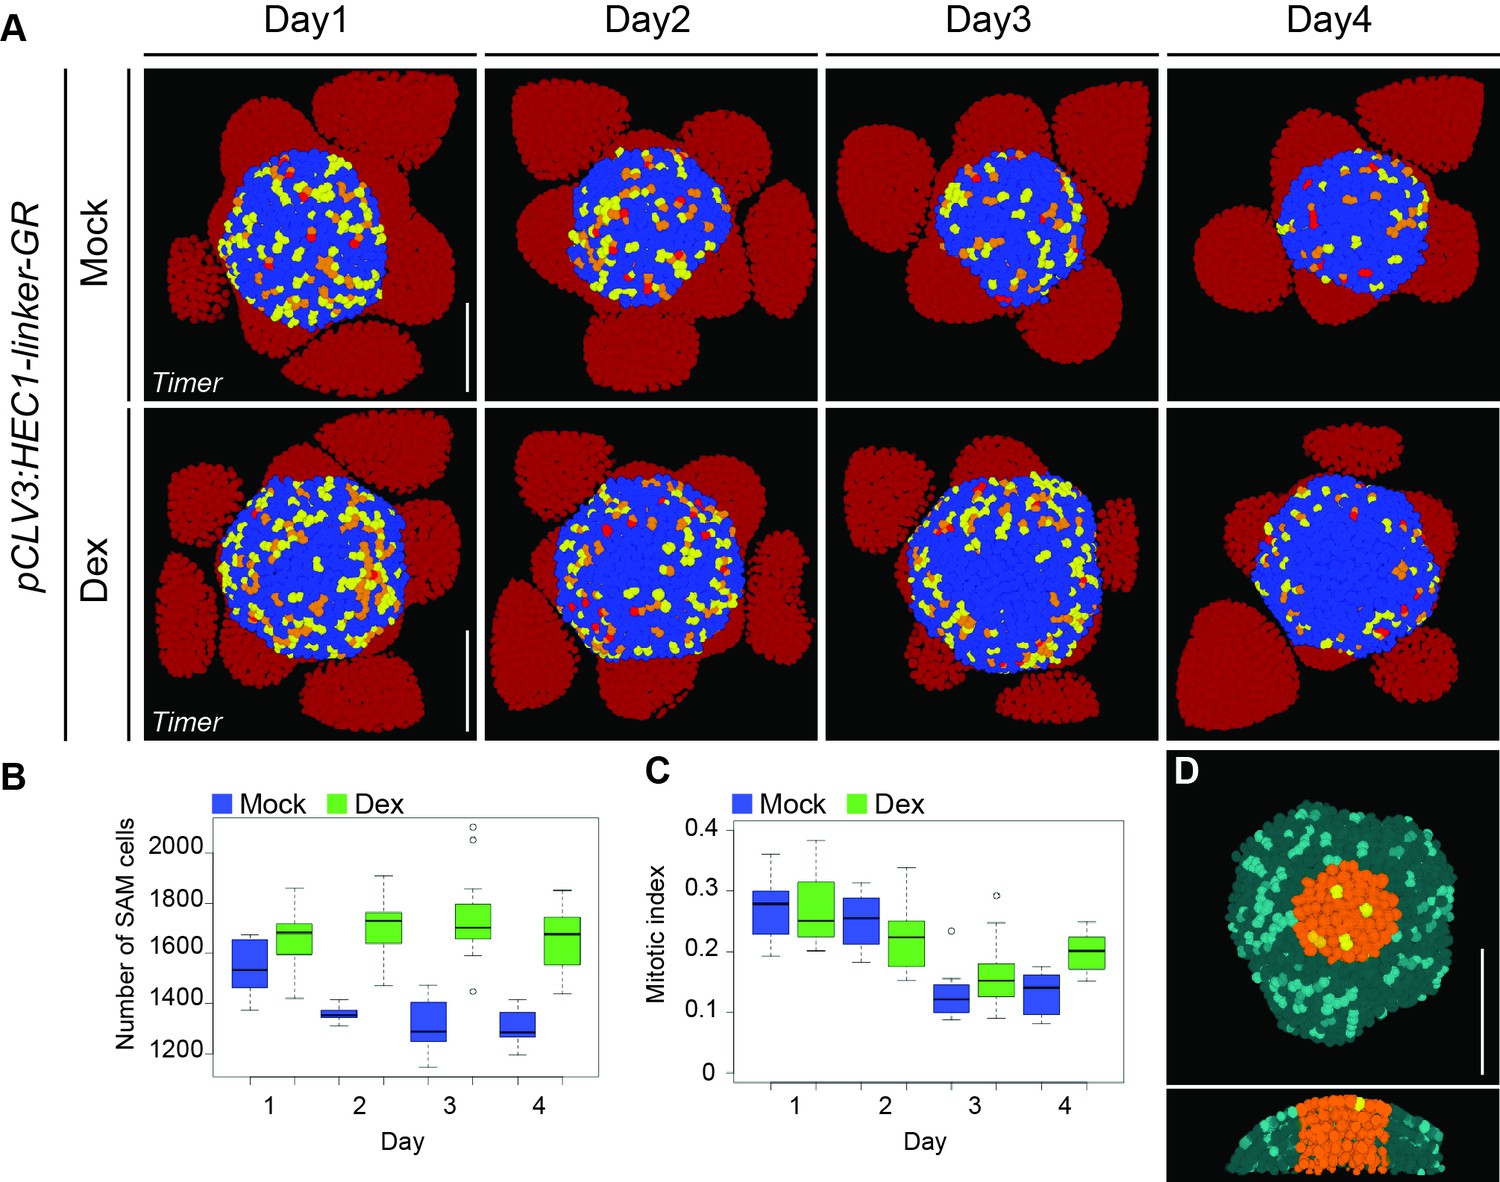
(A–B) Representative expression of pWUS:3xYFP-NLS in SAMs of pCLV3:HEC1-linker-GR plants four days after mock (A) or dex (B) treatment. (C–D) Development of WUS (C) and CLV3 (D) domain sizes in pCLV3:HEC1-linker-GR SAMs after mock or dex treatment. (E–H) Analysis of pCLV3:mCherry-NLS expression after image segmentation. Representative images of segmented SAMs four days after mock (E) or dex (F) treatment of pCLV3:HEC1-linker-GR plants. Yellow, orange, red highlight CLV3 positive cells. Quantification of CLV3 positive cell number (G) and ratio between CLV3 and total SAM cell number (H) after mock or dex treatment (n > 9 per condition). (I–J) Cell proliferation (pKNOLLE:mFluorescentTimer-NLS) in pCLV3:HEC1-linker-GR plants two days after mock (I) or dex (J) treatment. Red, orange, yellow: recently divided cells, blue: older cells; dark red: primordia (n > 7 per condition). (K–L) Time series quantification of mitotic index (young dividing cells/total cell number) at the centre (K) or at the periphery (L) of the SAM in pCLV3:HEC1-linker-GR/pKNOLLE:fast-mFluorescentTimer-NLS after mock or dex treatment. Scale bar: 50 µm.
-
Figure 2—source data 1
Intensity plot profiles: pWUS:3xYFP-NLS (panel C).
Intensity plot profiles: pCLV3:mCherry-NLS (panel D); CLV3 cell number quantification (panel G); Ratio CLV3/SAM cells: pCLV3:HEC1-linker-GR (Figure 2H); Mitotic index CZ quantification (panel K); Mitotic index PZ quantification (panel L).
- https://doi.org/10.7554/eLife.30135.012
-
Figure 2—source data 2
SAM size measurement pCLV3:HEC1-linker-GR (Figure 2—figure supplement 2A);
SAM cell number quantification (Figure 2—figure supplement 6B); Mitotic index quantification (Figure 2—figure supplement 6C).
- https://doi.org/10.7554/eLife.30135.013
Figure 2—figure supplement 1
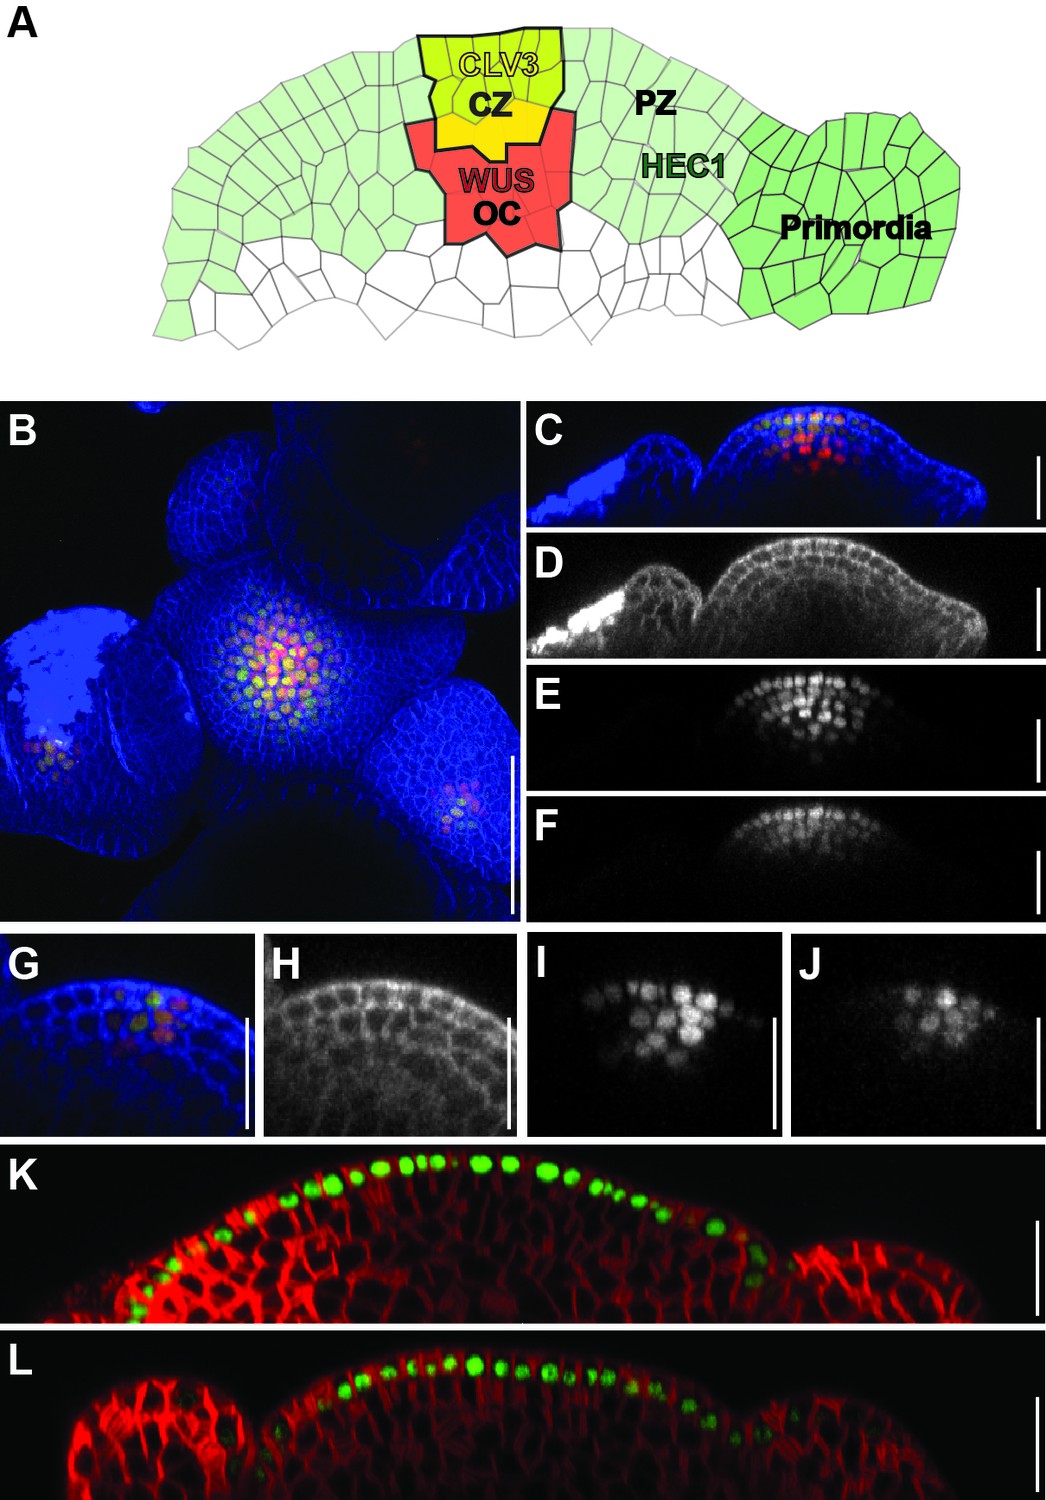
HEC1-linker-GFP protein mobility in the SAM.
(A) Schematic representation of the SAM with CLV3 (yellow), WUS (red) and HEC1 (green) mRNA expression pattern. Central zone (CZ, yellow), organising centre (OC, red), peripheral zone (PZ, light green) and primordia (dark green) domains are also decpicted. (B–F) Representative view of axillary meristem before fasciation expressing pCLV3:HEC1-linker-GFP and pCLV3:3xmCherry-NLS (n = 4). Top view of the merged channels (B), side view of the merged (C), blue (D), red (E) and green (F) channels. (G–J) Representative views of flower stage three expressing pCLV3:HEC1-linker-GFP and pCLV3:3xmCherry-NLS. Merged (G), blue (H), red (I), green (J) channels. (K–L) Side view of shoot meristem expressing pML1:2xGFP-NLS (K) and pML1:HEC1-linker-GFP (L). Scale bar: 50 µm (A), 20 µm (B–K).
Figure 2—figure supplement 2
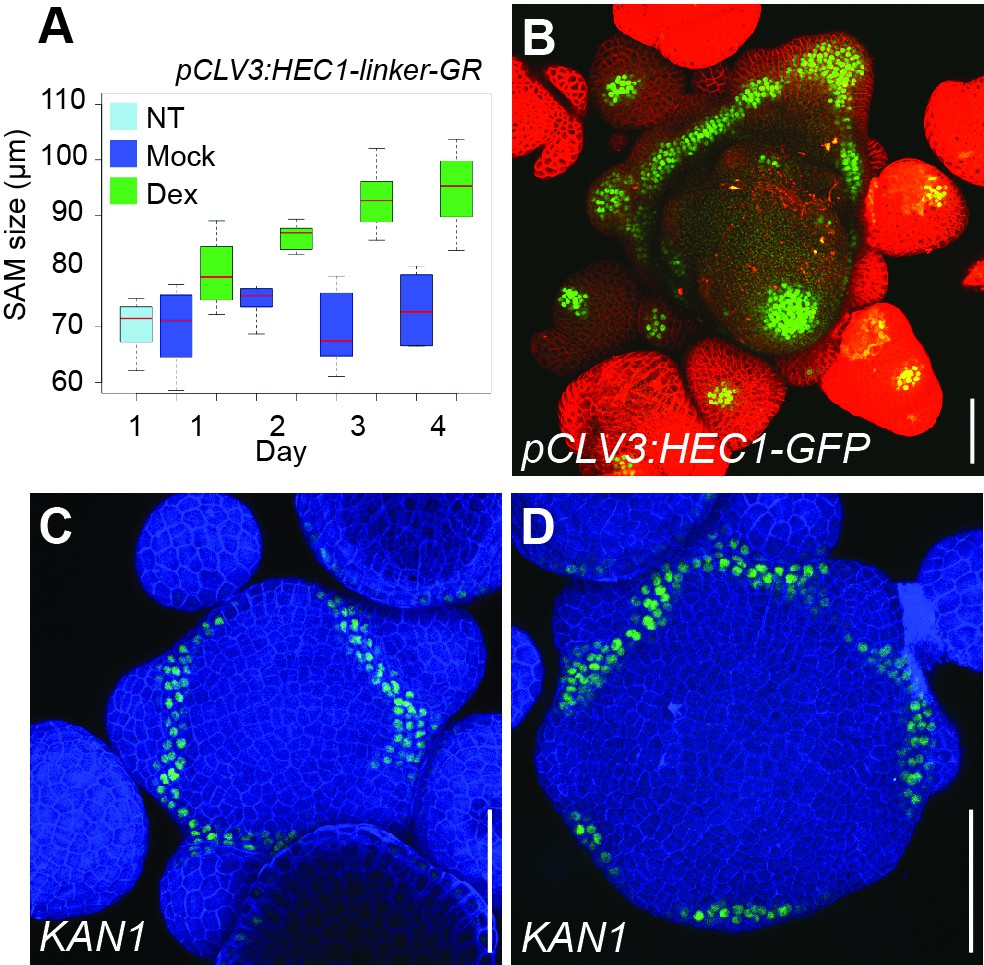
SAM behavior after promoting of HEC function at the CZ.
(A) Development of individual pCLV3:HEC1-linker-GR SAM size after mock or dex treatment (n > 6 per condition). (B) Representative view of pCLV3:HEC1-linker-GFP SAM 30 DAG. (C–D) Representative views of pCLV3:HEC1-linker-GR SAM expressing pKAN1:GFP-KAN1 after mock (C) or dex (D) treatment (n = 2) Scale bar: 50 µm.
Figure 2—figure supplement 3
Dynamics of WUS and CLV3 reporters after HEC1-GR induction at the CZ.
(A) Development of individual pCLV3:HEC1-linker-GR shoot meristems expressing pCLV3:mCherry-NLS and pWUS:3xYFP-NLS after mock or dex induction. pWUS:3xYFP-NLS (green) marks the OC whereas pCLV3:mCherry-NLS (Cyan) marks the CZ (n = 5 per condition). Yellow line: ROI used for measuring intensity plot profiles (B) Development of individual pCLV3:HEC1-linker-GR/wus-1/pWUS:WUS-linker-GFP shoot meristems after mock or dex treatment (n > 6). Scale bar: 50 µm.
Figure 2—figure supplement 4
Intensity plot profiles of WUS and CLV3 reporters after HEC1-GR induction at the CZ.
(A–B) Time series of intensity plot profiles in pCLV3:HEC1-linker-GR plants expressing pCLV3:mCherry-NLS and pWUS:3xYFP-NLS. The plots show the distribution of CLV3 signal (A) and WUS signal (B) in shoot meristems after mock and dex treatment.
Figure 2—figure supplement 5

Time series of 3D-reconstructed pCLV3:HEC1-linker-GR shoot meristems expressing pCLV3:mCherry-NLS/UBQ10:3xGFP-NLS after mock or dex induction.
Yellow, orange and red: CLV3 positive cells; light blue: PZ cells; dark blue: primordia. Note the progressive increase in the SAM and the CZ size after dex treatment. (n > 9 per condition). Scale bar: 50 µm.
Figure 2—figure supplement 6
Dynamics of the SAM proliferative activity after HEC1-GR induction at the CZ.
(A) Time series of 3D-reconstructed pCLV3:HEC1-linker-GR shoot meristems expressing pKNOLLE:fast-mFluorescentTimer-NLS after mock or dex treatment. Bright red, orange, yellow: young dividing cells; blue: older cells; dark red: primordia cells. Note that most cell division activity is detected at the peripheral zone (n > 7 per condition). (B) Development of the total SAM cell number in pCLV3:HEC1-linker-GR/pKNOLLE:fast-mFluorescentTimer-NLS SAM after mock (blue) or dex (green) treatment. (C) Time series quantification of mitotic index (young dividing cells/total SAM cells) in pCLV3:HEC1-linker-GR/pKNOLLE:fast-mFluorescentTimer-NLS after mock (blue) or dex (green) treatment. (D) 3D-segmented view of shoot meristem expressing pKNOLLE:fast-mFluorescentTimer-NLS and pUBQ10:3xGFP-NLS. The central domain (orange) and the periphery (cyan) of the SAM were quantified independently. Scale bar: 50 µm.
Figure 3 with 1 supplement
HEC function controls PZ to organ primordia fate transition.
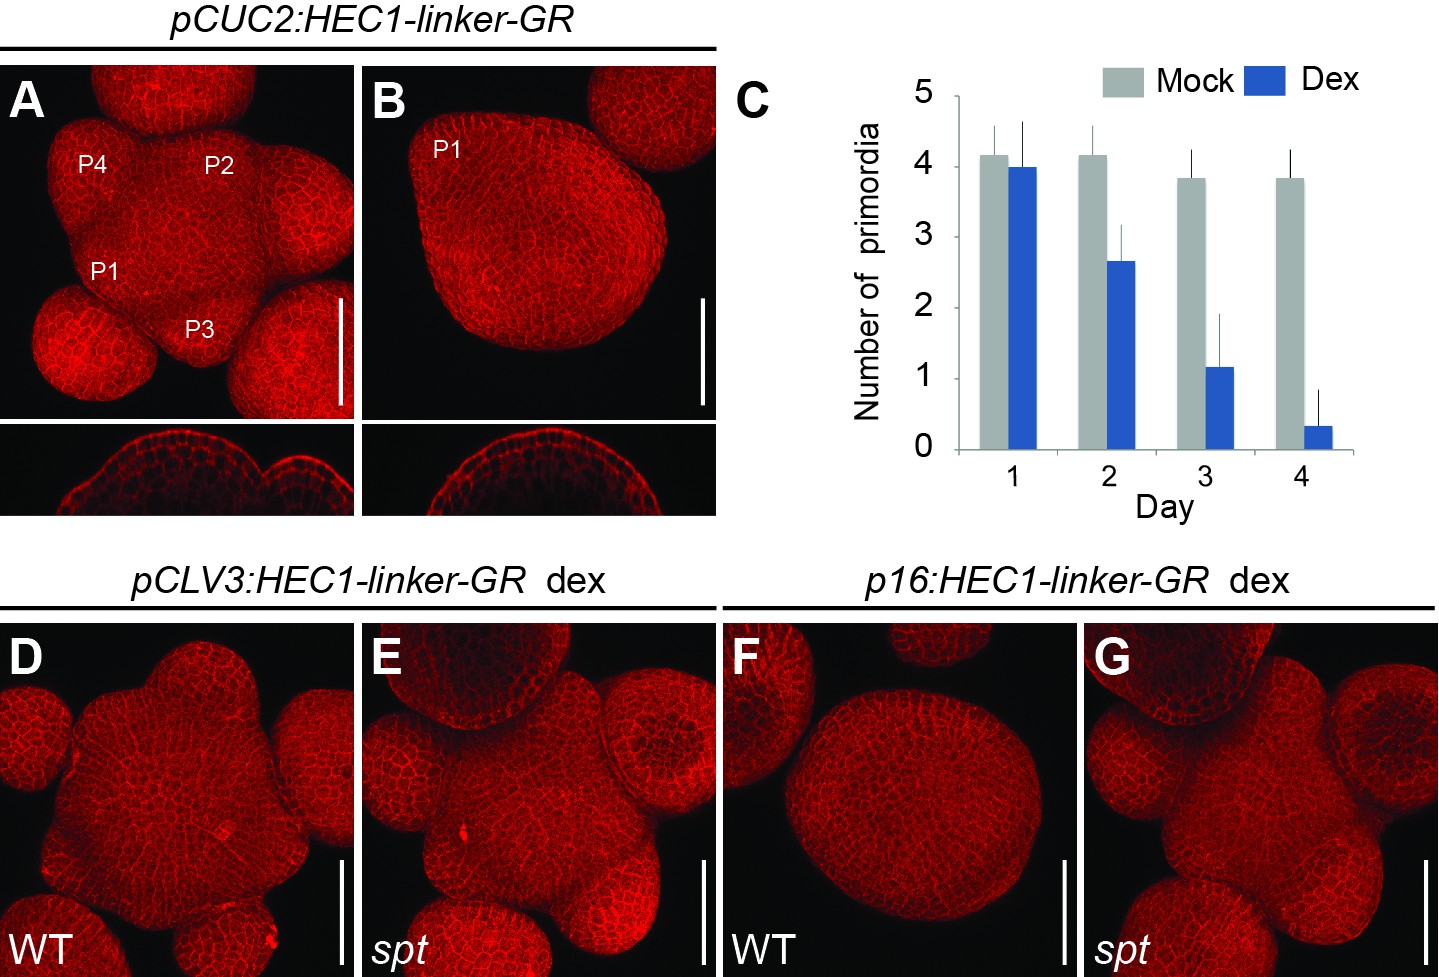
(A–B) Representative images of pCUC2:HEC1-linker-GR four days after mock (A) or dex treatment (B). (C) Quantification of primordia number formed in pCUC2:HEC1-linker-GR after mock and dex treatment over time (n = 6 per condition). (D–E) Representative view of pCLV3:HEC1-linker-GR four days after dex treatment in WT (D) or spt mutant background (E) (WT: n = 5; spt: n = 9). (F–G) Representative view of p16:HEC1-linker-GR four days after dex treatment in WT (F) or spt background (G) (WT: n = 6; spt: n = 10). Scale bar: 50 µm.
-
Figure 3—source data 1
Quantification primordia number (panel C).
- https://doi.org/10.7554/eLife.30135.016
Figure 3—figure supplement 1
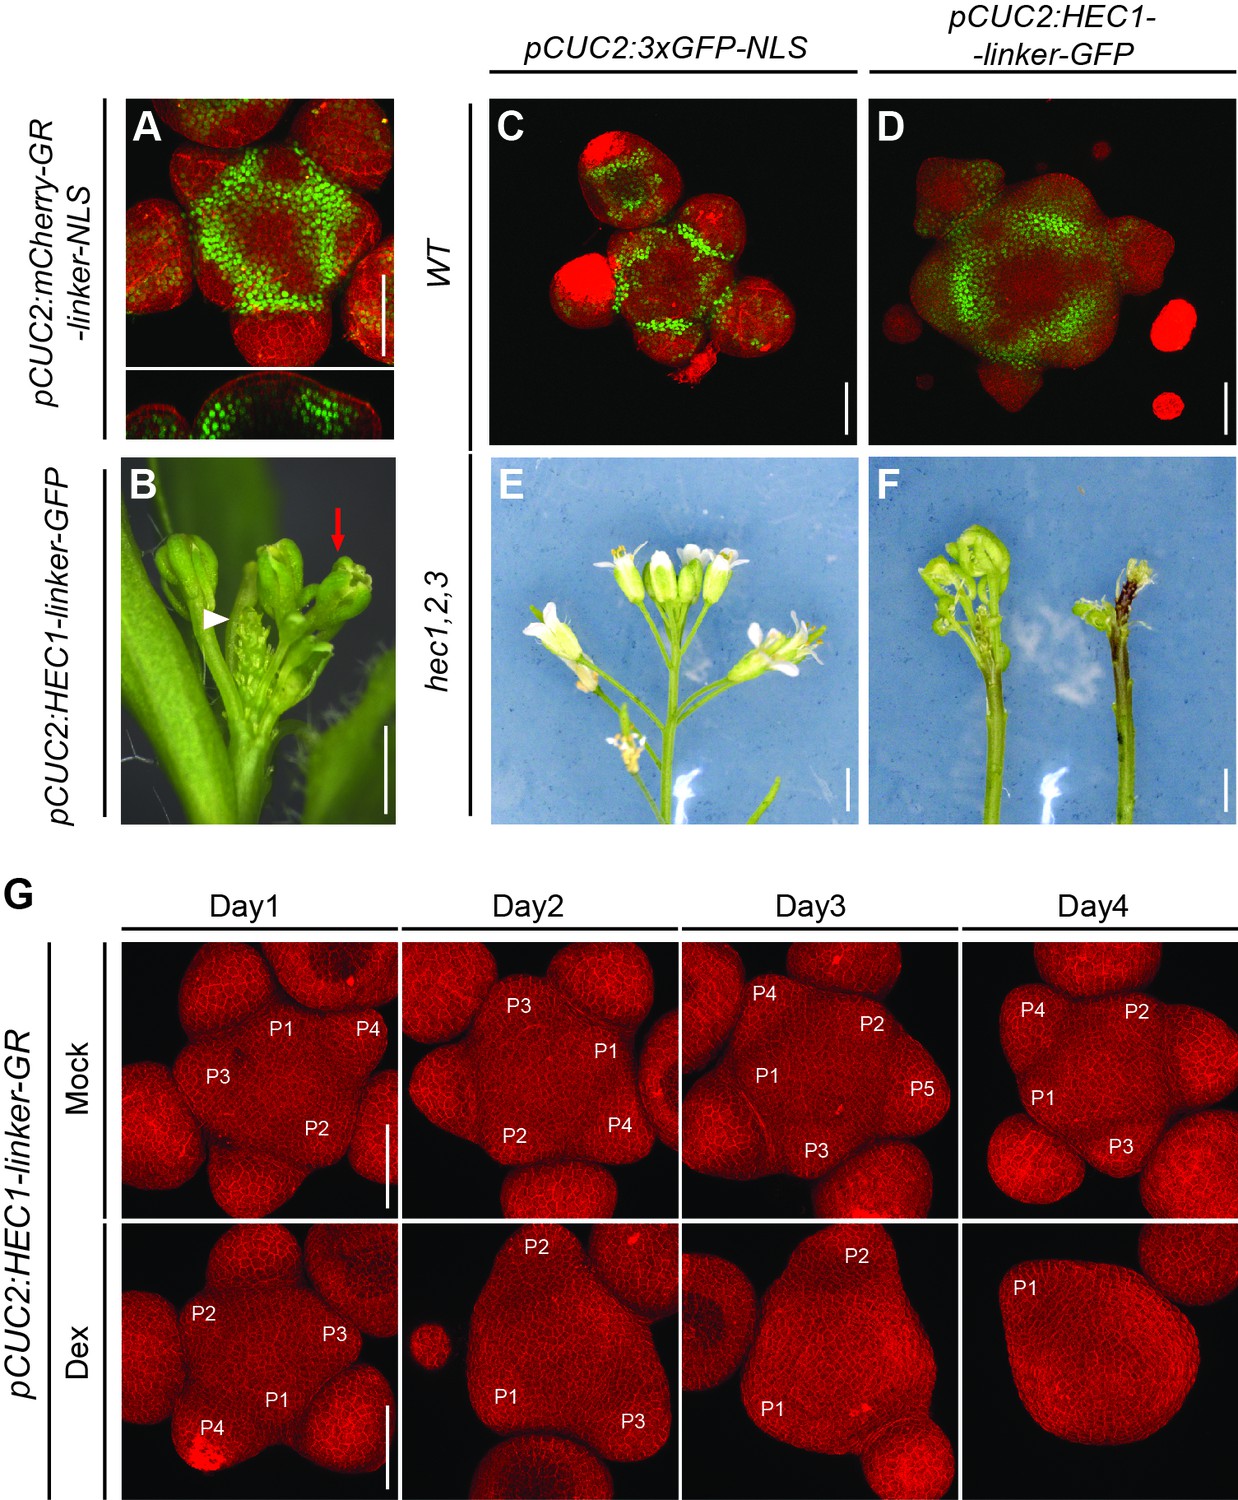
SAM behaviour after promoting HEC function at the PZ/BZ.
(A) Representative activity of pCUC2:mCherry-GR-linker-NLS in the shoot meristem (n > 3). Green signal marks mCherry-NLS. (B) pCUC2:HEC1-linker-GFP inflorescence 30 DAG (n > 30). Note the pin-like inflorescence (white triangle) and flower morphological defects (red arrow). (C) Shoot meristem expressing pCUC2:3xGFP-NLS 28 DAG (n > 5). GFP signal marks the boundary zone. (D) Shoot meristem expressing pCUC2:HEC1-linker-GFP 28 DAG (n > 10). Note the enlargement the SAM and early defects in flower primordia formation. (E–F) hec1,2,3 inflorescences expressing pCUC2:3xGFP-NLS (E) or pCUC2:HEC1-linker-GFP (F). (G) Time series of individual pCUC2:HEC1-linker-GR SAM after mock or dex treatment. Note the progressive inhibition of flower primordia initiation (n = 6 per condition). Scale bars: 1 mm (A), 50 µm (B–D).
Figure 4 with 1 supplement
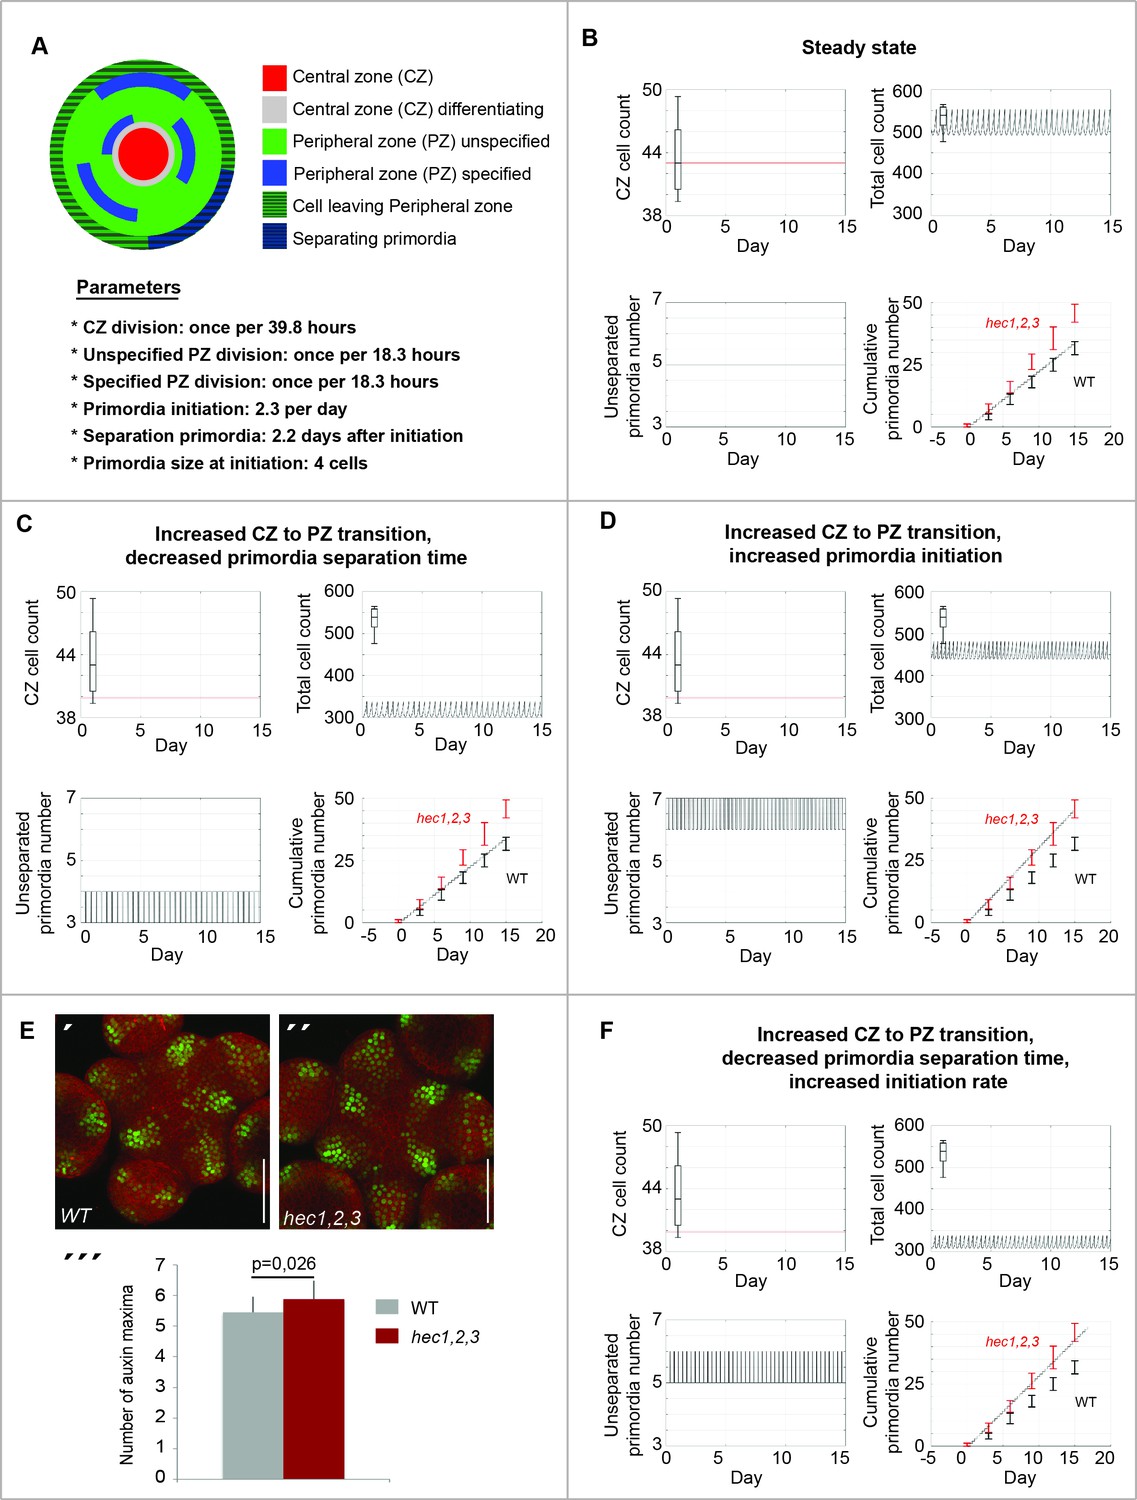
HEC genes control cell differentiation dynamics in the SAM.
Computational simulations displaying in silico estimation (line) and observed in vivo quantification (boxes) for CZ cell number, total cell number, CZ/total cell ratio, number of unseparated primordia and cumulative number of primordia. (A) Description of computational model. (B) Calibration of SAM model. (C–D) Simulation of HEC loss-of function on SAM cell behaviour. (C) Effects caused by increasing cell differentiation between CZ and PZ and decreasing primordia separation time. (D) Simulation of effects caused by increasing CZ to PZ transition and increasing primordia initiation rate. (E) Analysis of pDR5v2:3xYFP-NLS in WT (´) and hec1,2,3 (´´) SAMs. (´´´) Quantification of auxin maxima in WT (n = 20) and hec1,2,3 (n = 17). (F) Simulation of effects caused by increasing CZ to PZ transition, increasing primordia initiation rate and decreasing their separation time. Cell numbers in (B,C,D,F) refer to a single cellular layer and correspond to one third of the respective quantified cell numbers. Scale bar: 50 µm (E). Statistical test: Student t-test (E´´´).
-
Figure 4—source data 1
Quantification auxin maxima pDR5v2:3xYFP-NLS (panel E).
- https://doi.org/10.7554/eLife.30135.019
Figure 4—figure supplement 1
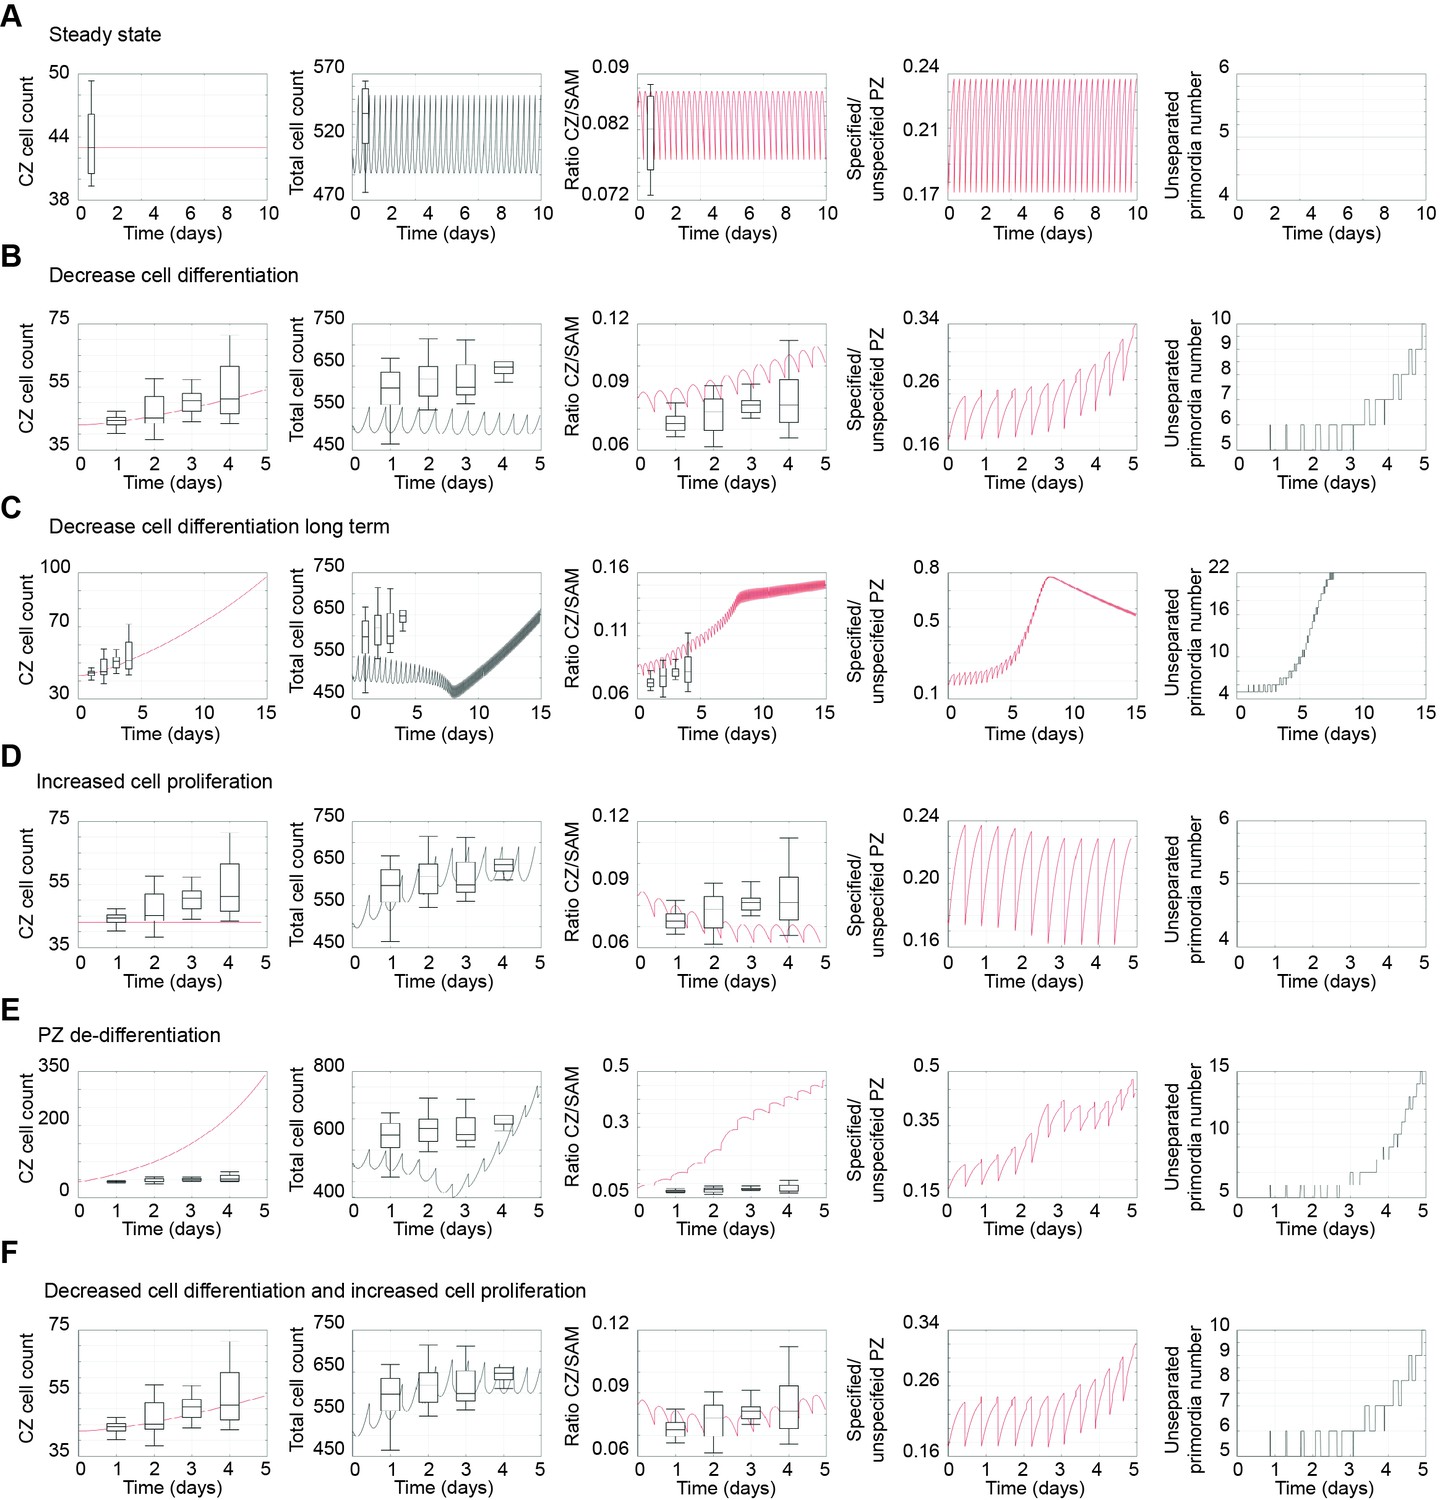
Computational model simulations.
(A–G) Model simulations displaying in silico estimation (line) and observed in vivo quantification (whisker box) for CZ cell count, total cell count, ratio CZ/total cell count, ratio specified PZ/unspecified PZ cells, and number of unseparated primordia. (A) Calibration of SAM model. (B–F) Simulation of changes in SAM behaviour by induction of pCLV3:HEC1-GR. (B) Short term effects caused by reducing cell differentiation between CZ and PZ alone. (C) Long term effects caused by reducing cell differentiation between CZ and PZ alone. Note the delay in the increase of the total cell count. (D) Simulation by increasing PZ proliferation rate by 10% alone. (E) Simulation of effects caused by promoting early PZ cell re-specification in CZ cells. (F) Changes caused by reducing cell differentiation between CZ and PZ and increasing PZ proliferation rate by 10%.
Figure 5 with 1 supplement
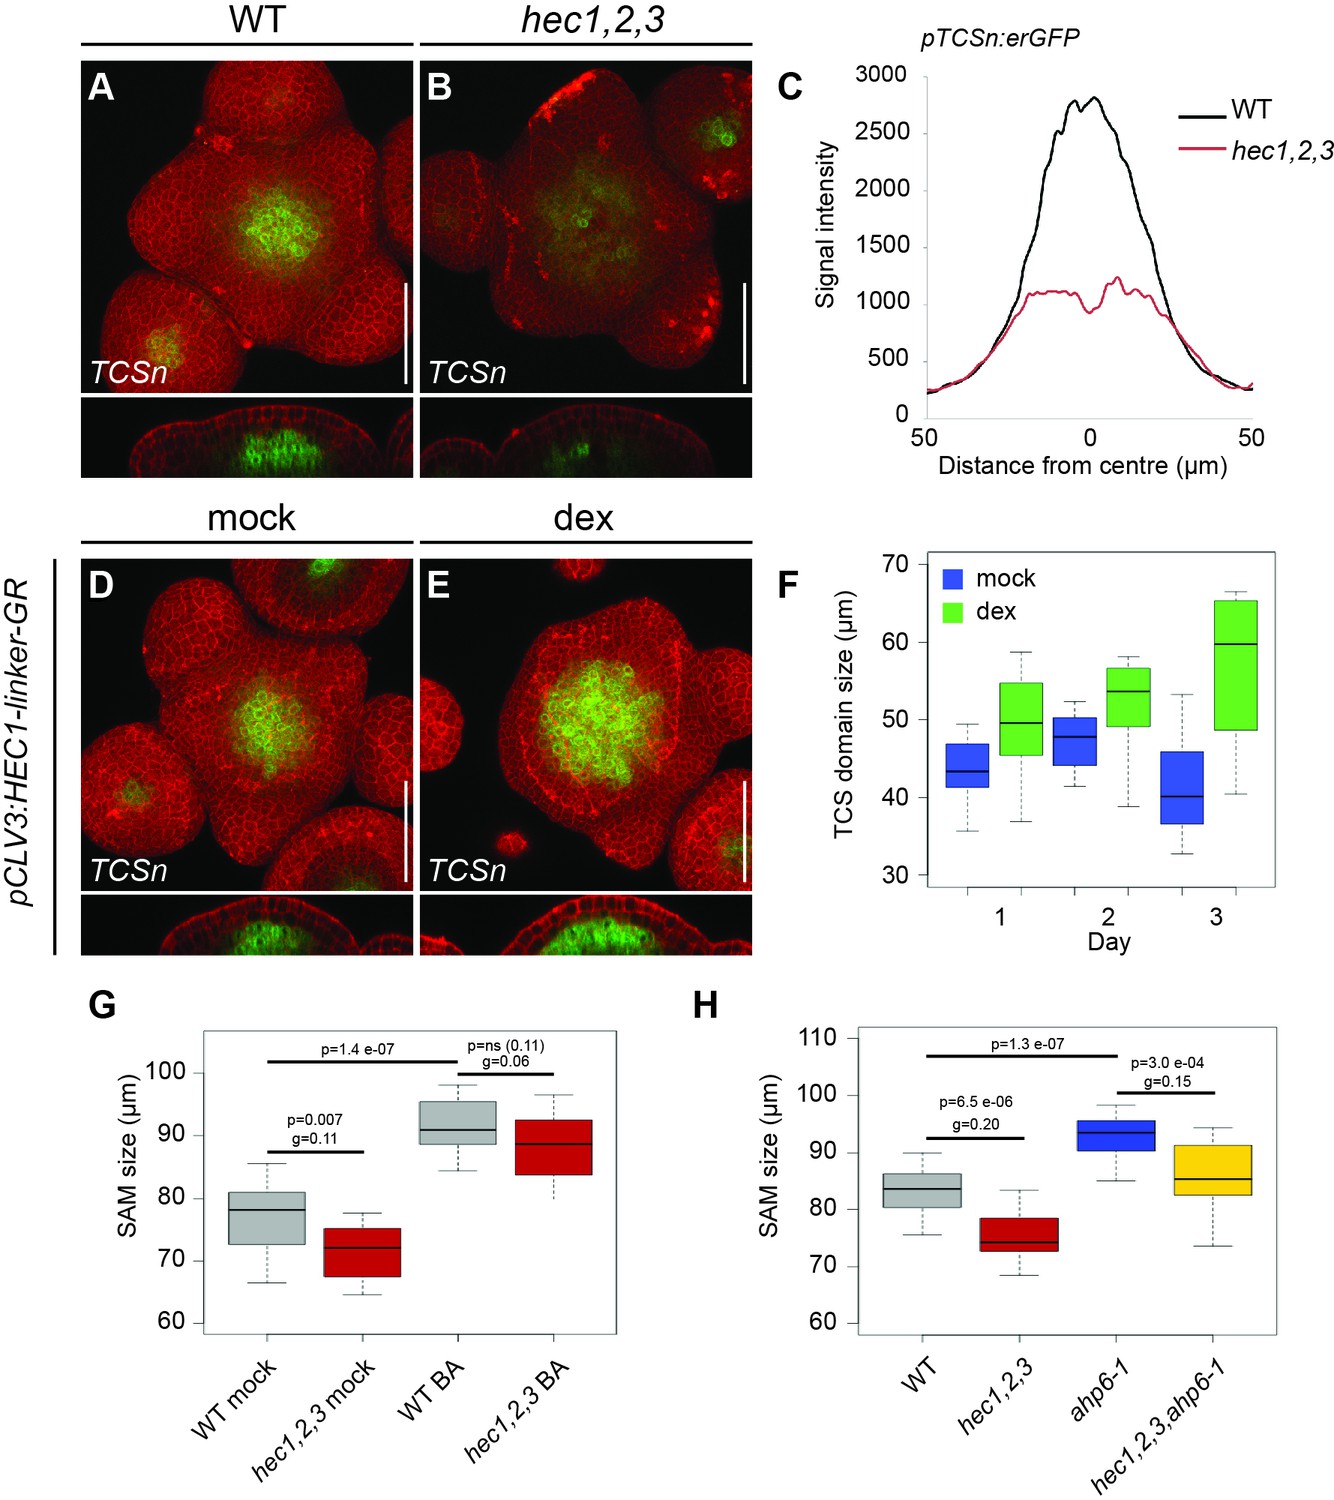
HEC genes promote cytokinin signalling.
(A–B) Representative expression of pTCSn:erGFP in WT (A) and hec1,2,3 (B) SAMs. (C) Average intensity plot profile of pTCSn:erGFP signal in WT and hec1,2,3 SAM (n > 14 per genotype). (D–F) Analysis of pTCSn:erGFP activity in response to pCLV3:HEC1-linker-GR induction. (D–E) Representative views of SAMs three days after mock (D) or dex treatment (E) (n > 6 per condition). (F) Development of TCS domain size after mock (blue) or dex (green) treatment. (G) Shoot meristem size after cytokinin treatment in WT (n > 13) and hec1,2,3 (n > 13) (H) Shoot meristem size after genetically modulating cytokinin signalling in WT (n > 14) and hec1,2,3 (n > 14). Statistical test: Student t-test; Effect size: Hedges´coefficient g (G,H). Scale bar: 50 µm.
-
Figure 5—source data 1
Intensity plot profiles pTCSn:erGFP (panel C);
TCS quantification plot profile (panel F); Source data also included for panels G and H.
- https://doi.org/10.7554/eLife.30135.022
Figure 5—figure supplement 1
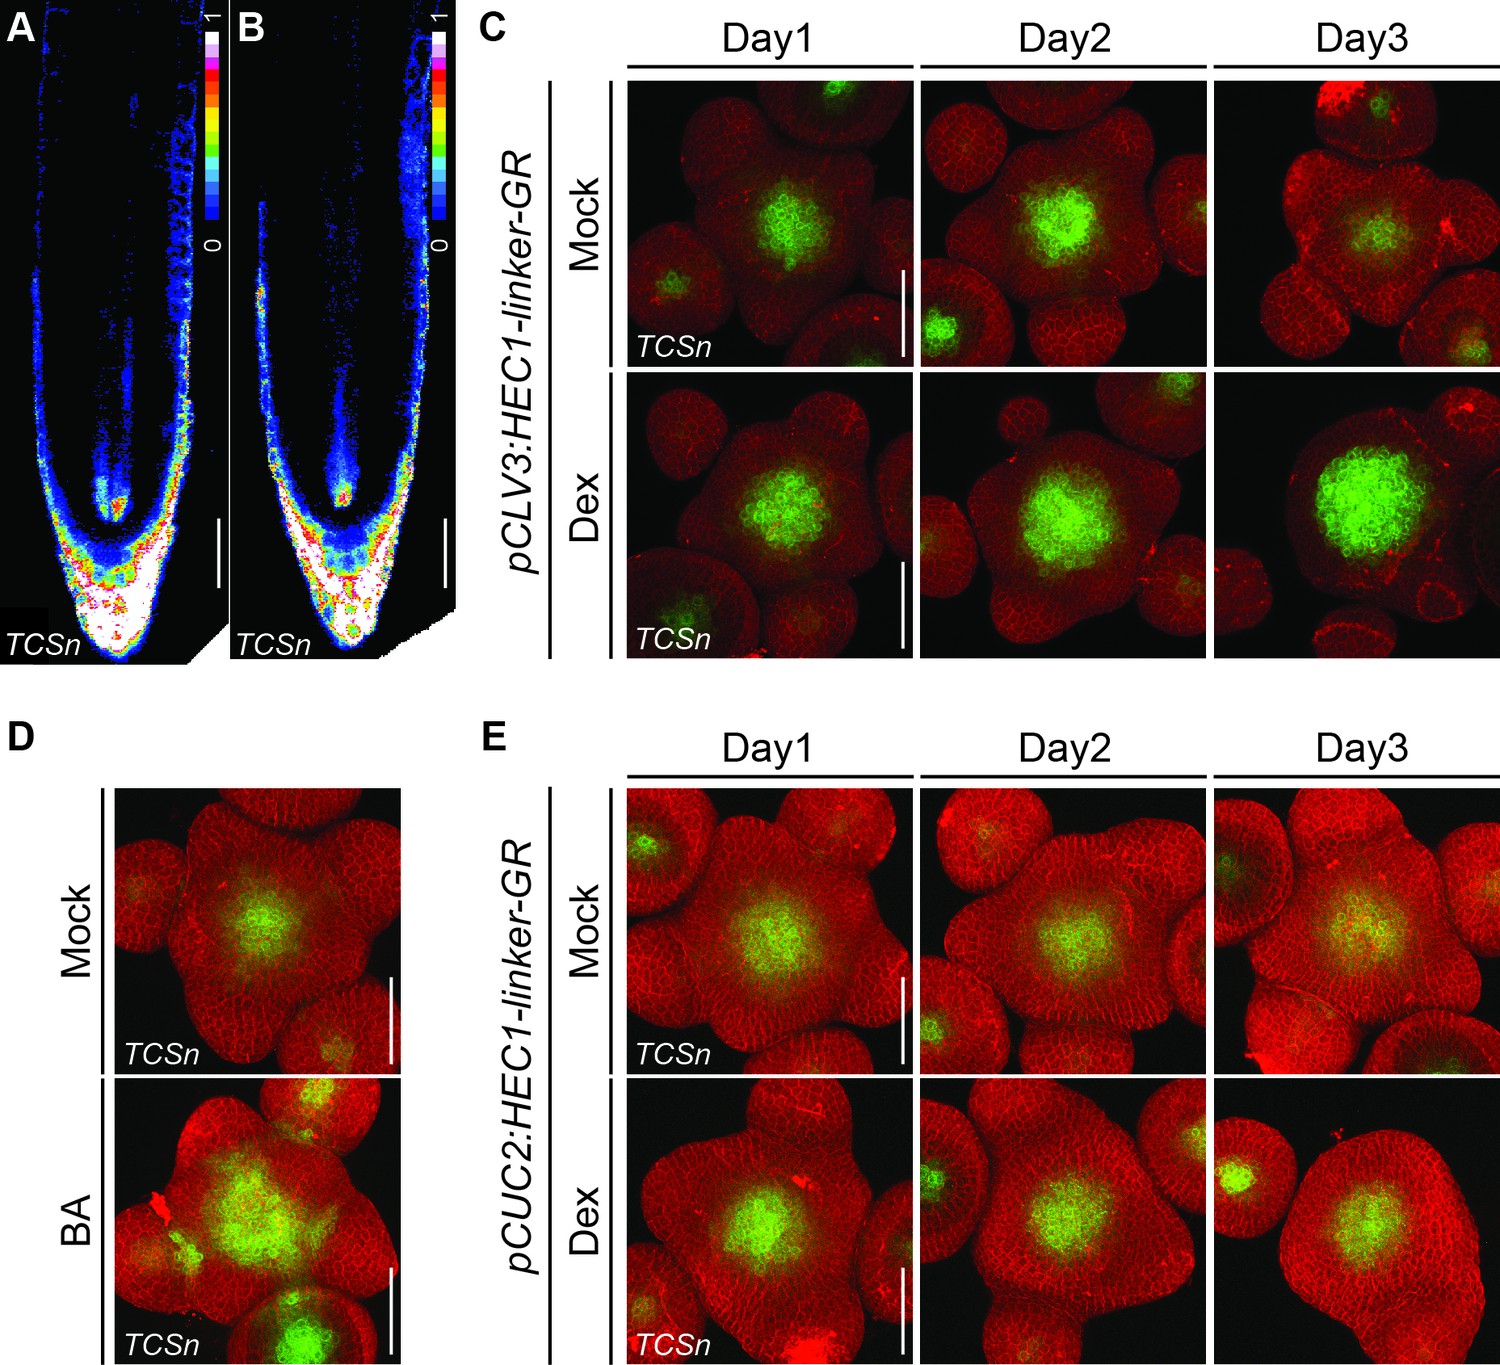
Dynamics of cytokinin responses after modulation of HEC function.
(A–B) Intensity based representation of root apical meristems expressing pTCSn:erGFP in WT (n = 5)(A) and hec1,2,3 (n = 10) (B). (C) Time series of individual pCLV3:HEC1-linker-GR shoot meristems expressing pTCSn:erGFP after mock or dex treatment. Note the progressive enlargement of the cytokinin-signalling domain in dex-treated plants (n > 6 per condition). (D) Cytokinin response (pTCSn:erGFP) in shoot meristems 24 hr after mock or 50 µM BA treatment (n > 7). (E) Time series of individual pCUC2:HEC1-linker-GR shoot meristems expressing pTCSn:erGFP after mock or dex treatment (n > 8 per conditions). Scale bar: 50 µm.
Figure 6 with 3 supplements
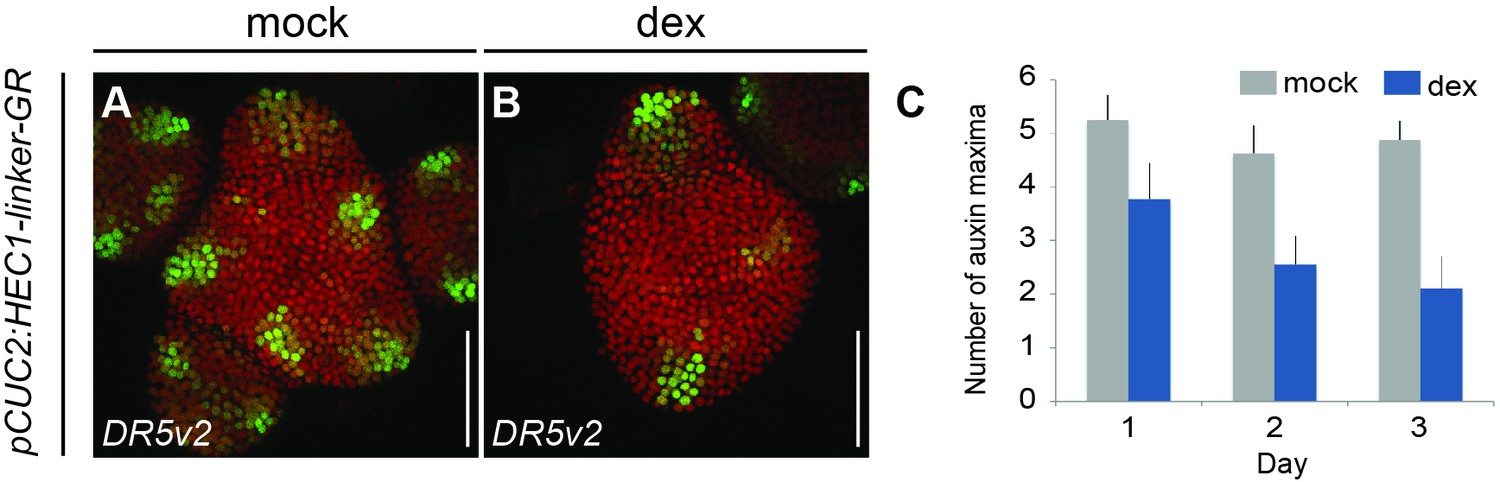
HEC function modulates auxin signalling.
(A–B) pDR5v2:3xYFP-NLS expression three days after mock (A) or dex treatment (B) of pCUC2:HEC1-linker-GR/pRPS5a:mCherry-NLS plants. (C) Quantification of auxin maxima in pCUC2:HEC1-linker-GR after mock or dex treatment (n > 7 per condition) over time. Scale bar: 50 µm.
-
Figure 6—source data 1
Quantification auxin maxima SAM (panel C).
- https://doi.org/10.7554/eLife.30135.027
-
Figure 6—source data 2
Quantification number of auxin maxima (Figure 6—figure supplement 2C);
Root Expression data Li et al., 2016 (Figure 6—figure supplement 3A); RAM size measurement p16:HEC1-linker-GR (Figure 6—figure supplement 3G); Quantification cortex cell number p16:HEC1-linker-GR (Figure 6—figure supplement 3H); Cortex cell lenght measurement p16:HEC1-linker-GR (Figure 6—figure supplement 3J).
- https://doi.org/10.7554/eLife.30135.028
Figure 6—figure supplement 1
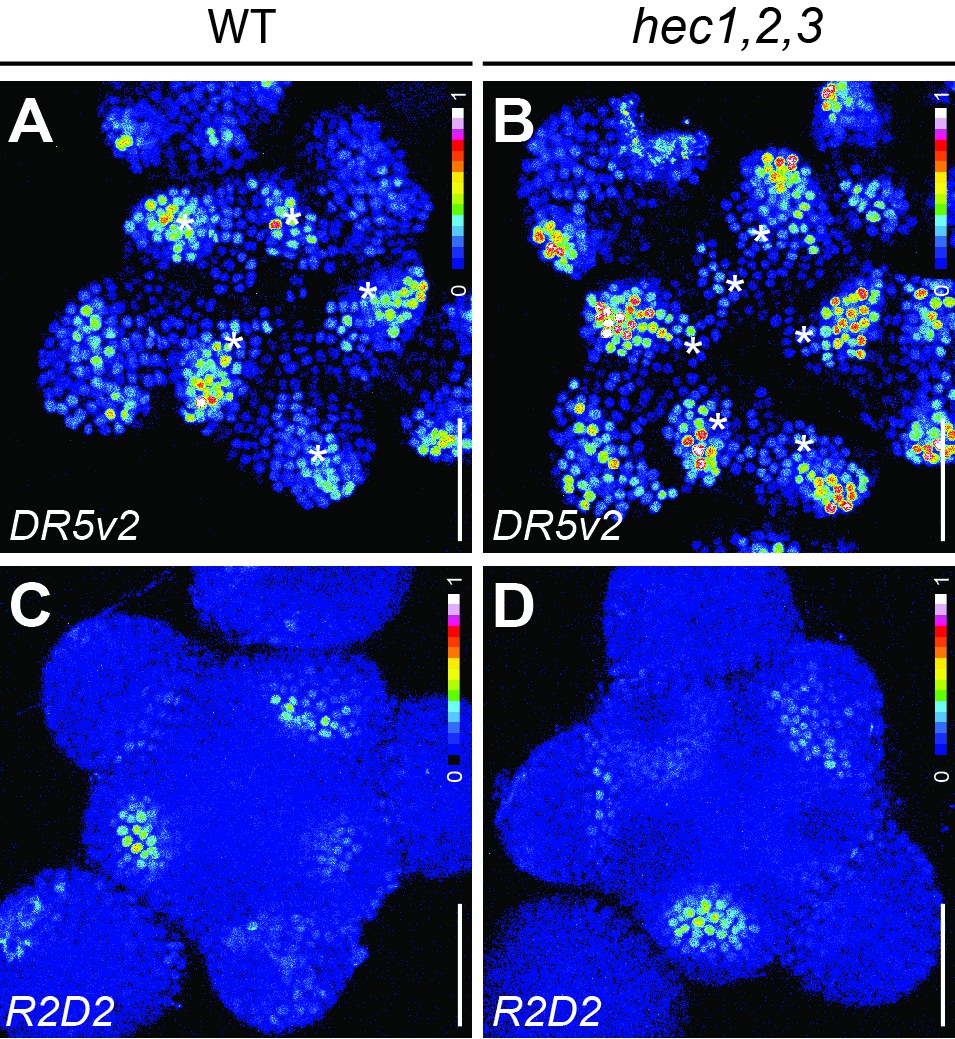
Auxin responses at the SAM in HEC loss-of-function mutants.
(A–B) Representative expression of pDR5v2:3xYFP-NLS in WT (n = 20) (A) and hec1,2,3 (n = 17) (B) shoot meristems (intensity based colour coding). White asterisks mark primordia (C–D) Representative expression of R2D2 in WT (n = 10) (C) and hec1,2,3 (n = 7) (D) shoot meristems (intensity based colour coding). Scale bar: 50 µm.
Figure 6—figure supplement 2

Dynamics of auxin responses at the SAM in HEC gain-of-function mutants.
(A) Time series of pDR5v2:3xYFP-NLS activity in individual pCUC2:HEC1-linker-GR/pRPS5A:dtTomato-NLS shoot meristems after mock or dex treatment (n > 7 per condition).(B) Time series of pDR5v2:3xYFP-NLS in p16:HEC1-linker-GR/pRPS5A:dtTomato-NLS shoot meristems after mock or dex treatment. (C) Quantification of number of auxin maxima as marked by pDR5v2:3xYFP-NLS activity, up to flower stage two in p16:HEC1-linker-GR shoot meristem after mock or dex treatment. (D–E) Representative views of pCLV3:HEC1-linker-GR expressing pDR5v2:3xYFP-NLS, three days after mock (D) and dex (E) treatment (n > 7). (F–G) Representative views of auxin input as marked by R2D2 activity in pCLV3:HEC1-linker-GR, three days after mock (F) and dex (G) treatment (n > 5). Note lower auxin sensing at the centre of the SAM, marked by higher R2D2 signal intensity after dex treatment. Gradient scale: relative intensity value. Scale bar: 50 µm.
Figure 6—figure supplement 3

RAM developmental dynamics in HEC gain-of-function mutants.
(A) Average expression level of HECATE genes and SHORTROOT (SHR) in different root domains as calculated in Li et al. (2016). (B) Representative image of p16:mCherry-GR-linker-NLS root three days after dex treatment (n = 15). White arrowhead marks the transition zone. (C–D) 5 DAG root meristem of p16:HEC1-linker-GR one days after mock (C) or dex (D) treatment. (E–F) 6 DAG root meristem of p16:HEC1-linker-GR two days after mock (E) or dex (F) treatment. Also note ectopic periclinal division at the cortex layer of dex-treated plants (box,white asterisk). White triangles mark the limit between the proximal meristem and the elongation zone (mock: n = 18, dex: n = 21). (G) RAM size in p16:HEC1-linker-GR after mock or dex treatment (n > 17 per condition). (H) Cortex cell number in p16:HEC1-linker-GR after mock or dex treatment (n > 17 per condition). (J) Cumulative averaged cortex cell length in p16:HEC1-linker-GR two days after mock or dex treatment (n = 11). (K–L) Intensity based representation of cell division activity (pKNOLLE:fast-mFluorescentTimer-NLS) in p16:HEC1-linker-GR root meristem 12 hr after mock (K) or dex (L) treatment. (M–P) Cytokinin (pTCSn:erGFP-NLS) (M, O) and auxin responses (pDR5v2:3xYFP-NLS) (N, P) in p16:HEC1-linker-GR root meristems one day after mock (M–N) or dex (O–P) treatment (n > 8 per genotype and condition). White arrowheads mark the transition domain where HEC function modulates the balance between auxin and cytokinin signalling. (Q–R) Bright field view of 5 DAG p16:HEC1-linker-GR root meristem one days after mock (Q) or dex (R) treatment. Red arrows highlight root hair differentiation. Statistical test: Student t-test (E). Scale bars: 100 µm.
Figure 7 with 2 supplements
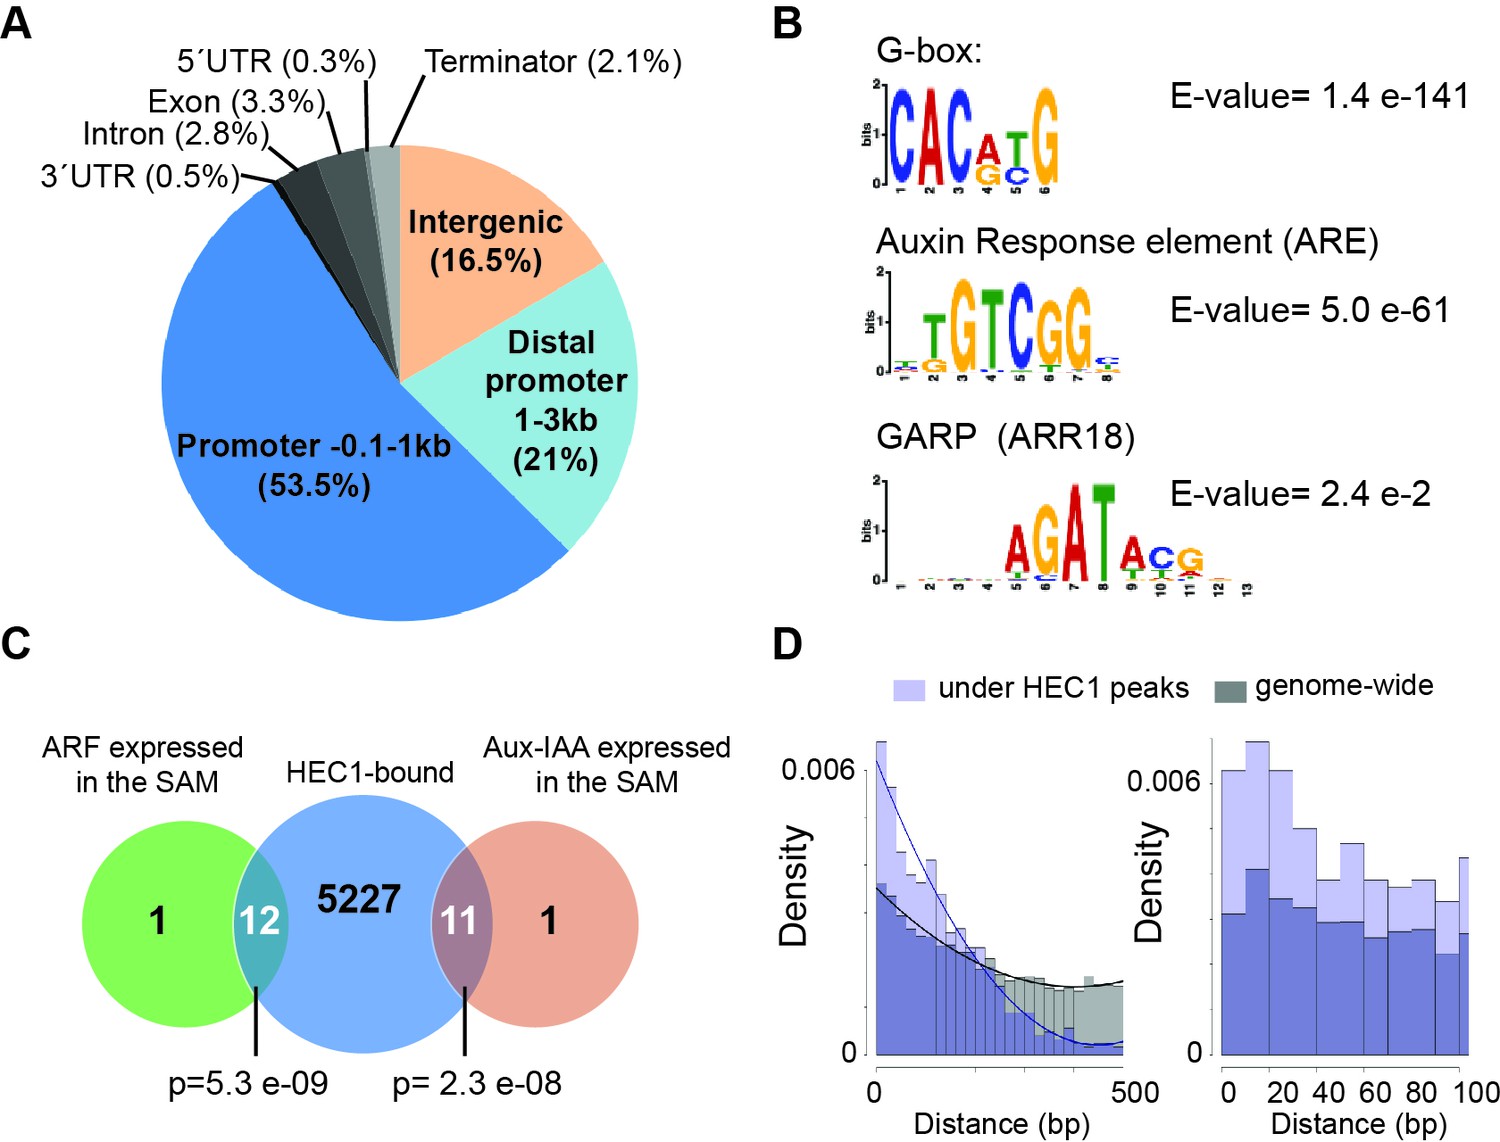
HEC1 DNA binding profile.
(A) Genome-wide distribution of HEC1-bound regions relative to gene models. (B) Motif enrichment analysis from HEC1 ChIP-seq. Position weight matrix depicting G-box, ARE and GARP motifs and corresponding E-value. (C) Venn diagram showing overlap between HEC1-bound genes and ARF and Aux-IAAs expressed in the SAM. (D) Distribution of distances between G-box and ARE under HEC1 peaks (light purple) and on the genomic background (grey). Overlap: dark purple. Fitting curves correspond to polynomial 2nd order fit. Statistical test: hypergeometric test (C).
-
Figure 7—source data 1
Calculation ARE_G-box enrichments (Figure 7—figure supplement 1G–I).
- https://doi.org/10.7554/eLife.30135.032
Figure 7—figure supplement 1
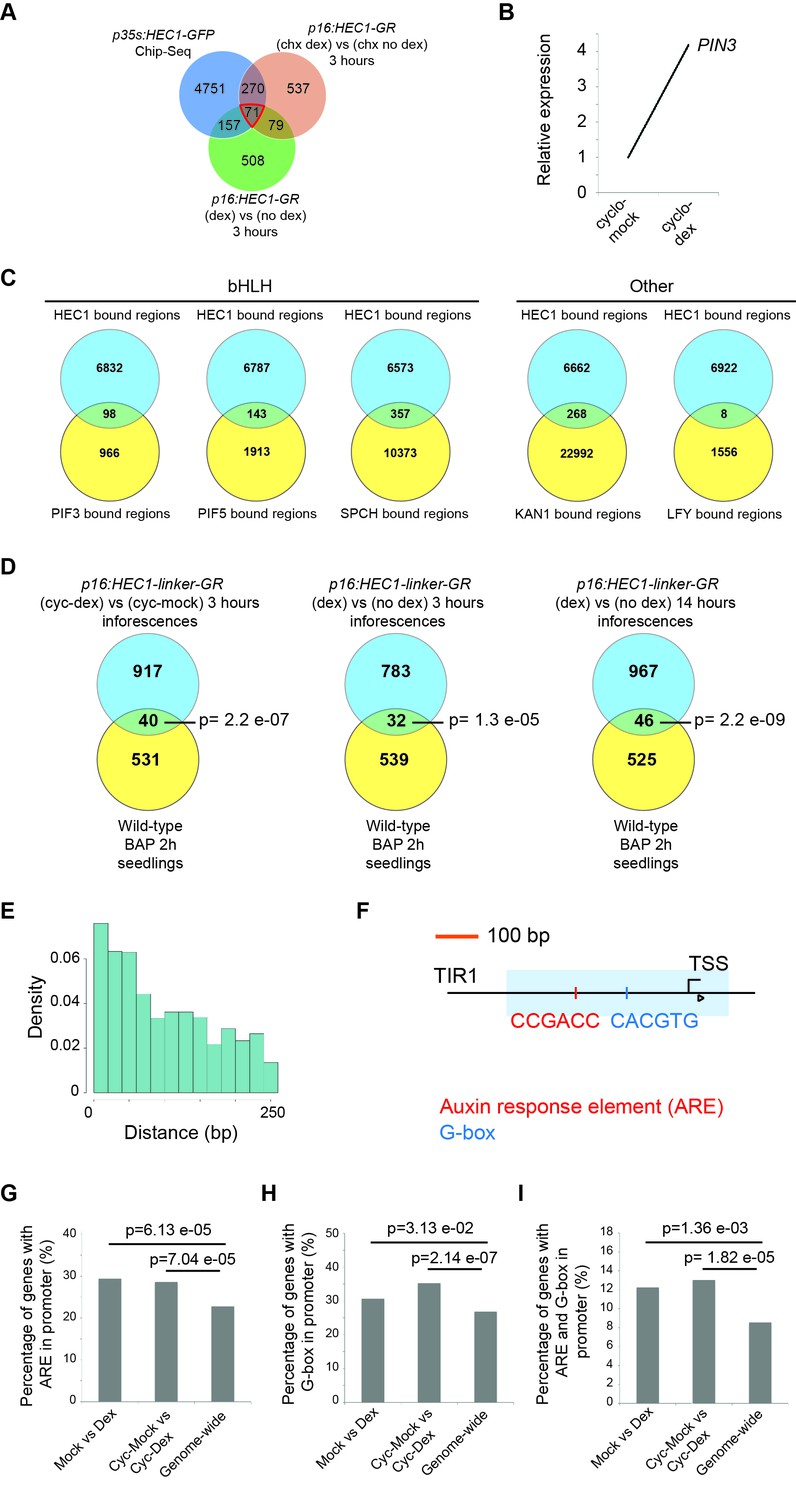
Analysis of HEC regulatory patterns in genome-wide profiles.
(A) Early HEC1-response genes as shown by the overlap between genes bound by HEC1 in p35S:HEC1-GFP ChIP-seq and regulated in p16:HEC1-linker-GR RNA-seq experiments. (B) Relative PIN3 expression in p16:HEC1-linker-GR RNA-seq. Biological triplicates were analysed. (C) Overlap between DNA binding regions of HEC1 and SPCH (Lau et al., 2014), PIF3, PIF5 (Pfeiffer et al., 2014), KAN1 (Merelo et al., 2013) and LFY (Moyroud et al., 2011). (D) Overlap between HEC1 response genes and cytokinin response genes (Bhargava et al., 2013). (E) Distribution of distances between HEC1 peaks (ChIP-seq) and ARE. (F) Schematic of TIR1 loci showing the overlap between HEC1 binding region (light blue box), G-box (blue line) and ARE (red line). (G–I) Proportion of early HEC1 response genes carrying an ARE (G), a G-box (H) or both motifs (I) in their promoter. Statistical test: Hypergeometric test (D), Fischer test two-sided (G–I).
Figure 7—figure supplement 2
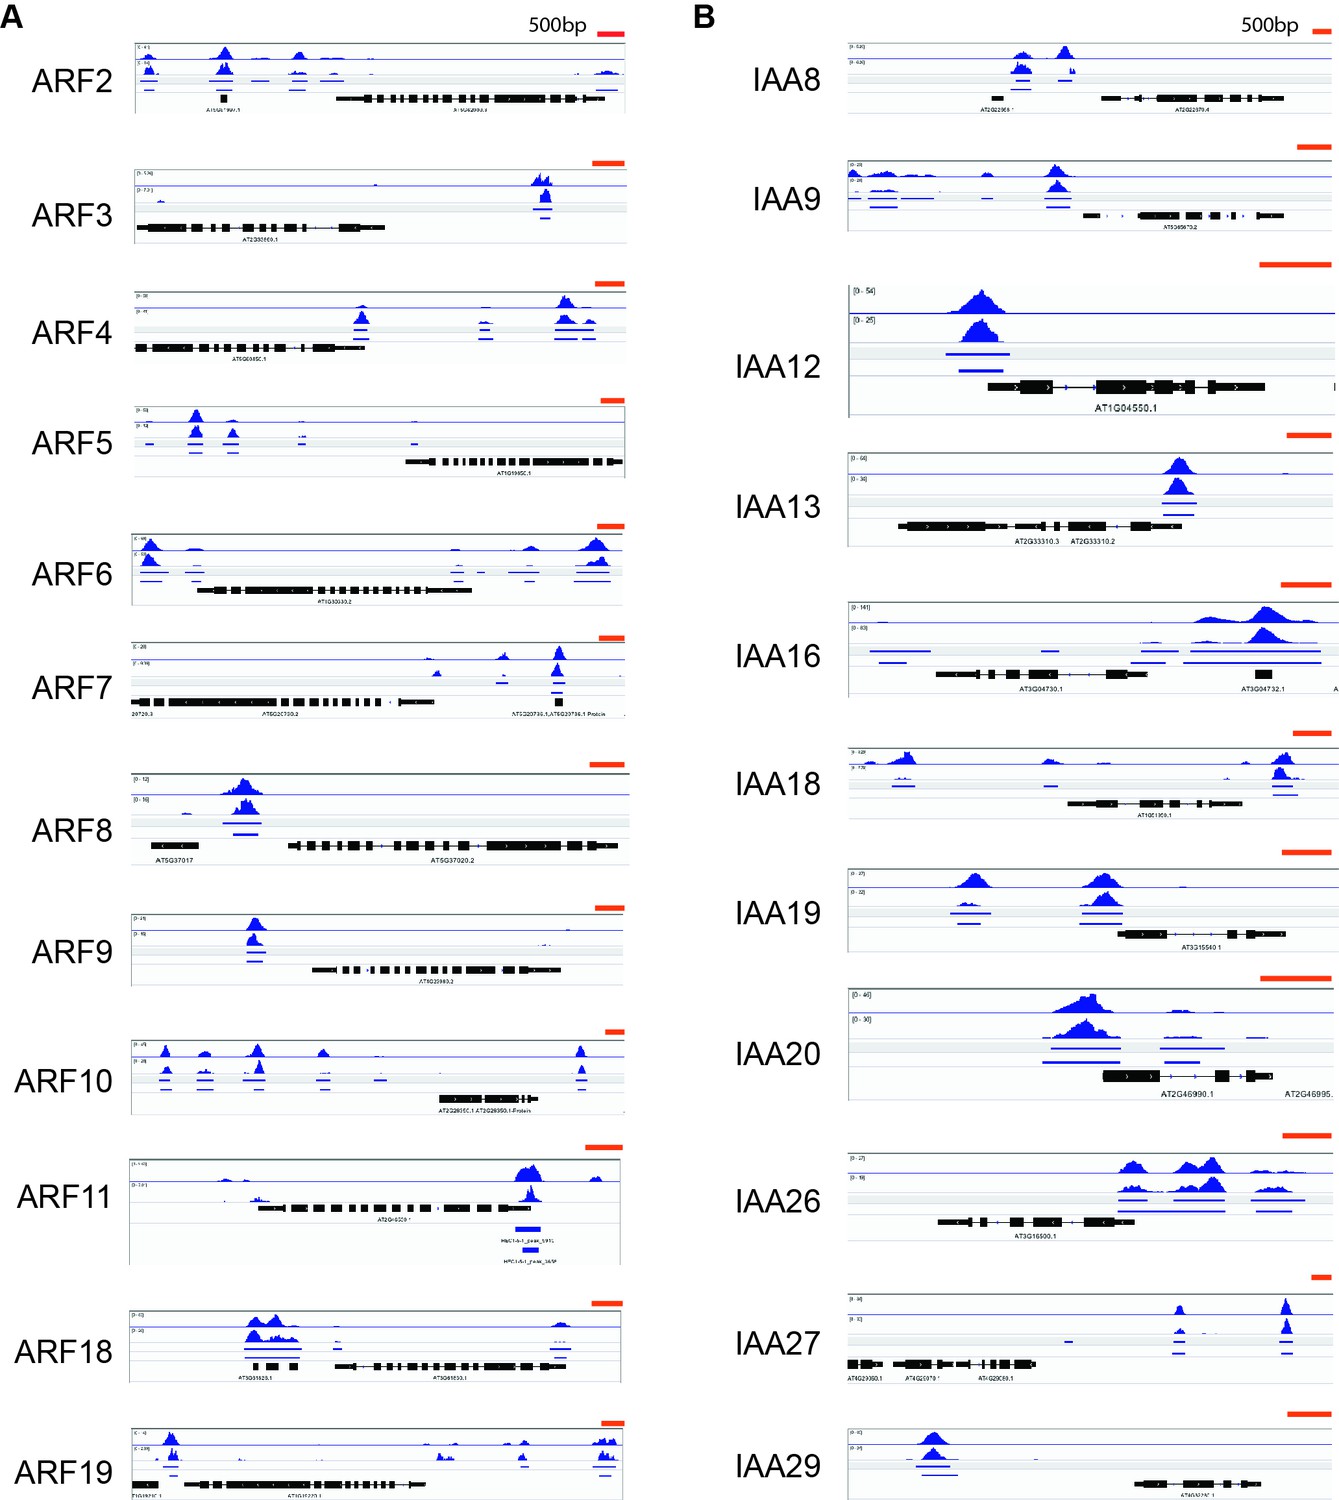
Visualization of HEC1 binding peaks at the loci of ARFs and Aux-IAAs expressed in the SAM.
(A) IGV visualization of HEC1 binding peaks at the promoter of ARFs expressed in the SAM. (B) IGV visualization of HEC1 peaks at the promoter of Aux-IAAs expressed in the SAM (Vernoux et al., 2011). Biological duplicates are depicted.
Figure 8 with 1 supplement
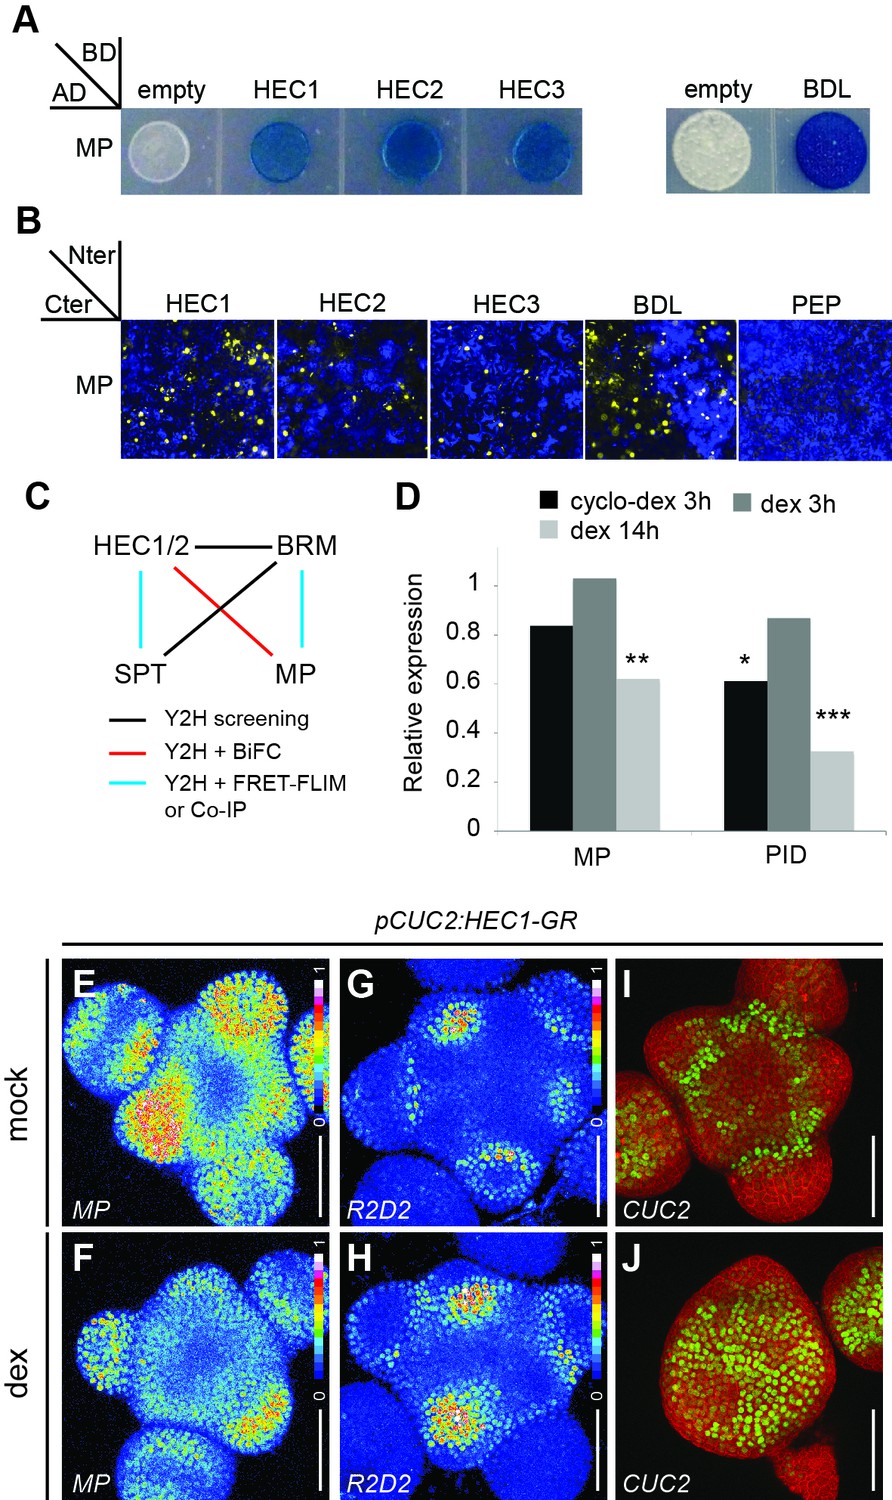
HEC factors interact with MP and unbalance the auxin feedback system.
(A) Yeast-two-Hybrid assay between MONOPTEROS (MP) and HEC1, HEC2 or HEC3. Empty vector: negative control; BODENLOS (BDL): positive control. Blue staining denotes physical interaction. (B) Bimolecular-Fluorescence Complementation assay between MP and HEC1, HEC2 or HEC3. Nuclear YFP fluorescence was reconstituted in all combinations. PEP: negative control; BDL: positive control. (C) Protein-protein interaction network between HEC, SPT, MP and BRM. (D) Relative expression of MP and PID after p16:HEC1-linker-GR induction as measured by RNA-seq experiment. Biological triplicates were analysed. (E,F) Representative expression of pMP:MP-GFP one day after mock (E) or dex (F) treatment of pCUC2:HEC1-linker-GR plants (n > 4 per condition, intensity based colour coding). (G, H) Representative expression of R2D2 one day after mock (G) or dex (H) treatment of pCUC2:HEC1-linker-GR plants (n > 4 per condition, intensity based colour coding). (I–J) Representative expression of pCUC2:3xGFP-NLS three days after mock (I) or dex (J) treatment of pCUC2:HEC1-linker-GR plants (n > 3 per conditions). Statistical test: Fischer´s exact test (EdgeR), *p<0.05, **p<0.01, ***p<0.001. Scale bar: 50 µm.
Figure 8—figure supplement 1
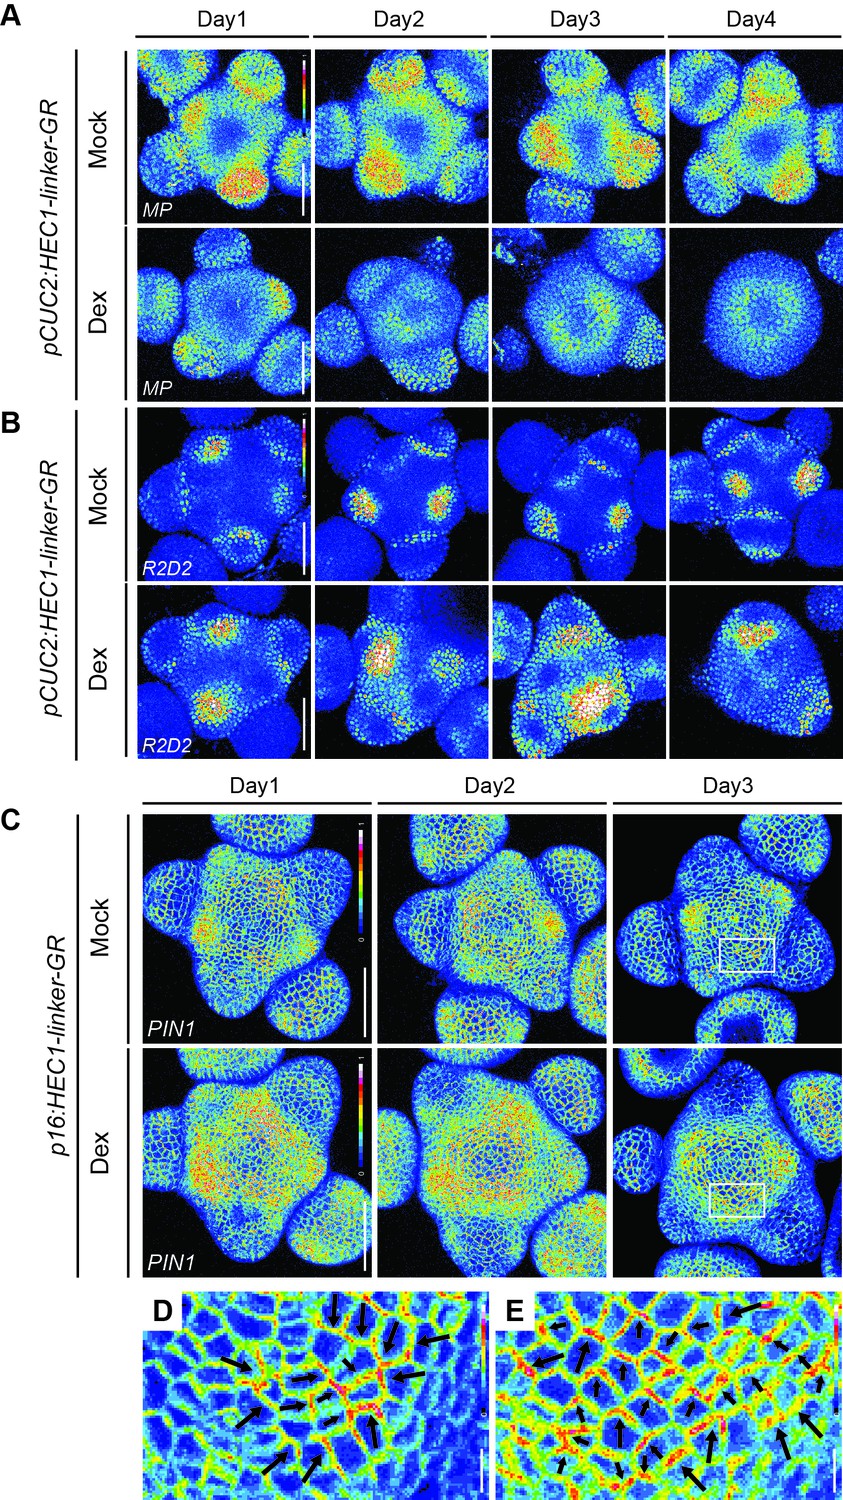
Dynamics of MP-GFP, PIN1-GFP and R2D2 after HEC1-GR induction at the PZ/BZ.
(A) Time series of pMP:MP-GFP in individual pCUC2:HEC1-linker-GR shoot meristems after mock or dex treatment (n > 6 per condition). (B) Time series of auxin signalling input in individual pCUC2:HEC1-linker-GR shoot meristems expressing R2D2 after mock or dex treatment. Higher R2D2 intensity signals mark low auxin sensing regions (n > 4 per condition). (C) Time series of pPIN1:PIN1-GFP in individual p16:HEC1-linker-GR shoot meristems after mock or dex treatment (mock: n > 4; dex: n > 9 per condition). (D–E) Magnified views of white boxes in (C) depicting pPIN1:PIN1-GFP after p16:HEC1-linker-GR mock (D) or dex (E) induction. Black arrows estimate PIN1 polarity. Scale bar: 50 µm (A–C), 5 µm (D–E).
Figure 9 with 1 supplement
Auxin feedback stabilization suppresses HEC function at the SAM periphery.
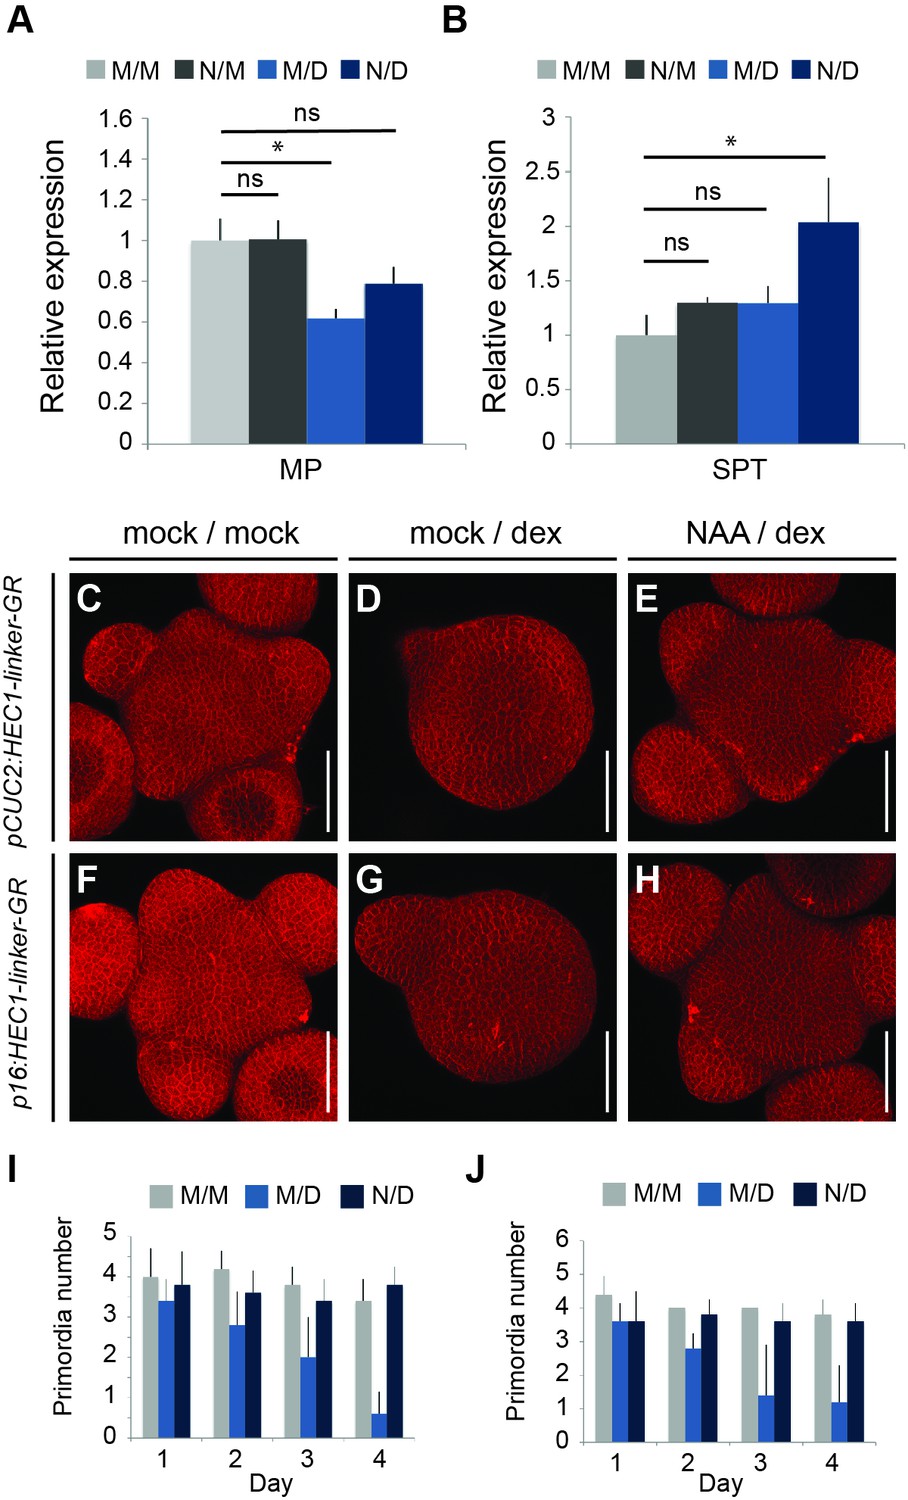
(A–B) Relative expression of MP (A) and SPT (B) 24 hr after p16:HEC1-linker-GR induction (M/M: mock/mock, N/M: NAA/mock, M/D: mock/dex, N/D: NAA/dex) (C–E) Representative views of pCUC2:HEC-linker-GR SAMs four days after mock/mock (C) mock/dex (D) or NAA/dex (E) treatment. (F–H) Representative view of p16:HEC-linker-GR SAMs four days after mock/mock (F) mock/dex (G) or NAA/dex (H) treatment. (I) Time series quantification of primordia number in pCUC2:HEC1-linker-GR after mock/mock (M/M), mock/dex (M/D) or NAA/dex (N/D) treatment (n = 5 per condition and time point). (J) Time series quantification of primordia number in p16:HEC1-linker-GR after mock/mock (M/M), mock/dex (M/D) or NAA/dex (N/D) treatment over time (n = 5 per condition and time point). Statistical test: Welch t-test *p<0.05, **p<0.01, ***p<0.001. Scale bar: 50 µm.
-
Figure 9—source data 1
qRT-PCR (panel 9A and B);
Quantification primordia number for pCUC2:HEC1-linker-GR (panel I); Quantification primordia number for p16:HEC1-linker-GR (panel J).
- https://doi.org/10.7554/eLife.30135.037
Figure 9—figure supplement 1

Dynamics of primordia initiation after HEC1-GR induction at the PZ/BZ and auxin co-treatment.
(A–D) Representative view of shoot meristems expressing pCUC2:3xGFP-NLS following 24 hr (A,B) or 48 hr (C,D) of mock (A,C) or NAA (B,D) treatment (n > 3 per condition). (E–F) Development of pCUC2:HEC1-linker-GR (E) or p16:HEC1-linker-GR (F) shoot meristem after mock/mock, mock/dex or NAA/dex treatment (n = 5 per condition and time point). Primordia are marked till flower stage 2. Scale bar: 50 µm.
Figure 10 with 1 supplement

HEC function integrates environmental signals at the SAM.
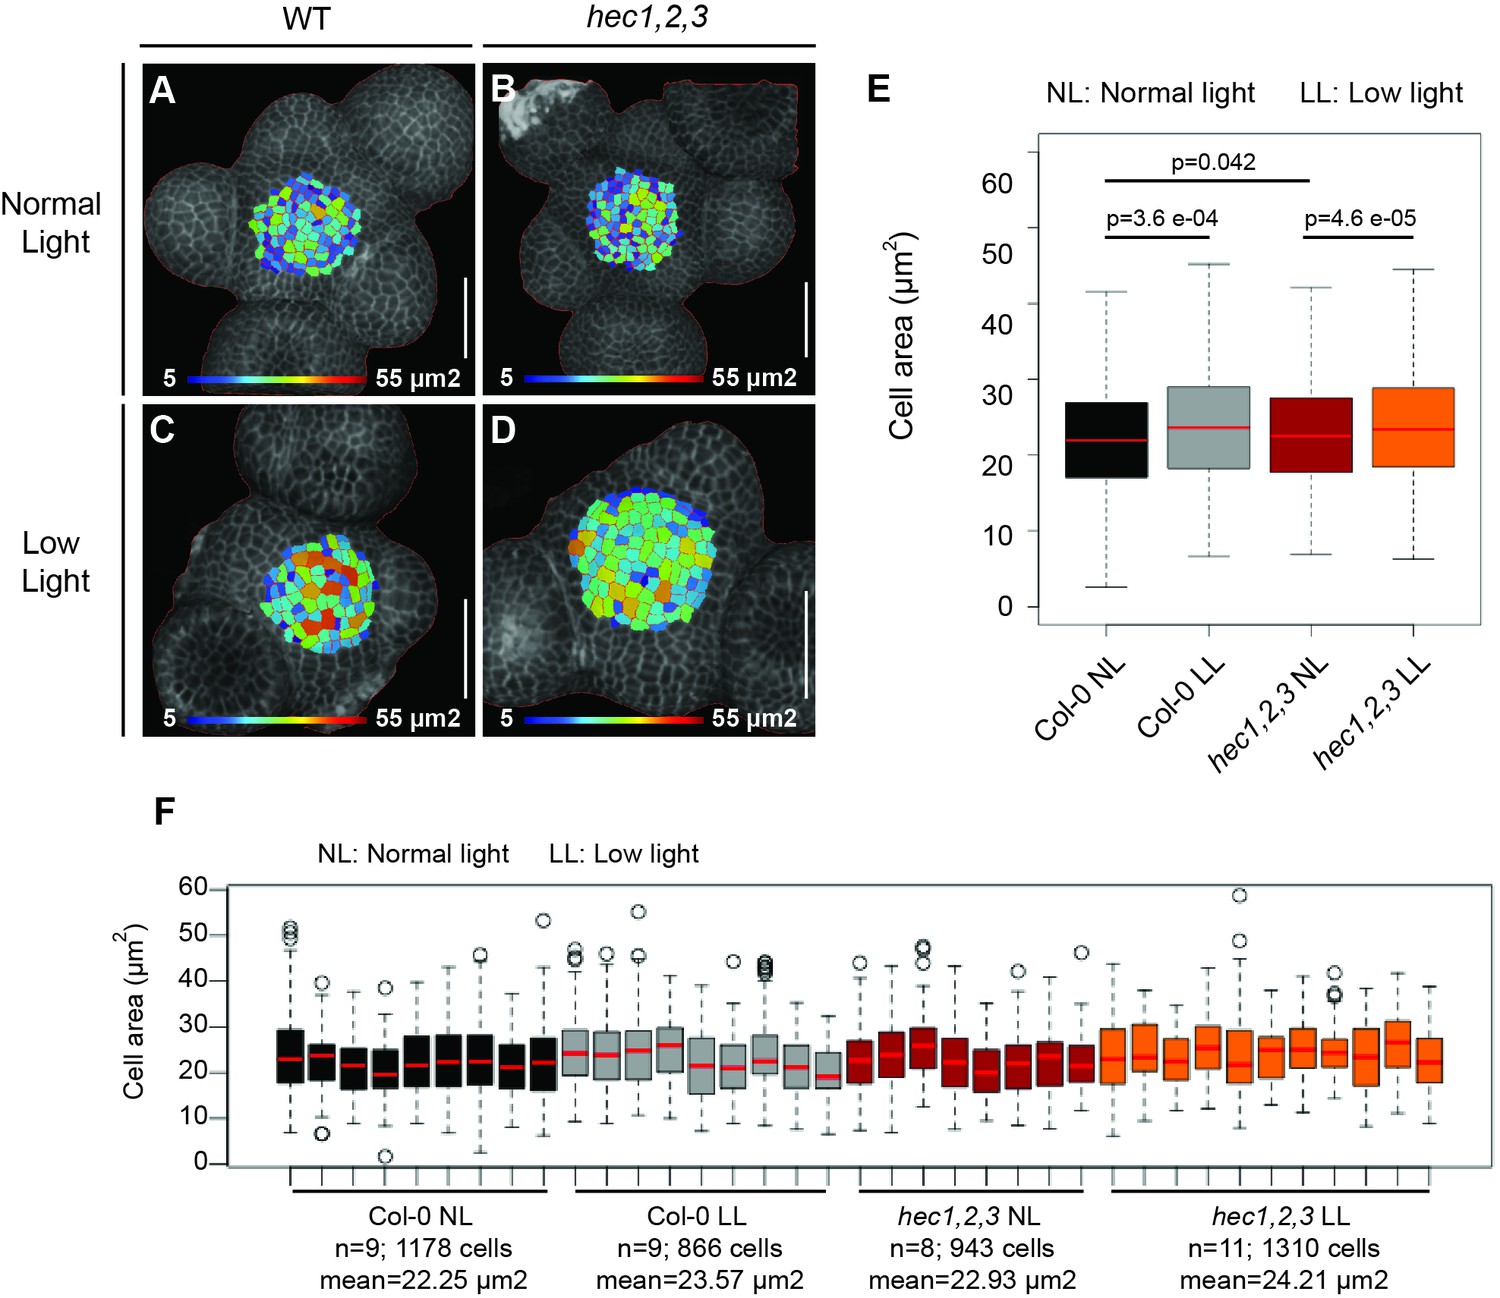
(A–D) Reconstructed views of shoot meristems in wild type (A, C) and hec1,2,3 (B, D) plants grown under normal (A, B) and low light intensity conditions (C, D) (n > 13). (E) Shoot meristem size in wild type and hec1,2,3 plants grown under normal and low light intensity regimes. (F–I) Cytokinin response (pTCSn:erGFP) in shoot meristems of wild type (n > 6) (F, H) and hec1,2,3 (n > 4) (G, I) plants under normal (F, G) and low light intensity conditions (H, I). (J) Quantification of cytokinin response in wild type and hec1,2,3 shoot meristem under normal and low light regimes. Statistical test: Wilcoxon signed-ranked test (E). Scale bar: 50 µm.
-
Figure 10—source data 1
Source data provided for panel E and intensity plot profiles pTCSn:erGFP under different light regimes (panel J).
- https://doi.org/10.7554/eLife.30135.040
-
Figure 10—source data 2
Cell surface area MorphographX (Figure 10—figure supplement 1E);
Cell surface area: MorphoGraphX individual plants (Figure 10—figure supplement 1F).
- https://doi.org/10.7554/eLife.30135.041
Figure 10—figure supplement 1
Cell size at the SAM after transfer to low light conditions.
(A–D) Cell area representation of wild type (A, C) and hec1,2,3 (B, D) plants grown under normal (A, B) and low light intensity conditions (B, D). Heat map colors depict cell size (µm2). (E–F) Cell area quantification in wild type and hec1,2,3 grown under different light regimes (E). Cell area distribution in individual shoot meristem analysed (F). NL: Normal light intensity (200 µmol m−2 s−1), LL: Low light intensity (15 µmol m−2 s−1). Statistical test: Wilcoxon signed-ranked test (E). Scale bar: 50 µm.
Figure 11
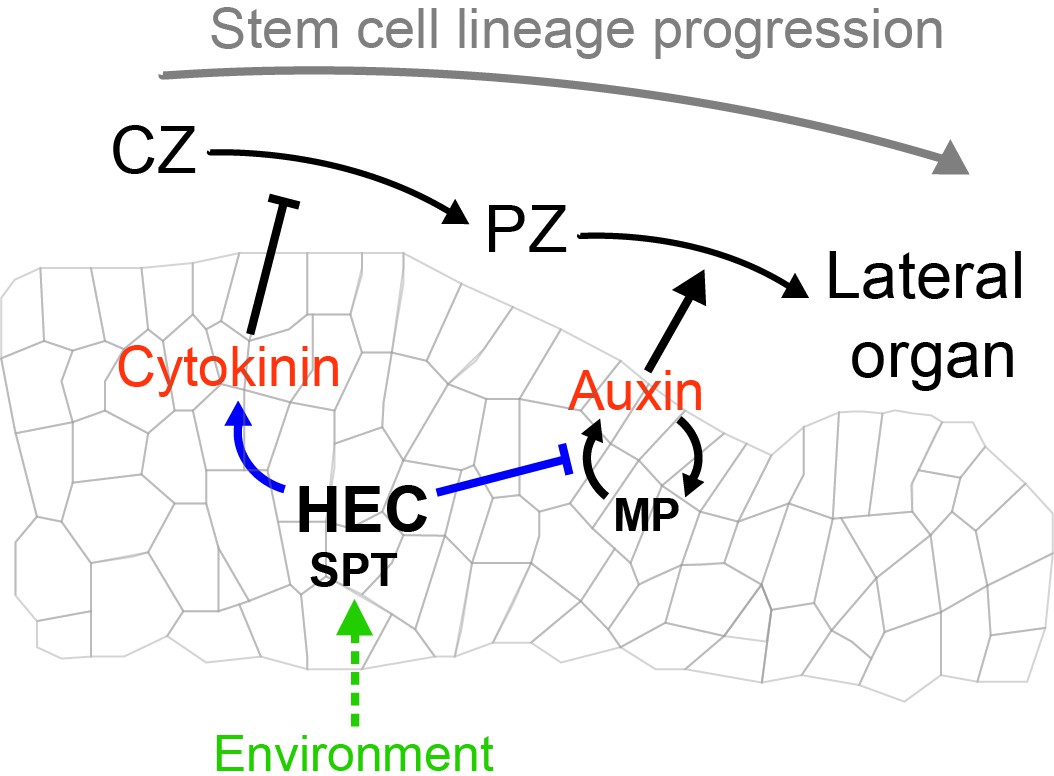
Theoretical model depicting HEC activity controlling cellular fate transition in the SAM by modulating the auxin-cytokinin phytohormonal balance and integrating environmental signals.
https://doi.org/10.7554/eLife.30135.042Additional files
-
Supplementary file 1
ChIPseq, RNAseq and QRT-PCR analyses
- https://doi.org/10.7554/eLife.30135.043
-
Supplementary file 2
List of oligonucleotides
- https://doi.org/10.7554/eLife.30135.044
-
Supplementary file 3
Description of computational model
- https://doi.org/10.7554/eLife.30135.045
Download links
A two-part list of links to download the article, or parts of the article, in various formats.
Downloads (link to download the article as PDF)
Open citations (links to open the citations from this article in various online reference manager services)
Cite this article (links to download the citations from this article in formats compatible with various reference manager tools)
Control of plant cell fate transitions by transcriptional and hormonal signals
eLife 6:e30135.
https://doi.org/10.7554/eLife.30135


