Phosphatidylinositol 4,5-bisphosphate optical uncaging potentiates exocytosis
- University of Copenhagen, Denmark
- Leibniz-Forschungsinstitut für Molekulare Pharmakologie, Germany
- European Molecular Biology Laboratory, Germany
- Max Planck Institute of Molecular Cell Biology and Genetics, Germany
- AstraZeneca, United Kingdom
- University of Washington, United States
- Saarland University, Germany
Figures
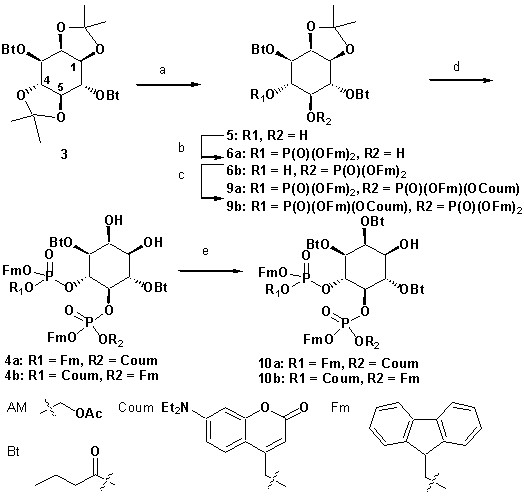
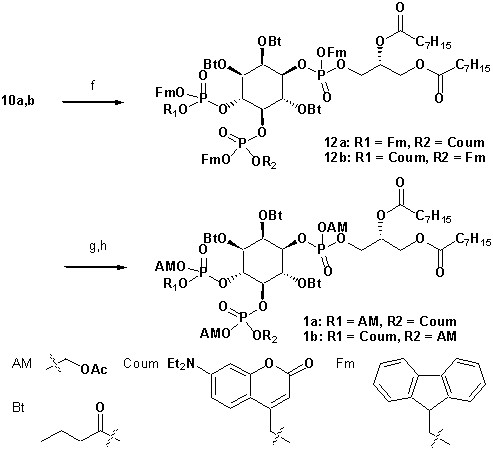
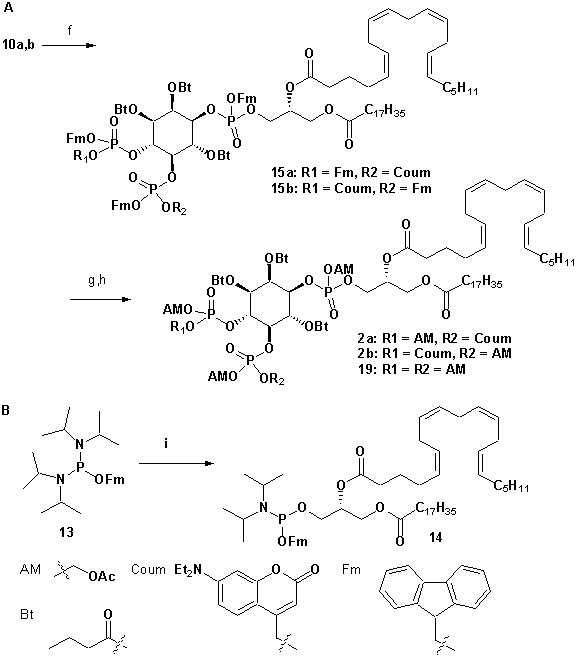
Figure 1
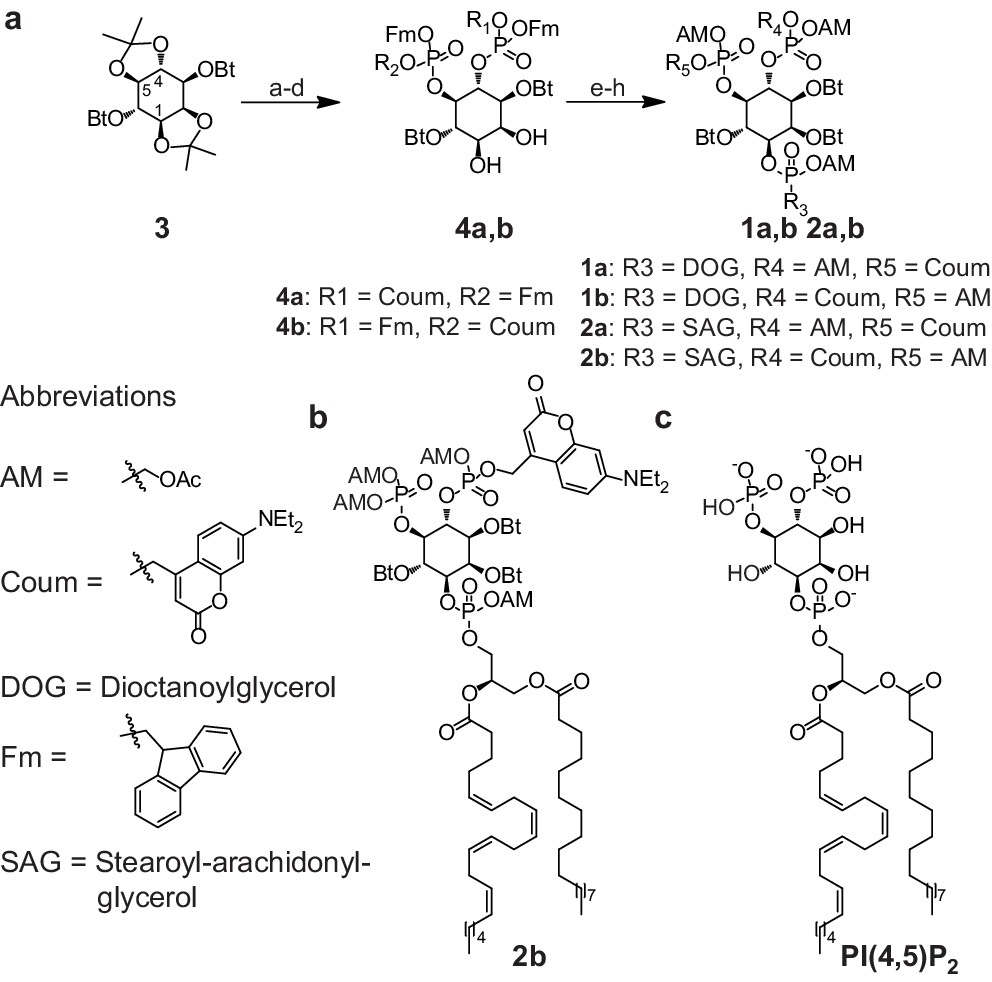
Synthesis of membrane-permeant and photoactivatable PI(4,5)P2 (cg-PI(4,5)P2).
(a) Synthesis of PI(4,5)P2 derivatives 1a,b and 2a,b. Reagents and conditions: (a) CH2Cl2:HCO2H 4:1, room temperature (rt), 3 hr, 88%; (b) (FmO)2P-NiPr27, 1H-tetrazole, CH2Cl2, rt, 1 hr, then AcO2H, −80°C-rt, 1 hr, 83% over two steps; (c) (Coum)(FmO)P-NiPr28, 1H-tetrazole, CH2Cl2, rt, 1 hr, then AcO2H, −80°C-rt, 1 hr; (d) CH2Cl2:HCO2H 1:19, rt, 6 hr; (e) Pr-C(OMe)3, CH2Cl2, JandaJel pyridinium trifluoroacetate, rt, 23 hr, 38% based on 3. For 1a,b: (f) (dioctanoylglycerol)(OFm)P-NiPr211, 1H-tetrazole, CH2Cl2, rt, 1 hr, then AcO2H, −80°C-rt, 1 hr, 67% over two steps; (g) CH2Cl2, EtNMe2, rt, 30 min; (h) acetoxymethyl bromide, N,N-diisopropylethylamine, MeCN, rt, 22 hr, 65% over two steps. For 2a,b: f) (stearoyl-arachidonylglycerol)(OFm)P-NiPr214, 1H-tetrazole, CH2Cl2, rt, 1 hr, then AcO2H, −80°C-rt, 1 hr, 89% over two steps; (g) CH2Cl2, EtNMe2, rt, 30 min; (h) acetoxymethyl bromide, N,N-diisopropylethylamine, MeCN, rt, 22 hr, 43% over two steps. (b) Structure of the caged, membrane-permeant PI(4,5)P2 derivative 2b. (c) Structure of the de-esterified and uncaged, predominant naturally occurring PI(4,5)P2 variant. (left panel) Ac: acetyl; AM: acetoxymethyl; Bt: butyryl; Coum: 7-diethylamino-4-methyl-2-oxo-2H-chromenyl; Fm: 9-fluorenylmethyl.
Figure 2 with 1 supplement
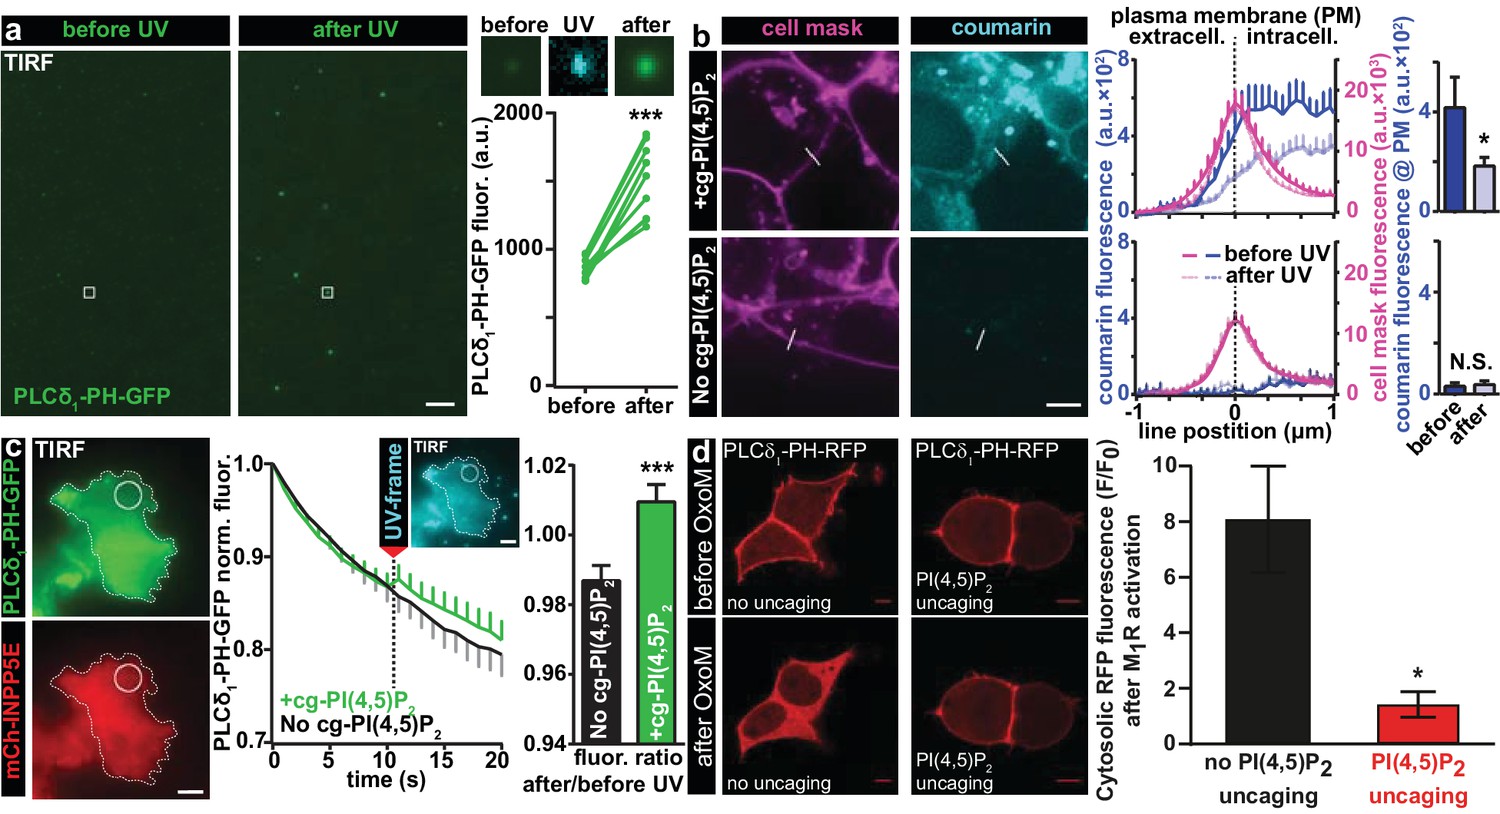
Characterization of PI(4,5)P2 UV uncaging in-vitro, loading of cg-PI(4,5)P2 into living cells and visualization of PI(4,5)P2 uncaging in several cell types.
(a) Uncaging of cg-PI(4,5)P2 micelles on a glass coverslip results in the relocation of a high affinity PI(4,5)P2 sensor, PLCδ1-PH-EGFP, to micelles following UV light exposure, as seen by a local increase in 488 nm excited fluorescence using TIRF microscopy. The two images on the left show the EGFP fluorescence before and after UV uncaging (note the background fluorescence due to soluble PLCδ1-PH-EGFP). The region within the white square is one example of an analyzed micelle. Magnified views are shown on the right before (EGFP fluorescence), during (showing coumarin/cg-PI(4,5)P2-fluorescence) and after (EGFP fluorescence) UV (405 nm) light in the TIRF field. The quantification shows the analysis of the fluorescence of all 10 micelles seen in this image frame. (b) HEK cells were either loaded for 30 min at 37°C with 20 µM of cg-PI(4,5)P2 (+cg-PI(4,5)P2, top line), or not loaded (No cg-PI(4,5)P2, bottom line). All cells were treated with the vehicle DMSO (0.2%), Pluronic (0.02%), CellMask Deep Red plasma membrane stain and imaged on a spinning disc confocal microscope. Fluorescence line profiles were collected to investigate cellular uptake of cg-PI(4,5)P2. Profiles were aligned to the local intensity maxima of the CellMask fluorescence indicating the position of the plasma membrane and revealed intracellular coumarin/cg-PI(4,5)P2 (compare dark blue profiles with and without cg-PI(4,5)P2). After cells were exposed to UV (405 nm) illuminations, the intensity distribution of the coumarin fluorescence was altered (light blue profiles) and intensity at the position of the plasma membrane significantly reduced (bar graph in top line), indicating PI(4,5)P2 uncaging. (c) COS-7 cells expressing PLCδ1-PH-EGFP (top left panel) and a plasma membrane targeted, m-Cherry tagged inositol polyphosphate 5-phosphatase (mCh-INPP5E) (bottom left panel) were either loaded for 30 min at 37°C with 20 µM cg-PI(4,5)P2 (+cg-PI(4,5)P2) or not loaded (No cg-PI(4,5)P2) and imaged on a TIRF microscope. All cells were treated with the vehicle DMSO (0.2%) and Pluronic (0.02%). Center panel: average EGFP fluorescence of ROIs at the plasma membrane (example shown in the images on the left) imaged at 1 Hz in the TIRF field in both groups (+cg-PI(4,5)P2: green, No cg-PI(4,5)P2: black). Between the 10th and the 11th frame, UV-uncaging was performed. The image acquired during the UV-frame (showing coumarin/cg-PI(4,5)P2-fluorescence) is shown as an insert. Right panel: the fluorescence change following uncaging was calculated by dividing the per-ROI fluorescence values in the 11th frame by those in the 10th frame. In cells loaded with cg-PI(4,5)P2, PLCδ1-PH-EGFP fluorescence increased in the TIRF field after UV-uncaging. (d) tsA-201 cells overexpressing M1 muscarinic receptors and PLCδ1-PH-RFP were imaged on a laser scanning confocal microscope. Due to the high affinity of the probe, endogenous PI(4,5)P2 levels are already sufficient to localize the probe to the plasma membrane at the beginning of the experiment (top line). Application of 1 µM of the M1 receptor agonist oxotremorine-M (Oxo-M) resulted in the translocation of the sensor to the cell center indicative of plasmalemmal PI(4,5)P2 breakdown in cells loaded with cg-PI(4,5)P2, but not subjected to UV-uncaging (no uncaging, bottom left image, black bar graph). This response was nearly abolished in cells subjected to UV light (PI(4,5)P2 uncaging, bottom right image and red bar graph). F/F0 signifies the ratio of fluorescence values within the cytosol at the end of the experiment (F) (21–22 s after the uncaging and 20 s after the application of oxotremorine-M) by the fluorescence at the beginning of the experiment (F0). See Figure 2—figure supplement 1 for further details. Scale bars 5 µm. All values are mean ±SEM. *p<0.05; **p<0.01; ***p<0.001. In panels a and b, paired t-tests were used, in panels c and d, unpaired two-tailed t-tests were performed. Number of cells (n): panel b: n = 14 cells (+cg-PI(4,5)P2), n = 5 cells (No cg-PI(4,5)P2). Panel c: n = 15 cells (+cg-PI(4,5)P2), n = 15 cells (No cg-PI(4,5)P2). Panel d: n = 6 cells (no uncaging), n = 12 cells (PI(4,5)P2 uncaging).
Figure 2—figure supplement 1
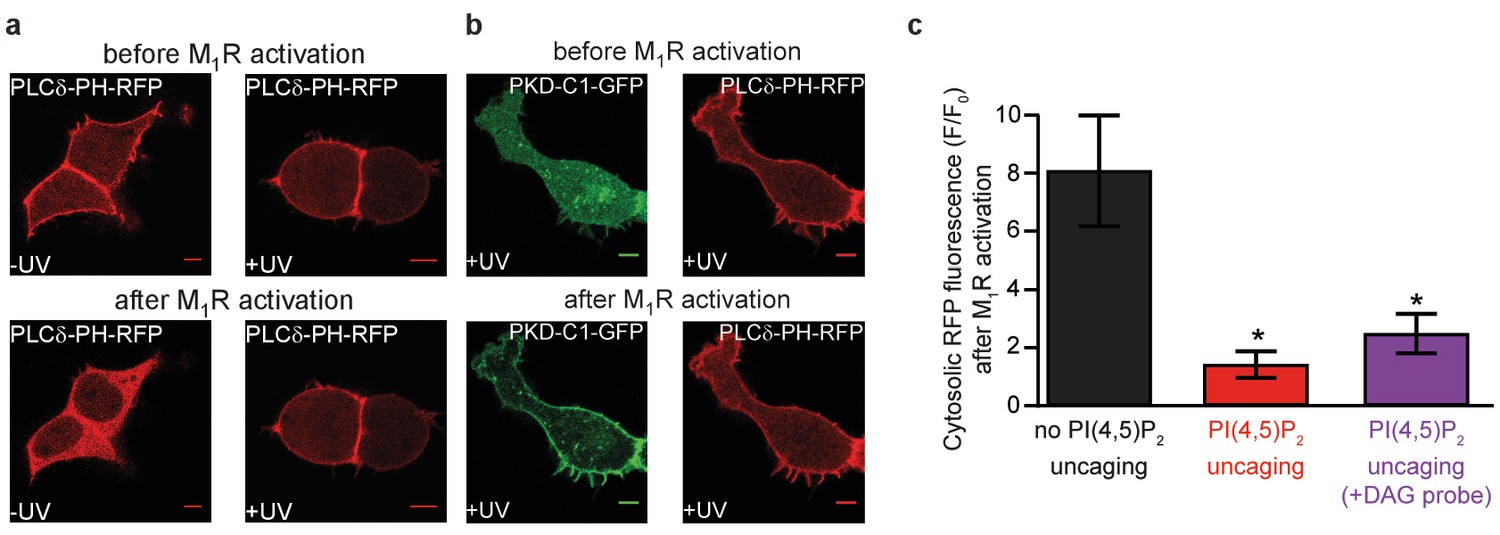
PI(4,5)P2 uncaging elevates plasmalemmal PI(4,5)P2.
(a) Confocal imaging of elevated PI(4,5)P2 levels following uncaging of 1a,b. These tsA-201 cells overexpress M1 receptors and the PI(4,5)P2-fluorescence sensor PLCδ1-PH-RFP. Due to the high affinity of the probe, endogenous PI(4,5)P2 levels are already sufficient to localize the probe to the plasma membrane at the beginning of the experiment. Application of 1 μM of the M1 receptor agonist oxotremorine-M resulted in the translocation of the sensor to the cell center indicative of PI(4,5)P2 breakdown in cells loaded with 1a,b, but not subjected to UV-uncaging. The translocation was prevented in cells where 1a,b was uncaged by a UV-laser. (b) UV-uncaging does not interfere with PI(4,5)P2 metabolism. The M1 receptor activates PLC which metabolizes PI(4,5)P2 to DAG. To ensure that uncaging did not interfere with this metabolism we monitored DAG levels by the DAG sensor PKD-C1-GFP DAG. M1 receptor activation led to translocation of the DAG sensor to the plasma membrane indicative of DAG production (green) while PI(4,5)P2 levels remained high enough to maintain the PI(4,5)P2 sensor at the plasma membrane (red). (c) Quantification of the experiments depicted in (a) and (b). F/F0 signifies the ratio of fluorescence values within the cytosol at the end of the experiment (F) (21–22 s after the uncaging and 20 s after the application of oxotremorine-M) by the fluorescence at the beginning of the experiment (F0). Images in (a) and first two columns of the bar graph in (c) are reproduced from Figure 2d. Number of cells: No PI(4,5)P2-uncaging, n = 6; PI(4,5)P2-uncaging, n = 12; PI(4,5)P2-uncaging (+DAG probe), n = 7 *p<0.05.
Figure 3
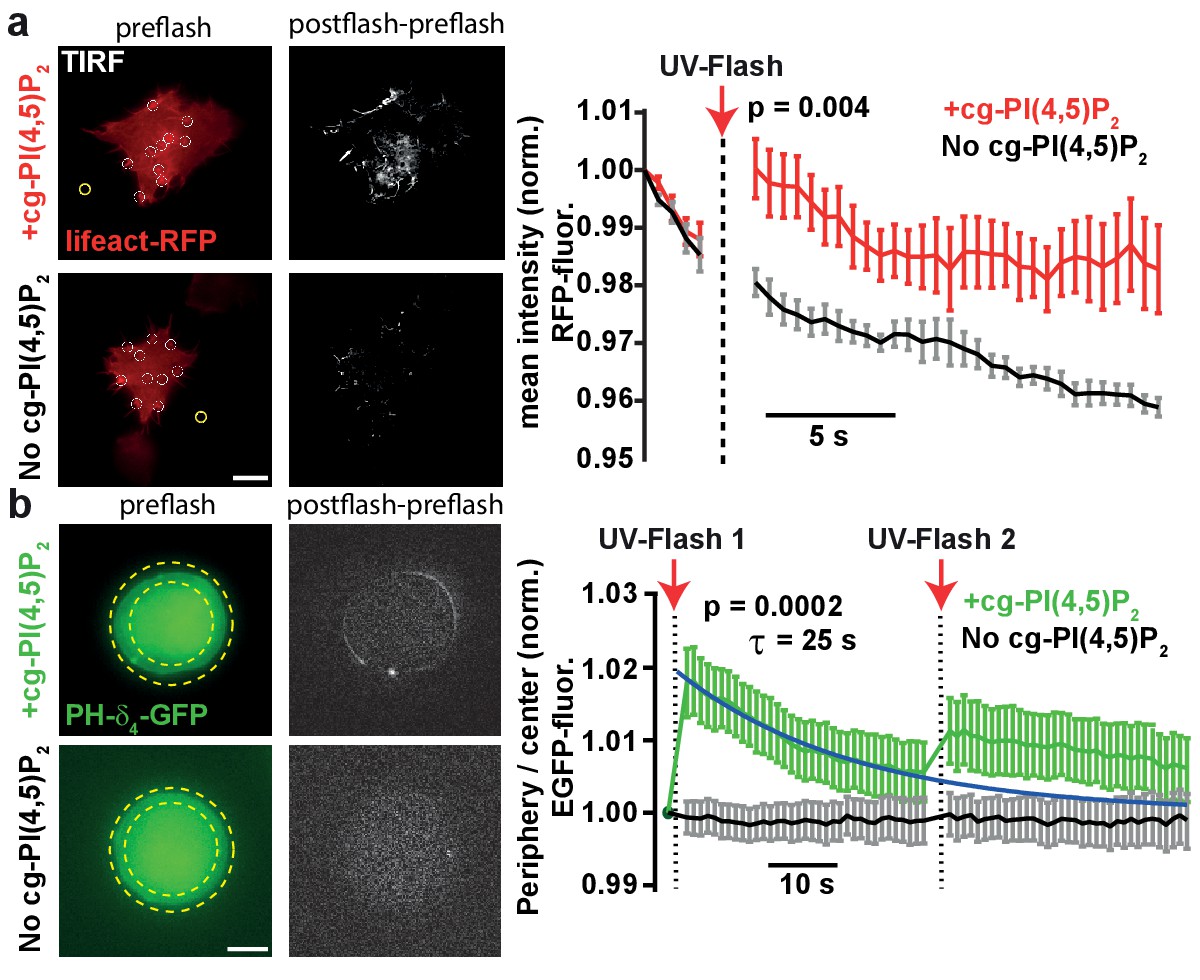
PI(4,5)P2 uncaging increases actin levels near the plasma membrane and recruits the low affinity PI(4,5)P2 sensor PLCδ4-PH-EGFP to plasma membranes of adrenal chromaffin cells.
(a) TIRF imaging of HEK cell footprints transfected with lifeact-RFP to label actin. Cells were either loaded for 30 min at 37°C with 20 µM cg-PI(4,5)P2 (+cg-PI(4,5)P2, top) or not loaded (No cg-PI(4,5)P2, bottom). All cells were treated with the vehicle DMSO (0.2%) and Pluronic (0.02%). Five baseline images were acquired at 2 Hz in the RFP channel, before a 405 nm UV laser was used to uncage PI(4,5)P2 in the TIRF field. Imaging in the RFP channel was then resumed at 2 Hz. The second column depicts difference images of the frames immediately after and before UV exposure (only fluorescence increase is shown). To quantify fluorescence, regions of interests (ROIs) were placed on fluorescence-rich regions that appeared to be actin bundles (white circles in the left images). A background subtraction was performed in each frame (yellow ROI). Fluorescence values were averaged per cell, normalized to the values of the first frame and then averaged across cells. The right panel depicts the average normalized fluorescence per frame in both groups (+cg-PI(4,5)P2: red, No cg-PI(4,5)P2: black). The RFP fluorescence in the TIRF field increased in cells loaded with cg-PI(4,5)P2 after uncaging. (b) To verify PI(4,5)P2 uncaging in chromaffin cells, the low-affinity PI(4,5)P2-sensor PLCδ4-PH-EGFP was expressed and cells were imaged on a bright-field fluorescence microscope. Cells were either loaded for 30–45 min at 37°C with 25 µM cg-PI(4,5)P2 (+cg-PI(4,5)P2, top) or not loaded (No cg-PI(4,5)P2, bottom). After a single EGPF frame, a strong UV-flash was applied. Imaging was then resumed in the EGFP channel at 1 Hz. The second column depicts difference images of the frames immediately after and before UV-flash exposure (only fluorescence increase is shown). To quantify translocation of the PLCδ4-PH-EGFP probe, the ratio of EGFP fluorescence in the periphery (between the two yellow dotted circles) and the center of the cell (inner yellow dotted circle) was measured and normalized to pre-flash values. The right panel shows the frame-wise quantification of the average (cell wise) ratio in both groups (+cg-PI(4,5)P2: green, No cg-PI(4,5)P2: black). The fluorescence ratio increased in cells loaded with cg-PI(4,5)P2 after UV-uncaging, indicating release of PI(4,5)P2 in the plasma membrane. The fluorescence ratio relaxed to baseline with a mono-exponential time course (blue line). A second UV-flash applied 38.5 s after the first one also increased the ratio, but to a lesser degree. Scale bars 5 µm. All values are mean ±SEM. Mann-Whitney U-tests were used to calculate p-values. Number of cells (n): panel a: n = 6 cells (+cg-PI(4,5)P2), n = 5 cells (No cg-PI(4,5)P2). Panel b: n = 15 cells (+cg-PI(4,5)P2), n = 20 cells (No cg-PI(4,5)P2).
Figure 4 with 3 supplements
PI(4,5)P2 uncaging potentiates exocytosis in adrenal chromaffin cells, which depends on the lipid head group but does not alter depolarization-induced currents.
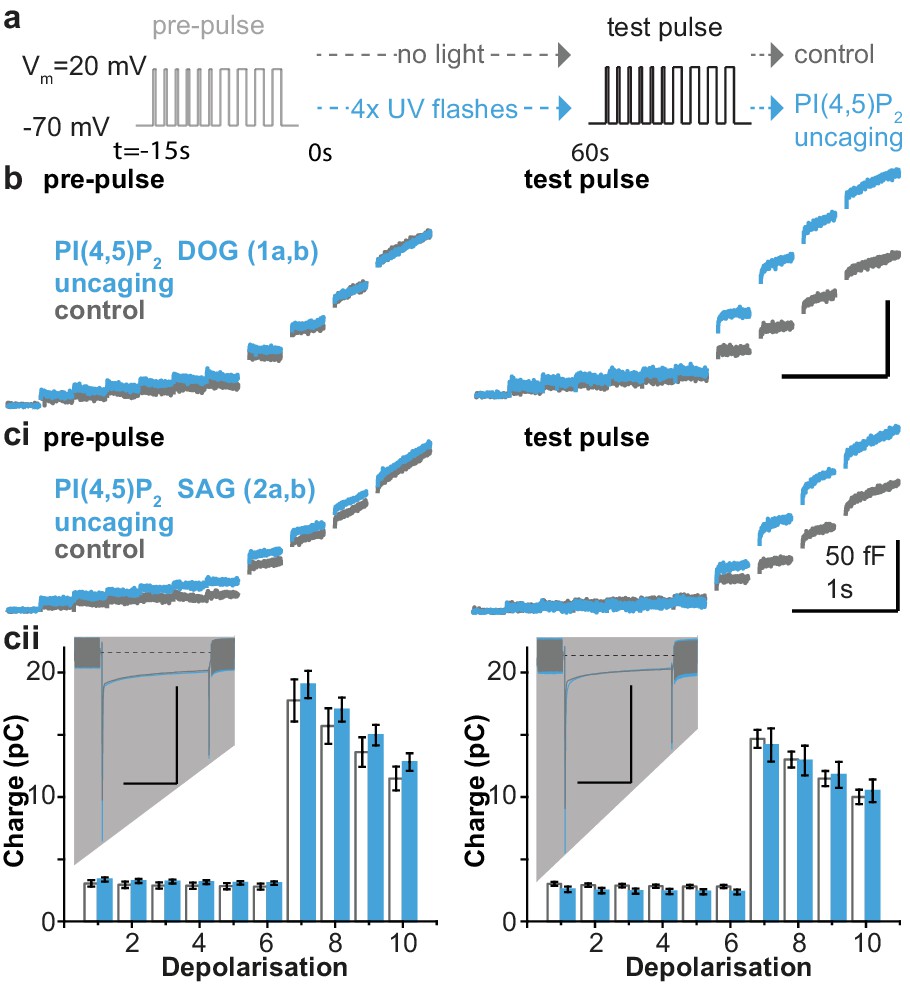
(a) Physiological stimulation paradigm to investigate the effect of PI(4,5)P2 uncaging on exocytosis. Cells were loaded with compounds 1a,b or 2a,b prior to experiments. After a pre-pulse of depolarizing voltage steps, cells were either subjected to UV uncaging (PI(4,5)P2 uncaging group) or not (control group). The effect of PI(4,5)P2 uncaging was investigated in a subsequent test pulse. The pre-pulse and the test pulse consisted of six brief (10 ms) and four longer (100 ms) depolarizations to allow Ca2+ influx and induce exocytosis (Voets et al., 1999). (b,ci) Whole-cell membrane capacitance measurements during the pre- and the test pulse were performed to quantify exocytosis (average traces are shown). (b) Uncaging a PI(4,5)P2 variant featuring a non-natural short-chain fatty acid composition (1a,b in Figure 1a) increased exocytosis during the test pulse. (ci) Uncaging of PI(4,5)P2 with the natural fatty acid composition (SAG, compound 2a,b, Figure 1a,b) had similar effects. (cii) Depolarization-induced cumulative currents (charges, Q, which mostly originate from Ca2+-currents) were similar between both groups for all 10 depolarization steps of pre- and test pulse. Insert: average currents during the first 100 ms depolarization, dashed line indicates baseline. Scale bar in the insert: 0.5 nA and 50 ms. See Figure 4—figure supplement 2 for corresponding analysis of compound 1a,b. Number of cells (n): n = 27 (wild type control, loaded with 1a,b), n = 26 (wild type PI(4,5)P2 uncaging, loaded with 1a,b); n = 23 (wild type control, loaded with 2a,b), n = 23 (wild type PI(4,5)P2 uncaging, loaded with 2a,b).
Figure 4—figure supplement 1

Incubation with cg-PI(4,5)P2 does not affect exocytosis.
Chromaffin cells were incubated with either 0.02% pluronic (Control) or 0.02% pluronic +25 µM cg-PI(4,5)P2 (+cg-PI(4,5)P2) for 30 min as described earlier. Reliable uptake of cg- PI(4,5)P2 was verified by the coumarin fluorescence at the end of the recording session (only for the +cg-PI(4,5)P2 group). (a) Average capacitance traces of exocytosis (left panel) elicited during the pre-pulse (a) and test pulse (b) stimulations of cells incubated with pluronic (Control) (dark red) or pluronic +cg-PI(4,5)P2 (light blue) and quantification (mean ±S.E.M) (right panel). The cells were not subjected to UV-light between the pre-pulse and test pulse. The release was identical from both groups during the pre-pulse and test pulse stimulation. Secretion from both groups recovered to comparable magnitudes during the test pulse as estimated by the CM (membrane capacitance) recovery (test pulse ΔCM_4 s/pre-pulse ΔCM_4 s) indicating that release was not influenced by the loading of cg-PI(4,5)P2. The calcium charges were calculated by integrating the currents during the depolarization pulses. Charges ratio were calculated by dividing the sum of charges in test pulse by the sum of charges in the pre-pulse. All the parameters were statistically tested using Student’s two-tailed t-test: pre-pulse: (IRP) p=0.9060, (RRP-IRP) p=0.9469, (total-RRP) p=0.4634, (calcium charges) p=0.8425; test pulse: (IRP) p=0.4078, (RRP-IRP) p=0.5360, (total-RRP) p=0.6249, (calcium charges) p=0.9344, (CM recovery) p=0.7082, (charges ratio) p=0.6618. Scale bars 25 fF/1 s. Number of cells (n) in electrophysiological recordings: n = 24 (Control), n = 21 (+cg-PI(4,5)P2).
Figure 4—figure supplement 2
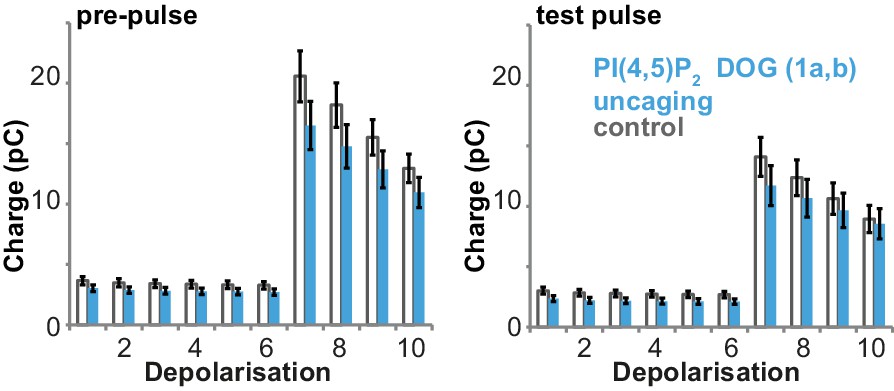
Uncaging of PI(4,5)P2 DOG (compound 1a,b in Figure 1a) does not alter depolarization-induced currents.
Depolarization-induced cumulative currents (charges mostly originating from Ca2+-currents) corresponding to the capacitance traces depicted in Figure 4b during the pre-pulse (left) and the test pulse (right). Uncaging of the PI(4,5)P2 analog (compound 1a,b) did not lead to increased depolarization induced charges. Number of cells (n): n = 27 (wild type control, loaded with 1a,b), n = 26 (wild type PI(4,5)P2 uncaging, loaded with 1a,b).
Figure 4—figure supplement 3
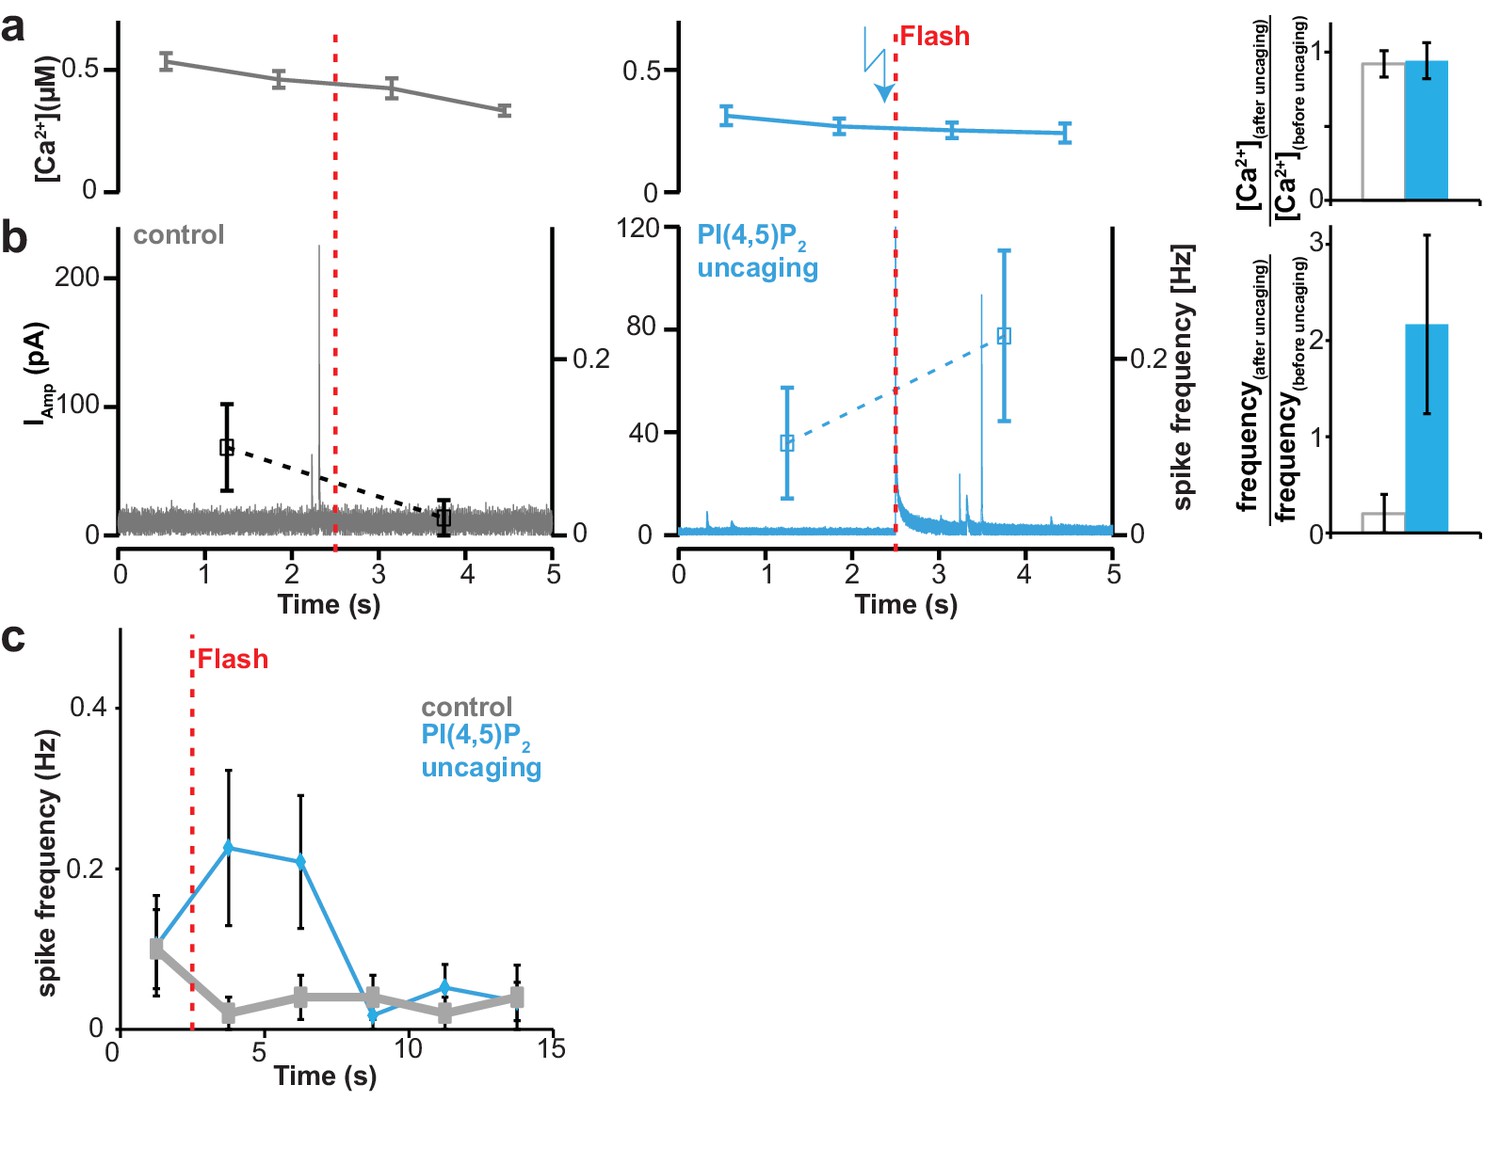
Uncaging of PI(4,5)P2 does not cause an increase of intracellular [Ca2+] but enhances the rate of single vesicle fusion events.
All cells were loaded with compound 2a,b, (Figure 1) and analyzed following a depolarization pre-pulse protocol as depicted in Figure 4a (not shown). (a) Measurements (once every second) of intracellular Ca2+ concentrations. A possible effect of PI(4,5)P2 uncaging was investigated. In the left panel no UV light for uncaging was applied (control, grey). Ca2+ levels are elevated due to the preceding pre-pulse and show relaxation behavior towards baseline levels. In the middle panel, a possible effect PI(4,5)P2 uncaging on intracellular Ca2+ concentration was investigated (PI(4,5)P2 uncaging group, blue). The timing of the flash is indicated by the vertical red dotted line. No increase of intracellular Ca2+ was observed upon uncaging. In the right panel, the ratios of the Ca2+ concentrations after uncaging divided by the Ca2+ levels prior to the flash were investigated in a cell-wise manner. No effect of PI(4,5)P2 uncaging was seen. (b) PI(4,5)P2 uncaging increases the rate of single vesicle fusion events monitored by amperometry, indicating an effect of PI(4,5)P2 uncaging on release in the absence of an effect on [Ca2+]. Amperometric current (continuous trace; left ordinate axis) to detect catecholamine release from single vesicle fusion events (spikes) and mean spike frequency (points with error bars depicting SEM; right ordinate axis) during a recording at a holding potential of Vm = −70 mV. In the left panel no UV light was applied (control, grey). In the middle panel PI(4,5)P2 was uncaged and the average frequency of vesicle fusion events was increased (PI(4,5)P2 uncaging group, blue). Please note that the transient coinciding with the uncaging flash is due to an artifact induced by the photoelectric effect when the light hits the amperometric fiber). The right panel depicts the ratio of single vesicle fusion frequencies in the 2.5 s bin after uncaging divided by the frequency in the 2.5 s bin preceding the flash. Opposite behaviors for both groups are seen. (c) Frequencies of single vesicle fusion events transiently increase following PI(4,5)P2 uncaging. Same data as in panel (b), but with extended view of event frequencies following the first two bins depicted above (note the extended time axis). The event frequency in both groups was investigated in 2.5 s long bins. The red vertical dashed line indicates the timing of the UV flash given in the uncaging group. All data are shown as mean ±SEM. Number of cells, n = 20 (control, loaded with cg-PI(4,5)P2 but not subjected to UV), n = 23 (PI(4,5)P2 uncaging). P values denote result of two-tailed Student’s t-test.
Figure 5 with 1 supplement
Uncaging of PI(4,5)P2, but not DAG augments exocytosis.
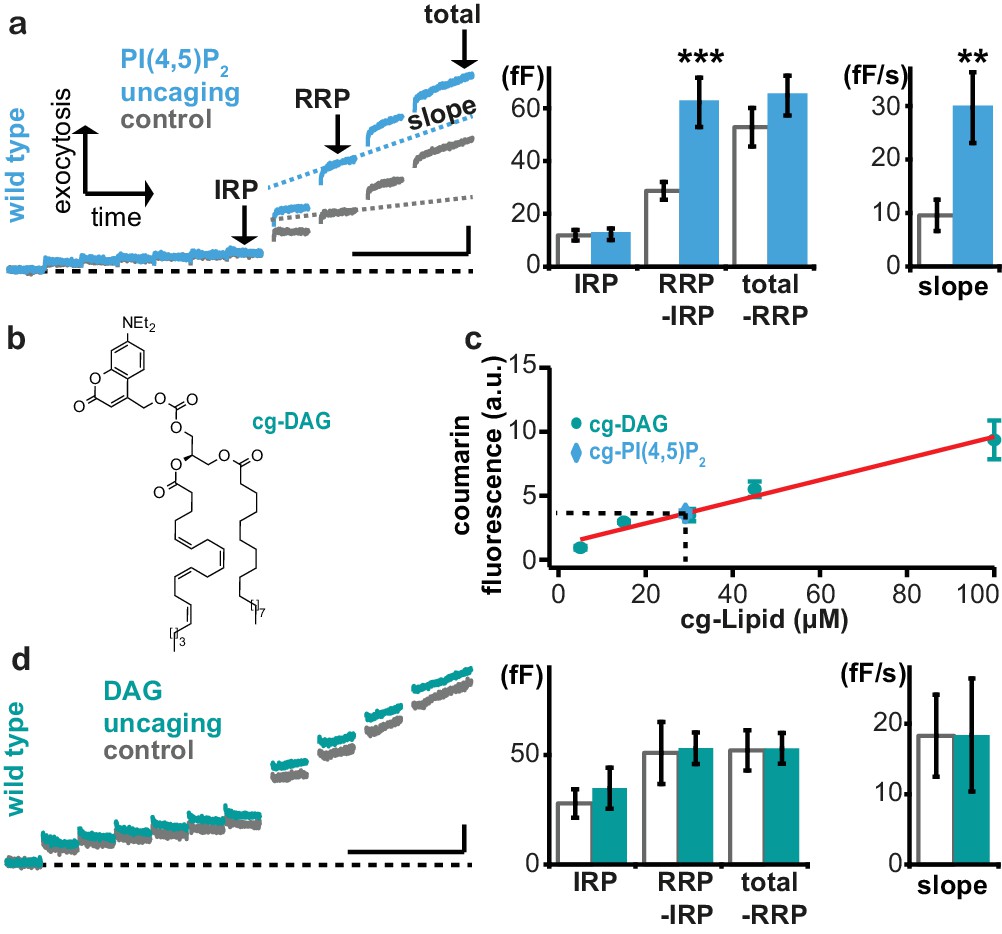
(a) Left panel: mean whole-cell capacitance responses during the test pulse of chromaffin cells loaded with cg-PI(4,5)P2 (data from compounds 1a,b and 2a,b pooled, uncaging group: blue, control group: grey). Different secretion phases are indicated. Right panel: cell-wise quantification. IRP = Immediately Releasable Pool; RRP = Readily Releasable Pool, slope = slope determined by linear fit of sliding capacitance. (b) Structure of caged DAG (cg-DAG). (c) Titration to determine the intracellular cg-PI(4,5)P2 concentration by comparison of coumarin fluorescence in cells loaded with known cg-DAG concentrations via the patch pipette, yielding [cg-PI(4,5)P2]=29 µM. (d) Left panel: depolarization-induced capacitance (average trace) elicited by the test pulse (same stimulation as in Figure 4a) in cells exposed to DAG uncaging (green), or not (grey, control). No augmentation was seen. Middle and right panel: quantification of IRP, RRP, total secretion and slope revealed no significant changes. Scale bars 20 fF/1 s. Statistical testing by unpaired Student’s t-test; **p<0.01; ***p<0.001. Number of cells (n): panel a: n = 50 (wild type control), n = 49 (wild type PI(4,5)P2 uncaging); panel c: n = 16 (cg-DAG 5 µM), n = 3 (cg-DAG 15 µM), n = 6 (cg-DAG 30 µM), n = 4 (cg-DAG 45 µM), n = 5 (cg-DAG 100 µM), n = 14 (cg-PI(4,5)P2), panel d: we used two different cg-DAG concentrations (cg-DAG, 45 µM = 6 cells and cg-DAG, 30 µM = 15 cells); pooled results are shown; n = 20 (wild type control), n = 21 (wild type DAG-uncaging).
Figure 5—figure supplement 1
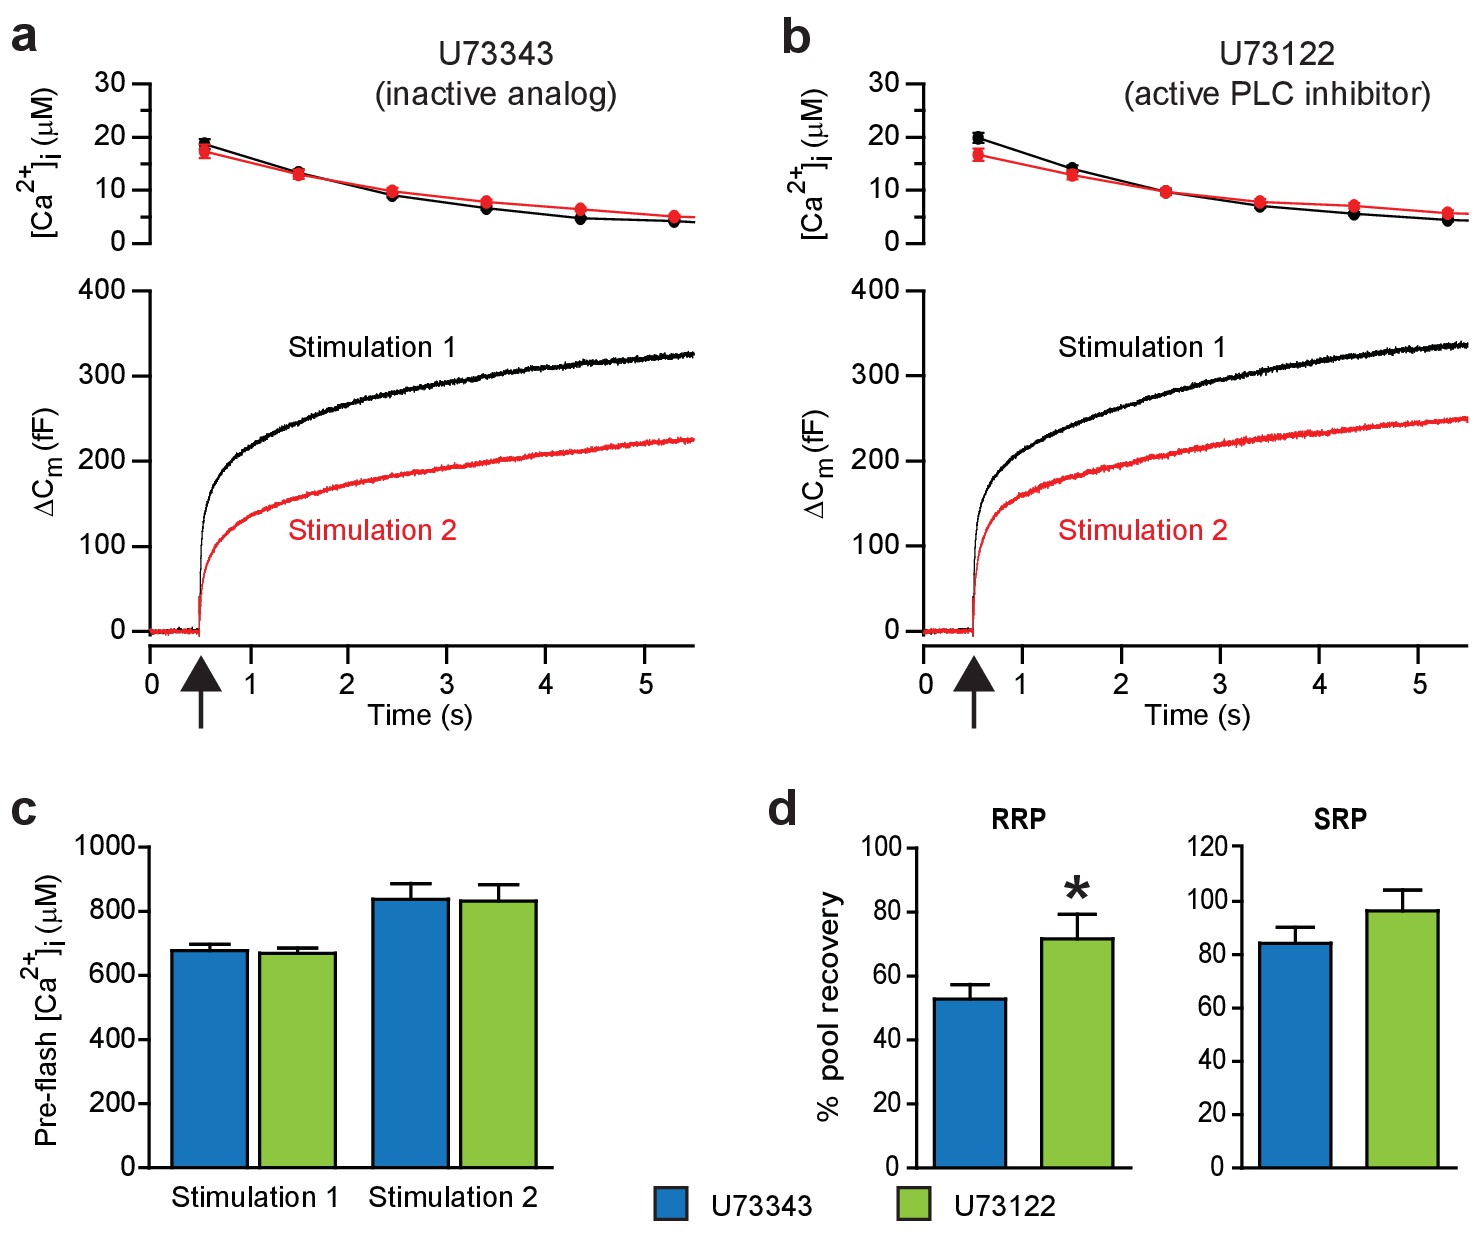
Blocking PI(4,5)P2-degradation to DAG augments recovery of the RRP.
These experiments measure exocytosis (capacitance changes) induced by sudden intracellular Ca2+ elevations. (a) Ca2+ uncaging (at arrow) stimulates fast and slow components of exocytosis. The response to a second Ca2+ uncaging (Stimulation 2, 100 s after Stimulation 1) is smaller. We reasoned that Ca2+ not only triggers the release of secretory vesicles from chromaffin cells, but also activates PLC, leading to PI(4,5)P2 hydrolysis. To test whether the lack of full recovery after the first stimulation might be due to an induction of PLC activity, we blocked PLC pharmacologically. Top panel: intracellular [Ca2+] (mean) following uncaging (at 0.5 s, see arrow). Bottom panel: average capacitance traces. Black traces are the first stimulation, red traces a second stimulation delivered 100 s later. Shown are mean traces from all measured cells. The inactive analog U73343 of the PLC inhibitor was present in the pipette (concentration 10 μM). (b) Similar experiment, but including the active PLC inhibitor (U73122, 10 μM) in the patch-clamp pipette. (c) The preflash (before uncaging) [Ca2+] (mean ±SEM) was unchanged between experiments performed with the active and the inactive compound (blue and green bars, respectively, a two-tailed Student’s t-test was used to test for differences between means, Stimulation 1: p=0.733; Stimulation 2: p=0.936). (d) Kinetic analysis of capacitance traces was used to identify the Readily-Releasable Pool (RRP) and the Slowly-Releasable Pool (SRP). The fractional recovery of the RRP (mean ±SEM) was significantly augmented by the active PLC-inhibitor (tested by a Student’s t-test p=0.0379 for RRP and p=0.323 for SRP). Number of cells, n = 36 (U73343), n = 36 (U73122). *p<0.05.
Figure 6 with 1 supplement
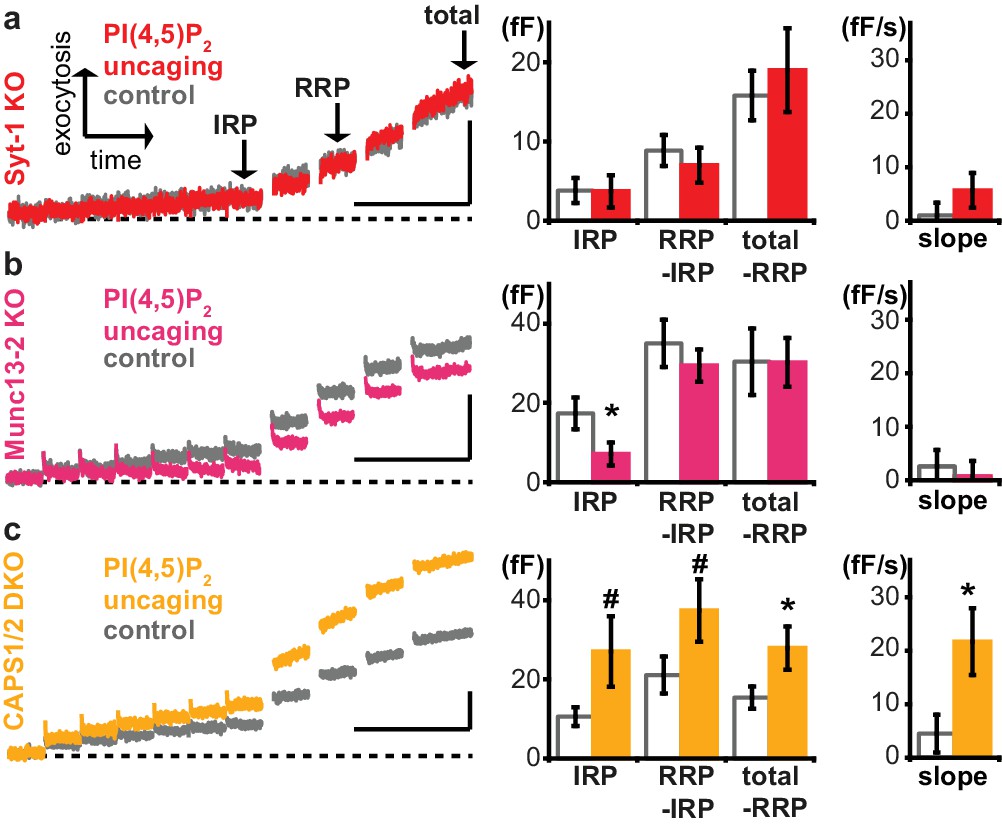
Exocytosis potentiation by PI(4,5)P2 uncaging requires synaptotagmin-1 and Munc13-2, but not CAPS.
(a–c) All cells were loaded with cg-PI(4,5)P2 prior to experiments and subjected to the stimulation paradigm shown in Figure 4a. Average whole-cell capacitance responses during the test pulse are shown and the secretion phases analyzed by cell-wise statistics (for secretion during the pre-pulse and further quantification see Figure 6—figure supplement 1). Cells were either subjected to UV uncaging (PI(4,5)P2 uncaging group) or not (control group). In Syt1-KO (a, red) and Munc13-2 KO (b, magenta) cells, exocytosis was not enhanced by PI(4,5)P2 uncaging. (c) In contrast, average exocytosis in CAPS 1/2 double knockout (DKO) cells (yellow) was increased. Scale bar 20 fF/1 s. Statistical testing by unpaired Student’s t-test; #p<0.08; *p<0.05. Number of cells (n): n = 33 (syt-1 KO control), n = 36 (syt-1 KO PI(4,5)P2 uncaging), n = 32 (Munc13-2 KO control), n = 37 (Munc13-2 KO PI(4,5)P2 uncaging), n = 21 (CAPS1/−2 DKO control), n = 20 (CAPS1/−2 DKO PI(4,5)P2 uncaging).
Figure 6—figure supplement 1
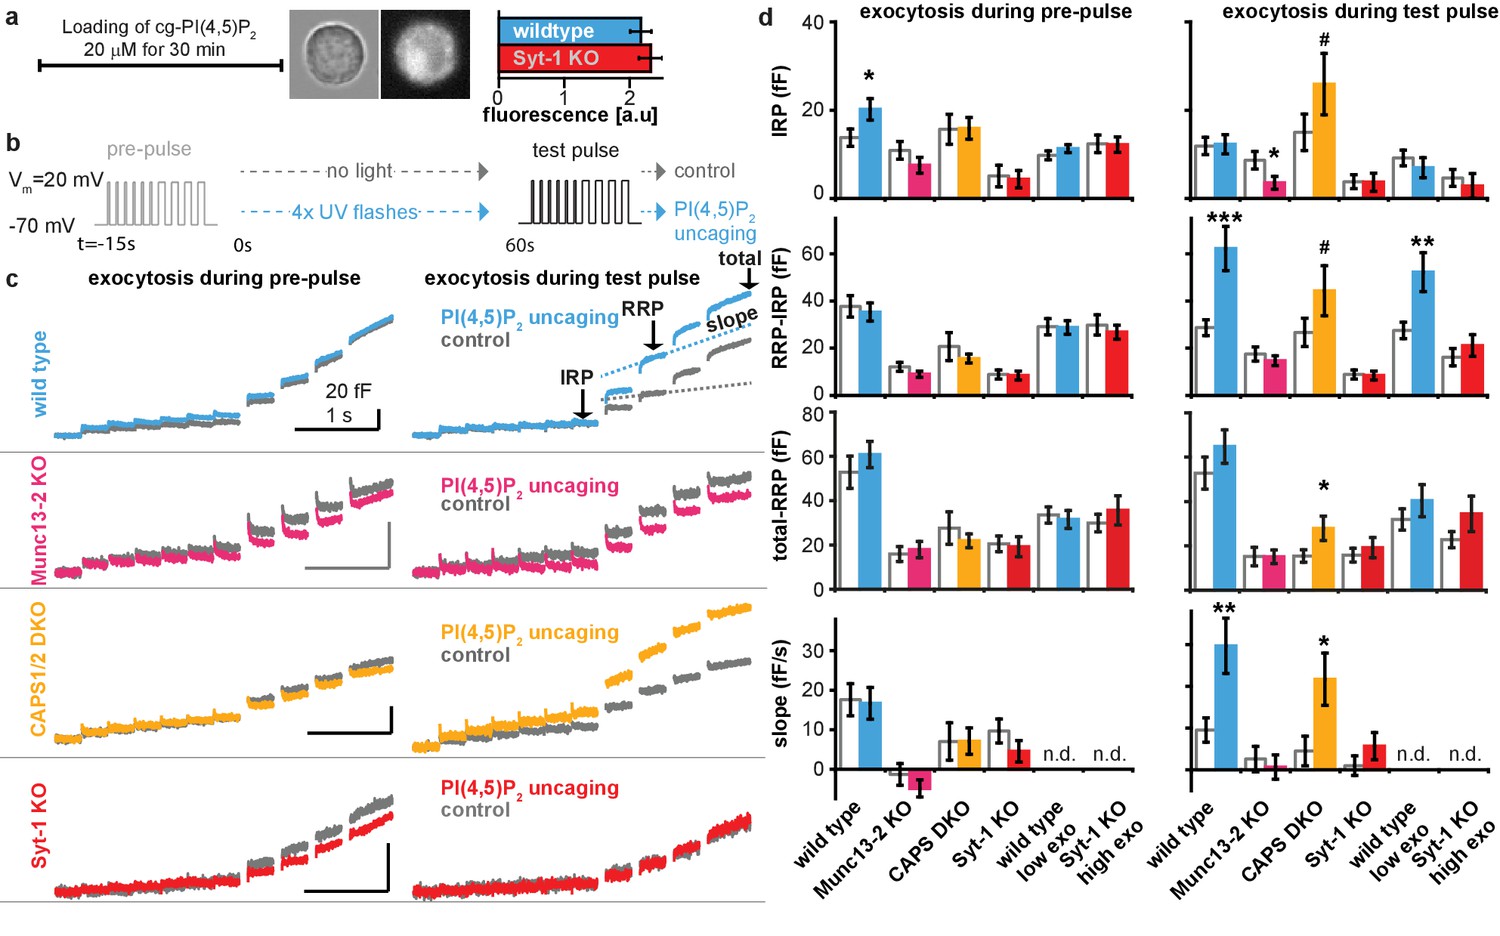
Uncaging cg-PI(4,5)P2 in-between the pre-pulse and the test pulse enhances exocytosis during the test-pulse.
Supplementary data figure of electrophysiological experiments depicted in Figures 5 and 6. (a) Loading protocol. Cells were incubated with cg-PI(4,5)P2 for 30 min leading to reliable uptake of cg-PI(4,5)P2 as indicated by the coumarin fluorescence (bright field and fluorescence images of a wildtype cell inserted, histogram shows mean intensity ± SEM, differences between means were tested by a Student’s two tailed t-test: p=0.533). (b) Physiological paradigm to investigate the effect of PI(4,5)P2 uncaging on exocytosis. (c) Average capacitance traces of exocytosis elicited during the pre-uncaging depolarization train (pre-pulse, left) and during the identical test pulse (right). The average exocytosis of wild type (light blue), Munc13-2 KO (magenta), CAPS1/−2 DKO (yellow) and syt-1 KO (red) which were subjected to UV uncaging in-between the pre- and the test pulse are shown together with their respective controls (grey, no uncaging). As expected, exocytosis in response to the pre-pulse was identical between cells in the uncaging group compared to their controls (due to identical treatment at this stage, the distinction in terms of light treatment occurs later). (d) Quantification (mean ±SEM) of data in (c), performed as outlined in Figure 5a for all genotypes. To investigate whether the magnitude of exocytosis influenced the PI(4,5)P2-sensitivity, we analyzed subsets of wild type cells with intrinsically low exocytosis (wild type low exo, with suitable maximal thresholds (0 < IRP < 20 fF, 0<(RRP-IRP)<80 fF, 0<(total-RRP)<65 fF) during pre-pulse) and of syt-1 KO cells with intrinsically higher exocytosis (syt-1 KO high exo, with suitable minimal thresholds (3 fF <IRP, 12 fF<(RRP-IRP), 8 fF<(total-RRP)) during pre-pulse). While release could still be augmented in wild type cells with low release, PI(4,5)P2 uncaging was without effect in syt-1 KO cells with high release. These data argue that the absence of potentiation by PI(4,5)P2 uncaging in syt-1 KO cells is not caused by the lower total exocytosis in these cells, which is in line with the augmenting effect observed in CAPS1/−2 DKO cells, which also have reduced exocytosis. Statistically significant differences between the means were tested using Student’s two-tailed t-test: pre-pulse wild type: (IRP) p=0.0439, (RRP-IRP) p=0.686, (total-RRP) p=0.857, (slope) p=0.868; test-pulse wild type (IRP) p=0.896, (RRP-IRP) p=0.000999, (total-RRP) p=0.256, (slope) p=0.00601; pre-pulse Munc13-2KO: (IRP) p=0.210, (RRP-IRP) p=0.183, (total-RRP) p=0.691, (slope) p=0.311; test-pulse Munc13-2KO (IRP) p=0.0391, (RRP-IRP) p=0.431, (total-RRP) p=0.999, (slope) p=0.650; pre-pulse CAPS DKO: (IRP) p=0.466, (RRP-IRP) p=0.840, (total-RRP) p=0.487, (slope) p=0.989; test-pulse CAPS DKO (IRP) p=0.0762, (RRP-IRP) p=0.0778, (total-RRP) p=0.0449, (slope) p=0.0200; pre-pulse Syt-1KO: (IRP) p=0.813, (RRP-IRP) p=0.149, (total-RRP) p=0.823, (slope) p=0.212; test-pulse Syt-1 KO (IRP) p=0.645, (RRP-IRP) p=0.537, (total-RRP) p=0.607, (slope) p=0.258; pre-pulse wild type low exo: (IRP) p=0.286, (RRP-IRP) p=0.930, (total-RRP) p=0.708; test-pulse wild type low exo (IRP) p=0.448, (RRP-IRP) p=0.00725, (total-RRP) p=0.356; pre-pulse Syt-1 KO high exo: (IRP) p=0.954, (RRP-IRP) p=0.593, (total-RRP) p=0.447; test-pulse Syt-1KO high exo (IRP) p=0.590, (RRP-IRP) p=0.417, (total-RRP) p=0.147. #p<0.08; *p<0.05, ***p<0.001. Scale bars 20 fF/1 s. n.d.: not determined. Number of cells (n) in electrophysiological recordings: n = 50 (wild type control), n = 49 (wild type PI(4,5)P2 uncaging), n = 21 (CAPS1/−2 DKO control), n = 20 (CAPS1/−2 DKO PI(4,5)P2 uncaging), n = 32 (Munc13-2 KO control), n = 37 (Munc13-2 KO PI(4,5)P2 uncaging), n = 33 (syt-1 KO control), n = 36 (syt-1 KO PI(4,5)P2 uncaging).
Figure 7 with 1 supplement

Uncaging PI(4,5)P2 induces rapid exocytosis.
(a) PI(4,5)P2 uncaging rapidly increased membrane capacitance measured during the first uncaging flash (stimulation protocol: see Figure 4a), indicative of fast vesicle fusion. Averaged capacitance traces during the first uncaging flash are shown for wild type (WT, light blue), Syt-1 KO (red), Munc13-2 KO (magenta) and CAPS1/−2 DKO (yellow) and together with their respective controls (no UV light, grey). Note that the uncaging event follows the first depolarization train, and in the syt-1 KO there is still some ongoing, delayed secretion, as indicated by the upward ‘sloping’ control trace. (b) In wild type cells, the size of the capacitance step was highly correlated to the size of the readily releasable pool (RRP; assayed during the pre-pulse – see Figure 4a). Data are median values ± SEM of cells sorted by their RRP size and binned. The correlation (corr. R²-value: 0.97) indicates that the capacitance step is likely caused by rapid fusion of RRP vesicles. (c) Quantification of traces depicted in (a). Shown is the average capacitance increase (from the first to the last value shown in (a)) in control (no UV light, grey) and uncaging groups. Statistical testing by unpaired Student’s t-test; *p<0.05; **p<0.01; ***p<0.001. Number of cells (n): n = 50 (wild type, control, data of the compounds 1a,b and 2a,b were pooled), n = 49 (wild type, PI(4,5)P2 uncaging, data of the compounds 1a,b and 2a,b were pooled), n = 21 (CAPS1/−2 DKO control), n = 20 (CAPS1/−2 DKO PI(4,5)P2 uncaging), n = 32 (Munc13-2 KO control), n = 37 (Munc13-2 KO PI(4,5)P2 uncaging), n = 33 (Syt-1 KO control), n = 36 (syt-1 KO PI(4,5)P2 uncaging).
Figure 7—figure supplement 1
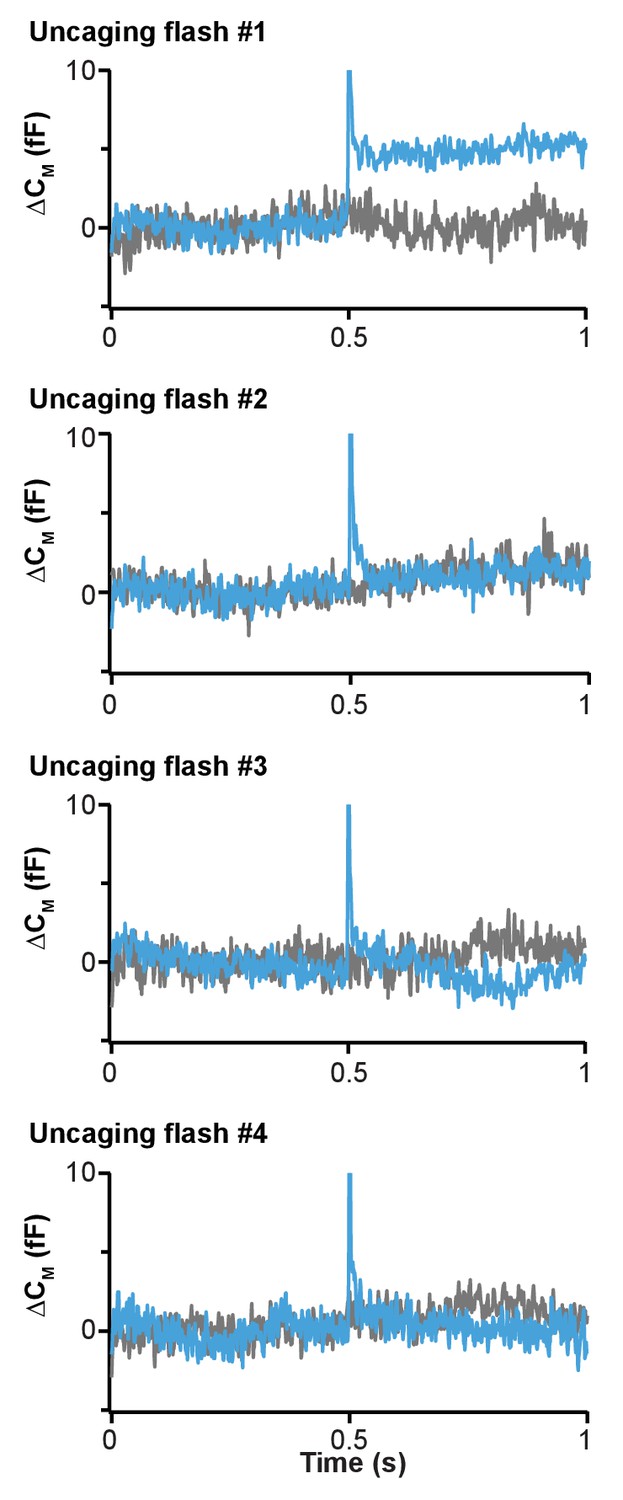
Fast release of vesicles upon first PI(4,5)P2 uncaging event in wild type chromaffin cells.
Our uncaging protocol in chromaffin cells included four sequential uncaging pulses every 15 s. Figure 7 shows only the average capacitance traces during the first uncaging. Here, the membrane capacitance traces (means of all cells loaded with 1a,b) around the time of all four uncaging pulses (lasting 1–2 ms, see Methods) are shown. Light blue traces: wild type cells that were exposed to uncaging flashes; grey traces: wild type cells not exposed to uncaging flashes (same cells as in Figures 4 and 5). The uncaging flash was delivered in the middle of the trace (at 0.5 s). Note that the ‘spike’ in the blue trace is an electrical interference artifact due to the discharge of the flash lamp. At the time of the first flash, the capacitance jumped by ~5 fF, which corresponds to the fast fusion of ~5 vesicles. In subsequent flashes, no capacitance jumps were detected, indicating that the discharge of the flash lamp itself does not cause a capacitance jump. These data are consistent with fast fusion of vesicles triggered by PI(4,5)P2 uncaging.
Figure 8
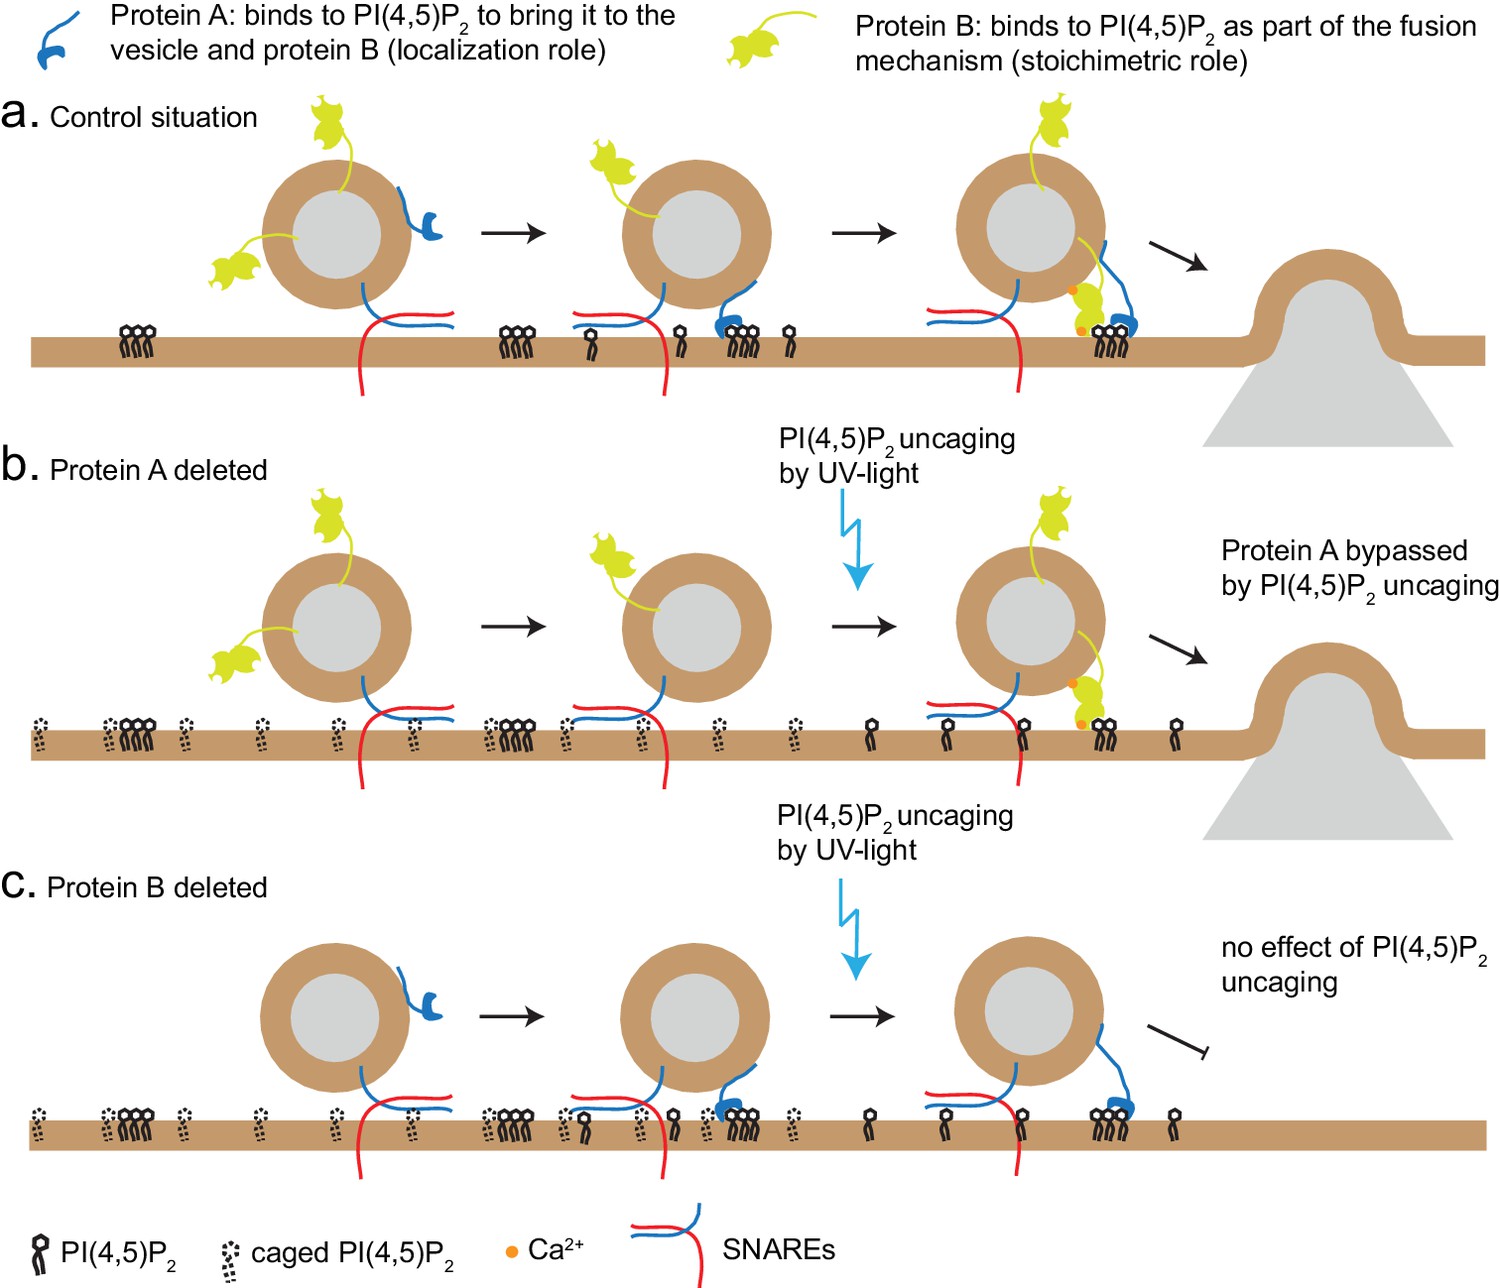
Uncaging PI(4,5)P2 distinguishes mechanism of lipid-binding.
Two different roles of lipid-binding proteins can be distinguished by lipid uncaging: protein A (e.g. CAPS) binds to PI(4,5)P2 in order to bring it to the vesicle and fusion machinery (localization role); protein B (e.g. synaptotagmin-1) binds to PI(4,5)P2 as an obligatory part of its mechanism (stoichiometric role). (a) In the control situation, protein A colocalizes PI(4,5)P2 with protein B, leading to fusion. (b). Upon deletion of protein A, protein B is unable to interact with PI(4,5)P2. Uncaging uncovers PI(4,5)P2 underneath the vesicle, allowing protein B to interact and support secretion. Thus, the defect (lack of protein A) is bypassed by PI(4,5)P2 uncaging. (c) Upon deletion of protein B, protein A still co-localizes PI(4,5)P2 with the vesicle, but protein B is missing and PI(4,5)P2 uncaging does not overcome the defect.
Chemical structure 1
Synthesis of head group 10a,b.
https://doi.org/10.7554/eLife.30203.018
Chemical structure 2
Synthesis of 1a,b.
https://doi.org/10.7554/eLife.30203.019
Chemical structure 3
Synthesis of 2a,b.
https://doi.org/10.7554/eLife.30203.020
Chemical structure 4

Structure determination of 4- and 5-isomers.
https://doi.org/10.7554/eLife.30203.021
Chemical structure 5
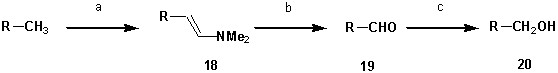
Synthesis of 7-diethylamino-4-hydroxymethyl-2-oxo-2H-chromen 20.
https://doi.org/10.7554/eLife.30203.022Tables
Key resources table
| Reagent type (species) or resource | Designation | Source or reference | Identifiers | Additional information |
|---|---|---|---|---|
| strain, strain background (Mus.musculus) | CD1 | Department of Experimental Medicine, Faculty of Health and Medical Sciences, Unviersity of Copenhagen. | ||
| genetic reagent (M.musculus) | Syt-1 nul allele (gene symbol: syt1) | Geppert et al., 1994 | PMID: 18308932 | |
| genetic reagent (M.musculus) | Munc13-2 null allele (gene symbol: Unc13b) | Varoqueaux et al., 2002 | PMID: 12070347 | |
| genetic reagent (M.musculus) | CAPS1 null allele (gene symbol: Cadps) | Speidel et al., 2005 | PMID: 15820695 | |
| genetic reagent (M.musculus) | CAPS2 null allele (gene symbol: Cadps2) | Jockusch et al., 2007 | PMID: 18022372 | |
| cell line (HEK 293T) | HEK 293T | ATCC | CRL-1573 | Experiments in Figure 2b |
| cell line (HEK 293T) | HEK 293T | A gift from Dr. Theres Schaub and Prof Victor Tarabykin, Institute of Cell Biology and Cell Biology, Charité Berlin | Experiments Figure 3a | |
| cell line (COS-7) | COS-7 | ATCC | CRL-1651 | |
| cell line (tsA201) | tsA201 | Sigma-aldrich | Sigma-aldrich: 96121229 | |
| transfected lentiviral construct (p156rrl-pCMV- PLCδ4PH-EGFP) | PLCδ4-PH-GFP | This paper | Local reference: 131 | plasmid with PLCδ4 received from Thomas F. J. Martin (Department of Biochemistry, University of Wisconsin) |
| transfected construct (pCMV-PLCδ1-PH-EGFP) | PLCδ1-PH-GFP | Michael Krauss (Leibniz- Forschungsinstitut für Molekulare Pharmakologie, Berlin, Germany). | ||
| transfected construct (pCMV-PLCδ1-PH-RFP) | PLCδ1-PH-RFP | Ken Mackie (The Gill Center for Biomolecular Science, Bloomington, Indiana) | ||
| transfected construct (pCMV-mcherry-INPP5E) | mCh-INPP5E | Posor et al., 2013 | ||
| transfected construct (pCMV-mRFPruby- N1*Lifeact) | lifeact-RFP | Geerd van den Bogaart (Radboud University Medical Center, Nijmegen, The Netherlands) | PMID: 18536722 | |
| commercial assay or kit | QIAprep Spin Miniprep Kit | Qiagen | ||
| commercial assay or kit | QIAquick Gel Extraction Kit | Qiagen | ||
| commercial assay or kit | QIAquick PCR Purification Kit | Qiagen | ||
| chemical compound, drug | DMSO | Sigma-aldrich | Sigma-aldrich: D8418 | |
| chemical compound, drug | Ascorbic aci | Sigma-aldrich | Sigma-aldrich: A5960 | |
| chemical compound, drug | CaCl2 | Sigma-aldrich | Sigma-aldrich: 499609 | |
| chemical compound, drug | CellMask | Invitrogen | Invitrogen: C10046 | |
| chemical compound, drug | CsOH | Sigma-aldrich | Sigma-aldrich 516988 | |
| chemical compound, drug | DMEM | Gibco/Thermo Fisher | Gibco/Thermo Fisher: 31966047 | Experiments in Figure 3a |
| chemical compound, drug | DMEM | Lonza | Lonza: BE12-741F | Experiments in Figure 2b,c |
| Chemical compound, drug | HBSS | Gibco/Thermo Fisher | 14025–050 | |
| chemical compound, drug | caged DOG-PI(4,5)P2 | This paper | European Molecular Biology Laboratory (EMBL), Cell Biology and Biophysics Unit, Meyerhofstr. 1, 69117 Heidelberg, Germany. Att: Carsten Schultz (schultz@embl.de) | |
| chemical compound, drug | EDTA | Sigma-aldrich | Sigma-aldrich: E5134 | |
| chemical compound, drug | Fetal Bovine Serum (FBS) | Gibco/Thermo Fisher | Thermo Fisher/Gibco: 16140063 | Experiments in Figure 3a |
| chemical compound, drug | Fetal Bovine Serum (FBS) | Gibco/Thermo Fisher | Thermo Fisher/Gibco: 10270–106 | Experiments in Figure 2b,c |
| chemical compound, drug | Fura-4F | Invitrogen | Invitrogen: F14174 | |
| chemical compound, drug | Furaptra | Invitrogen | Invitrogen: M1290 | |
| chemical compound, drug | Glucose | Sigma-aldrich | Sigma-aldrich: G8270 | |
| chemical compound, drug | HEPES | Sigma-aldrich | Sigma-aldrich: H3375 | |
| chemical compound, drug | Insulin-transferrin- selenium-X | Invitrogen | Invitrogen: 51500056 | |
| chemical compound, drug | KCl | Sigma-aldrich | Sigma-aldrich: P5405 | |
| chemical compound, drug | L-Cysteine | Sigma-aldrich | Sigma-aldrich: C7352 | |
| chemical compound, drug | L-Glutamic acid | Sigma-aldrich | Sigma-aldrich: G1251 | |
| chemical compound, drug | Lipofectamin 2000 | Thermo Fisher | Thermo Fisher: 11668027 | |
| chemical compound, drug | Lipofectamin LTX | Thermo Fisher | Thermo Fisher: 15338100 | |
| chemical compound, drug | Opti-MEM I Reduced Serum Medium | Thermo Fisher | Thermo Fisher: 31985070 | |
| chemical compound, drug | Dulbecco's Modified Eagle Medium | Thermo Fisher | ThermoFirsher: 31966021 | |
| chemical compound, drug | Mg-ATP | Sigma-aldrich | Sigma-aldrich: A9187 | |
| chemical compound, drug | MgCl2 | Sigma-aldrich | Sigma-aldrich: 449172 | |
| chemical compound, drug | NaCl | Sigma-aldrich | Sigma-aldrich: S9888 | |
| chemical compound, drug | Na-GTP | Sigma-aldrich | Sigma-aldrich: G8877 | |
| chemical compound, drug | NaH2PO4 | Sigma-aldrich | Sigma-aldrich: S8282 | |
| chemical compound, drug | NPE | Synaptic Systems | SySy: 510 006 | |
| chemical compound, drug | Papain | Worthington Biochemical | Worthington Biochemical: LS003126 | |
| chemical compound, drug | Penicillin/ streptomycin | Invitrogen | Invitrogen: 15140122 | |
| chemical compound, drug | Pluronic F-127 | Thermo Fisher | Thermo Fisher: P3000MP | |
| chemical compound, drug | cg-DAG | Nadler et al., 2013 | PMID: 23720390 | |
| chemical compound, drug | caged SAG-PI(4,5)P2 | This paper | European Molecular Biology Laboratory (EMBL), Cell Biology and Biophysics Unit, Meyerhofstr. 1, 69117 Heidelberg, Germany. Att: Carsten Schultz (schultz@embl.de) | |
| chemical compound, drug | trypsin-inhibitor | Sigma-aldrich | Sigma-aldrich: T9253 | |
| chemical compound, drug | U73122 | Sigma-aldrich | Sigma-aldrich: U6756 | |
| chemical compound, drug | U73343 | Sigma-aldrich | Sigma-aldrich: U6881 | |
| software, algorithm | Igor Pro | Wavemetrics | ||
| ImageJ version 1.50b | Waybe Rasband, National Institute of Health, USA | |||
| SigmaPlot v. 12.3 | Systat Software Inc. | |||
| Matlab | MathWorks |
Additional files
-
Transparent reporting form
- https://doi.org/10.7554/eLife.30203.023
Download links
A two-part list of links to download the article, or parts of the article, in various formats.
Downloads (link to download the article as PDF)
Open citations (links to open the citations from this article in various online reference manager services)
Cite this article (links to download the citations from this article in formats compatible with various reference manager tools)
Phosphatidylinositol 4,5-bisphosphate optical uncaging potentiates exocytosis
eLife 6:e30203.
https://doi.org/10.7554/eLife.30203


