Suppression and facilitation of human neural responses
- University of Washington, United States
- Johns Hopkins University, United States
Figures
Figure 1

Common assumptions.
The direction of motion of a small stimulus (A); contrast = 98%, diameter = 2°) can be perceived after a shorter presentation duration than a larger stimulus (B); diameter = 12°). This has been suggested to reflect the inhibitory influence of the extra-classical RF surround (red arrows) in motion-sensitive neurons in MT. Suppression turns to facilitation at low contrast (C; 3%), which has been assumed to reflect excitation from the surround and/or expansion of the classical RF. Orange ring represents the size of RFs in the foveal region of MT as measured in macaques (Raiguel et al., 1995; Liu et al., 2016). Comparable RF sizes in human MT are assumed (Tadin et al., 2003; Amano et al., 2009).
Figure 2
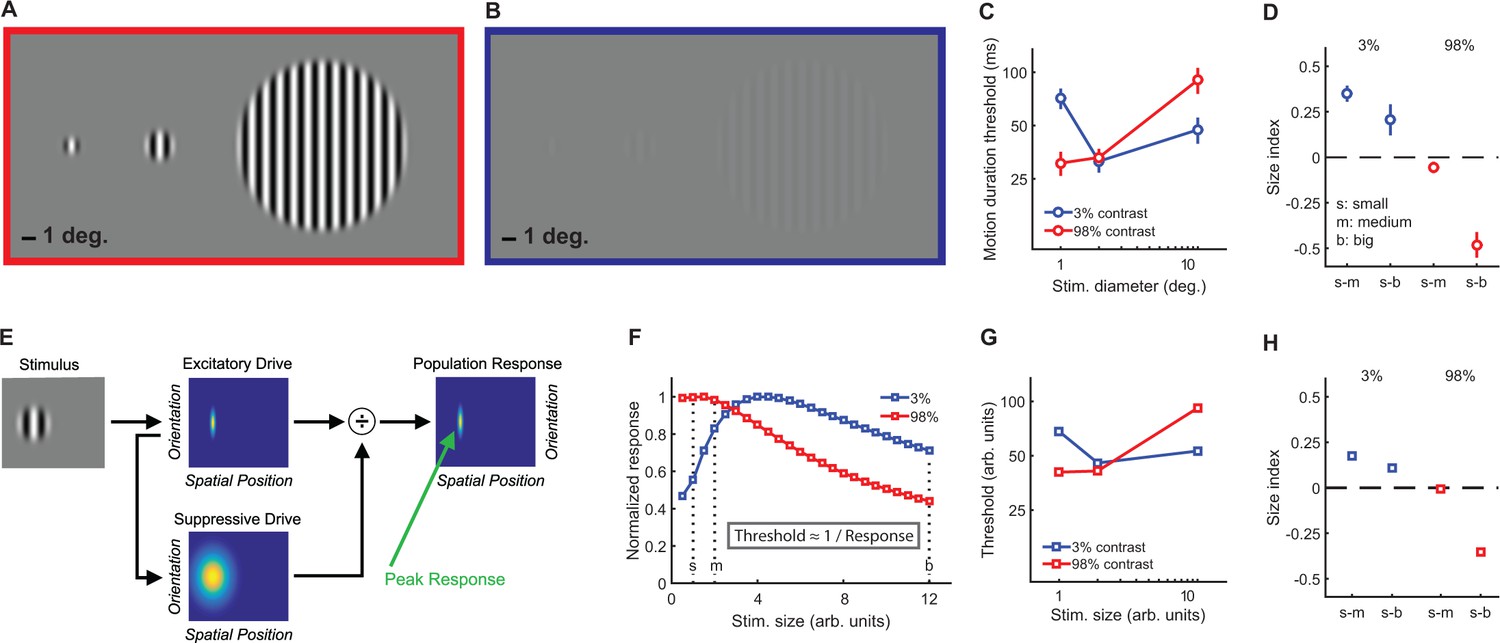
Stimuli, psychophysical results, and modeling.
Small, medium, and big stimuli at high (A) and low contrast (B). The amount of time required to discriminate left- vs. right-moving stimuli with 80% accuracy (threshold in ms) is shown in (C) (average across N = 10 subjects, error bars are mean ± s.e.m.). Size indices (D) show the effect of increasing stimulus size, where negative values indicate that thresholds increase (suppression) and positive values indicate decreased thresholds (summation). A schematic representation of the normalization model is presented in (E) (for full model details, see Appendix 1), with the peak predicted responses for different stimulus sizes and contrasts shown in (F) (responses for both contrasts normalized to a maximum value of 1). As noted in the inset, predicted thresholds for motion discrimination are inversely proportional to these peak responses. Thresholds (G) and size indices (H) predicted by the model show a good qualitative match to the psychophysical data (C and D).
Figure 3 with 1 supplement
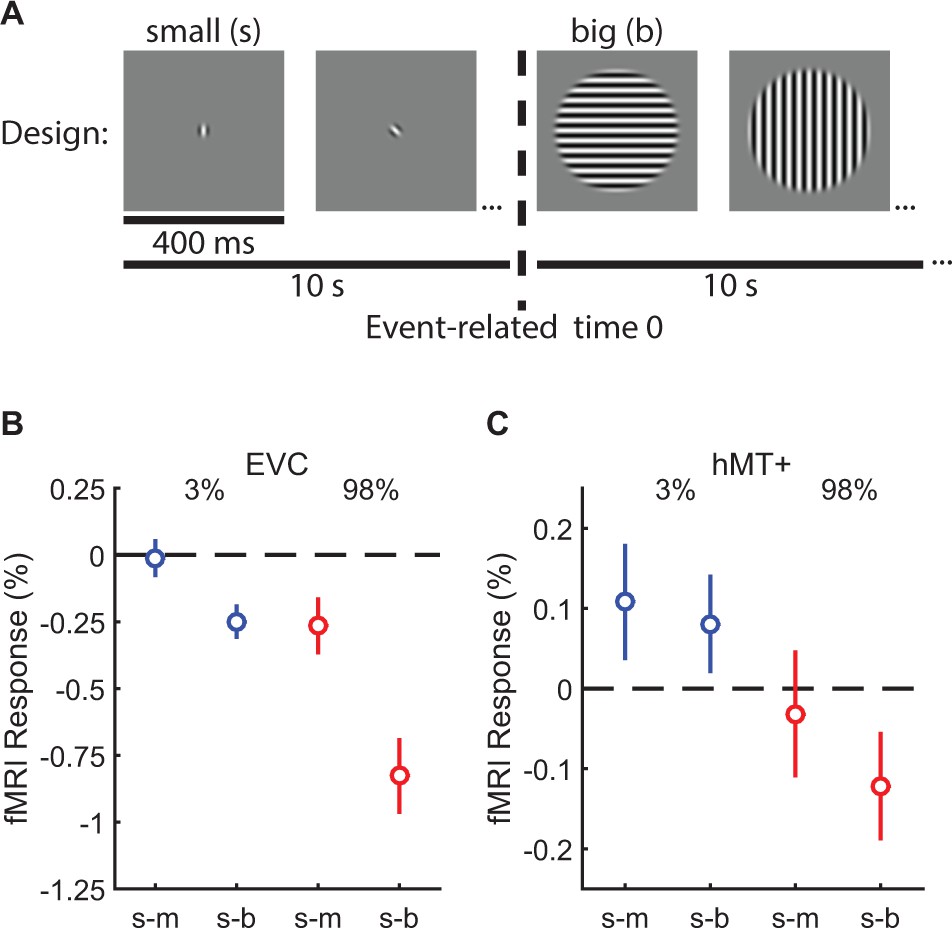
Measuring suppression and summation using functional MRI.
This experiment measured the response to increasing stimulus size within regions of visual cortex representing the smallest stimulus. ROIs were localized in N = 10 subjects in EVC and N = 8 in hMT+. The blocked experimental design is illustrated in (A). Drifting gratings (400 ms on, 225 ms blank) of a particular size were presented within 10 s blocks. In (B), we show the change in the fMRI response within EVC and hMT + following the increase in stimulus size from small to medium (s–m) or small to big (s–b). The response to low-contrast stimuli (3%) is shown in blue, high contrast (98%) in red. Error bars are mean ± s.e.m. .
Figure 3—figure supplement 1
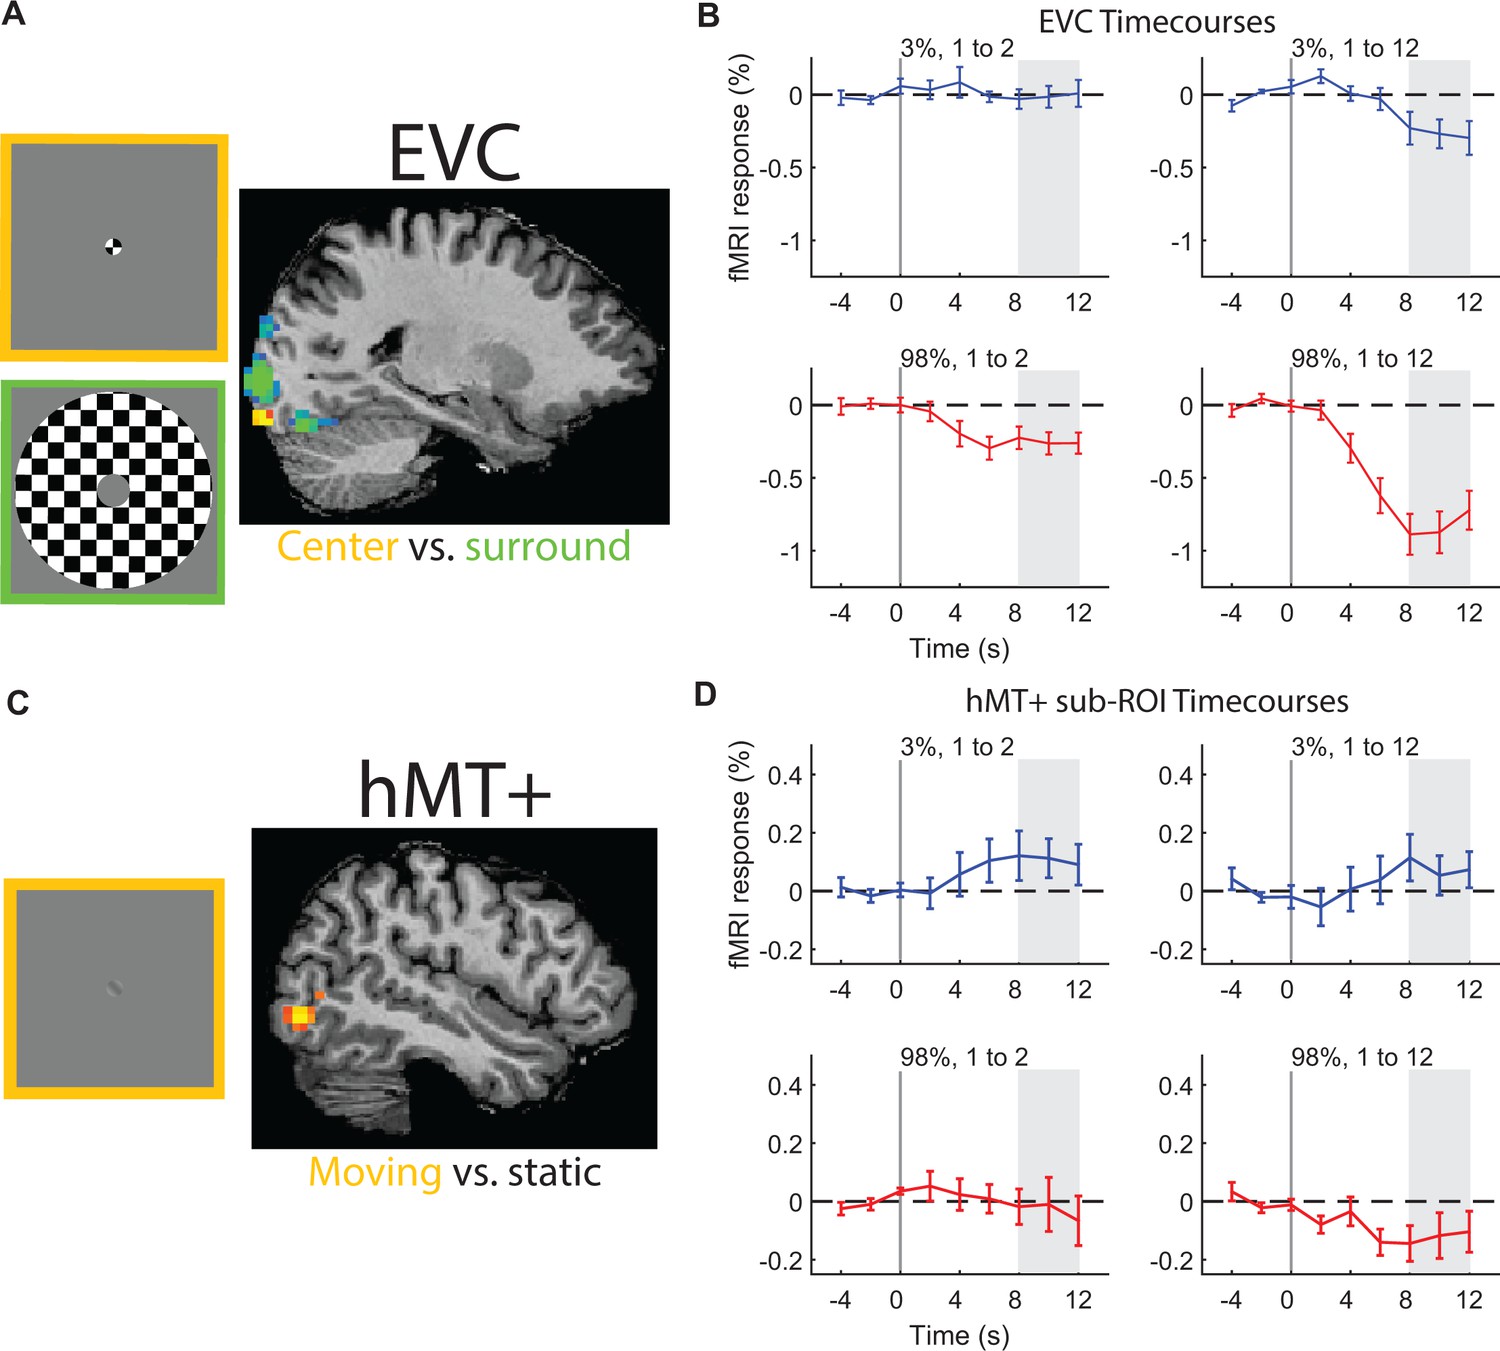
Regions-of-interest (ROIs) and response time courses for size-dependent fMRI responses.
In (A), center (orange) and surrounding (green) localizer stimuli are shown on the left. On the right, an example ROI in EVC was defined from voxels whose time course correlated positively with presentation of the center stimulus (orange; see Materials and methods). Average time courses (B) from EVC ROIs for low (blue) and high contrast (red) stimuli from N = 10 subjects. At time = 0 s (vertical line), stimulus size increased from 1 to 2° (left) or 1 to 12° (right). Gray region shows the time period where the peak response was calculated (shown in Figure 3). Error bars are mean ± s.e.m. An example of the hMT+ localizer stimulus (left) and the motion-selective ROI (right) are shown in (C). Within this hMT+ ROI, a sub-region was identified that also responded selectively to the center > surround localizer (from A, see Materials and methods). Sub-ROIs from hMT+ were identified in N = 8 subjects. Response time courses for hMT+ sub ROIs (D) are shown, as in (B).
Figure 4 with 1 supplement
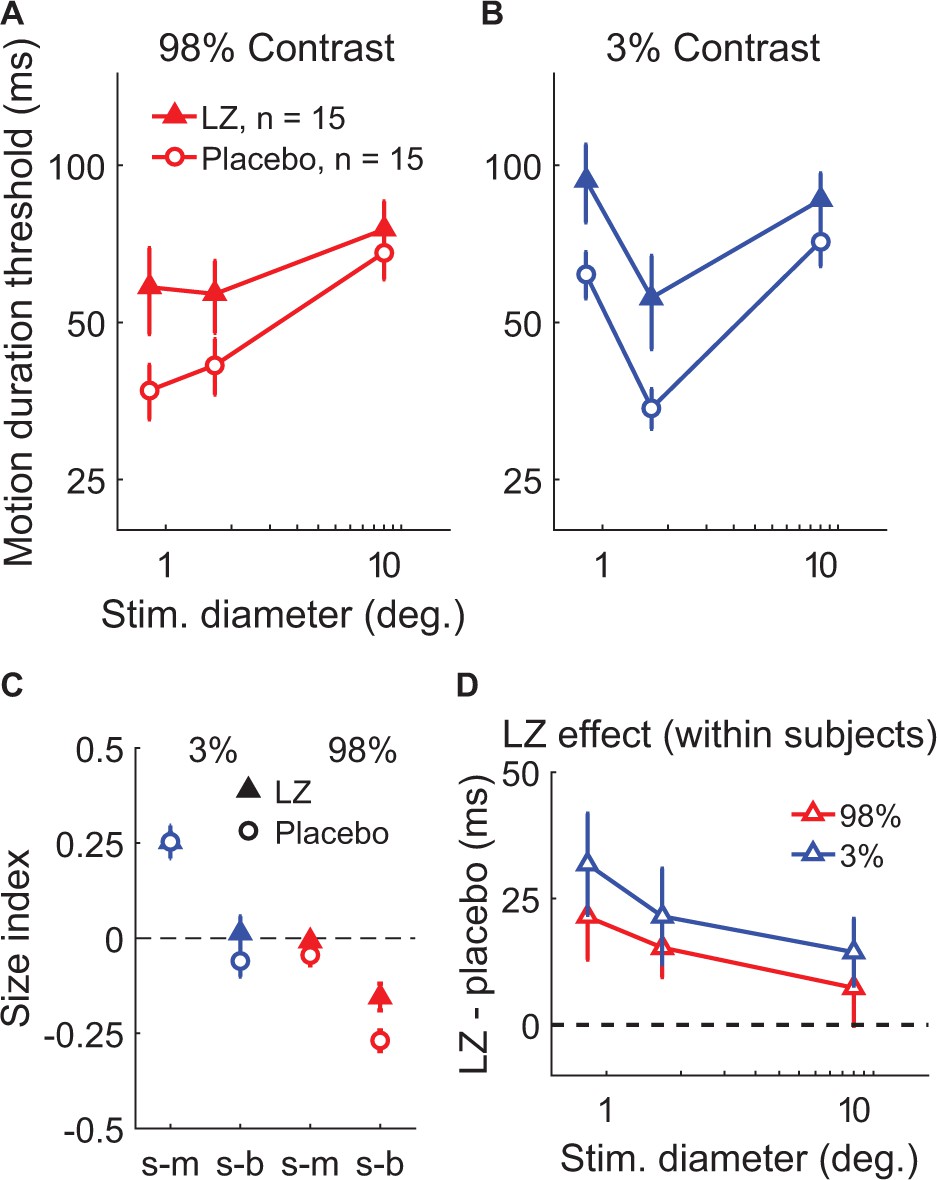
The effect of lorazepam on spatial suppression.
Fifteen subjects took lorazepam (LZ) or placebo in a double-blind, crossover experiment. Duration thresholds were measured for high- (A) and low-contrast (B) moving gratings in each session. Size indices (C) and within-subjects effects of the drug (D) were calculated. Error bars are mean ± s.e.m.
Figure 4—figure supplement 1

Lorazepam model.
The effect of lorazepam (LZ) versus placebo was described by reducing both contrast and response gain within the normalization model (Appendix 1—table 1). Using this model, we were able to predict the effect of LZ on motion discrimination thresholds (A), (B), and (D) and size indices (C), in a manner which mirrors the data from Figure 4.
Figure 5 with 7 supplements
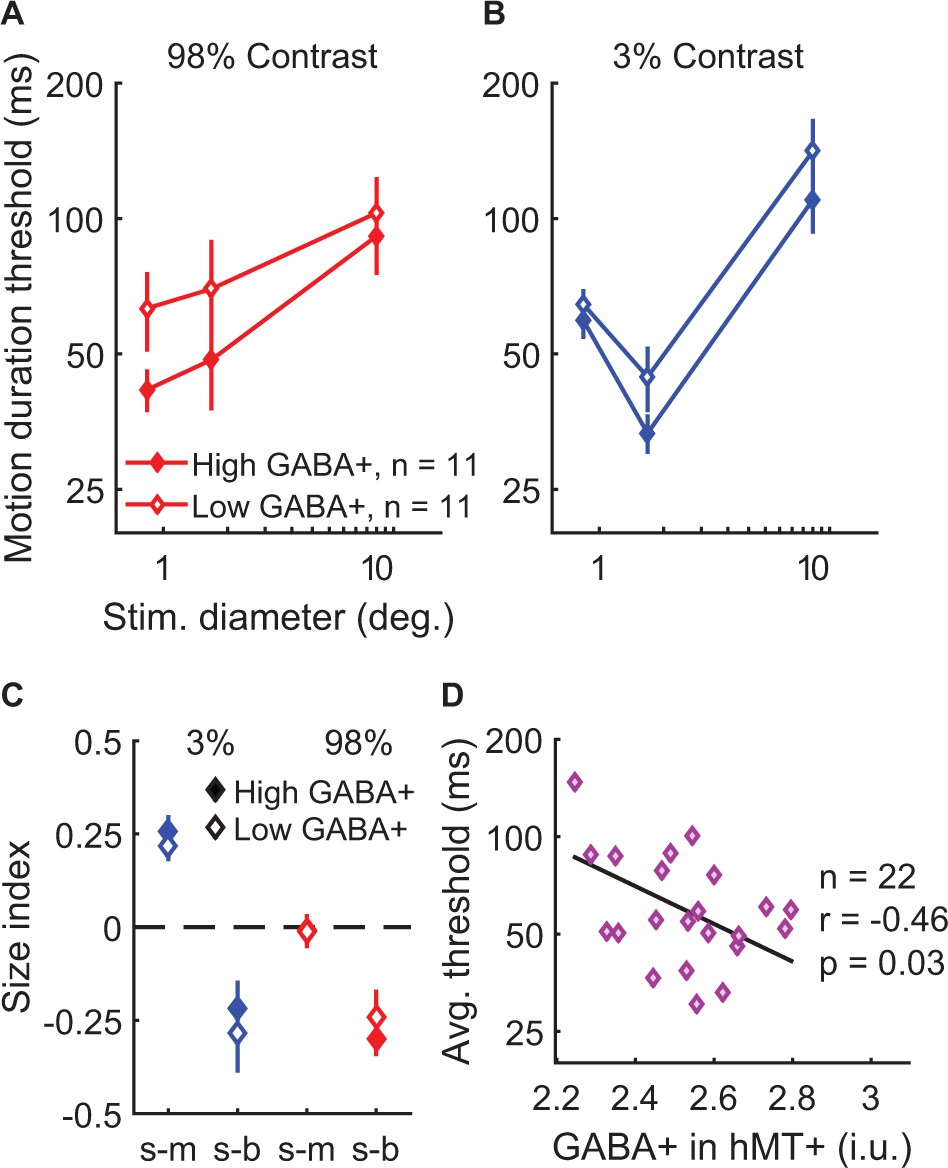
Examining task performance in terms of individual differences in GABA+ concentration in hMT+.
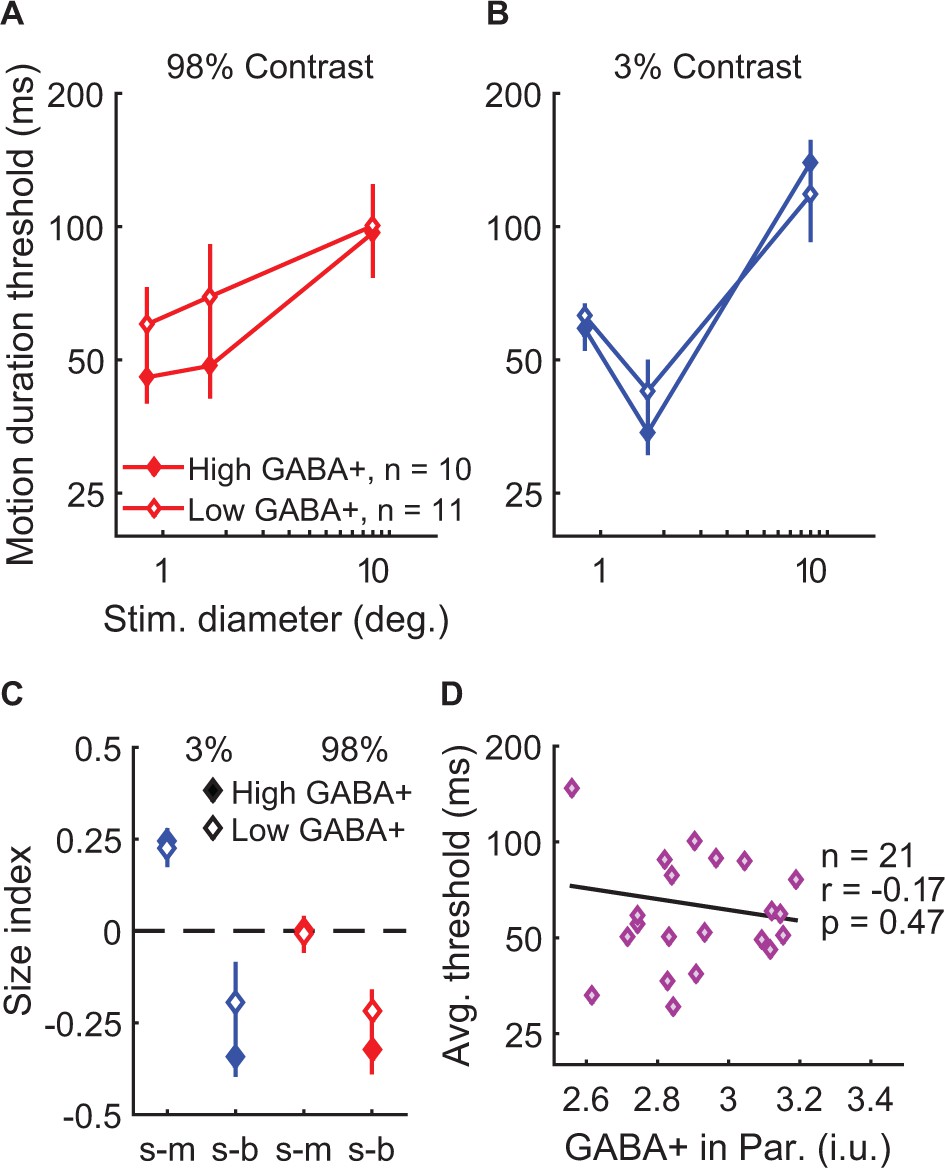
To help illustrate the relationship between GABA+ measured in hMT+ and motion discrimination performance, thresholds (A and B) and size indices (C) are shown for subjects with lower (open symbols, N = 11) and higher GABA+ (filled symbols, N = 11; groups defined by median split). Error bars are mean ± s.e.m. As shown in (D), subjects with more GABA+ in hMT+ performed better overall during motion discrimination (lower average thresholds; geometric mean of all six stimulus conditions).
Figure 5—figure supplement 1

MRS voxel placement and GABA+ fitting.
Mean spectroscopy voxel locations in right and left hMT+ (A) are shown in blue – green (color indicates % overlap across subjects). To visualize positioning across individuals, each subject’s voxel coordinates were mapped to Talairach space, percent overlap was calculated, and the result was projected onto a representative anatomical image. Note that this is only for visualization purposes; the exact voxel placement for each subject was dictated by individual anatomy. Average location of hMT+ across subjects is shown in yellow (determined using a similar method as average MRS voxel position, correlation threshold > 0.3). Images are shown in neurological convention (i.e., left is left). Voxel location for EVC (B) and Parietal cortex (C) are also shown. (D) Average spectrum across subjects from left hMT+ is shown in black (error bars show SD). Average fit to the GABA peak (red) and residuals (blue) are also shown. (E) Zoomed region from D.
Figure 5—figure supplement 2
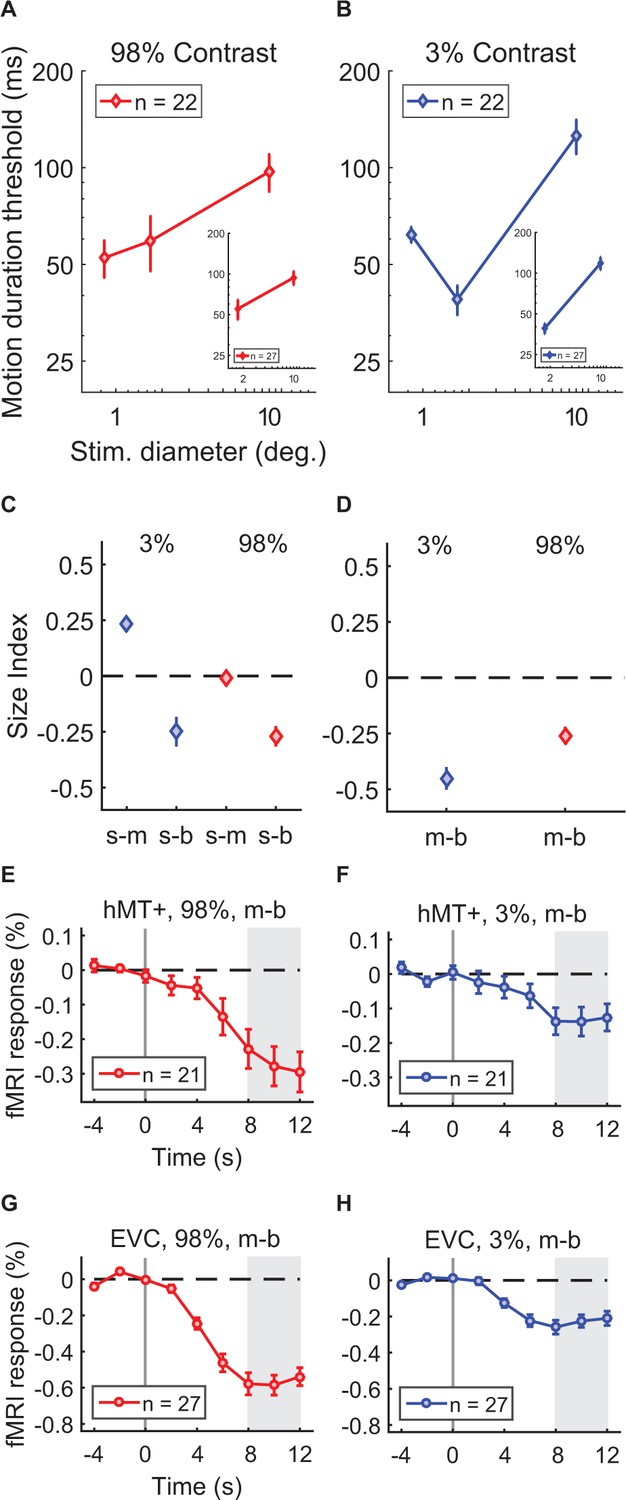
Summary of psychophysical and fMRI data from the MRS experiment.
Motion discrimination thresholds are shown for the subjects who participated in all six stimulus conditions in (A) and (B) (N = 22). Thresholds were obtained from five additional subject for only the medium and big stimulus sizes; inset panels show the data from all subjects (N = 27) in these four conditions. Size indices are shown for small-medium and small-big comparisons in (C) (N = 22), and medium-big in (D) (N = 27). All subjects (N = 27) participated in an fMRI experiment that measured the response to increasing stimulus size. Response time courses for high- (E and G) and low-contrast (F and H) stimuli are plotted for regions representing the smallest stimulus size (E and F): hMT+ sub ROIs, identified in N = 21 subjects; (G and H): EVC ROIs, N = 27). At time = 0 s (vertical line), stimulus size increased from medium to big. Gray region shows the time period where the peak response was calculated (shown in Figure 5—figure supplement 3G–H and Figure 5—figure supplement 4E–F). Error bars are mean ±s.e.m.
Figure 5—figure supplement 3
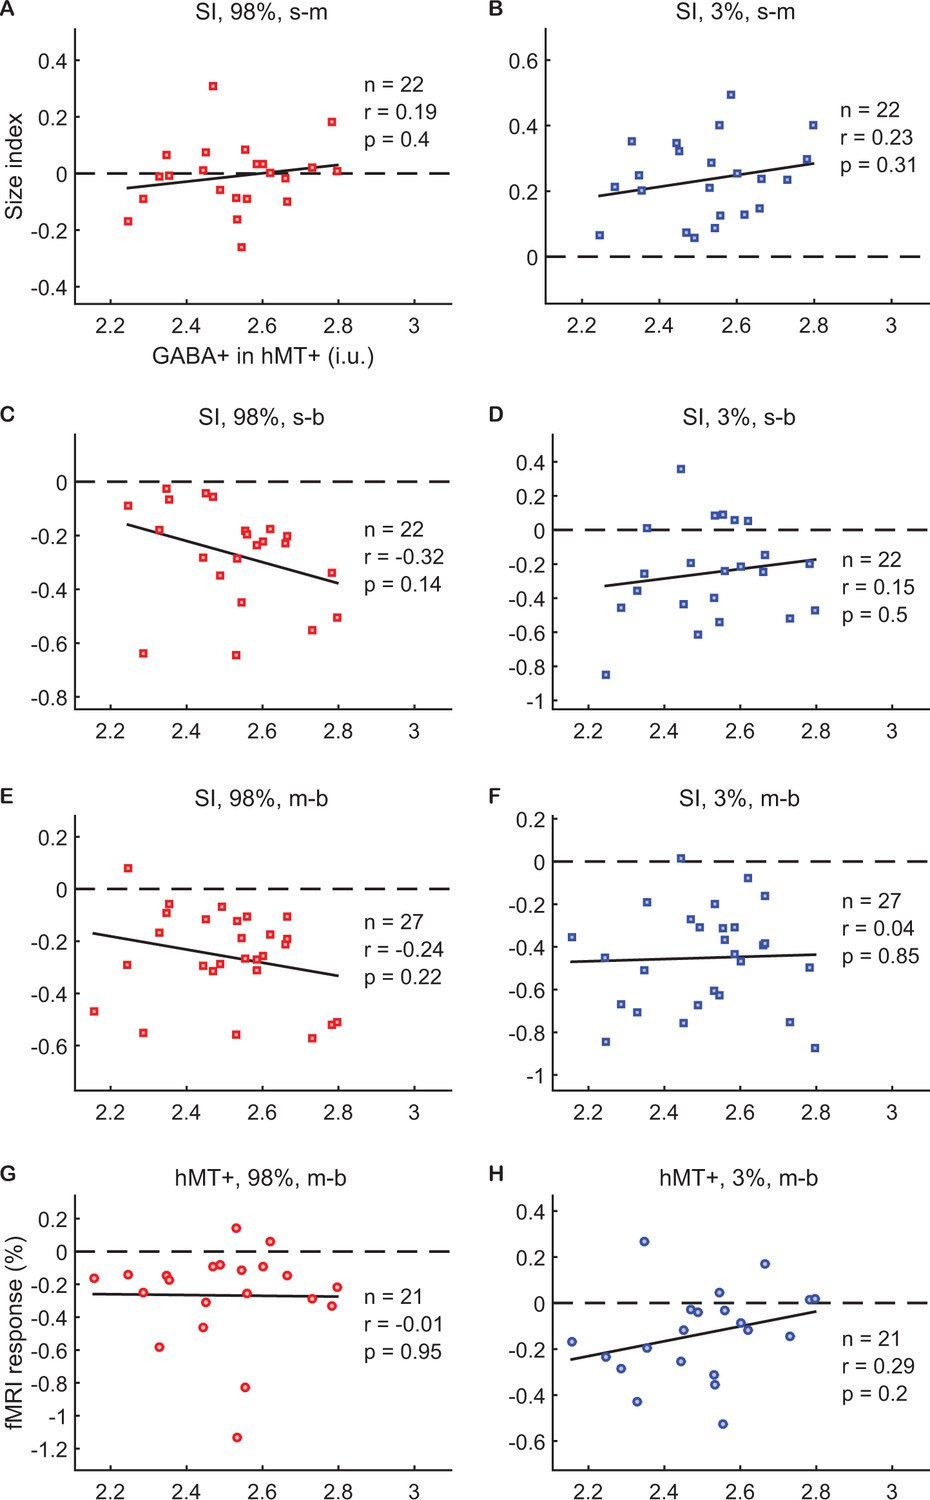
No significant relationship between GABA+ in hMT + and suppression or summation.
In all panels, the concentration of GABA+ in hMT+ (left and right measured in separate scans and averaged) is shown for each subject along the x-axis. Psychophysical size indices are shown along the y-axis in panels (A–F), which quantify the change in motion discrimination thresholds for small-medium (s-m; A and B), small-big (s-b; C and D), and medium-big (m-b; E and F) comparisons. In (G) and (H), the magnitude of the fMRI response in hMT+ evoked by increasing stimulus size (m–b) is shown along the y-axis. Stimulus contrast was 98% in panels (A), (C), (E), and (G), and 3% in (B), (D), (F), and (H). In all panels, negative values indicate suppression; positive values indicate facilitation. The number of subjects (n), correlation coefficient (r) and significance (p) is shown for each comparison. No significant correlations between hMT+ GABA+ and size indices or fMRI suppression in hMT+ were observed. These sample sizes are sufficient to detect correlations of r ≥ 0.58 (for N = 21) to r ≥ 0.52 (N = 27) with 80% power (probability of type II error <20%) (Hulley et al., 2013).
Figure 5—figure supplement 4
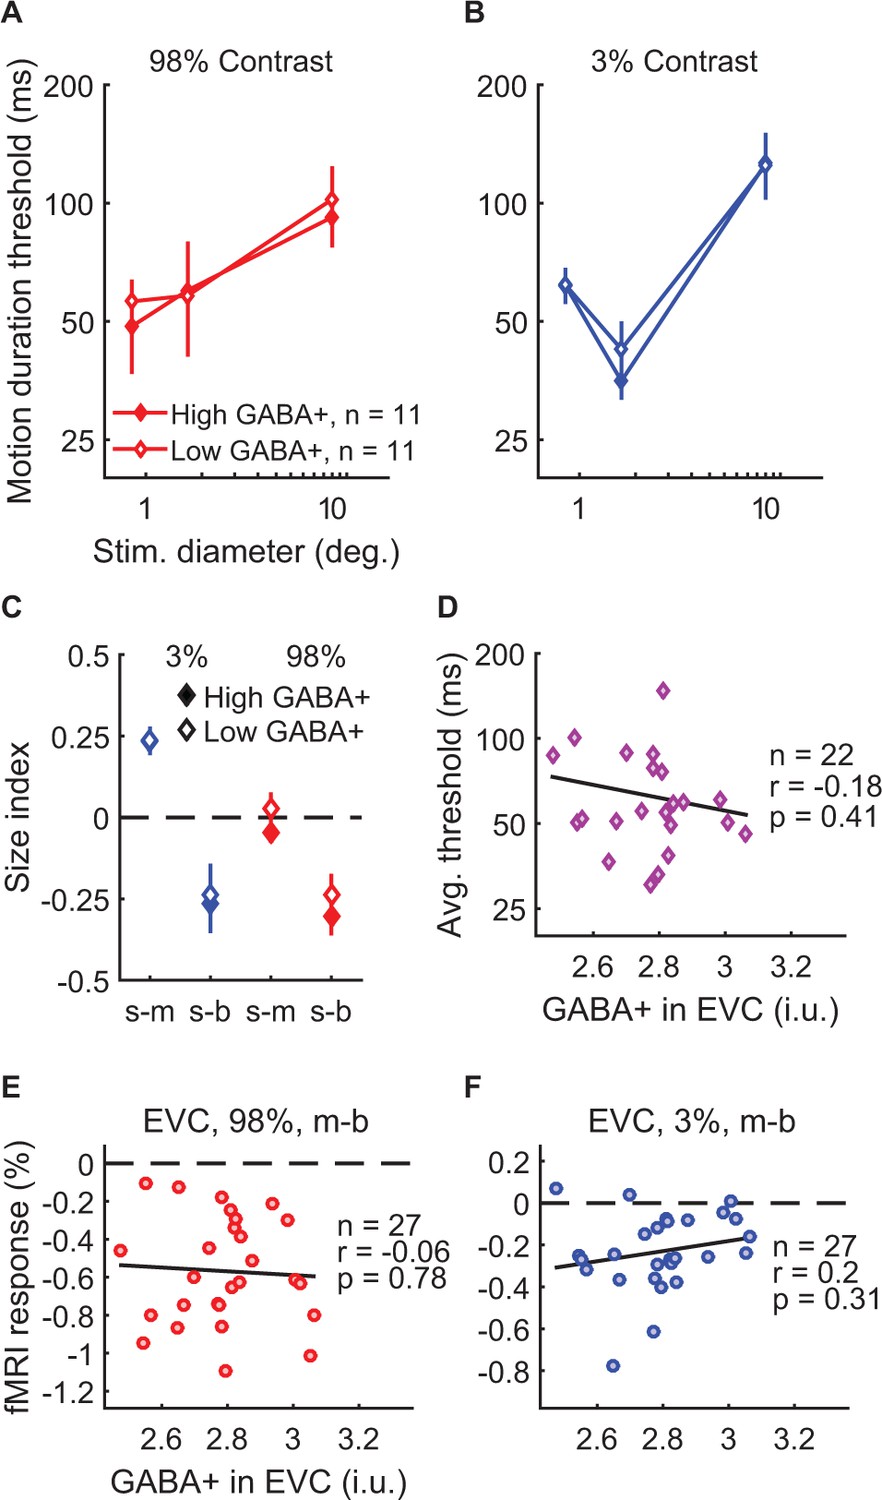
Examining task performance in terms of GABA+ in EVC.
Thresholds (A and B) and size indices (C) are shown for subjects with lower (open symbols, N = 11) and higher GABA+ (filled symbols, N = 11; groups defined by median split) in EVC (average of 2 measurements). Error bars are mean ± s.e.m. GABA +in EVC had no significant relationship with psychophysical size indices (correlation with 3% s-m: r20 = 0.11, p=0.61; 3% s-b: r20 = −0.05, p=0.84; 3% m-b [not shown]: r25 = 0.01, p=0.96; 98% s-m: r20 = −0.04, p=0.87; 98% s-b: r20 = −0.23, p=0.30; 98% m-b [not shown]: r25 = −0.17, p=0.39). As shown in (D), there was also no relationship between GABA+ in EVC and overall motion discrimination performance (average thresholds are the geometric mean of all six stimulus conditions). In (E) and (F), fMRI responses in EVC to increasing stimulus size (medium-big) are shown along the y-axis. No significant correlations with GABA+ in EVC were observed. These sample sizes are sufficient to detect correlations of r ≥ 0.57 (for N = 22) to r ≥ 0.52 (N = 27) with 80% power (probability of type II error <20%) (Hulley et al., 2013).
Figure 5—figure supplement 5
Examining task performance in terms of GABA+ in parietal cortex.
Thresholds (A and B) and size indices (C) are shown for subjects with lower (open symbols, N = 11) and higher GABA+ (filled symbols, N = 10; groups defined by median split) in parietal cortex (Par.). Error bars are mean ±s.e.m. There was no relationship between Par. GABA+ and psychophysical size indices (correlation with 3% s-m: r19 = 0.27, p=0.23; 3% s-b: r19 = −0.10, p=0.66; 3% m-b [not shown]: r24 = −0.15, p=0.46; 98% s-m: r19 = 0.10, p=0.67; 98% s-b: r19 = −0.28, p=0.21; 98% m-b [not shown]: r25 = −0.16, p=0.44). Nor was there a significant relationship between Par. GABA+ and overall motion discrimination performance (D); average thresholds are the geometric mean of all six stimulus conditions). These sample sizes are sufficient to detect correlations of r ≥ 0.57 (for N = 21) to r ≥ 0.53 (N = 26) with 80% power (probability of type II error < 20%) (Hulley et al., 2013).
Figure 5—figure supplement 6
MRS model.
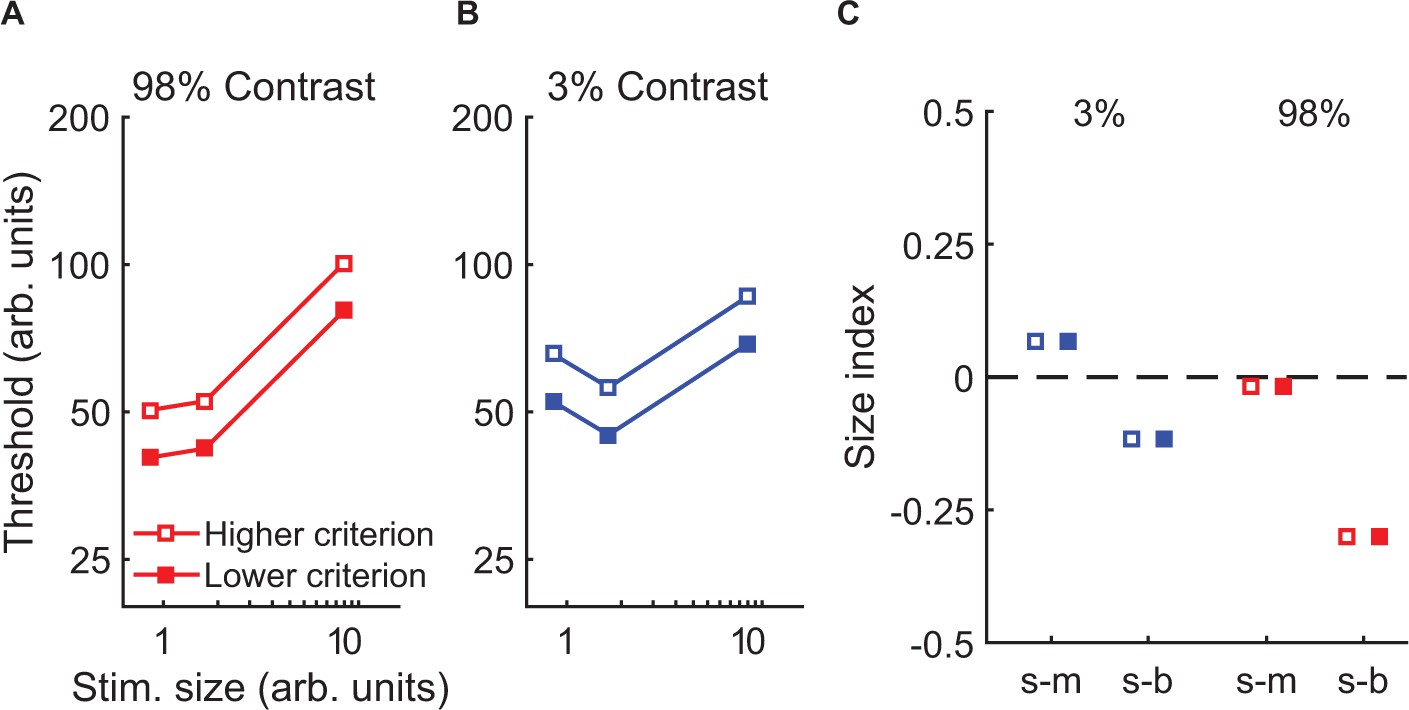
The relationship between GABA+ in hMT+ (measured using MRS) and motion discrimination performance was modeled by a change in behavioral response criteria (Appendix 1-Table 1). Lowering the criterion leads to lower predicted thresholds overall (A and B), but does not affect size indices (C). The predictions of this model are well matched to the data shown in Figure 5. In panel (C), indices for higher and lower criterion models are offset along the x-axis, to prevent overlap and illustrate that the values are identical.
Figure 5—figure supplement 7
FMRI contrast-response data.
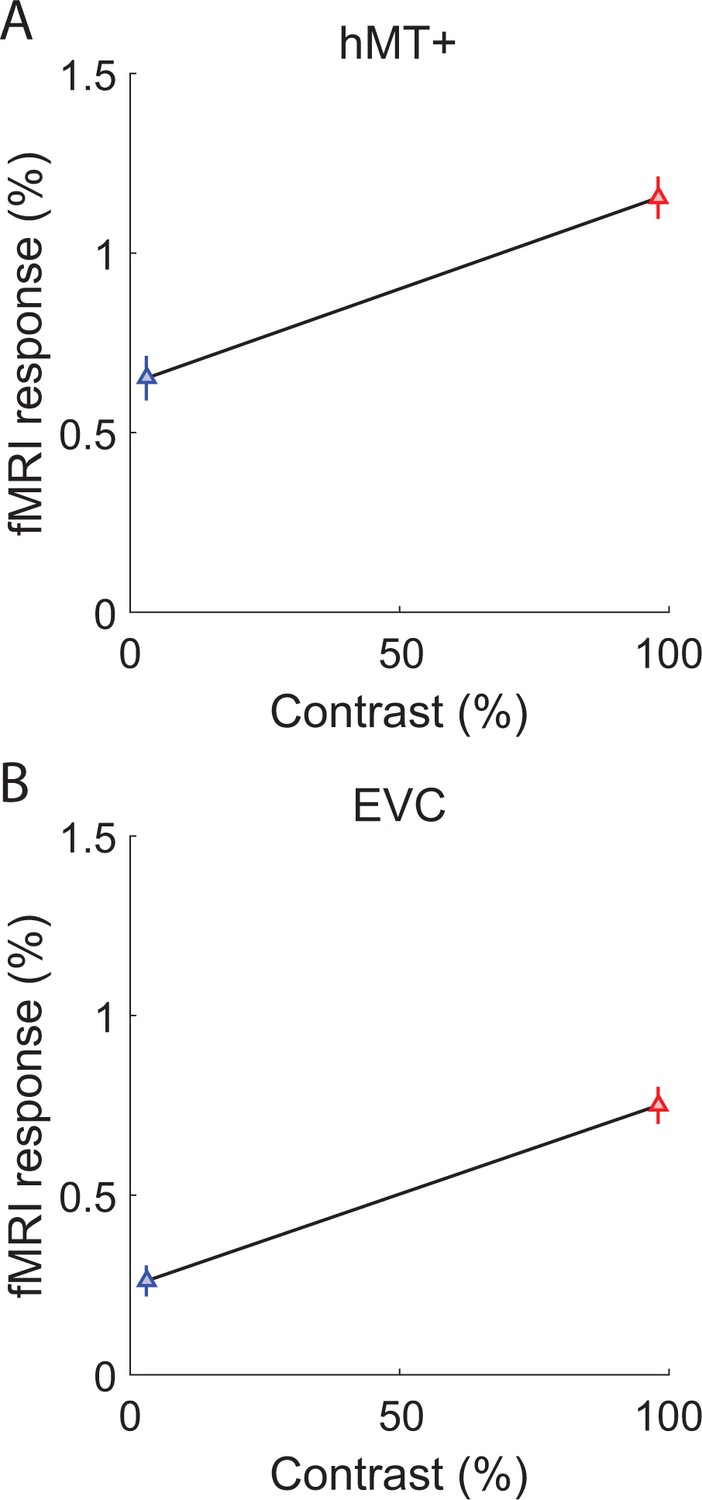
The fMRI response to 3% (blue) and 98% (red) contrast drifting gratings, measured within hMT+ (A) and EVC (B). Data were obtained from the same group of subjects who participated in the MRS experiment (N = 27). Error bars are mean ± s.e.m.
Tables
Appendix 1—table 1
Normalization model parameters.
Arbitrary units abbreviated as a.u. Lorazepam abbreviated LZ. +Indicates parameters that were adjusted in order to fit the data, as opposed to those that were fixed to match the stimuli. Changes in contrast gain were modeled by varying stimulus contrast (e.g. stimulus contrast for the LZ model is the square root of the contrast for the placebo model). Response gain changes were modeled through the inclusion of a parameter that scaled the predicted response (A). For the MRS model, the effect of hMT+ GABA was modeled by varying the response criteria (lower value is 80% of the higher criterion).
| Parameter name | Parameter value | ||
|---|---|---|---|
| Basic model | Lorazepam model | hMT+ GABA MRS model | |
| Stimulus contrast | 0.03 or 0.98 | 0.03 or 0.98 (placebo), 0.017 or 0.099 (LZ) | 0.03 or 0.98 |
| Stimulus spatial center (x, a.u.) | 0 | 0 | 0 |
| Stimulus spatial width (a.u.) | 1, 2, or 12 | 0.84, 1.7, or 10 | 0.84, 1.7, or 10 |
| Stimulus orientation (θ, °) | 90 | 90 | 90 |
| Stimulus orientation width (°) | 5 | 5 | 5 |
| Excitatory spatial pooling width (xw_e, a.u.)+ | 5 | 6.5 | 4.5 |
| Excitatory orientation pooling width (θw_e, °)+ | 25 | 5 | 25 |
| Suppressive spatial pooling width (xw_s, a.u.)+ | 40 | 40 | 15 |
| Suppressive orientation pooling width (θw_s, °)+ | 50 | 25 | 50 |
| Semi-saturation constant (σ, a.u.)+ | 0.0002 | 0.0001 | 0.0001 |
| Criterion (at 3% contrast, a.u.)+ | 300 | 775 | 300 (higher), 240 (lower) |
| Criterion (at 98% contrast, a.u.)+ | 650 | 775 | 375 (higher), 300 (lower) |
| Response scalar (A, a.u.)+ | N/A | 1 (placebo), 0.85 (LZ) | N/A |
Additional files
-
Transparent reporting form
- https://doi.org/10.7554/eLife.30334.016
Download links
A two-part list of links to download the article, or parts of the article, in various formats.
Downloads (link to download the article as PDF)
Open citations (links to open the citations from this article in various online reference manager services)
Cite this article (links to download the citations from this article in formats compatible with various reference manager tools)
Suppression and facilitation of human neural responses
eLife 7:e30334.
https://doi.org/10.7554/eLife.30334


