LAST, a c-Myc-inducible long noncoding RNA, cooperates with CNBP to promote CCND1 mRNA stability in human cells
- CAS Center for Excellence in Molecular Cell Science, Innovation Center for Cell Signaling Network, School of Life Sciences, University of Science & Technology of China, China
- Henan Provincial People’s Hospital, School of Medicine, Henan University, China
Figures
Figure 1 with 2 supplements

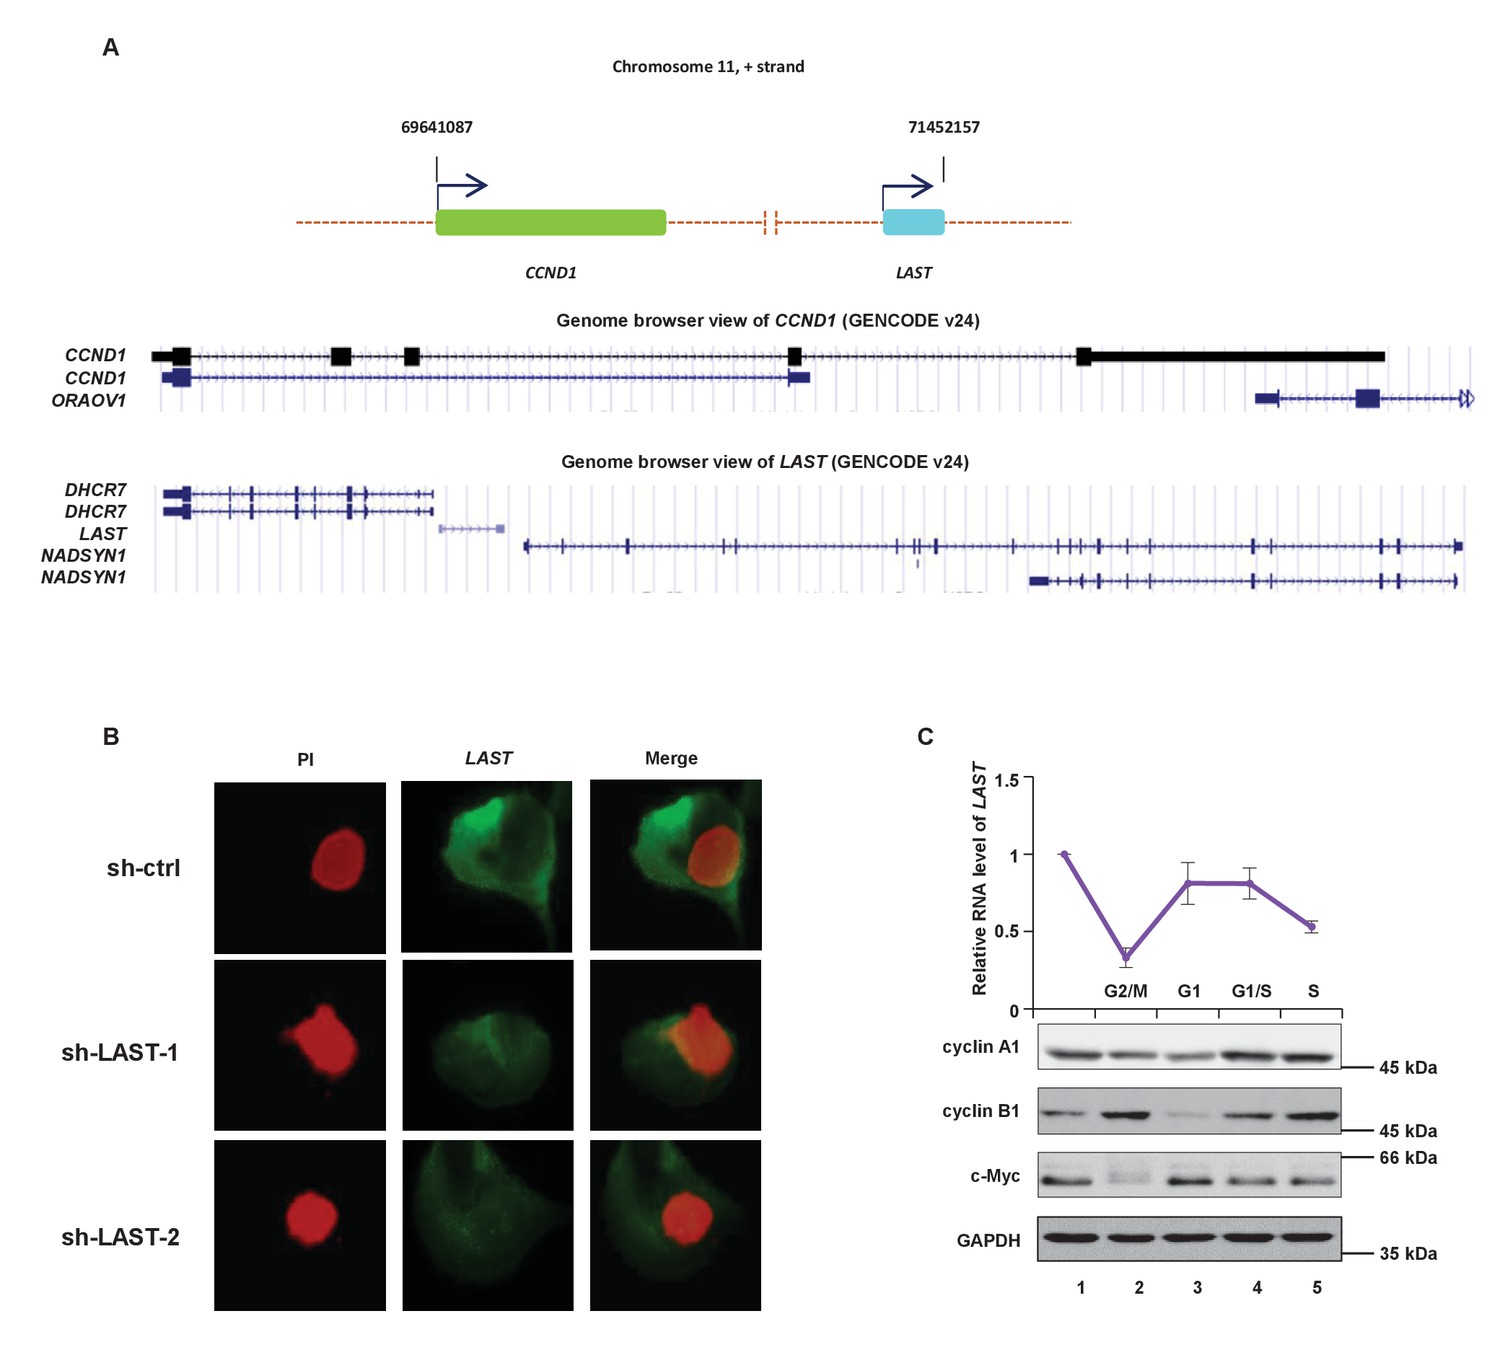
LAST is positively regulated by c-Myc.
(A) P493-6 cells carrying a c-Myc tet-off system were treated with doxycycline (1 μg/mL) for 24 hr. The levels of five lncRNAs (lncRNA-5639,–51, −52,–5630 and −5690) and the positive control CDK4 were assessed by real-time RT–PCR analysis. Data shown are the mean ± SD (n = 3; ***p<0.001, two-tailed t-test). Cell lysates were also analyzed by western blotting with the indicated antibodies to ensure that gene expression was controlled by c-Myc. (B) HCT116 cells were infected with lentiviruses expressing control shRNA (sh-ctrl), shRNA-1,–2 against lncRNA-52 or shRNA-1,–2 against lncRNA-51, as indicated. The lentivirus-mediated gene knockdown efficiencies for both lncRNA-52 and lncRNA-51 were analyzed by real-time RT–PCR. Data shown are the mean ± SD (n = 3; **p<0.01, ***p<0.001, two-tailed t-test). (C) Colonies of the above cells were stained with crystal violet and photographed after 14 days of incubation. (D) The number of colonies was counted and plotted in columns. (E) Total RNA from the indicated cell lines was subjected to northern blot analysis to determine the molecular size of LAST. (F) Single molecule RNA FISH detecting endogenous LAST molecules (green) in HCT116 and H1299. Chromosomal DNA (red) was stained with PI. (G) HCT116 and H1299 cells were fractionated into cytoplasmic and nuclear extracts. Total RNA extracted from each fraction was analyzed by real-time RT–PCR. Data shown are the mean ± SD (n = 3). Actin and U1 were used as markers for the cytoplasmic and nuclear fractions, respectively. (H) The LAST transcript copy numbers per cell in HAFF, IMR90, MCF10A, HCT116, MCF7 and H1299 cells were determined by absolute quantitative PCR (qPCR). Data shown are the mean ± SD (n = 3). (I) HCT116, H1299 and MCF10A cells were infected with lentiviruses expressing control shRNA or c-Myc shRNA. Ninety-six hours after infection, total RNA and cell lysates were analyzed by real-time RT-PCR and western blotting, respectively. Data shown are the mean ± SD (n = 3; **p<0.01, ***p<0.001, two-tailed t-test). (J) HCT116, H1299 and MCF10A cells were transfected with empty vector or FLAG-c-Myc. Twenty-four hours after transfection, total RNA was extracted from these cells and subjected to real-time RT-PCR analysis. Data shown are the mean ± SD (n = 3; *p<0.05, **p<0.01, two-tailed t-test). Cell lysates were also analyzed by western blotting using the indicated antibodies. (K) Schematic representation of putative c-Myc binding sites around the LAST gene, predicted c-Myc binding fragments, qPCR-amplified fragments from the ChIP assay and fragments used in the luciferase reporter assay (upper panel). Lysates from HCT116 cells were subjected to the ChIP assay with a normal rabbit IgG or c-Myc antibody. ChIP products were amplified by qPCR with the indicated pairs of primers (Table 1). Data shown are the mean ± SD (n = 3; *p<0.05, two-tailed t-test) (lower panel). (L) Schematic diagram of the luciferase reporter systems constructed to assess LAST promoter activity. The indicated pGL3-based luciferase reporter constructs were generated to examine the transcriptional activities of two putative c-Myc binding sites, BS2 and BS3, in response to c-Myc induction. BS2M and BS3M indicate their corresponding mutant binding sites, which are written in black in the open boxes (upper panel). HCT116 cells were co-transfected with either FLAG-c-Myc or the control vector plus the indicated reporter constructs and Renilla luciferase plasmid. Twenty-four hours after transfection, reporter activity was measured and plotted after normalizing with respect to Renilla luciferase activity. Data shown are the mean ± SD (n = 3; *p<0.05, two-tailed t-test) (lower panel).
-
Figure 1—source data 1
Source data for Figure 1A, B, D, G, H, I, J, K and L.
- https://doi.org/10.7554/eLife.30433.006
Figure 1—figure supplement 1
LAST is positively regulated by c-Myc.
(A) Schematic representation of the gene locations of CCND1 and LAST on chromosome 11. (B) Single molecule RNA FISH was used to detect endogenous LAST molecules (green) in H1299 expressing control shRNA, LAST shRNA-1 or −2. Chromosomal DNA (red) was stained with PI. (C) HCT116 cells were treated as follows: mock (lane1); thymidine/TDR (2.5 mM) for 16 hr, then released for 9 hr, followed by nocodazole (50 ng/mL) for 16 hr (lane 2); mimosine (200 μM) for 24 hr (lane 3); TDR for 16 hr, then released for 9 hr, followed by TDR again for 16 hr (lane 4); and TDR for 16 hr, then released for 9 hr, followed by TDR again for 16 hr, then released for 3 hr (lane 5). Total RNA was subjected to real-time RT-PCR to detect the LAST levels in their respective cell cycle phase. Western blotting was used to analyze the indicated protein level. Data shown are the mean ± SD (n = 3).
Figure 1—figure supplement 2
Uncropped images of blots.
Red boxes indicate the cropped regions.
Figure 2 with 2 supplements

LAST accelerates G1/S transition and upregulates cyclin D1/CCND1.
(A) HCT116 cells were infected with lentiviruses expressing control shRNA, LAST shRNA-1 or −2. Ninety-six hours after infection, total RNA was extracted and the transcript levels for LAST, CCND1, CCNE1, CDK2, CDK4 and c-Myc were analyzed by real-time RT-PCR. Data shown are the mean ± SD (n = 3; *p<0.05, **p<0.01, ***p<0.001, two-tailed t-test). (B) Cell lysates prepared as described above (Figure 2A) were analyzed by western blotting to examine GAPDH, cyclin D1, cyclin E1, Actin, CDK2, CDK4 and c-Myc expression. (C) HAFF and H1299 cells were infected with lentiviruses expressing control shRNA or LAST shRNA. Ninety-six hours after infection, total RNA was analyzed by real-time RT-PCR to detect the level of LAST to determine its knockdown efficiency (lower panel). Total RNA was also analyzed by real-time RT-PCR to detect the level of CCND1 mRNA and by western blotting to examine the cyclin D1 protein level (upper panel). Data shown are the mean ± SD (n = 3; *p<0.05, **p<0.01). (D) HCT116, H1299 and HAFF cells were infected with lentiviruses expressing control RNA or LAST. Ninety-six hours after infection, total RNA was analyzed by real-time RT-PCR to detect successful expression of LAST (lower panel). Total RNA was also analyzed by real-time RT-PCR to detect the level of CCND1 mRNA and by western blotting to examine the cyclin D1 protein level (upper panel). Data shown are the mean ± SD (n = 3; *p<0.05, **p<0.01, ***p<0.001, two-tailed t-test).
-
Figure 2—source data 1
Source data for Figure 2A, C and D.
- https://doi.org/10.7554/eLife.30433.010
Figure 2—figure supplement 1

LAST knockdown prevents cell passage from the G1 phase into S phase.
(A) HCT116 cells were individually infected with lentiviruses expressing LAST shRNA-1,–2 and non-targeting control shRNA. Ninety-six hours after infection, cells were stained with PI, followed by flow cytometric analysis of the cell cycle phase distribution. (B) The percentage numbers of cells from (A) in the G1, S or G2/M phase were analyzed by FlowJo 7.6 software. Data shown are the mean ± SD (n = 3; *p<0.05, **p<0.01, two-tailed t-test). (C) HCT116 cells were infected with lentiviruses expressing control shRNA, LAST shRNA-1 or −2. Ninety-six hours after infection, total RNA was extracted and the transcript levels of DHCR7 and NADSYN1 were analyzed by real-time RT-PCR. Data shown are the mean ± SD (n = 3; two-tailed t-test). Cell lysates were analyzed by western blotting to examine actin, DHCR7 and NADSYN1 expression. (D) HCT116 cells expressing control shRNA or LAST shRNA-1 were separately transfected with either mock control or shRNA-resistant LAST. Twenty-four hours after transfection, total extracted RNA was subjected to real-time RT-PCR to analyze the mRNA level of CCND1. Data shown are the mean ± SD (n = 3; **p<0.01, two-tailed t-test). (E) Cell lysates from cells treated as described in Figure 2—figure supplement 1B were analyzed by western blotting to detect the cyclin D1 protein level.
Figure 2—figure supplement 2
Uncropped images of blots.
Red boxes indicate the cropped regions.
Figure 3 with 2 supplements
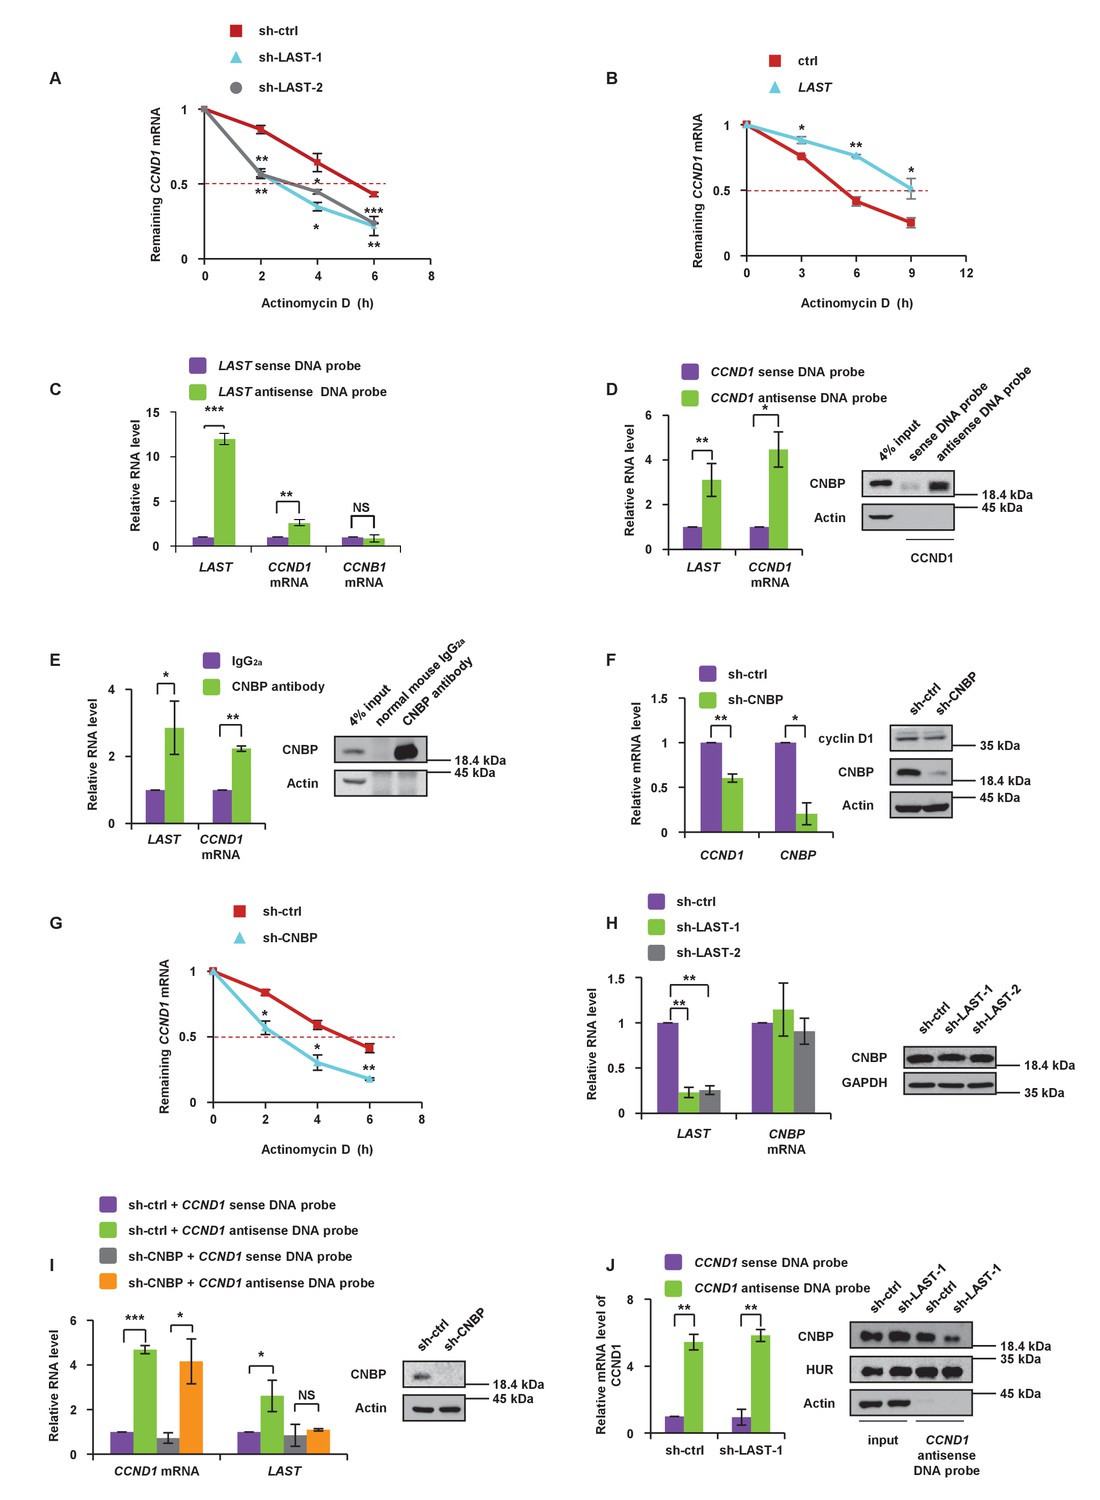
LAST stabilizes CCND1 mRNA via CNBP.
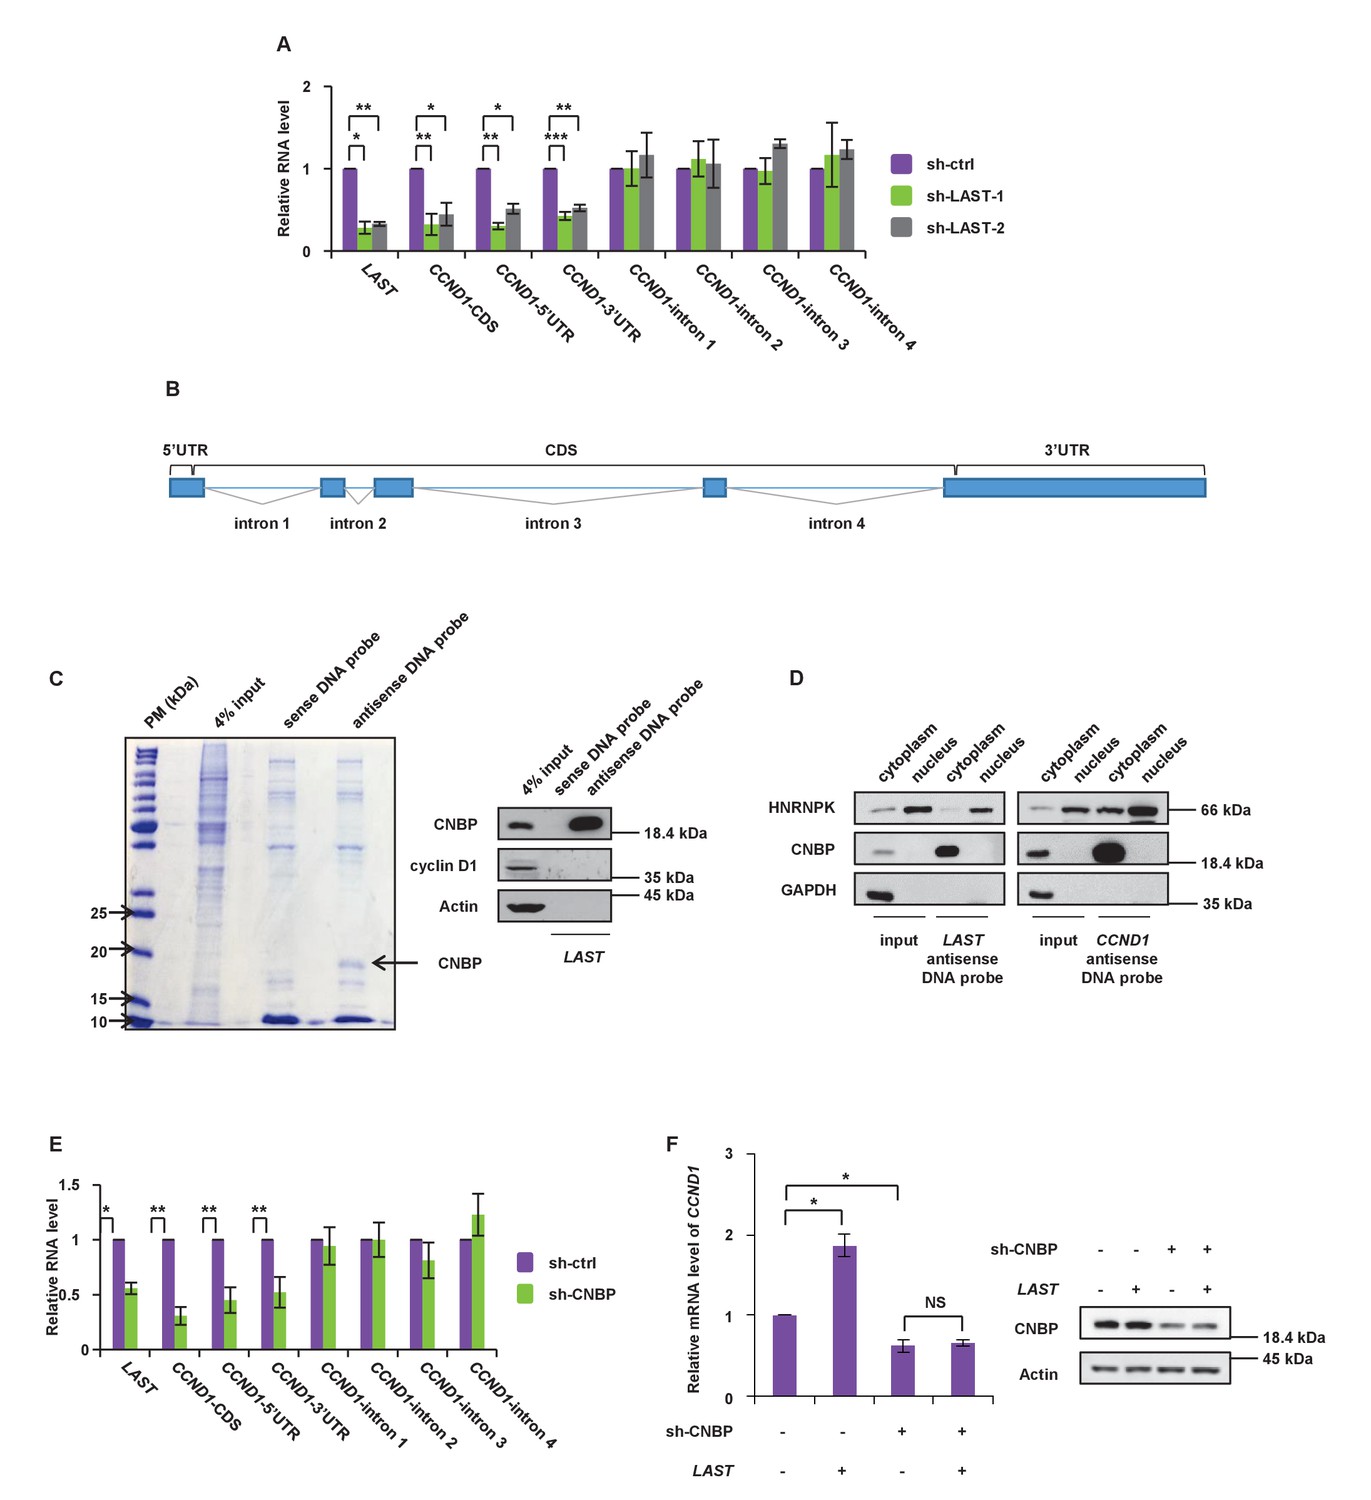
(A) HCT116 cells expressing control shRNA, LAST shRNA-1 or −2 were treated with actinomycin D (1 μg/mL) for the indicated periods of time. Total RNA was purified and then analyzed by real-time RT-PCR to examine the mRNA half-life of CCND1. Data shown are the mean ± SD (n = 3; *p<0.05, **p<0.01, ***p<0.001, two-tailed t-test). (B) HCT116 cells expressing control RNA or LAST were treated with actinomycin D (1 μg/mL) for the indicated periods of time. Total RNA was extracted and then analyzed by real-time RT-PCR to examine the mRNA half-life of CCND1. Data shown are the mean ± SD (n = 3; *p<0.05, **p<0.01, two-tailed t-test). (C) HCT116 cell lysates were incubated with in vitro synthesized biotin-labeled sense or antisense DNA probes against LAST for the biotinylated oligonucleotide pull-down assay. The precipitates from the pull-down were analyzed by real-time RT-PCR to detect the interacting mRNAs. Data shown are the mean ± SD (n = 3; **p<0.01, ***p<0.001, two-tailed t-test). (D) HCT116 cell lysates were incubated with in vitro synthesized biotin-labeled sense or antisense DNA probes against CCND1 mRNA for the biotin pull-down assay. The precipitates from the pull-down underwent real-time RT-PCR and western blot analyses to examine the levels of indicated RNAs and protein CNBP, respectively. Data shown are the mean ± SD (n = 3; *p<0.05, **p<0.01, two-tailed t-test). (E) HCT116 cell lysates were immunoprecipitated with an antibody against CNBP or normal mouse IgG2a. Precipitated samples were analyzed by western blotting to ensure successful precipitation of CNBP and by real-time RT-PCR to detect the indicated coprecipitated RNAs. Data shown are the mean ± SD (n = 3; *p<0.05, **p<0.01, two-tailed t-test). (F) HCT116 cells were infected with lentiviruses expressing control shRNA or CNBP shRNA. Ninety-six hours after infection, total RNA was subjected to real-time RT-PCR to compare the levels of CCND1 mRNA. Data shown are the mean ± SD (n = 3; *p<0.05, **p<0.01, two-tailed t-test). Cell lysates were also analyzed by western blotting with the indicated antibodies. (G) HCT116 cells expressing control shRNA or CNBP shRNA were treated with actinomycin D (1 μg/mL) for the indicated periods of time. Total RNA was then analyzed by real-time RT-PCR to examine the mRNA half-life of CCND1. Data shown are the mean ± SD (n = 3; *p<0.05, **p<0.01, two-tailed t-test). (H) HCT116 cells were infected with lentiviruses expressing control shRNA, LAST shRNA-1 or −2. Ninety-six hours after infection, total RNA was subjected to real-time RT-PCR to compare the levels of CNBP. Data shown are the mean ± SD (n = 3; **p<0.01, two-tailed t-test). Cell lysates were also analyzed by western blotting to examine actin and CNBP expression. (I) Cell lysates of HCT116 cells expressing control shRNA or CNBP shRNA were incubated separately with in vitro synthesized biotin-labeled sense or antisense DNA probes against CCND1 mRNA for the biotinylated oligonucleotide pull-down assay. The pull-down products were subjected to real-time RT-PCR analysis to examine the indicated RNA levels. Cell lysates from HCT116 treated with or without CNBP shRNA knockdown were subjected to western blotting to ensure knockdown of CNBP. Data shown are the mean ± SD (n = 3; *p<0.05, ***p<0.001, two-tailed t-test). (J) Cell lysates of HCT116 cells expressing control shRNA or LAST shRNA-1 were incubated with in vitro synthesized biotin-labeled sense or antisense DNA probes against CCND1 mRNA for the biotin pull-down assay, followed by real-time RT-PCR analysis to examine the indicated RNA levels. Pull-down products were also subjected to western blotting with the indicated antibodies and real-time RT-PCR. Data shown are the mean ± SD (n = 3; **p<0.01, two-tailed t-test).
-
Figure 3—source data 1
Source data for Figure 3A, B, C, D, E, F, G, H, I and J.
- https://doi.org/10.7554/eLife.30433.014
Figure 3—figure supplement 1
LAST stabilizes CCND1 mRNA via CNBP.
(A) HCT116 cells were infected with lentiviruses expressing control shRNA, LAST shRNA-1 or −2. Ninety-six hours after infection, total RNA was analyzed by real-time RT-PCR with the indicated primers. Data shown are the mean ± SD (n = 3; *p<0.05, **p<0.01, ***p<0.001, two-tailed t-test). RT-PCR was performed using specific primer pairs against various regions of the CCND1 pre-mRNA transcript, including the 5’-UTR, coding region, 3’-UTR and intronic regions-1,–2, −3 and −4 (Figure 3—figure supplement 1B), to measure the level of the CCND1 transcript. (B) Schematic illustration showing the different parts of CCND1 mRNA, including the 5’UTR, 3’UTR, intron 1, intron 2, intron 3 and intron 4 regions. (C) HCT116 cell lysates were incubated with in vitro synthesized biotin-labeled sense or antisense DNA probes against LAST for the biotin-labeled RNA pull-down assay. Precipitated complexes from the pull-down assay were separated by SDS-PAGE and visualized by Coomassie brilliant blue staining. Gel-separated proteins were analyzed by MALDI mass spectrometry. A putative RNA-binding protein is indicated. Pull-down products were analyzed by western blotting with indicated antibodies. (D) Cytoplasmic and nuclear extracts from HCT116 cells were incubated with a LAST antisense DNA probe or CCND1 antisense DNA probe. Precipitated complexes from the pull-down assay were analyzed by western blotting with the indicated antibodies. (E) HCT116 cells were infected with lentiviruses expressing control shRNA or CNBP shRNA. Ninety-six hours after infection, total RNA was analyzed by real-time RT-PCR with the indicated primers against their respective regions. Data shown are the mean ± SD (n = 3; *p<0.05, **p<0.01, two-tailed t-test). (F) HCT116 cells expressing control shRNA or CNBP shRNA were separately infected with lentiviruses expressing either mock control or LAST. Ninety-six hours after injection, the total RNA extracted was subjected to real-time RT-PCR to analyze the mRNA level of CCND1, and cell lysates were analyzed by western blotting to detect the CNBP protein level.
Figure 3—figure supplement 2
Uncropped images of blots.
Red boxes indicate the cropped regions.
Figure 4 with 3 supplements

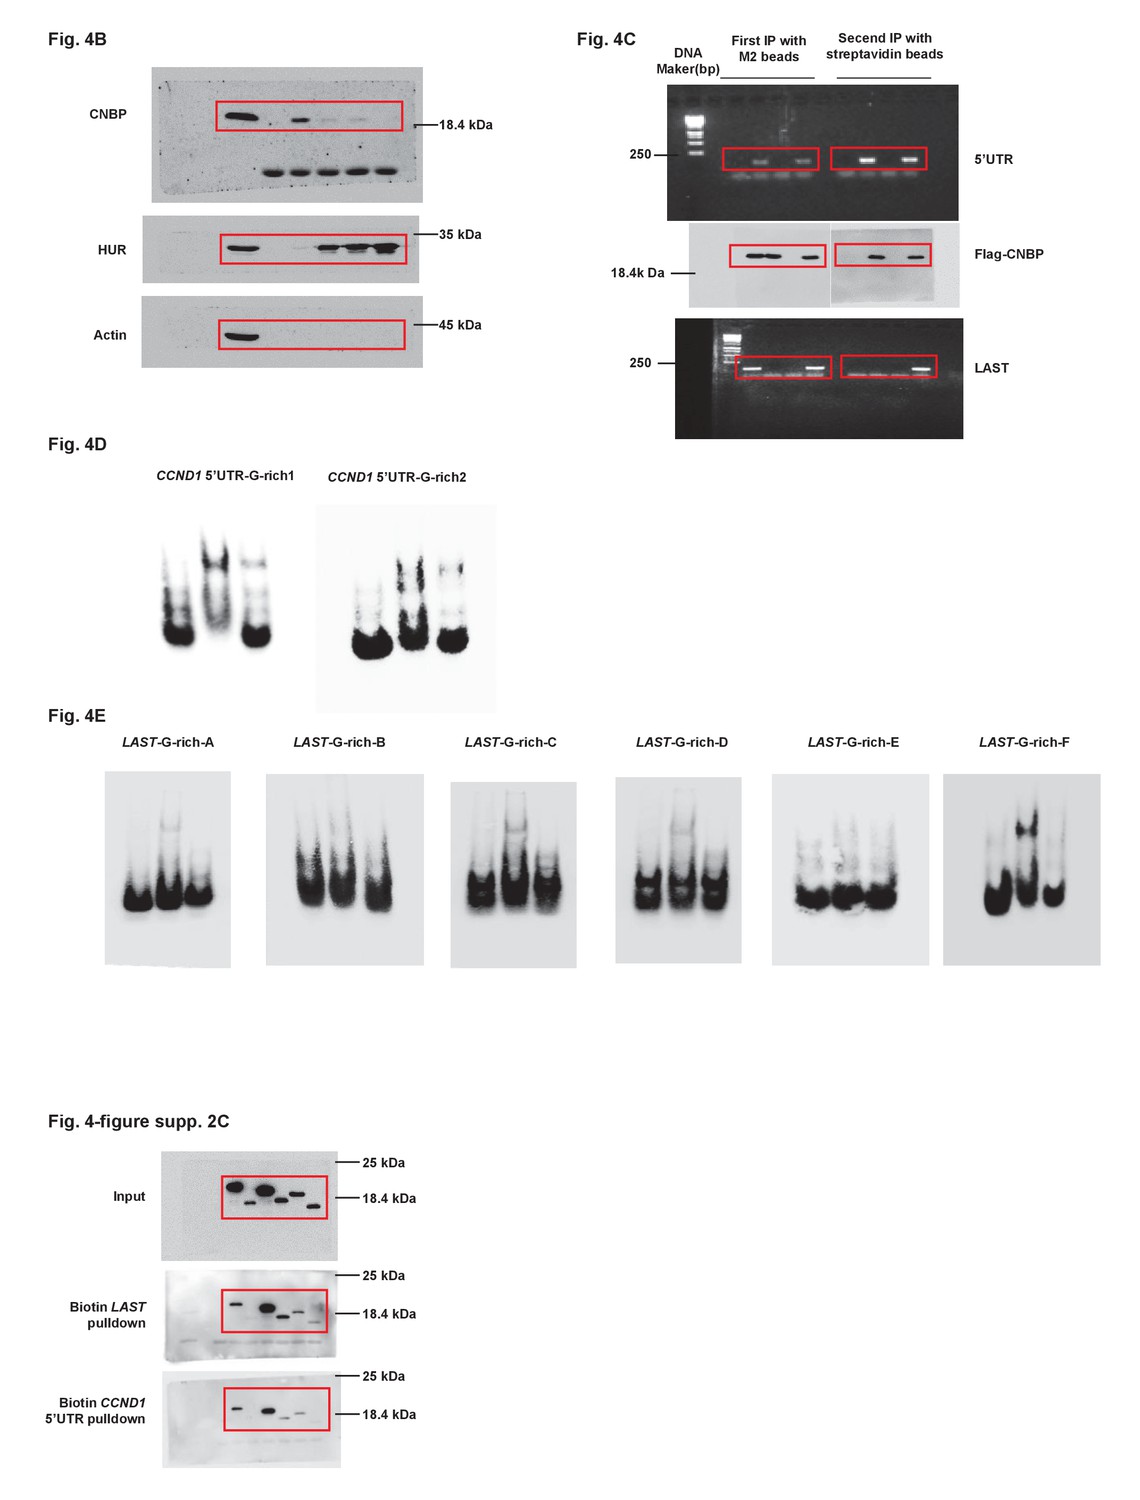
CNBP binds to LAST and CCND1 mRNA via their G-rich motifs.
(A) Schematic illustration showing different parts, including the 5’UTR, CDS, 3’UTR-1, 3’UTR-2 and 3’UTR-3, in CCND1 mRNA (upper panel). HCT116 cell lysates were incubated with in vitro synthesized biotin-labeled CCND1 5’UTR as well as 3’UTR-1,–2, and −3 (upper panel), followed by RNA pull-down. Cell lysates incubated with no RNA were used as negative controls. Pull-down products were subjected to real-time RT-PCR. Data shown are the mean ± SD (n = 3; **p<0.01, two-tailed t-test) (lower panel). (B) The pull-down products from above were analyzed by western blotting with the indicated antibodies. (C) In-vitro synthetic biotin-labeled CCND1 5’UTR and unlabeled LAST plus Flag-CNBP were incubated for 3 hr at 4°C. The mixtures were first immunoprecipitated with M2 beads, followed by elution with 3 × FLAG peptides. Ten percent of the eluent was analyzed by western blotting or RT-PCR. The rest of the eluent was further immunoprecipitated with streptavidin beads. The immunoprecipitates were then washed. After elution, 10% of the eluent was analyzed by western blotting. Ninety percent of the eluent was used for real-time RT-PCR analysis. (D) A schematic illustration of two G-rich regions in the CCND1 5’UTR. Electrophoretic mobility shift assay (EMSA) was performed to detect the CNBP binding activity to its targeted G-rich region 1 and 2. (E) A schematic illustration of six G-rich regions in LAST. An electrophoretic mobility shift assay (EMSA) was performed to detect the CNBP binding activity to its targeted G-rich motif A, B, C, D, E and F. (F) HCT116 cells were infected with lentiviruses expressing either control RNA; wild-type LAST; LAST individually mutated at G-rich-A, G-rich-C, G-rich-D and G-rich-F sites; or LAST mutated at the four G-rich-A, C, D and F sites combined. Ninety-six hours after infection, total RNA was analyzed by real-time RT-PCR to detect the successful expression levels of LAST or mutant LAST. Data shown are the mean ± SD (n = 3; **p<0.01, two-tailed t-test). (G) Total RNA of HCT116 cells separately expressing exogenous control RNA; wild-type LAST; LAST with a single mutation at G-rich-A, G-rich-C, G-rich-D or G-rich-D; and LAST with four mutations combined were analyzed by real-time RT-PCR to detect the mRNA level of CCND1. Data shown are the mean ± SD (n = 3; *p<0.05, **p<0.01, ***p<0.001, two-tailed t-test).
-
Figure 4—source data 1
Source data for Figure 4A, F and G.
- https://doi.org/10.7554/eLife.30433.019
Figure 4—figure supplement 1
CNBP binds to CCND1 mRNA 5'UTR.
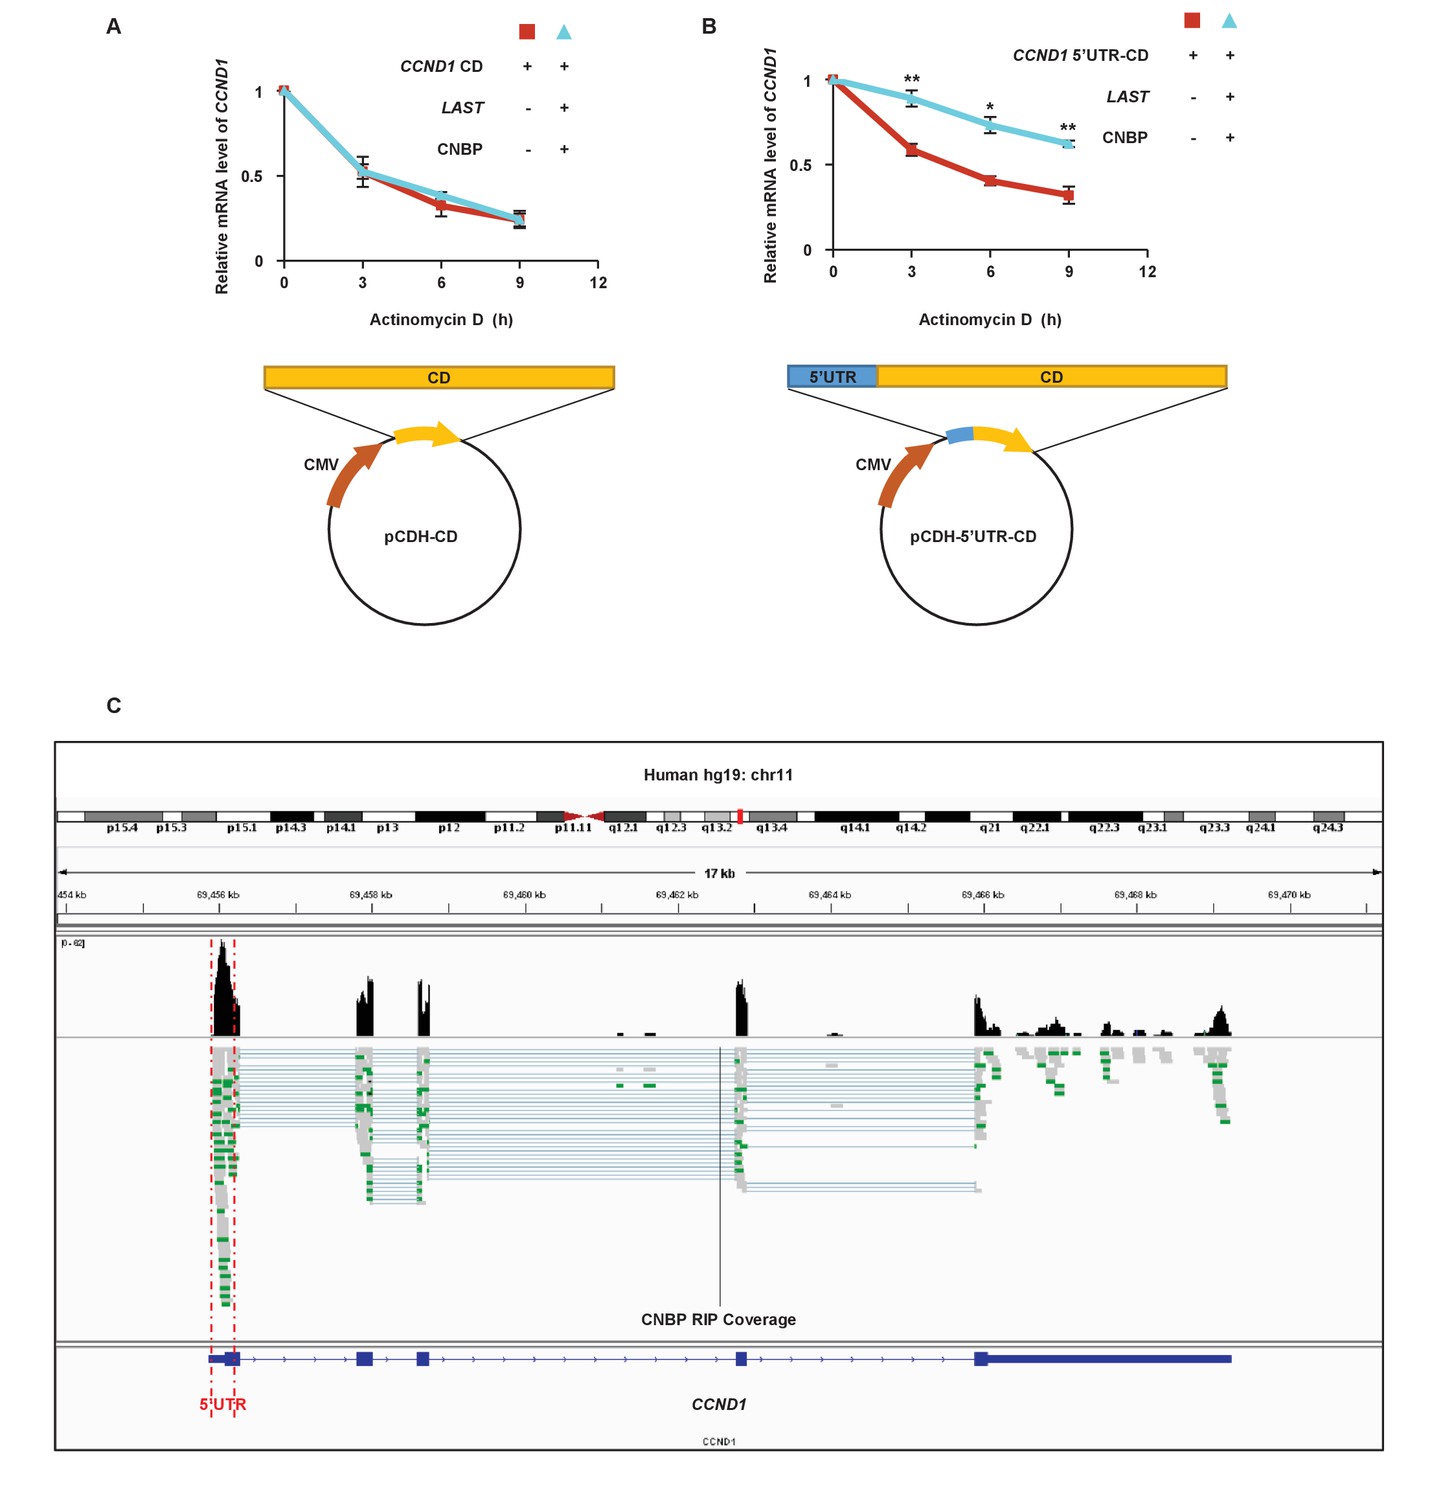
(A) 293T cells were either transfected with PCDH-CCND1-CD alone or co-transfected with PCDH-CCND1-CD plus LAST and FLAG-CNBP. Twenty-four hours later, cells were treated with actinomycin D (1 μg/mL) for the indicated periods of time. Total RNA was purified and then analyzed by real-time RT-PCR to examine the mRNA half-life of CCND1. Data shown are the mean ± SD (n = 3). (B) 293T cells were either transfected with PCDH-CCND1-CD alone or co-transfected with PCDH-CCND1-5’UTR-CD plus LAST and FLAG-CNBP. Twenty-four hours later, cells were treated with actinomycin D (1 μg/mL) for the indicated periods of time. Total RNA was purified and then analyzed by real-time RT-PCR to examine the mRNA half-life of CCND1. Data shown are the mean ± SD (n = 3; *p<0.05, **p<0.01, two-tailed t-test). (C) Visualization analysis of the CNBP RIP-seq peaks of the CCND1 5’UTR was performed by IGV.
Figure 4—figure supplement 2
Both LAST and CCND1 mRNA bind to CNBP.
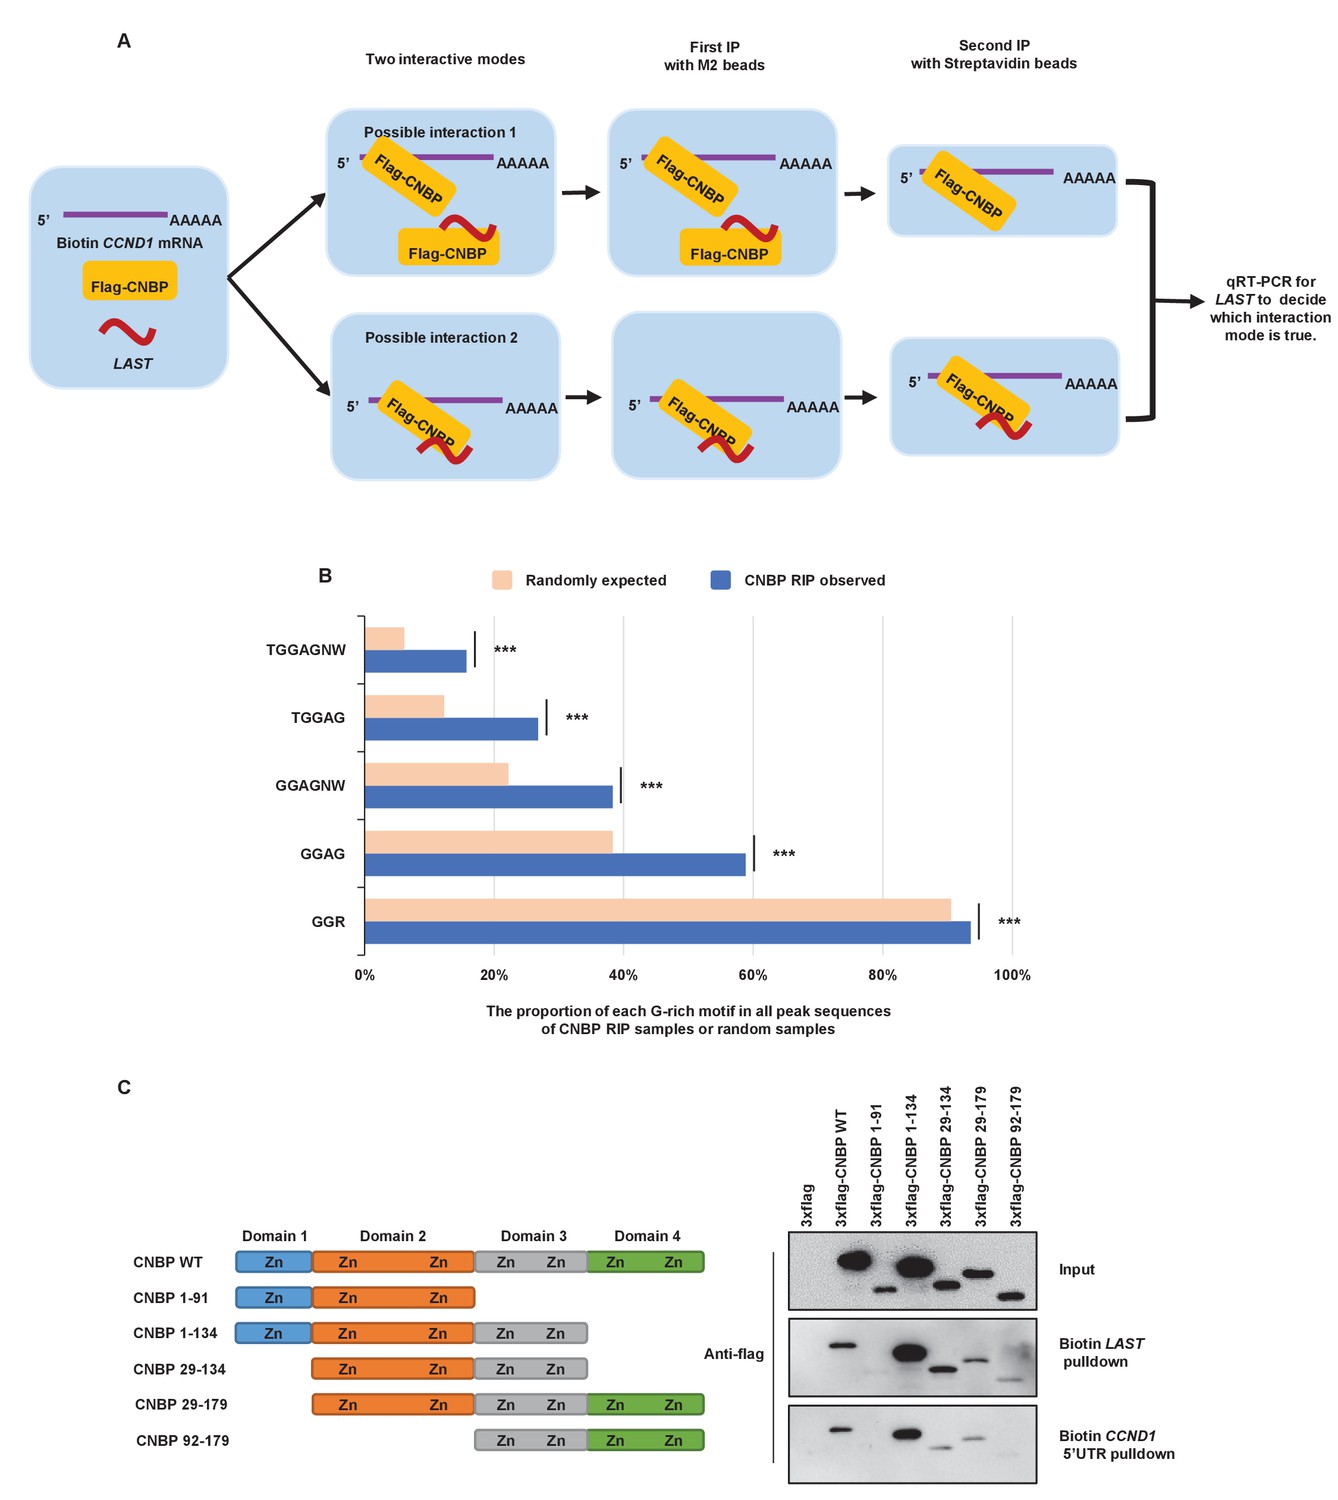
(A) A schematic illustration of the two-step immunoprecipitation/pulldown assay to determine the interactive mode for CCND1, CNBP and LAST. (B) CNBP RIP sequencing enriched peaks were analyzed, and all those containing a series of G-rich motifs were selected. For a given G-rich motif, the average proportion of motif-containing sequences in 1000 randomly generated DNA sequence samples was used as a negative control. The proportions of G-rich motif-containing peaks in all RIP peak sequences and the average proportion of G-rich motif-containing sequences in 1000 random samples are shown in the bar graph (***p<0.001, U-test). (C) In vitro transcribed biotin-labeled LAST or the biotin-labeled CCND1 5’UTR was separately incubated with lysates extracted from HEK293T cells expressing full-length CNBP or the indicated CNBP deletion mutants for 3 hr. The biotin pull-down assay was then carried out.
Figure 4—figure supplement 3
Uncropped images of blots.
Red boxes indicate the cropped regions.
Figure 5 with 1 supplement
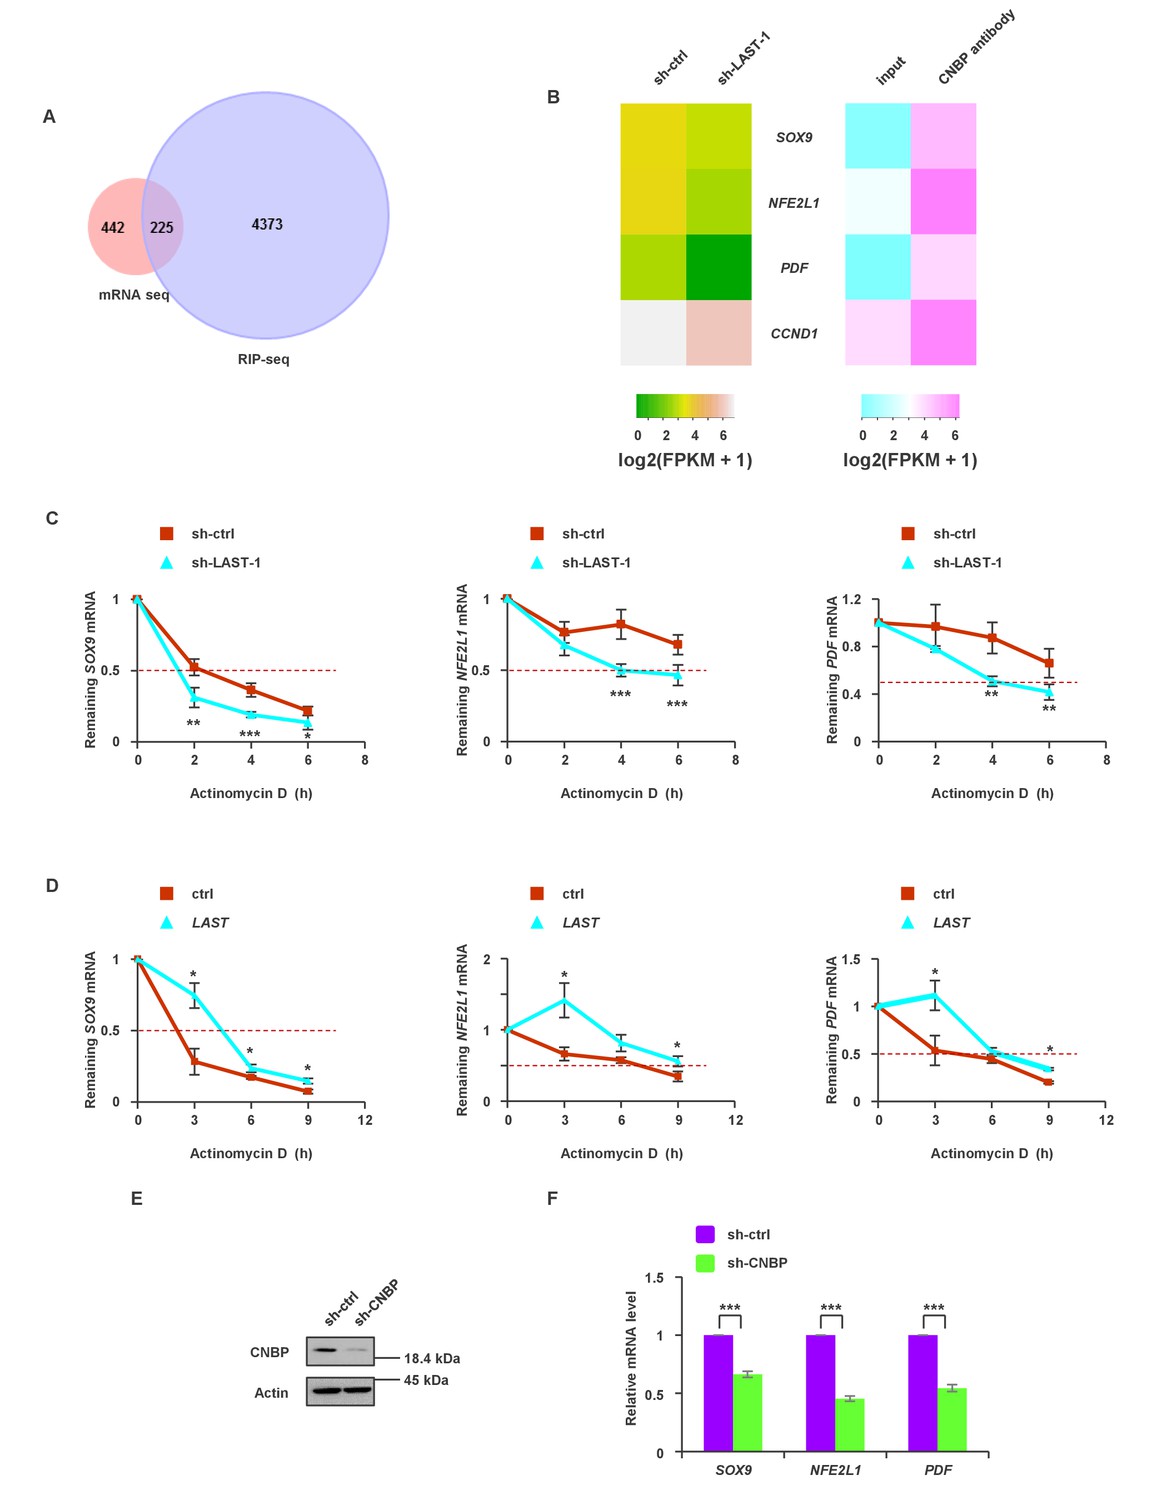
The synergistic effect of LAST and CNBP on mRNA expression.
(A) Venn diagram represents 225 overlapping transcripts (Supplementary file 2) obtained from LAST RNA-seq (red) and CNBP RIP-seq (violet). (B) Heatmap showing that SOX9, NFE2L1, PDF and CCND1 are not only decreased upon LAST knockdown but also enriched by CNBP. (C) HCT116 cells expressing control shRNA or LAST shRNA-1 were treated with actinomycin D (1 μg/mL) for the indicated periods of time. Total RNAs were extracted and then analyzed by real-time RT-PCR to examine the mRNA half-life of SOX9, NFE2L1 and PDF. Data shown are the mean ± SD (n = 6; *p<0.05, **p<0.01, ***p<0.001, two-tailed t-test). (D) HCT116 cells expressing control RNA or LAST were treated with actinomycin D (1 μg/mL) for the indicated periods of time. Total RNAs were extracted and then analyzed by real-time RT-PCR to examine the mRNA half-life of SOX9, NFE2L1 and PDF. (E) HCT116 cells were infected with lentiviruses expressing control shRNA or CNBP shRNA. Ninety-six hours later, cell lysates were subjected to western blotting to detect the CNBP knockdown efficiency. (F) HCT116 cells were infected with lentiviruses expressing control shRNA or CNBP shRNA. Ninety-six hours after injection, total RNA was analyzed by real-time RT-PCR with the indicated primers. Data shown are the mean ± SD (n = 3; ***p<0.001, two-tailed t-test).
-
Figure 5—source data 1
Source data for Figure 5C, D and F.
- https://doi.org/10.7554/eLife.30433.022
Figure 5—figure supplement 1

Uncropped images of blots.
Red boxes indicate the cropped regions.
Figure 6 with 2 supplements
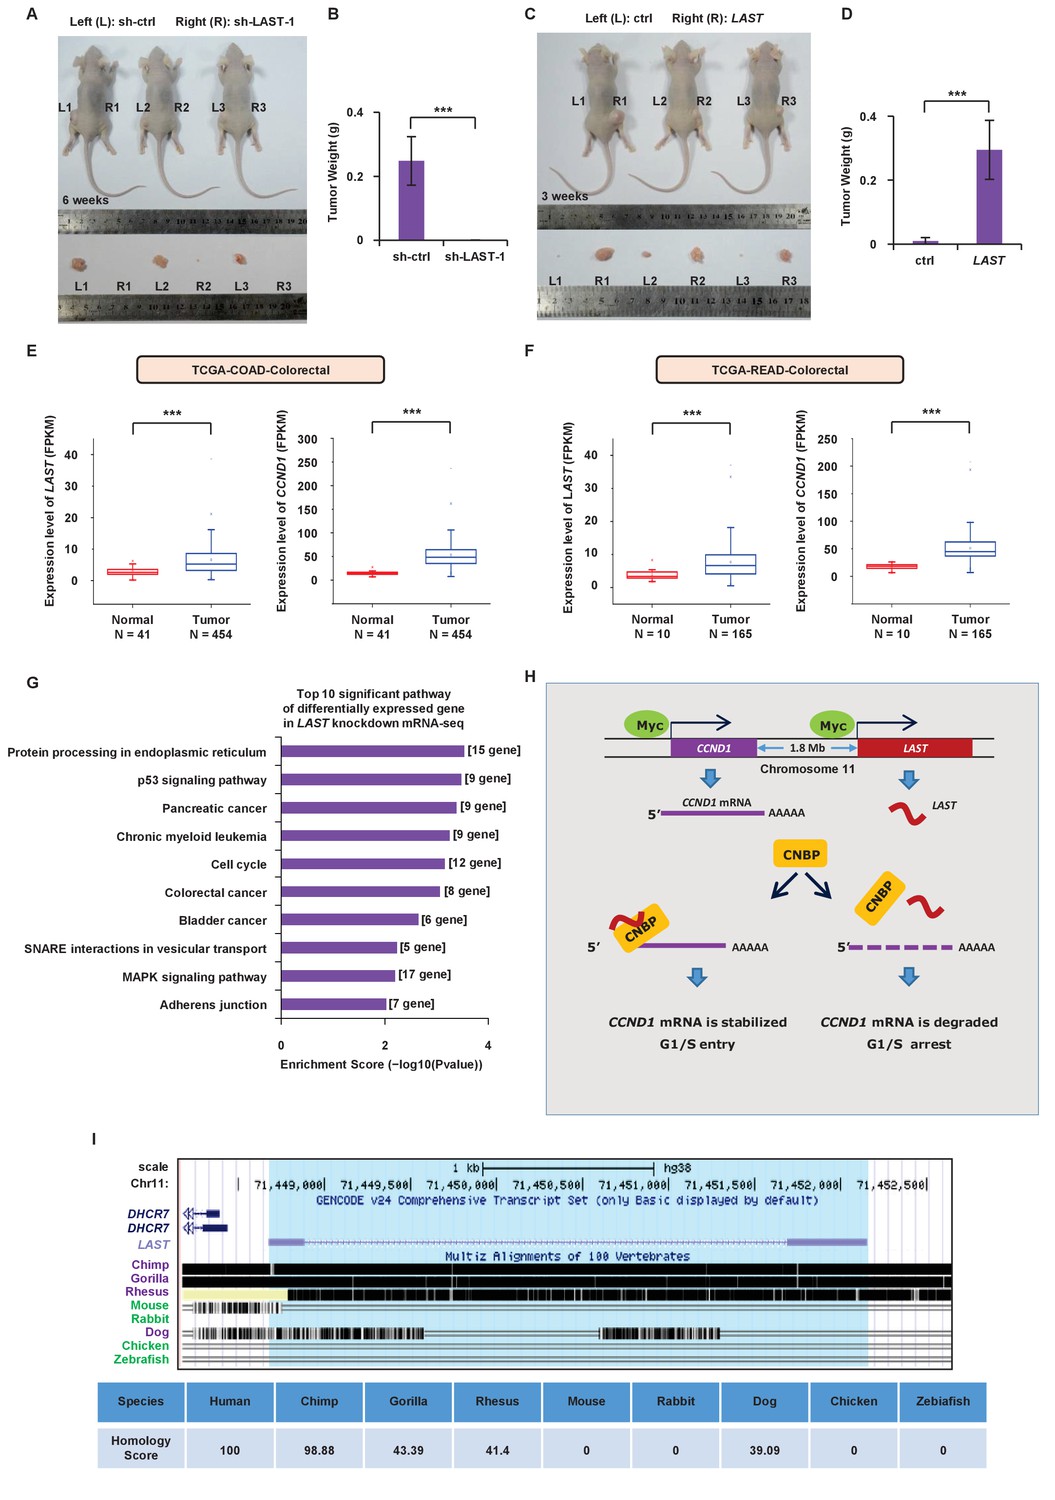
LAST promotes tumorigenesis.
(A) A total of 3 × 10⁶ HCT116 cells expressing either control shRNA or LAST shRNA-1 were individually injected subcutaneously into the flanks of nude mice (n = 7 for each group) as indicated. Representative photographs of xenograft tumors in situ were taken 6 weeks after injection. (B) Tumors of the above nude mice (Figure 6A) were also selected to be weighed. Data shown are the mean ± SD (n = 7; ***p<0.001, two-tailed t-test). (C) A total of 3 × 10⁶ HCT116 cells expressing either control RNA or LAST were individually injected subcutaneously into the flanks of nude mice (n = 7 for each group) as indicated. Representative photographs of xenograft tumors in situ were taken 3 weeks after injection. (D) Tumors of the above nude mice (Figure 6C) were selected and weighed. Data shown are the mean ± SD (n = 7; ***p<0.001, two-tailed t-test). (E) Data for the LAST and CCND1 expression levels in COAD (colon adenocarcinoma) tumor and normal tissues were downloaded from the TCGA dataset. Box plots showing differential expression of LAST and CCND1 between normal (n = 41) and tumor (n = 454) samples. Statistical analysis was performed using the two-tailed t-test (***p<0.001). (F) Data for LAST and CCND1 expression levels in READ (rectum adenocarcinoma) tumor and normal tissues were downloaded from the TCGA dataset. Box plots showing the differential expression of LAST and CCND1 between normal (n = 10) and tumor (n = 165) samples. Statistical analysis was performed using the two-tailed t-test (***p<0.001). (G) Pathway analysis of differentially downregulated genes (log2 (fold change) below - 0.58 in RNA-seq) in HCT116 with and without LAST knockdown. The top 10 significant pathways with enrichment scores are shown. (H) A schematic illustration of the proposed model depicting the role of c-Myc-induced LAST in regulating CCND1 mRNA stability via CNBP. (I) Gene homology analysis of LAST in human, chimp, gorilla, rhesus, mouse, rabbit, dog, chicken and zebrafish.
-
Figure 6—source data 1
Source data for Figure 6B, D, E and F.
- https://doi.org/10.7554/eLife.30433.026
Figure 6—figure supplement 1
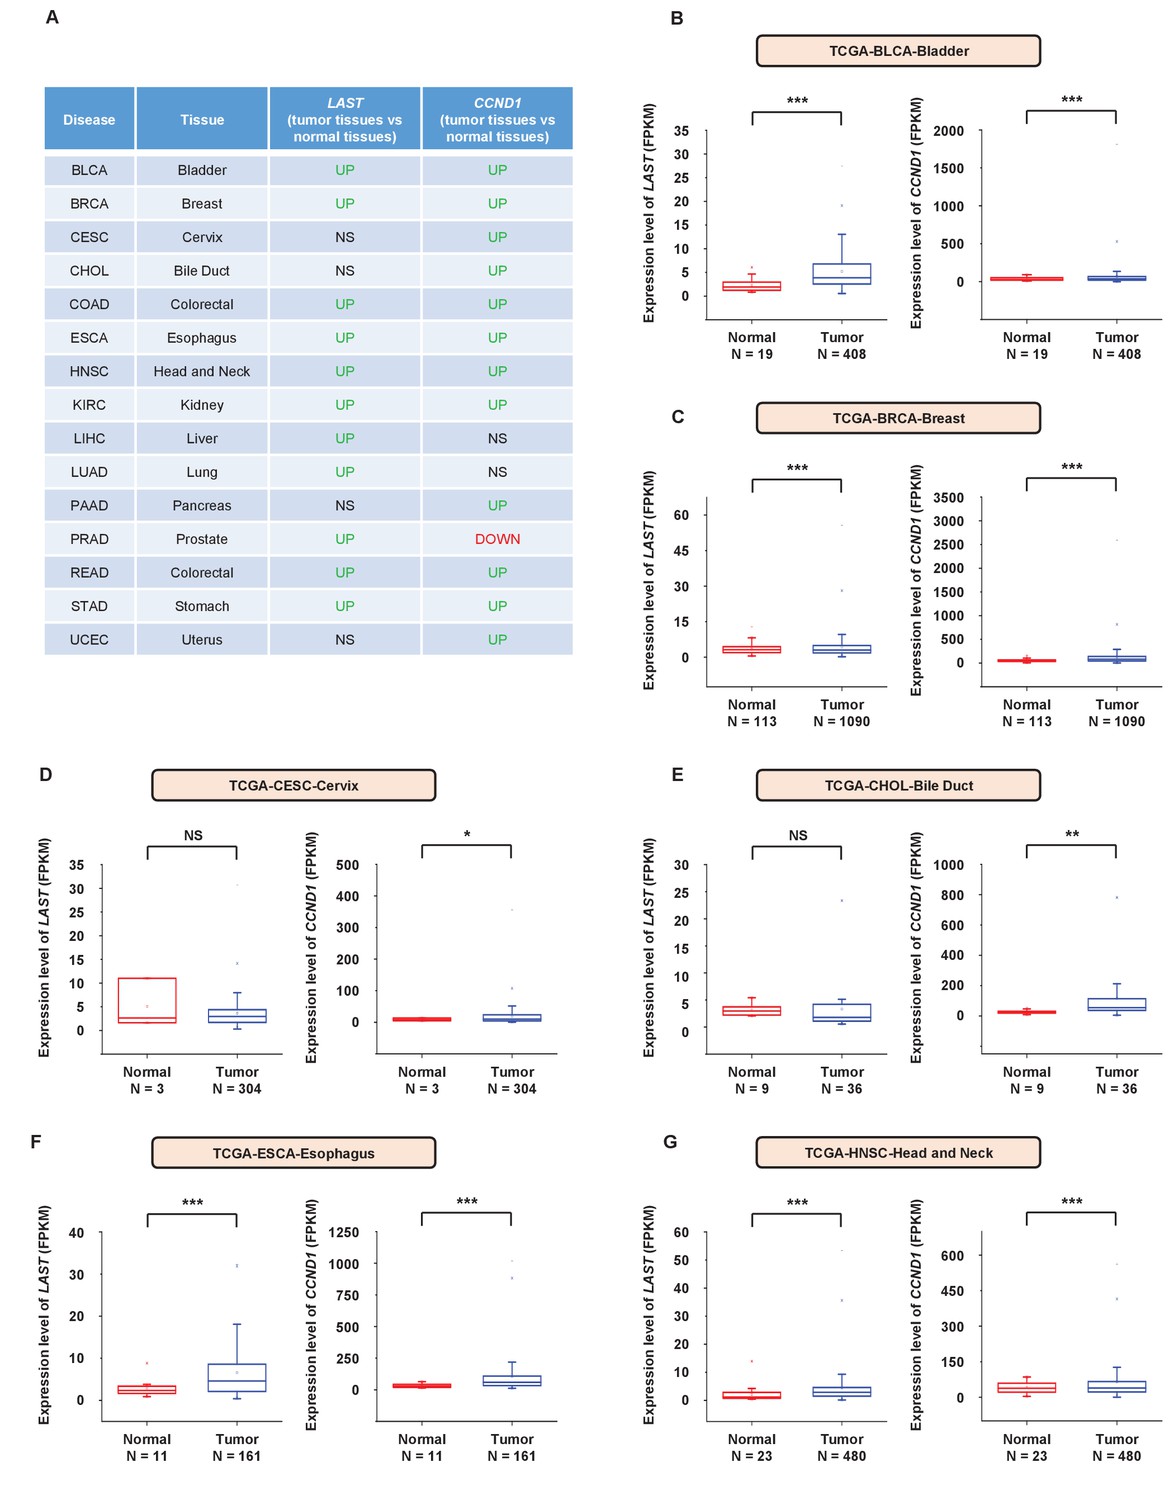
The expression levels of LAST and CCND1 are both higher in most tumor tissues than in their normal counterparts.
(A) Summary table of the differential expression of LAST and CCND1 between 15 tumor tissue types and their corresponding normal tissues. Data were from the TCGA dataset. (B) Data for the LAST and CCND1 expression levels in BLCA (bladder urothelial carcinoma) tumor and normal tissues were downloaded from the TCGA dataset. Box plots showing differential expression of LAST and CCND1 between normal (n = 19) and tumor (n = 408) samples. Statistical analysis was performed using the two-tailed t-test (***p<0.001). (C) Data for the LAST and CCND1 expression levels in BRCA (breast invasive carcinoma) tumor and normal tissues were downloaded from the TCGA dataset. Box plots showing differential expression of LAST and CCND1 between normal (n = 113) and tumor (n = 1090) samples. Statistical analysis was performed using the two-tailed t-test (***p<0.001). (D) Data for the LAST and CCND1 expression levels in CESC (cervical squamous cell carcinoma) tumor and normal tissues were downloaded from the TCGA dataset. Box plots showing the differential expression of LAST and CCND1 between normal (n = 3) and tumor (n = 304) samples. Statistical analysis was performed using the two-tailed t-test (*p<0.05). (E) Data for the LAST and CCND1 expression levels in CHOL (cholangiocarcinoma) tumor and normal tissues were downloaded from the TCGA dataset. Box plots showing the differential expression of LAST and CCND1 between normal (n = 9) and tumor (n = 36) samples. Statistical analysis was performed using the two-tailed t-test (**p<0.01). (F) Data for the LAST and CCND1 expression levels in ESCA (esophageal carcinoma) tumor and normal tissues were downloaded from the TCGA dataset. Box plots showing the differential expression of LAST and CCND1 between normal (n = 11) and tumor (n = 161) samples. Statistical analysis was performed using the two-tailed t-test (***p<0.001). (G) Data for the LAST and CCND1 expression levels in HNSC (head and neck squamous carcinoma) tumor and normal tissues were downloaded from the TCGA dataset. Box plots showing the differential expression of LAST and CCND1 between normal (n = 23) and tumor (n = 480) samples. Statistical analysis was performed using the two-tailed t-test (***p<0.001).
Figure 6—figure supplement 2
The expression levels of LAST and CCND1 are both higher in most tumor tissues than in their normal counterparts.
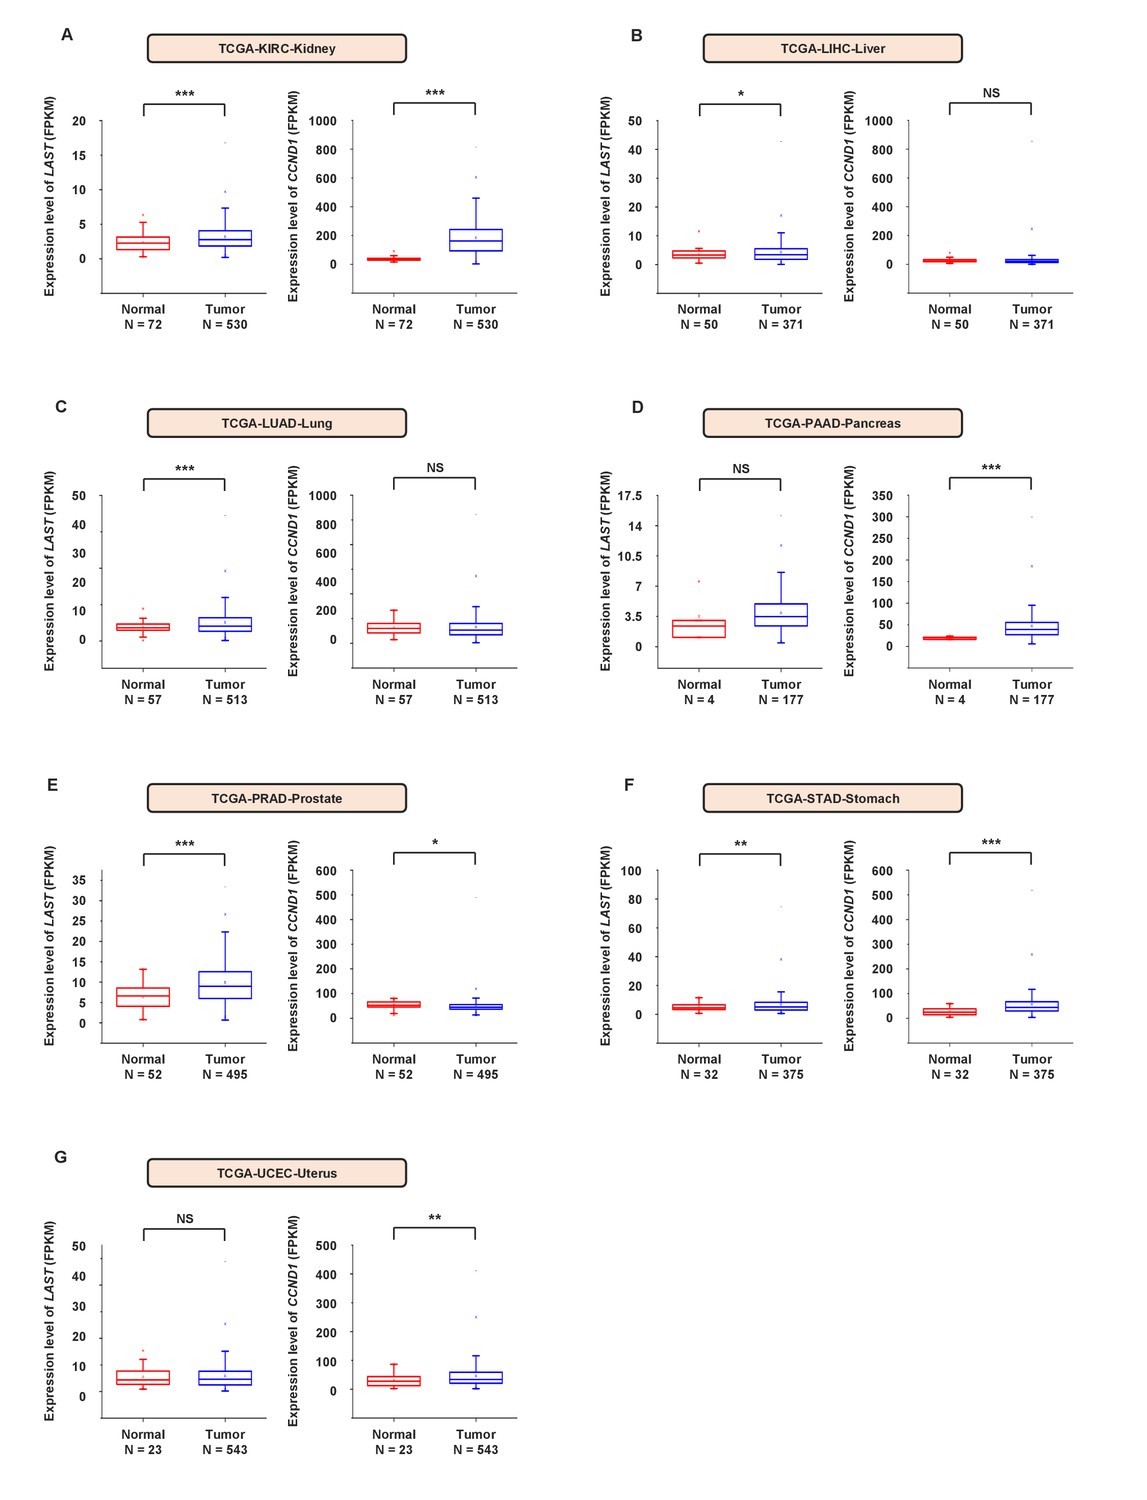
(A) Data for the LAST and CCND1 expression levels in KIRC (kidney renal clear cell carcinoma) tumor and normal tissues were downloaded from the TCGA dataset. Box plots showing the differential expression of LAST and CCND1 between normal (n = 72) and tumor (n = 530) samples. Statistical analysis was performed using the two-tailed t-test (***p<0.001). (B) Data for the LAST and CCND1 expression levels in LIHC (liver hepatocellular carcinoma) tumor and normal tissues were downloaded from the TCGA dataset. Box plots showing the differential expression of LAST and CCND1 between normal (n = 50) and tumor (n = 371) samples. Statistical analysis was performed using the two-tailed t-test (*p<0.05). (C) Data for the LAST and CCND1 expression levels in LUAD (lung adenocarcinoma) tumor and normal tissues were downloaded from the TCGA dataset. Box plots showing the differential expression of LAST and CCND1 between normal (n = 57) and tumor (n = 513) samples. Statistical analysis was performed by the two-tailed t-test (***p<0.001). (D) Data for the LAST and CCND1 expression levels in PAAD (pancreatic adenocarcinoma) tumor and normal tissues were downloaded from the TCGA dataset. Box plots showing the differential expression of LAST and CCND1 between normal (n = 4) and tumor (n = 177) samples. Statistical analysis was performed using the two-tailed t-test (***p<0.001). (E) Data for the LAST and CCND1 expression levels in PRAD (prostate adenocarcinoma) tumor and normal tissues were downloaded from the TCGA dataset. Box plots showing the differential expression of LAST and CCND1 between normal (n = 52) and tumor (n = 495) samples. Statistical analysis was performed using the two-tailed t-test (*p<0.05, ***p<0.001). (F) Data for the LAST and CCND1 expression levels in STAD (stomach adenocarcinoma) tumor and normal tissues were downloaded from the TCGA dataset. Box plots showing the differential expression of LAST and CCND1 between normal (n = 32) and tumor (n = 375) samples. Statistical analysis was performed using the two-tailed t-test (**p<0.01, ***p<0.001). (G) Data for the LAST and CCND1 expression levels in UCEC (uterine corpus endometrial carcinoma) tumor and normal tissues were downloaded from the TCGA dataset. Box plots showing the differential expression of LAST and CCND1 between normal (n = 23) and tumor (n = 543) samples. Statistical analysis was performed using the two-tailed t-test (**p<0.01).
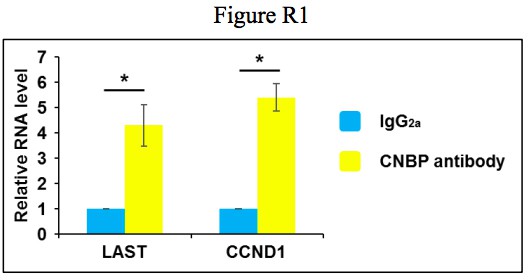
Author response image 1
Tables
Table 1
Oligomers used in this study
https://doi.org/10.7554/eLife.30433.027| Name | Application | Sequence |
|---|---|---|
| qrt-lncRNA-5639-F | qRT-PCR | GACCTTGGGCTAGTTATTTTGTG |
| qrt-lncRNA-5639-R | qRT-PCR | TCCTCTCTCCTTTCCTGTCTG |
| qrt-lncRNA-51-F | qRT-PCR | ACCACAGATCCAGTAGCCTAG |
| qrt-lncRNA-51-R | qRT-PCR | CCTAACCACACTCCAAGACAC |
| qrt-lncRNA-5630-F | qRT-PCR | CTCCAACATCACCAAAACCAC |
| qrt-lncRNA-5630-R | qRT-PCR | TCTTGGCATGTGGTATCTGTC |
| qrt-lncRNA-5690-F | qRT-PCR | TCGACATGAAACTTGGGTGG |
| qrt-lncRNA-5690-R | qRT-PCR | GGCCAAATTCACTTGATGCTC |
| qrt-LAST-F | qRT-PCR | GGATCCTCCATAAACGATCAG |
| qrt-LAST-R | qRT-PCR | AGCTGGTCGGTGGTCTCTTA |
| qrt-CNBP-F | qRT-PCR | CCTCGGATAGAGGTTTCCAG |
| qrt-CNBP -R | qRT-PCR | ACCGCAGTTATAGCAGGCTT |
| qrt-CDK4-F | qRT-PCR | CTGGTGTTTGAGCATGTAGACC |
| qrt-CDK4-R | qRT-PCR | AAACTGGCGCATCAGATCCTT |
| qrt-CDK2-F | RT-PCR | GCTAGCAGACTTTGGACTAGCCAG |
| qrt-CDK2-R | qRT-PCR | AGCTCGGTACCACAGGGTCA |
| qrt-CCNB1-F | qRT-PCR | AAGAGCTTTAAACTTTGGTCTGGG |
| qrt-CCNB1-R | qRT-PCR | CTTTGTAAGTCCTTGATTTACCATG |
| qrt-CCNE1-F | qRT-PCR | ATCAGCACTTTCTTGAGCAACA |
| qrt-CCNE1-R | qRT-PCR | TTGTGCCAAGTAAAAGGTCTCC |
| qrt-CCND1-CDS-F | qRT-PCR | ACGAAGGTCTGCGCGTGTT |
| qrt-CCND1-CDS-R | qRT-PCR | CCGCTGGCCATGAACTACCT |
| qrt-CCND1-5’UTR-F | qRT-PCR | CTGGAGCCTCCAGAGGGCTGT |
| qrt-CCND1-5’UTR-R | qRT-PCR | GCGCTCCCTCGCGCTCTTC |
| qrt-CCND1-3’UTR-1-F | qRT-PCR | GGAAAGCTTCATTCTCCTTGTTG |
| qrt-CCND1-3’UTR-1-R | qRT-PCR | TTCTTTTGCTTAAGTCAGAGATGGAA |
| qrt-CCND1-3’UTR-2-F | RT-PCR | CATTGATTCAGCCTGTTTGG |
| qrt-CCND1-3’UTR-2-R | qRT-PCR | GAATTCATCGGAACCGAACT |
| qrt-CCND1-3’UTR-3-F | RT-PCR | TCTCAATGAAGCCAGCTCACA |
| qrt-CCND1-3’UTR-3-R | RT-PCR | TTTTGGTTCGGCAGCTTG |
| qrt-CCND1-intron-1-F | qRT-PCR | CTTTGTTCAAGCAGCGAGTC |
| qrt-CCND1-intron-1-R | qRT-PCR | AAGGTCCTCCAAGCCGATA |
| qrt-CCND1-intron-2-F | qRT-PCR | CCCAGCTCCCTTGAGTCC |
| qrt-CCND1-intron-2-R | qRT-PCR | CGGTCCTGGATGTTGGAG |
| qrt-CCND1-intron-3-F | qRT-PCR | TTTGTCATCGGCCAGAAATA |
| qrt-CCND1-intron-3-R | qRT-PCR | GACCTTCAGAGCACAGACCA |
| qrt-CCND1-intron-4-F | qRT-PCR | ATGTGCGTGGCCAATAAATA |
| qrt-CCND1-intron-4-R | qRT-PCR | ATCCCAGGGTTTAACAGCAG |
| qrt-c-Myc-F | qRT-PCR | AGCGACTCTGAGGAGGAAC |
| qrt-c-Myc-R | qRT-PCR | TGTGAGGAGGTTTGCTGTG |
| qrt-PDF-F | qRT-PCR | GCTGCGGCGCTCCTATT |
| qrt-PDF-R | qRT-PCR | TTGGCACACGTGCGAGAAC |
| qrt-NFE2L1-F | qRT-PCR | TGGCTATGGTATCCACCCCA |
| qrt-NFE2L1-R | qRT-PCR | ACCAGCCAGGCATTTACCTC |
| qrt-SOX9-F | qRT-PCR | GCGAGCCCGATCTGAAGAAG |
| qrt-SOX9-R | qRT-PCR | GTTCTTGCTGGAGCCGTTGA |
| qrt-DHCR7-F | qRT-PCR | ATCTGCCATGACCACTTCGG |
| qrt-DHCR7-R | qRT-PCR | CAGACCCTGCAGCGTGTAAA |
| qrt-NADSYN1-F | qRT-PCR | GCCGTGAGGAGTGGAAATGA |
| qrt-NADSYN1-R | qRT-PCR | GTGGTCAGTATGCGTCCACA |
| qrt-TOMM6-F | qRT-PCR | TGCTGGCTCGGCTAATGAAA |
| qrt-TOMM6-R | qRT-PCR | TCCTATCAGTGGCAAAGCGG |
| qrt-CEBPG-F | qRT-PCR | GAGCATGCACACAACCTTGC |
| qrt-CEBPG-R | qRT-PCR | CATTGTCGCCATCTGCTGTC |
| qrt-PRNP-F | qRT-PCR | GGAGAACTTCACCGAGACCG |
| qrt-PRNP-R | qRT-PCR | AGGACCATGCTCGATCCTCT |
| qrt-CHMP1B-F | qRT-PCR | GTTCAACCTGAAGTTCGCGG |
| qrt-CHMP1B-R | qRT-PCR | GGCATTTTCGGCGTGTATCC |
| qrt-MSX1-F | qRT-PCR | CCACTCGGTGTCAAAGTGGA |
| qrt-MSX1-R | qRT-PCR | GAAGGGGACACTTTGGGCTT |
| qrt-THAP11-F | qRT-PCR | AACCTGGTATCTGCTTCCGC |
| qrt-THAP11-R | qRT-PCR | TGAGATCGATGGGCTTCACG |
| qrt-C16orf91-F | qRT-PCR | ATGGGAAAGGGACATCAGCG |
| qrt-C16orf91-R | qRT-PCR | CTCCCCACACCTGTCTCAAC |
| qrt-VMA21-F | qRT-PCR | CATCTGCACAGCACCTTACAGTTTGC |
| qrt-VMA21-R | qRT-PCR | GAAATGCAGCACATCCAAATCCTCCC |
| qrt-PLEC-F | qRT-PCR | CCGGGCAGTCTCTGAAGATG |
| qrt-PLEC-R | qRT-PCR | GCGTTTTCCCAAGGTTCCAG |
| qrt-DLG5-F | qRT-PCR | GATGACCCGGGAGAGAAACG |
| qrt-DLG5-R | qRT-PCR | GGATTCAGCCTGTGGTAGGG |
| qrt-EPPK1-F | qRT-PCR | GTGTGTGATGAGTGGCCACACC |
| qrt-EPPK1-R | qRT-PCR | CTCTGGGTACACTGGCCTGCTCT |
| qrt-HIST2H4A-F | qRT-PCR | GGCGGAAAAGGCTTAGGCAA |
| qrt-HIST2H4A-R | qRT-PCR | CCAGAGATCCGCTTAACGCC |
| qrt-MYH9-F | qRT-PCR | ATCTCGTGCTATCCGCCAAG |
| qrt-MYH9-R | qRT-PCR | GTTGTACGGCTCCAACAGGA |
| qrt-PPL-F | qRT-PCR | AGGCAAATACAGCCCCACTG |
| qrt-PPL-R | qRT-PCR | AGGTCACTCTGCATCTTGGC |
| qrt-PRKDC-F | qRT-PCR | GGACCTATAGCGTTGTGCCC |
| qrt-PRKDC-R | qRT-PCR | GATCACTCAGGTAAGCCGCC |
| qrt-GDF15-F | qRT-PCR | TCCAGATTCCGAGAGTTGCG |
| qrt-GDF15-R | qRT-PCR | CGAGGTCGGTGTTCGAATCT |
| qrt-Actin-F | qRT-PCR | GACCTGACTGACTACCTCATGAAGAT |
| qrt-Actin-R | qRT-PCR | GTCACACTTCATGATGGAGTTGAAGG |
| qrt-U6-F | qRT-PCR | GCTTCGGCAGCACATATACTAAAAT |
| qrt-U6-R | qRT-PCR | CGCTTCACGAATTTGCGTGTCAT |
| qrt-U1-F | qRT-PCR | GGCGAGGCTTATCCATTG |
| qrt-U1-R | qRT-PCR | CCCACTACCACAAATTATGC |
| sh-LAST-F-1 | plasmid construction | ccggAAGAGGATCCTCCATAAACGActcgagTCGTTTATGGAGGATCCTCTTtttttg |
| sh-LAST-R-1 | plasmid construction | aattcaaaaaAAGAGGATCCTCCATAAACGActcgagTCGTTTATGGAGGATCCTCTT |
| sh-LAST-F-2 | plasmid construction | ccggTCAGCCATAGCAGCTGTGATTctcgagAATCACAGCTGCTATGGCTGAtttttg |
| sh-LAST-R-2 | plasmid construction | aattcaaaaaTCAGCCATAGCAGCTGTGATTctcgagAATCACAGCTGCTATGGCTGA |
| sh-lncRNA-51-F-1 | plasmid construction | ccggAAGCAGATGGAGGGAAGTTggatcc AACTTCCCTCCATCTGCTTtttttg |
| sh-lncRNA-51-R-1 | plasmid construction | aattcaaaaaAAGCAGATGGAGGGAAGTTggatccAACTTCCCTCCATCTGCTT |
| sh-lncRNA-51-F-2 | plasmid construction | ccggGGAAGCAGAGTAAGCAAGTGAGGATCCTCACTTGCTTACTCTGCTTCCtttttg |
| sh-lncRNA-51-R-2 | plasmid construction | aattcaaaaaGGAAGCAGAGTAAGCAAGTGAGGATCCTCACTTGCTTACTCTGCTTCC |
| LAST-DNA-1-sense | lncRNA pull down | (biotin-)TAAACGATCAGCCATAGCA |
| LAST-DNA-1-antisense | lncRNA pull down | (biotin-)TGCTATGGCTGATCGTTTA |
| LAST-DNA-2-sense | lncRNA pull down | (biotin-)TCATCGTGCCTCAGTTTCC |
| LAST-DNA-2-antisense | lncRNA pull down | (biotin-)GGAAACTGAGGCACGATGA |
| LAST-DNA-3-sense | lncRNA pull down | (biotin-)ACAGACACAGTTCTTGGTC |
| LAST-DNA-3-antisense | lncRNA pull down | (biotin-)GACCAAGAACTGTGTCTGT |
| LAST-DNA-4-sense | lncRNA pull down | (biotin-)ATGGGTCATATATTACATG |
| LAST-DNA-4-antisense | lncRNA pull down | (biotin-)CATGTAATATATGACCCAT |
| LAST-DNA-5-sense | lncRNA pull down | (biotin-)GTTGAATATGTATGTTTAG |
| LAST-DNA-5-antisense | lncRNA pull down | (biotin-)CTAAACATACATATTCAAC |
| LAST-DNA-6-sense | lncRNA pull down | (biotin-)CCAGCCTCAGACAGATGGC |
| LAST-DNA-6-antisense | lncRNA pull down | (biotin-)GCCATCTGTCTGAGGCTGG |
| CCND1-DNA-1-sense | mRNA pull down | (biotin-)GCGCAGTAGCAGCGAGCAGCA |
| CCND1-DNA-1-antisense | mRNA pull down | (biotin-)TGCTGCTCGCTGCTACTGCGC |
| CCND1-DNA-2-sense | mRNA pull down | (biotin-)CCGCTGGCCATGAACTACCTG |
| CCND1-DNA-2-antisense | mRNA pull down | (biotin-)CAGGTAGTTCATGGCCAGCGG |
| CCND1-DNA-3-sense | mRNA pull down | (biotin-)AACACGCGCAGACCTTCGTTG |
| CCND1-DNA-3-antisense | mRNA pull down | (biotin-)CAACGAAGGTCTGCGCGTGTT |
| CCND1-DNA-4-sense | mRNA pull down | (biotin-)CGTAGGTAGATGTGTAACCTCT |
| CCND1-DNA-4-antisense | mRNA pull down | (biotin-)AGAGGTTACACATCTACCTACG |
| CCND1-DNA-5-sense | mRNA pull down | (biotin-)AGAGTCATCTGATTGGACAGGC |
| CCND1-DNA-5-antisense | mRNA pull down | (biotin-GCCTGTCCAATCAGATGACTCT |
| CCND1-DNA-6-sense | mRNA pull down | (biotin-)AATGAAGCCAGCTCACAGTGCT |
| CCND1-DNA-6-antisense | mRNA pull down | (biotin-)AGCACTGTGAGCTGGCTTCATT |
| ChIP-LAST-a-F | qRT-PCR for ChIP | TTCCTGACAGCAGATTCCAG |
| ChIP-LAST-a-R | qRT-PCR for ChIP | TCTGCCATGTTTGGAGAATG |
| ChIP-LAST-b-F | qRT-PCR for ChIP | ACCTGCTCACCTGGGCAAGC |
| ChIP-LAST-b-R | qRT-PCR for ChIP | GGCAATCGCTGACATCATCCGGG |
| ChIP-LAST-c-F | qRT-PCR for ChIP | GGGATCCCAGCTGACCAGCTG |
| ChIP-LAST-c-R | qRT-PCR for ChIP | GAGGCACGATGATCCAGGTGATGAG |
| ChIP-LAST-d-F | qRT-PCR for ChIP | CTGAGCCACAGTGCGAGCCG |
| ChIP-LAST-d-R | qRT-PCR for ChIP | GACAGTAAGGCCTGTTACCCGAGC |
| ChIP-LAST-e-F | qRT-PCR for ChIP | AAGTCAAACAGCACGAACCC |
| ChIP-LAST-e-R | qRT-PCR for ChIP | CGGATGGGCATTGACGTTAT |
| ChIP-LAST-f-F | qRT-PCR for ChIP | TCAAGTGCAGTTCCTGTAGTTTC |
| ChIP-LAST-f-R | qRT-PCR for ChIP | GATGGCGCTGAATTCTTGGGAACC |
| ChIP-LAST-g-F | qRT-PCR for ChIP | TCCCTTCTTGTCCCTTCAAA |
| ChIP-LAST-g-R | qRT-PCR for ChIP | CCTAAAGACCAACGGGAAAC |
| ChIP-LAST-h-F | qRT-PCR for ChIP | TCTAGGGTTCTGGGCTGTCT |
| ChIP-LAST-h-R | qRT-PCR for ChIP | GTCAGGCTCACGAGACGAT |
Additional files
-
Supplementary file 1
lncRNA expression microarray data.
Information of the selected lncRNAs is colored.
- https://doi.org/10.7554/eLife.30433.028
-
Supplementary file 2
Overlap of the CNBP RIP sequencing dataset and LAST knockdown mRNA sequencing dataset (downregulation).
Information of SOX9, PDF, NFE2L1 and CCND1 is colored.
- https://doi.org/10.7554/eLife.30433.029
-
Supplementary file 3
LAST knockdown mRNA sequencing dataset (downregulation).
- https://doi.org/10.7554/eLife.30433.030
-
Supplementary file 4
Correlation between LAST and CCND1 expression levels in fifteen TCGA tumor types.
- https://doi.org/10.7554/eLife.30433.031
-
Transparent reporting form
- https://doi.org/10.7554/eLife.30433.032
Download links
A two-part list of links to download the article, or parts of the article, in various formats.
Downloads (link to download the article as PDF)
Open citations (links to open the citations from this article in various online reference manager services)
Cite this article (links to download the citations from this article in formats compatible with various reference manager tools)
LAST, a c-Myc-inducible long noncoding RNA, cooperates with CNBP to promote CCND1 mRNA stability in human cells
eLife 6:e30433.
https://doi.org/10.7554/eLife.30433


