LAST, a c-Myc-inducible long noncoding RNA, cooperates with CNBP to promote CCND1 mRNA stability in human cells
- CAS Center for Excellence in Molecular Cell Science, Innovation Center for Cell Signaling Network, School of Life Sciences, University of Science & Technology of China, China
- Henan Provincial People’s Hospital, School of Medicine, Henan University, China
Abstract
Cyclin D1 is a critical regulator of cell cycle progression and works at the G1 to S-phase transition. Here, we report the isolation and characterization of the novel c-Myc-regulated lncRNA LAST (LncRNA-Assisted Stabilization of Transcripts), which acts as a CCND1 mRNA stabilizer. Mechanistically, LAST was shown to cooperate with CNBP to bind to the 5′UTR of CCND1 mRNA to protect against possible nuclease targeting. In addition, data from CNBP RIP-seq and LAST RNA-seq showed that CCND1 mRNA might not be the only target of LAST and CNBP; three additional mRNAs were shown to be post-transcriptional targets of LAST and CNBP. In a xenograft model, depletion of LAST diminished and ectopic expression of LAST induced tumor formation, which are suggestive of its oncogenic function. We thus report a previously unknown lncRNA involved in the fine-tuned regulation of CCND1 mRNA stability, without which CCND1 exhibits, at most, partial expression.
https://doi.org/10.7554/eLife.30433.001eLife digest
Cell division involves a series of steps in which the cell grows, duplicates its contents, and then divides into two. Together these steps are called the cell cycle, and the transition between each step must be controlled to make sure that events take place in the right order. Any loss of control can cause cells to divide in an unrestrained manner, which may lead to cancer.
Proteins called cyclins control progression through the cell cycle. As such, these proteins need to be produced in the correct amounts and at the correct times. Transcription factors are proteins that switch genes on or off to help regulate how much protein is made from those genes. A transcription factor known as c-Myc regulates the expression of the genes that encode the cyclins. Among these genes, one called CCND1 is particularly important because it encodes a protein that controls a crucial transition in the cell cycle: it marks a ‘point of no return’, beyond which cells are committed to dividing.
When a transcription factor switches on a gene, the gene gets copied into a molecule of messenger RNA, which is then translated into protein. But, cells also contain genes that do not code for proteins. Transcription factors can bind to such non-coding genes, leading to the production of so-called long non-coding RNAs (often abbreviated to lncRNAs).
Many lncRNAs can affect the expression of other genes. Cao, Zhang et al. have now asked whether any lncRNAs regulate CCND1 in human cells. The analysis revealed that the transcription factor c-Myc promotes the expression of a previously unidentified lncRNA. Cao, Zhang et al. name this lncRNA LAST, which is officially short for LncRNA-assisted stabilization of transcripts, and show thatit makes the CCND1 messenger RNA more stable. In other words, it makes the messenger RNAs ‘last’ longer in the cell. This in turn, ensures that the cell cycle progresses in the correct manner, allowing cells to complete their division. In the absence of LAST, the CCND1 messenger RNA becomes unstable and as a result the cell cycle does not progress.
Cao, Zhang et al. then explored the role of LAST in cancer cells. When human colon cancer cells that expressed LAST were implanted into mice, they formed tumors. Yet, reducing the expression of LAST in the colon cancer cells made the tumors grow slower.
Future challenges will be to understand how LAST makes messenger RNAs stable and further explore its role in cancer. A better understanding of this molecule could reveal whether it can be used to help doctors diagnose or treat cancers.
https://doi.org/10.7554/eLife.30433.002Introduction
The oncoprotein c-Myc plays a pivotal role in multiple cellular processes, such as cell cycle progression, malignant transformation, differentiation suppression and apoptosis induction, predominantly through its transcription activity (Seth et al., 1993; Drayton et al., 2003; Wei et al., 2003; Demeterco et al., 2002; Prendergast, 1999; Amati et al., 1992; Lee et al., 1996; Hoffman and Liebermann, 2008). Indeed, as a master transcriptional factor, c-Myc regulates the expression of approximately 10–15% of genes in the genome, including a variety of protein-coding genes (Lin et al., 2012; Nie et al., 2012; Fernandez et al., 2003), such as CDKN1A, CDKN2B, CCND1, CCND2, CDK4 and E2F2 (Adhikary and Eilers, 2005).
Among c-Myc target genes, CCND1 is of particular importance in cell cycle control and is characterized by the dramatic periodicity of the abundance of its protein product cyclin D1 throughout the cell cycle (Sherr, 1995). Cyclin D1 forms a complex with CDK4 or CDK6 and functions as a regulatory subunit whose activity is required for G1/S transition (Sherr, 1995; Resnitzky et al., 1994). Cyclin D1 also interacts with the tumor suppressor pRB1, which in turn positively regulates cyclin D1 expression (DeGregori, 2004). Mutation, amplification and overexpression of CCND1 are frequently observed in cancer and have been reported to contribute to tumorigenesis (Wiestner et al., 2007; Elsheikh et al., 2008; Musgrove et al., 2011). Cyclin D1 is a short-lived protein with a rapid turnover rate (~24 min) due to degradation by the ubiquitin-proteasome system (Diehl et al., 1998; Diehl et al., 1997). While early studies showed that the Skp2 F-box protein is involved in cyclin D1 degradation (Yu et al., 1998), a recent study has identified two additional F-box proteins that play important roles in targeting cyclin D1 for proteasome degradation (Lin et al., 2006; Okabe et al., 2006).
c-Myc can upregulate or downregulate expression of cyclin D1 in a context-dependent manner. On the one hand, c-Myc, together with Max, a co-transcription factor, activates CCND1 transcription through an E box located at −558 nt in its promoter (Kress et al., 2015; Yu et al., 2005; Guo et al., 2011). On the other hand, simultaneous overexpression of c-Myc and ZO-2 enhances repression of the CCND1 promoter through the E box in MDCK cells (Gonzalez-Mariscal et al., 2009). In addition, c-Myc has been reported to repress the cyclin DI promoter and antagonize USF-mediated transactivation in BALB/c-3T3, Rat6 and rat embryo fibroblasts (Philipp et al., 1994). In addition to c-Myc, multiple transcription factors, including AP-1, NF-κB, E2F and Oct-1, can bind to their respective CCND1 promoters and regulate its expression (Guo et al., 2011). CCND1 can also be regulated epigenetically through histone modifications; GATA3 cooperates with PARP1 to regulate CCND1 transcription by modulating histone H1 incorporation (Shan et al., 2014). Moreover, post-transcriptional mechanisms are also involved in the regulation of CCND1, as exemplified by MYF5-mediated enhancement in CCND1 mRNA translation, which contributes to early myogenesis (Panda et al., 2016). Mutations in CCND1 leading to stable truncated transcripts are associated with increased cell proliferation and shortened survival of cancer patients (Wiestner et al., 2007).
Long noncoding RNAs (lncRNAs), which are defined as transcripts that are longer than 200 nucleotides and lack protein coding capacity, are emerging as important regulators of biological processes, including regulation of gene expression at multiple levels, such as chromatin remodeling, transcription, and post-transcriptional modulation (Derrien et al., 2012; Iorio and Croce, 2012; Bonasio and Shiekhattar, 2014; Wilusz et al., 2008). Genome-wide studies have shown that c-Myc transcriptionally regulates many lncRNA genes, such as PVT1, the CCAT family, and MYCLos, whereas a number of lncRNAs have been demonstrated to be important components of the c-Myc-mediated signaling network (Colombo et al., 2015; Nissan et al., 2012; Ling et al., 2013; Kim et al., 2015a; Kim et al., 2015b). Nevertheless, whether lncRNAs participate in the regulation of CCND1 remains to be fully studied.
Here, we report the isolation and characterization of the novel c-Myc regulated LAST, which acts as a CCND1 mRNA stabilizer and without which CCND1 mRNA becomes unstable and cell cycle arrest occurs in the G1 phase. Mechanistically, LAST cooperates with CNBP, a single-stranded DNA/RNA-binding factor, to bind to the 5’ untranslated region of CCND1 messenger RNA, possibly to protect against nuclease degradation. This report describes a model by which lncRNA stabilizes mRNA post-transcriptionally via 5’-end protection.
Results
Identification of LAST, a c-Myc-responsive long noncoding RNA that promotes cell proliferation
To identify novel functions of c-Myc-regulated long non-coding RNAs, doxycycline-treated or untreated P493-6 cells carrying a c-Myc tet-off system (Kim et al., 2007) were used to analyze the lncRNA expression profile via long non-coding RNA microarray analysis (Supplementary file 1, GSE106916). We selected five significantly c-Myc-downregulated lncRNAs (fold change above 8, P-value below 0.01) that were identified by the lncRNA microarray. Two of the five lncRNAs, namely, lncRNA-51 and lncRNA-52, along with CDK4 (positive control) were found to be downregulated when c-Myc expression was suppressed by doxycycline treatment (Figure 1A). Of these two c-Myc responsive lncRNAs, lncRNA-52 (RP11-660L16.2, ENST00000529369) was chosen for further investigation because knockdown of this lncRNA (Figure 1B) showed a significant reduction in colony formation (Figure 1C and D). lncRNA-52 is located approximately 1.8 Mb downstream of the cyclin D1/CCND1 gene in a head-to-tail orientation (Figure 1—figure supplement 1A). As will be shown in the following sections, this lncRNA is able to promote the stability of mRNA transcripts, including CCND1 mRNA; we therefore named it LAST (LncRNA-Assisted Stabilization of Transcripts).
Figure 1 with 2 supplements see all

LAST is positively regulated by c-Myc.
(A) P493-6 cells carrying a c-Myc tet-off system were treated with doxycycline (1 μg/mL) for 24 hr. The levels of five lncRNAs (lncRNA-5639,–51, −52,–5630 and −5690) and the positive control CDK4 were assessed by real-time RT–PCR analysis. Data shown are the mean ± SD (n = 3; ***p<0.001, two-tailed t-test). Cell lysates were also analyzed by western blotting with the indicated antibodies to ensure that gene expression was controlled by c-Myc. (B) HCT116 cells were infected with lentiviruses expressing control shRNA (sh-ctrl), shRNA-1,–2 against lncRNA-52 or shRNA-1,–2 against lncRNA-51, as indicated. The lentivirus-mediated gene knockdown efficiencies for both lncRNA-52 and lncRNA-51 were analyzed by real-time RT–PCR. Data shown are the mean ± SD (n = 3; **p<0.01, ***p<0.001, two-tailed t-test). (C) Colonies of the above cells were stained with crystal violet and photographed after 14 days of incubation. (D) The number of colonies was counted and plotted in columns. (E) Total RNA from the indicated cell lines was subjected to northern blot analysis to determine the molecular size of LAST. (F) Single molecule RNA FISH detecting endogenous LAST molecules (green) in HCT116 and H1299. Chromosomal DNA (red) was stained with PI. (G) HCT116 and H1299 cells were fractionated into cytoplasmic and nuclear extracts. Total RNA extracted from each fraction was analyzed by real-time RT–PCR. Data shown are the mean ± SD (n = 3). Actin and U1 were used as markers for the cytoplasmic and nuclear fractions, respectively. (H) The LAST transcript copy numbers per cell in HAFF, IMR90, MCF10A, HCT116, MCF7 and H1299 cells were determined by absolute quantitative PCR (qPCR). Data shown are the mean ± SD (n = 3). (I) HCT116, H1299 and MCF10A cells were infected with lentiviruses expressing control shRNA or c-Myc shRNA. Ninety-six hours after infection, total RNA and cell lysates were analyzed by real-time RT-PCR and western blotting, respectively. Data shown are the mean ± SD (n = 3; **p<0.01, ***p<0.001, two-tailed t-test). (J) HCT116, H1299 and MCF10A cells were transfected with empty vector or FLAG-c-Myc. Twenty-four hours after transfection, total RNA was extracted from these cells and subjected to real-time RT-PCR analysis. Data shown are the mean ± SD (n = 3; *p<0.05, **p<0.01, two-tailed t-test). Cell lysates were also analyzed by western blotting using the indicated antibodies. (K) Schematic representation of putative c-Myc binding sites around the LAST gene, predicted c-Myc binding fragments, qPCR-amplified fragments from the ChIP assay and fragments used in the luciferase reporter assay (upper panel). Lysates from HCT116 cells were subjected to the ChIP assay with a normal rabbit IgG or c-Myc antibody. ChIP products were amplified by qPCR with the indicated pairs of primers (Table 1). Data shown are the mean ± SD (n = 3; *p<0.05, two-tailed t-test) (lower panel). (L) Schematic diagram of the luciferase reporter systems constructed to assess LAST promoter activity. The indicated pGL3-based luciferase reporter constructs were generated to examine the transcriptional activities of two putative c-Myc binding sites, BS2 and BS3, in response to c-Myc induction. BS2M and BS3M indicate their corresponding mutant binding sites, which are written in black in the open boxes (upper panel). HCT116 cells were co-transfected with either FLAG-c-Myc or the control vector plus the indicated reporter constructs and Renilla luciferase plasmid. Twenty-four hours after transfection, reporter activity was measured and plotted after normalizing with respect to Renilla luciferase activity. Data shown are the mean ± SD (n = 3; *p<0.05, two-tailed t-test) (lower panel).
-
Figure 1—source data 1
Source data for Figure 1A, B, D, G, H, I, J, K and L.
- https://doi.org/10.7554/eLife.30433.006
To verify the existence of endogenousLAST and to determine its molecular size, northern blot analysis was performed. A band of approximately 700 nt in length was detected in both P493-6 and H1299 cells, but was absent in P493-6 cells treated with doxycycline, which suppresses c-Myc expression (Figure 1E). The apparent size of LAST was the same as predicted by the UCSC (University of California, Santa Cruz) Genome Browser, suggesting that LAST is a full-length transcript. To investigate the cellular compartment in which LAST is located, single molecule RNA fluorescent in situ hybridization (FISH) was performed in both HCT116 and H1299 cells. As shown in Figure 1F, LAST was predominantly localized in the cytosol. Cytosol localization of LAST was also confirmed by determining the levels of LAST in different sub-cellular fractions (Figure 1G). Moreover, the signal intensity of LAST was reduced in LAST-depleted cells (Figure 1—figure supplement 1B). It has been reported that lncRNAs are often present at relatively low copy numbers; hence, we measured the LAST transcript copy number per cell in various cell lines, including the normal cell lines HAFF, IMR90, and MCF10A and tumor cell lines HCT116, MCF7 and H1299. The LAST copy number was higher in tumor cells than in normal cells (Figure 1H).
Lentivirus-mediated gene knockdown of c-Myc decreased whereas ectopic expression of c-Myc increased LAST expression in HCT116, H1299 and MCF10A cells (Figure 1I and J). Furthermore, the levels of LAST and c-Myc appeared to be notably synchronous during cell cycle progression (Figure 1—figure supplement 1C). In particular, the c-Myc and LAST levels were decreased in G2/M (lane 2), followed by a rapid increase in the G1 phase (lane 3). These data suggest that LAST expression is positively regulated by c-Myc.
We next explored whether c-Myc regulates LAST expression at the transcriptional level. We first inspected the genomic sequence around the LAST gene using the JASPAR database (Mathelier et al., 2016). Six putative c-Myc binding sites (BS1, BS2, BS3, BS4, BS5 and BS6) were identified (Figure 1K, upper panel). Furthermore, we analyzed the genomic sequence around the LAST gene using the ENCODE database. Three fragments (F1, F2 and F3) were predicted to be recognized by c-Myc (Figure 1K, upper panel). The chromatin immunoprecipitation (ChIP) assay determined the association of c-Myc with chromatin fragments corresponding to the BS2 and BS3 sites (within F2 fragment) among all examined fragments (Figure 1K, lower panel). We further evaluated whether BS2 and BS3 conferred c-Myc-dependent transcriptional activity. DNA fragments containing wild-type BS2 and BS3 or their corresponding mutant binding sites were inserted into the promoter region of a firefly luciferase reporter plasmid (Figure 1L, upper panel). Luciferase expression from the reporter containing an individual BS2 or BS3 site was indeed induced by ectopic expression of c-Myc (Figure 1L, lower panel). By contrast, mutant BS2M and BS3M sites showed no response to c-Myc induction (Figure 1L, lower panel). These data demonstrate that c-Myc transactivates LAST.
LAST promotes G1/S transition and upregulates cyclin D1/CCND1
Knockdown of LAST results in reduced colony formation (Figure 1C), indicating that LAST normally promotes cell proliferation. To examine how LAST affects cell growth, the cell cycle phase distribution was analyzed by flow cytometric analysis. Knockdown of LAST caused a decrease in the percentage of cells in the S and G2/M phases and an increase in the percentage of cells in the G1 phase (Figure 2—figure supplement 1A and B), indicating that LAST knockdown prevents cell passage from the G1 phase into S phase. As a result, LAST was shown to promote G1/S phase transition.
Cell cycle regulation is controlled by many factors. To define which factor(s) were involved in LAST-mediated regulation, the mRNA levels of G1-related cyclins and CDKs genes were selected for comparison in HCT116 cells before and after LAST gene knockdown. Among all of the mRNAs examined, only the CCND1 mRNA level was significantly decreased (Figure 2A). Among all of the cyclins or CDKs examined, only cyclin D1 was shown to be downregulated when LAST was depleted (Figure 2B). The lncRNA PVT1 is known to be a c-Myc regulated lncRNA that is involved in c-Myc stability and activity (Colombo et al., 2015). However, unlike PVT1, we found that LAST, which is also regulated by c-Myc (Figure 1A), does not affect c-Myc stability since knockdown of LAST did not change c-Myc expression at either the mRNA or protein levels (Figure 2A and B). The effect of LAST on cyclin D1/CCND1 was further verified in normal HAFF cells and tumor H1299 and HCT116 cells. Depletion of LAST decreased whereas over-expression of LAST increased cyclin D1/CCND1 expression at both the mRNA and protein levels (Figure 2C and D).
Figure 2 with 2 supplements see all

LAST accelerates G1/S transition and upregulates cyclin D1/CCND1.
(A) HCT116 cells were infected with lentiviruses expressing control shRNA, LAST shRNA-1 or −2. Ninety-six hours after infection, total RNA was extracted and the transcript levels for LAST, CCND1, CCNE1, CDK2, CDK4 and c-Myc were analyzed by real-time RT-PCR. Data shown are the mean ± SD (n = 3; *p<0.05, **p<0.01, ***p<0.001, two-tailed t-test). (B) Cell lysates prepared as described above (Figure 2A) were analyzed by western blotting to examine GAPDH, cyclin D1, cyclin E1, Actin, CDK2, CDK4 and c-Myc expression. (C) HAFF and H1299 cells were infected with lentiviruses expressing control shRNA or LAST shRNA. Ninety-six hours after infection, total RNA was analyzed by real-time RT-PCR to detect the level of LAST to determine its knockdown efficiency (lower panel). Total RNA was also analyzed by real-time RT-PCR to detect the level of CCND1 mRNA and by western blotting to examine the cyclin D1 protein level (upper panel). Data shown are the mean ± SD (n = 3; *p<0.05, **p<0.01). (D) HCT116, H1299 and HAFF cells were infected with lentiviruses expressing control RNA or LAST. Ninety-six hours after infection, total RNA was analyzed by real-time RT-PCR to detect successful expression of LAST (lower panel). Total RNA was also analyzed by real-time RT-PCR to detect the level of CCND1 mRNA and by western blotting to examine the cyclin D1 protein level (upper panel). Data shown are the mean ± SD (n = 3; *p<0.05, **p<0.01, ***p<0.001, two-tailed t-test).
-
Figure 2—source data 1
Source data for Figure 2A, C and D.
- https://doi.org/10.7554/eLife.30433.010
To test if the function of LAST is mediated through an effect on the adjacent genes, we checked the shRNA-mediated LAST knockdown effect on the two adjacent genes DHCR7 and NADSYN1 (Figure 1—figure supplement 1A) and found that LAST showed no effect on either the mRNA or protein levels of those two genes (Figure 2—figure supplement 1C). Furthermore, we introduced shRNA-resistant LAST into LAST depleted cells, and as shown in Figure 2—figure supplement 1D and E, both the CCND1 mRNA and protein levels were rescued. This result excludes off-target effects of LAST shRNA knockdown.
LAST cooperates with CNBP to regulate CCND1 mRNA stability
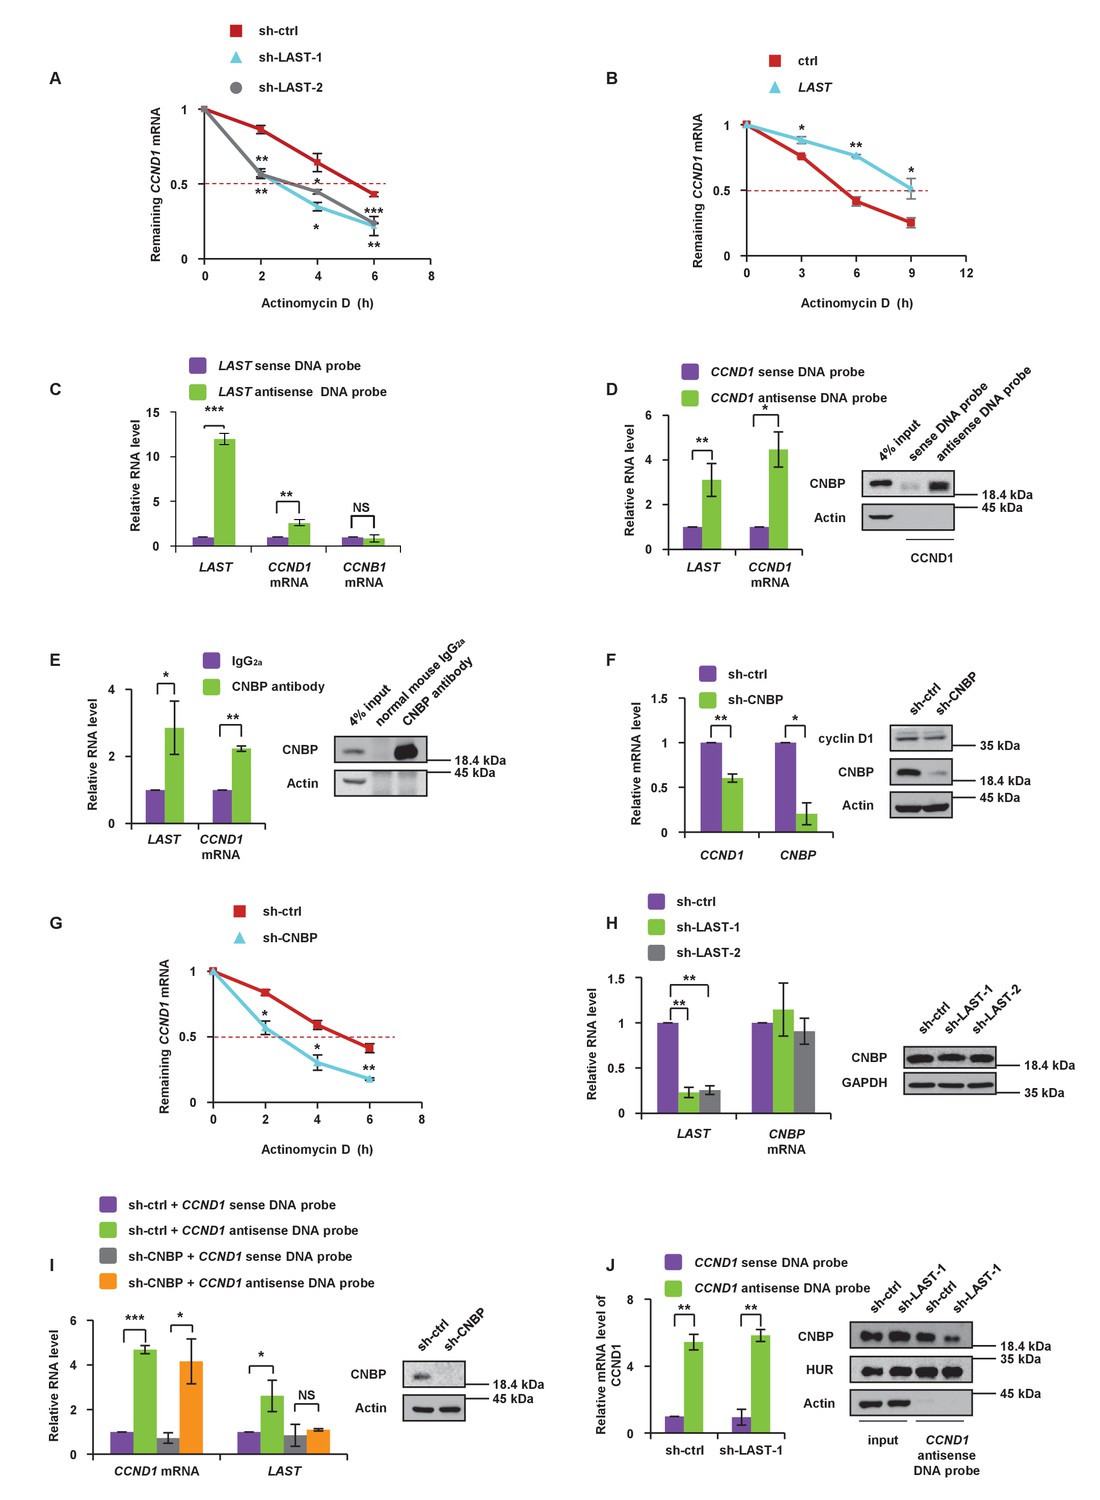
To investigate how LAST affects the CCND1 mRNA level, we first examined whether LAST regulates the CCND1 mRNA transcription process. The levels of both CCND1 pre-mRNA and mature mRNA were examined by primers against CCND1 mRNA intron- or exon-specific regions in HCT116 cells treated with and without LAST knockdown. The levels of CCND1 pre-mRNA containing four intronic regions were found to remain unaltered between control and LAST knockdown cells, whereas the levels of mature spliced CCND1 mRNA containing 5’UTR, CDS (coding sequences) and 3’UTR regions were greatly reduced upon LAST depletion (Figure 3—figure supplement 1A and B). These results suggest that LAST may post-transcriptionally regulate CCND1 mRNA. To evaluate the effect of LAST on the stability of CCND1 mRNA, HCT116 cells were treated with actinomycin D, which measures the decay of pre-existing mRNA. Knockdown of LAST resulted in a decrease of the half-life of CCND1 mRNA from 5 hr to 3 hr (Figure 3A), whereas over-expression of LAST increased its half-life from 5 hr to 9 hr (Figure 3B), indicating that LAST stabilizes CCND1 mRNA. To determine whether LAST interacts with CCND1 mRNA, we performed a biotinylated oligonucleotide pull-down assay, and as shown in Figure 3C, endogenous CCND1 mRNA but not CCNB1 mRNA co-precipitated with LAST, indicating an association between LAST and CCND1 mRNA. However, by careful inspection, we found there was no complementary base pairing between LAST and CCND1 mRNA. We therefore hypothesized that some protein(s) may mediate this binding. Proteins pulled down by LAST were separated by SDS PAGE, and a unique band with a molecular weight of approximately 20 kDa was revealed and identified as CNBP by mass spectrometry (Figure 3—figure supplement 1C, left panel). CNBP has a preference for binding single-stranded DNA and RNA (Flink and Morkin, 1995) and has been reported to function in the translation of ornithine decarboxylase mRNA (Sammons et al., 2010). To validate the MS Spectro result, we performed a LAST pull-down assay. A biotin-labeled antisense DNA probe against LAST pulled down CNBP, but not cyclin D1 (Figure 3—figure supplement 1C, right panel). To further demonstrate that CNBP can bridge CCND1 mRNA and LAST, we first pulled down CCND1 mRNA using a biotinylated antisense DNA probe as bait; both CNBP and LAST were coprecipitated (Figure 3D). The RIP assay further concluded that CNBP interacts with both CCND1 mRNA and LAST (Figure 3E). These data demonstrate that CNBP acts as a mediator for LAST and CCND1 mRNA binding. As shown in Figure 3F, CNBP knockdown in HCT116 led to a decrease in both the mRNA and protein levels of cyclin D1/CCND1. The effect of CNBP on the stability of CCND1 mRNA was evaluated in HCT116 cells treated with actinomycin D. The half-life of CCND1 mRNA was reduced from 5 hr to 3 hr as CNBP was depleted (Figure 3G), further demonstrating that CNBP prolongs the CCND1 mRNA half-life. Because CNBP predominantly resides in the cytosol, we investigated whether the association of CCND1 mRNA with LAST via CNBP only occurs in the cytosol. Using a LAST and CCND1 mRNA pull-down assay, we found that CNBP was co-precipitated by either LAST or CCND1 mRNA in the cytoplasm, but not the nucleus (Figure 3—figure supplement 1D). HNRNPK was used as a nuclear marker. Moreover, knockdown of CNBP was shown to result in decreased levels of CCND1 mRNA (Figure 3F). Further investigation revealed that knockdown of CNBP affected the level of mature CCND1 mRNA, but not unspliced CCND1 pre-mRNA, indicating that the protective role of CNBP in mature CCND1 mRNA stability occurred in the cytosol since nuclear unspliced CCND1 pre-mRNA was not affected when CNBP was silenced (Figure 3—figure supplement 1E). To further confirm that LAST affects CCND1 mRNA stability through CNBP, we knocked down CNBP in HCT116 cells. As shown in Figure 3—figure supplement 1F, the increased expression of CCND1 mRNA caused by over-expression of LAST was diminished when CNBP was depleted (lanes 2 vs. 4). Thus, our hypothesis is that LAST affects CCND1 mRNA via CNBP. Knockdown of LAST resulted in no change in CNBP at either the RNA or protein levels (Figure 3H), which suggests that LAST affects CCND1 mRNA not according to the quantity of CNBP, but rather by the association of CNBP and CCND1 mRNA. It was therefore expected that knockdown of CNBP would reduce the association between LAST and CCND1 mRNA. This was indeed the case. An RNA pull-down experiment was performed starting with the same amount of CCND1 mRNA, and less LAST was co-precipitated as CNBP was depleted (Figure 3I). Similarly, when we pulled down the same amount of CCND1 mRNA, less co-precipitated CNBP was detected as LAST was silenced. As a negative control, the RNA-binding protein HuR remained unchanged after LAST was knocked down (Figure 3J). These data suggest that LAST cooperates with CNBP to regulate CCND1 mRNA stability.
Figure 3 with 2 supplements see all
LAST stabilizes CCND1 mRNA via CNBP.
(A) HCT116 cells expressing control shRNA, LAST shRNA-1 or −2 were treated with actinomycin D (1 μg/mL) for the indicated periods of time. Total RNA was purified and then analyzed by real-time RT-PCR to examine the mRNA half-life of CCND1. Data shown are the mean ± SD (n = 3; *p<0.05, **p<0.01, ***p<0.001, two-tailed t-test). (B) HCT116 cells expressing control RNA or LAST were treated with actinomycin D (1 μg/mL) for the indicated periods of time. Total RNA was extracted and then analyzed by real-time RT-PCR to examine the mRNA half-life of CCND1. Data shown are the mean ± SD (n = 3; *p<0.05, **p<0.01, two-tailed t-test). (C) HCT116 cell lysates were incubated with in vitro synthesized biotin-labeled sense or antisense DNA probes against LAST for the biotinylated oligonucleotide pull-down assay. The precipitates from the pull-down were analyzed by real-time RT-PCR to detect the interacting mRNAs. Data shown are the mean ± SD (n = 3; **p<0.01, ***p<0.001, two-tailed t-test). (D) HCT116 cell lysates were incubated with in vitro synthesized biotin-labeled sense or antisense DNA probes against CCND1 mRNA for the biotin pull-down assay. The precipitates from the pull-down underwent real-time RT-PCR and western blot analyses to examine the levels of indicated RNAs and protein CNBP, respectively. Data shown are the mean ± SD (n = 3; *p<0.05, **p<0.01, two-tailed t-test). (E) HCT116 cell lysates were immunoprecipitated with an antibody against CNBP or normal mouse IgG2a. Precipitated samples were analyzed by western blotting to ensure successful precipitation of CNBP and by real-time RT-PCR to detect the indicated coprecipitated RNAs. Data shown are the mean ± SD (n = 3; *p<0.05, **p<0.01, two-tailed t-test). (F) HCT116 cells were infected with lentiviruses expressing control shRNA or CNBP shRNA. Ninety-six hours after infection, total RNA was subjected to real-time RT-PCR to compare the levels of CCND1 mRNA. Data shown are the mean ± SD (n = 3; *p<0.05, **p<0.01, two-tailed t-test). Cell lysates were also analyzed by western blotting with the indicated antibodies. (G) HCT116 cells expressing control shRNA or CNBP shRNA were treated with actinomycin D (1 μg/mL) for the indicated periods of time. Total RNA was then analyzed by real-time RT-PCR to examine the mRNA half-life of CCND1. Data shown are the mean ± SD (n = 3; *p<0.05, **p<0.01, two-tailed t-test). (H) HCT116 cells were infected with lentiviruses expressing control shRNA, LAST shRNA-1 or −2. Ninety-six hours after infection, total RNA was subjected to real-time RT-PCR to compare the levels of CNBP. Data shown are the mean ± SD (n = 3; **p<0.01, two-tailed t-test). Cell lysates were also analyzed by western blotting to examine actin and CNBP expression. (I) Cell lysates of HCT116 cells expressing control shRNA or CNBP shRNA were incubated separately with in vitro synthesized biotin-labeled sense or antisense DNA probes against CCND1 mRNA for the biotinylated oligonucleotide pull-down assay. The pull-down products were subjected to real-time RT-PCR analysis to examine the indicated RNA levels. Cell lysates from HCT116 treated with or without CNBP shRNA knockdown were subjected to western blotting to ensure knockdown of CNBP. Data shown are the mean ± SD (n = 3; *p<0.05, ***p<0.001, two-tailed t-test). (J) Cell lysates of HCT116 cells expressing control shRNA or LAST shRNA-1 were incubated with in vitro synthesized biotin-labeled sense or antisense DNA probes against CCND1 mRNA for the biotin pull-down assay, followed by real-time RT-PCR analysis to examine the indicated RNA levels. Pull-down products were also subjected to western blotting with the indicated antibodies and real-time RT-PCR. Data shown are the mean ± SD (n = 3; **p<0.01, two-tailed t-test).
-
Figure 3—source data 1
Source data for Figure 3A, B, C, D, E, F, G, H, I and J.
- https://doi.org/10.7554/eLife.30433.014
Both LAST and CCND1 mRNA bind to CNBP through their G-rich motifs
To describe a detailed CNBP, LAST and CCND1 mRNA binding mechanism, we mapped the LAST and CNBP binding sites on CCND1 mRNA by RNA pull-down using different in vitro biotin-labeled fragments (Figure 4A, upper panel). We found that the 5’UTR but not 3’UTR-1,–2 and −3 of CCND1 mRNA was able to bind LAST and CNBP (Figure 4A and B), indicating that LAST and CNBP bind to the 5’ region of CCND1 mRNA. To further determine whether LAST and CNBP bind to the CCND1 mRNA 5’UTR to enhance its stability, two CCND1 expression constructs were generated, as shown in Figure 4—figure supplement 1A and B. One construct contained the CCND1 coding region (CD) plus the 5’UTR and the other contained the CD alone. The expression plasmid plus LAST and CNBP or plasmid alone was individually transfected into 293T cells. Actinomycin D was added to measure the mRNA decay rate. The half-life of ectopically expressed CCND1 mRNA lacking the 5’UTR was not altered by the presence or absence of LAST and CNBP (Figure 4—figure supplement 1A). By contrast, the half-life of CCND1 mRNA bearing 5'-UTRs was extended from 4 hr in the absence of LAST and CNBP to 9 hr in the presence of LAST and CNBP, indicating that LAST and CNBP enhanced CCND1 mRNA stability via its 5’UTR (Figure 4—figure supplement 1B). In addition, we performed CNBP RIP sequencing, and an enrichment peak at the CCND1 5’UTR was observed (Figure 4—figure supplement 1C). This was consistent with the previous conclusion from Figure 4B. Thus, our hypothesis is that CNBP binds both CCND1 mRNA and LAST. We again examined whether LAST, the 5'-UTR of CCND1 mRNA and CNBP form a ternary complex by using a sequential immuno-precipitation assay (Figure 4—figure supplement 2A). By using an anti-FLAG antibody against FLAG–CNBP, both the biotin-labeled 5'-UTR of CCND1 mRNA and LAST were pulled down in an initial immunoprecipitation assay (Figure 4C, panel 1 and 3). The immunocomplexes were eluted and were subsequently precipitated by streptavidin sepharose beads against the biotin-labeled 5'-UTR of CCND1 mRNA. LAST and CNBP were present in the streptavidin-biotin precipitates (Figure 4C, panel 5 and 6), indicating that these three components indeed form a ternary complex.
Figure 4 with 3 supplements see all

CNBP binds to LAST and CCND1 mRNA via their G-rich motifs.
(A) Schematic illustration showing different parts, including the 5’UTR, CDS, 3’UTR-1, 3’UTR-2 and 3’UTR-3, in CCND1 mRNA (upper panel). HCT116 cell lysates were incubated with in vitro synthesized biotin-labeled CCND1 5’UTR as well as 3’UTR-1,–2, and −3 (upper panel), followed by RNA pull-down. Cell lysates incubated with no RNA were used as negative controls. Pull-down products were subjected to real-time RT-PCR. Data shown are the mean ± SD (n = 3; **p<0.01, two-tailed t-test) (lower panel). (B) The pull-down products from above were analyzed by western blotting with the indicated antibodies. (C) In-vitro synthetic biotin-labeled CCND1 5’UTR and unlabeled LAST plus Flag-CNBP were incubated for 3 hr at 4°C. The mixtures were first immunoprecipitated with M2 beads, followed by elution with 3 × FLAG peptides. Ten percent of the eluent was analyzed by western blotting or RT-PCR. The rest of the eluent was further immunoprecipitated with streptavidin beads. The immunoprecipitates were then washed. After elution, 10% of the eluent was analyzed by western blotting. Ninety percent of the eluent was used for real-time RT-PCR analysis. (D) A schematic illustration of two G-rich regions in the CCND1 5’UTR. Electrophoretic mobility shift assay (EMSA) was performed to detect the CNBP binding activity to its targeted G-rich region 1 and 2. (E) A schematic illustration of six G-rich regions in LAST. An electrophoretic mobility shift assay (EMSA) was performed to detect the CNBP binding activity to its targeted G-rich motif A, B, C, D, E and F. (F) HCT116 cells were infected with lentiviruses expressing either control RNA; wild-type LAST; LAST individually mutated at G-rich-A, G-rich-C, G-rich-D and G-rich-F sites; or LAST mutated at the four G-rich-A, C, D and F sites combined. Ninety-six hours after infection, total RNA was analyzed by real-time RT-PCR to detect the successful expression levels of LAST or mutant LAST. Data shown are the mean ± SD (n = 3; **p<0.01, two-tailed t-test). (G) Total RNA of HCT116 cells separately expressing exogenous control RNA; wild-type LAST; LAST with a single mutation at G-rich-A, G-rich-C, G-rich-D or G-rich-D; and LAST with four mutations combined were analyzed by real-time RT-PCR to detect the mRNA level of CCND1. Data shown are the mean ± SD (n = 3; *p<0.05, **p<0.01, ***p<0.001, two-tailed t-test).
-
Figure 4—source data 1
Source data for Figure 4A, F and G.
- https://doi.org/10.7554/eLife.30433.019
CNBP prefers to bind G-rich motifs, especially the GGAG core (Armas et al., 2008; Benhalevy et al., 2017). We checked the proportion of G-rich motifs in all of the peak sequences from the CNBP RIP samples. Nearly sixty percent of the CNBP enriched sequences contained the GGAG motif, and more than ninety percent of the peak sequences contained a GGR motif (Figure 4—figure supplement 2B). To assess the possible CNBP binding sites on LAST and CCND1 mRNA, the bioinformatics software tool QGRS Mapper was utilized (Kikin et al., 2006). Two G-rich sequences containing a GGAG core in the 5’UTR of CCND1 mRNA were identified (Figure 4D, upper part). An electrophoretic mobility shift assay (EMSA) was performed, and the results showed that G-rich-1 and G-rich-2 in the CCND1 5’UTR were responsible for the binding of CNBP (Figure 4D, lower part). Among the six predicted G-rich sequences (G-rich-A to F) found in LAST (Figure 4E, upper part), four G-rich sequences (G-rich-A, C, D and F) were found to contain a GGAG core. G-rich-A, C, D and F from LAST were able to bind CNBP, whereas neither G-rich-B nor G-rich-E was able to bind CNBP (Figure 4E, lower part). Thus, CNBP only interacted with G-rich sequences that contained the GGAG core, but not those lacking the GGAG core. These data suggest that both CCND1 and LAST interact with CNBP via their G-rich motifs containing the GGAG core. Four G-rich regions (A, C, D and F) were mutated from GGAG to UUUU with either a single mutation or four combined mutations in LAST. We found that over-expression of LAST containing only one site mutation led to an increase in the CCND1 mRNA level, whereas over-expression of LAST containing four G-rich site mutations nullified its effect on the CCND1 mRNA level (Figure 4F and G). This result indicates that the effect of LAST on CCND1 stability requires at least one of the four functional G-rich motifs. To define which domain of CNBP is responsible for binding LAST and the CCND1 5’UTR, a biotin-labeled RNA pull-down assay and deletion mapping were performed. According to the web site InterPro (Hunter et al., 2009), CNBP can be divided into four structural domains based on its zinc-finger arrangement (Figure 4—figure supplement 2C). As shown in Figure 4—figure supplement 2C, we concluded that LAST binds to the CNBP fragment corresponding to amino acids 92–134 (domain 3), whereas the CCND1 5’UTR binds to the CNBP fragment corresponding to amino acids 29–134 (domain 2 + domain 3) (Figure 4—figure supplement 2C). Determination of the exact mechanism of these associations requires further investigation.
In addition to CCND1, LAST regulates the stability of other mRNAs
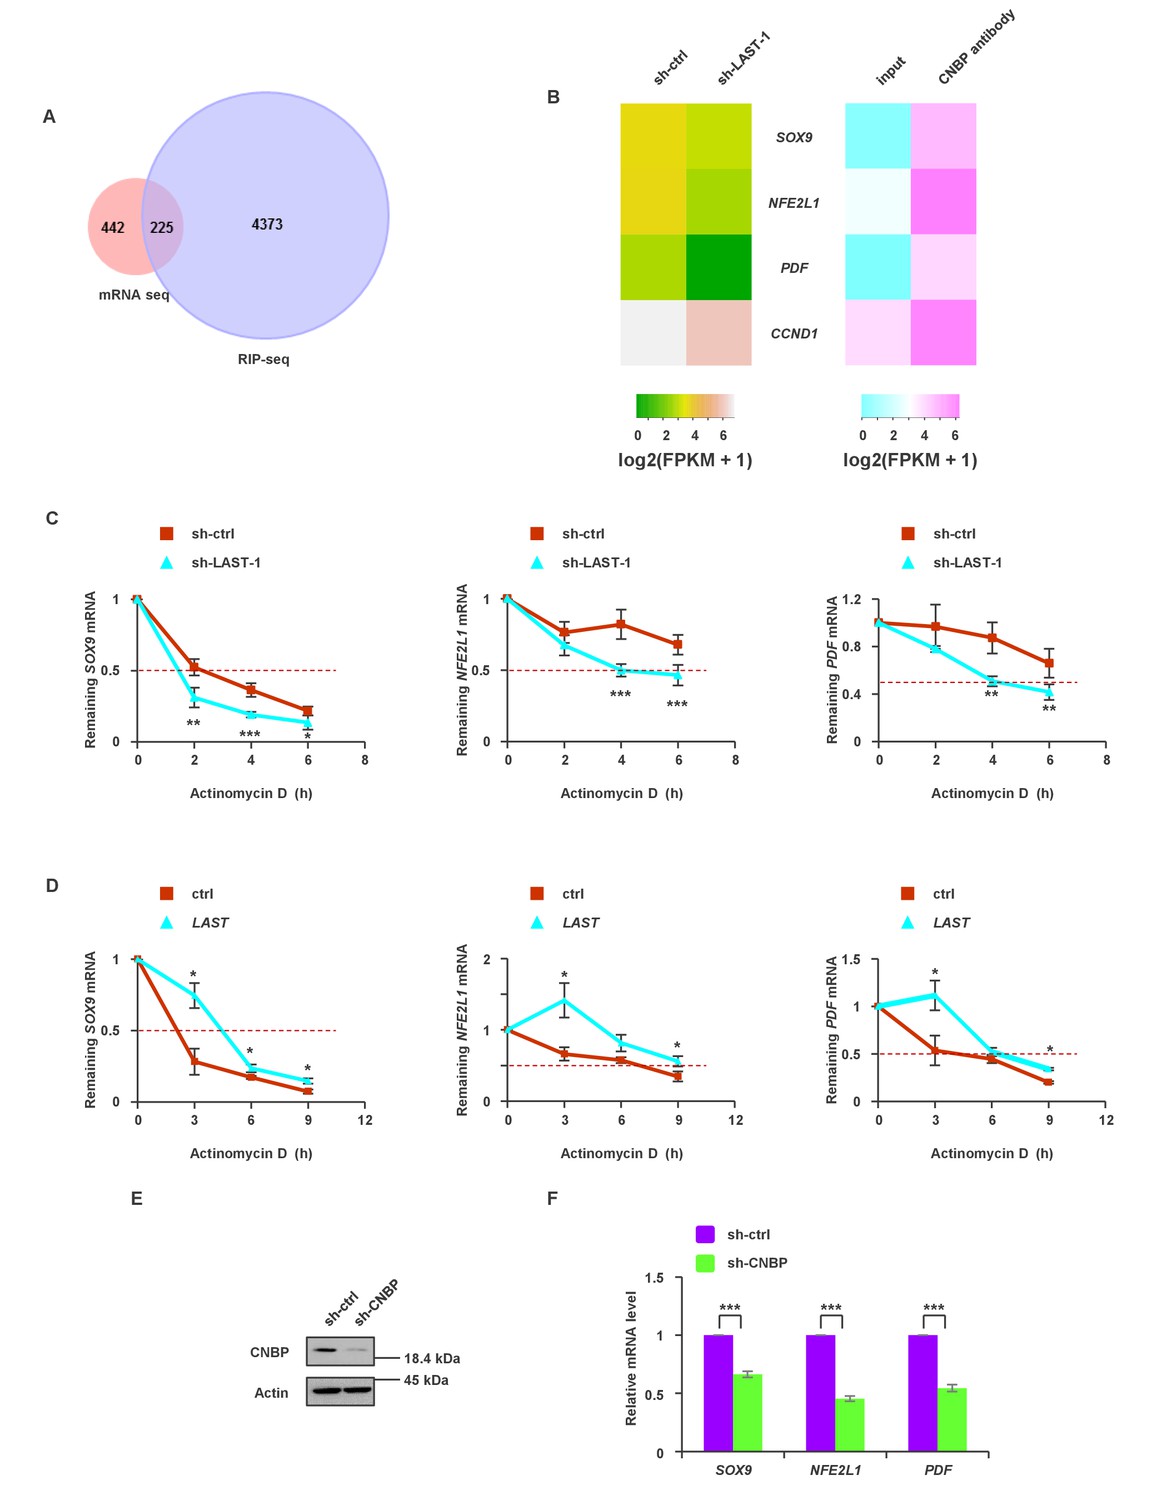
To globally identify transcripts that simultaneously meet the following requirements: (i) transcripts are downregulated by LAST knockdown and (ii) transcripts are able to bind to CNBP, we assembled two unbiased transcriptome profiles using LAST knockdown mRNA-seq and CNBP RIP-seq in HCT116 cells. The intersection of these two arrays is shown in Figure 5A, and 225 overlapping genes were found (Supplementary file 2). We further narrowed this list down to 75 genes (Supplementary file 2, bold part) based on the criteria that CNBP-enriched genes must be 4-fold above the input control level. Three mRNAs, namely, SOX9, NFE2L1 and PDF, were also likely to be regulated by LAST, as knockdown of LAST led to a decrease in their levels (Figure 5B). Experimental verification showed that knockdown of LAST decreased (Figure 5C) whereas over-expression of LAST increased their half-lives (Figure 5D). In addition, CNBP deletion led to a decrease in the mRNA levels of SOX9, NFE2L1 and PDF (Figure 5E and F). These data suggest that LAST, together with CNBP, can regulate the stabilization of additional mRNAs, such as SOX9, NFE2L1 and PDF.
Figure 5 with 1 supplement see all
The synergistic effect of LAST and CNBP on mRNA expression.
(A) Venn diagram represents 225 overlapping transcripts (Supplementary file 2) obtained from LAST RNA-seq (red) and CNBP RIP-seq (violet). (B) Heatmap showing that SOX9, NFE2L1, PDF and CCND1 are not only decreased upon LAST knockdown but also enriched by CNBP. (C) HCT116 cells expressing control shRNA or LAST shRNA-1 were treated with actinomycin D (1 μg/mL) for the indicated periods of time. Total RNAs were extracted and then analyzed by real-time RT-PCR to examine the mRNA half-life of SOX9, NFE2L1 and PDF. Data shown are the mean ± SD (n = 6; *p<0.05, **p<0.01, ***p<0.001, two-tailed t-test). (D) HCT116 cells expressing control RNA or LAST were treated with actinomycin D (1 μg/mL) for the indicated periods of time. Total RNAs were extracted and then analyzed by real-time RT-PCR to examine the mRNA half-life of SOX9, NFE2L1 and PDF. (E) HCT116 cells were infected with lentiviruses expressing control shRNA or CNBP shRNA. Ninety-six hours later, cell lysates were subjected to western blotting to detect the CNBP knockdown efficiency. (F) HCT116 cells were infected with lentiviruses expressing control shRNA or CNBP shRNA. Ninety-six hours after injection, total RNA was analyzed by real-time RT-PCR with the indicated primers. Data shown are the mean ± SD (n = 3; ***p<0.001, two-tailed t-test).
-
Figure 5—source data 1
Source data for Figure 5C, D and F.
- https://doi.org/10.7554/eLife.30433.022
LAST promotes tumorigenesis
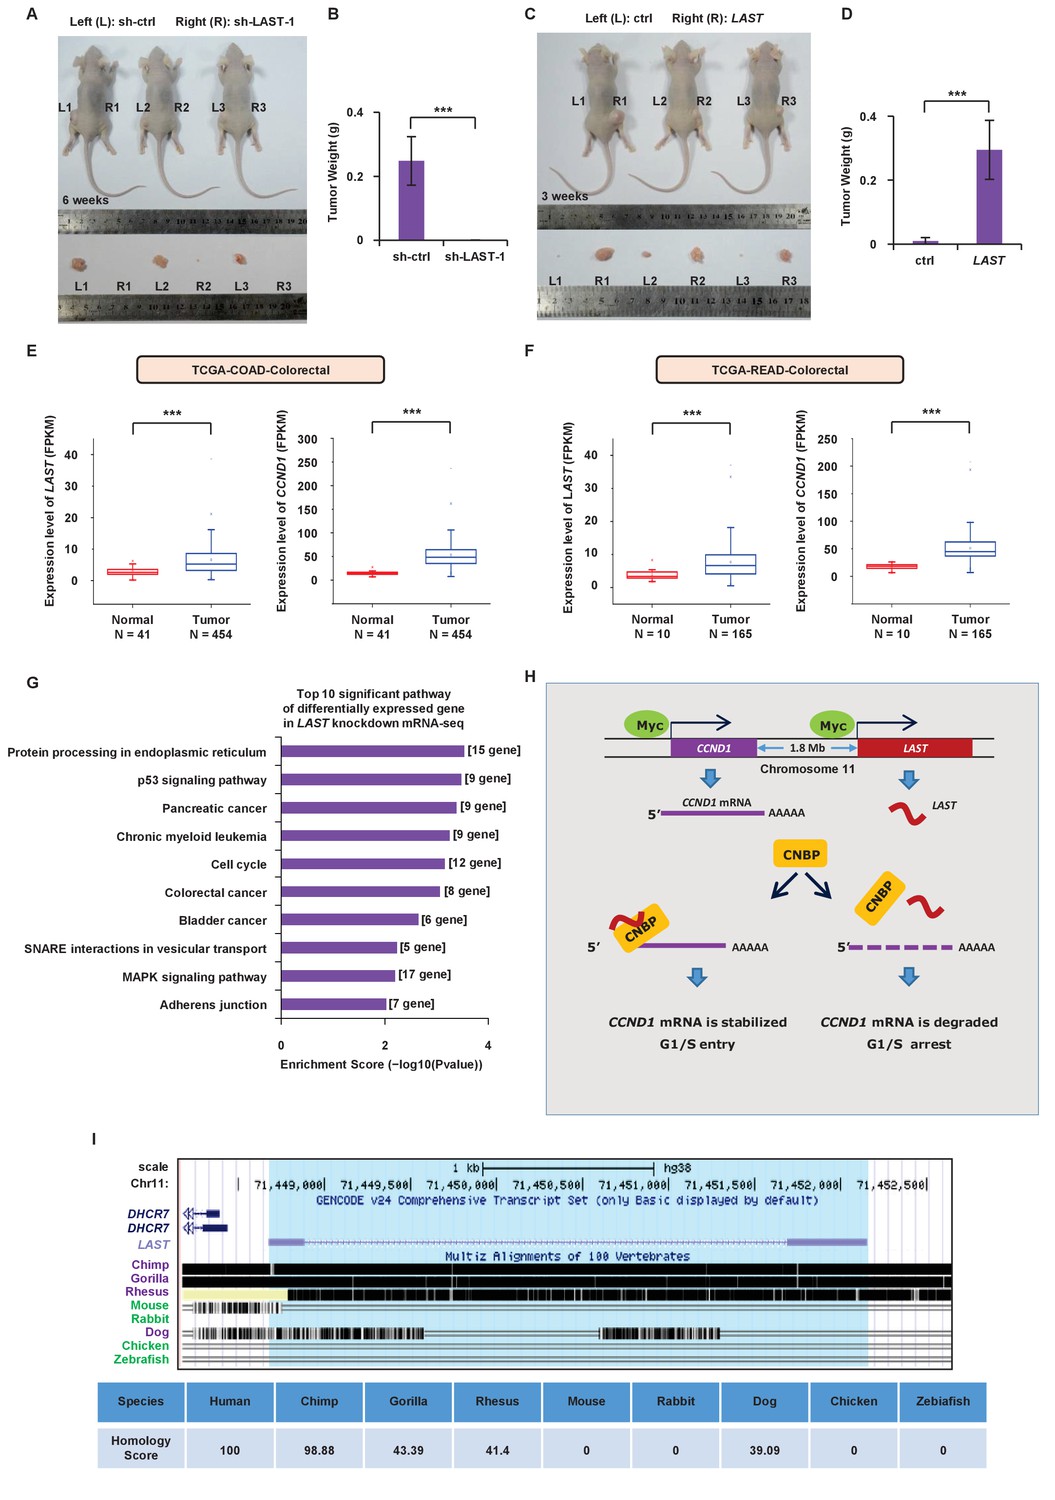
To further determine whether LAST regulates tumorigenesis, we used a xenograft mouse model. HCT116 cells stably expressing exogenous LAST or LAST shRNA-1 were injected subcutaneously into the dorsal flanks of nude mice (left (control) and right (treated), n = 7 for each group). According to animal care and enforcement, mice were sacrificed when the largest subcutaneous tumor mass on one flank was close to one cubic centimeter. Tumors expressing control shRNA or LAST shRNA-1 were excised after 6 weeks, and tumors expressing control RNA or LAST were excised after 3 weeks. Mice were sacrificed and tumors were excised. Knockdown of LAST decreased the tumorigenicity of HCT116 cells (Figure 6A and B). By contrast, induction of LAST promoted HCT116 cell tumorigenicity (Figure 6C and D). Furthermore, based on the TCGA dataset (Weinstein et al., 2013), we found that the LAST expression levels were higher in tumor tissues than normal tissues, including the human bladder, breast, colorectal, esophagus, head and neck, kidney, liver, lung, prostate and stomach. In addition, the CCND1 expression levels were higher in tumor tissues than in normal tissues, including the human bladder, breast, cervix, bile duct, colorectal, esophagus, head and neck, kidney, pancreas, stomach and uterus. In conclusion, both the LAST and CCND1 expression levels were higher in most tumor tissues than in their normal counterparts (Figure 6E and F, Figure 6—figure supplements 1 and 2). The above results suggest that LAST promotes tumorigenesis.
Figure 6 with 2 supplements see all
LAST promotes tumorigenesis.
(A) A total of 3 × 10⁶ HCT116 cells expressing either control shRNA or LAST shRNA-1 were individually injected subcutaneously into the flanks of nude mice (n = 7 for each group) as indicated. Representative photographs of xenograft tumors in situ were taken 6 weeks after injection. (B) Tumors of the above nude mice (Figure 6A) were also selected to be weighed. Data shown are the mean ± SD (n = 7; ***p<0.001, two-tailed t-test). (C) A total of 3 × 10⁶ HCT116 cells expressing either control RNA or LAST were individually injected subcutaneously into the flanks of nude mice (n = 7 for each group) as indicated. Representative photographs of xenograft tumors in situ were taken 3 weeks after injection. (D) Tumors of the above nude mice (Figure 6C) were selected and weighed. Data shown are the mean ± SD (n = 7; ***p<0.001, two-tailed t-test). (E) Data for the LAST and CCND1 expression levels in COAD (colon adenocarcinoma) tumor and normal tissues were downloaded from the TCGA dataset. Box plots showing differential expression of LAST and CCND1 between normal (n = 41) and tumor (n = 454) samples. Statistical analysis was performed using the two-tailed t-test (***p<0.001). (F) Data for LAST and CCND1 expression levels in READ (rectum adenocarcinoma) tumor and normal tissues were downloaded from the TCGA dataset. Box plots showing the differential expression of LAST and CCND1 between normal (n = 10) and tumor (n = 165) samples. Statistical analysis was performed using the two-tailed t-test (***p<0.001). (G) Pathway analysis of differentially downregulated genes (log2 (fold change) below - 0.58 in RNA-seq) in HCT116 with and without LAST knockdown. The top 10 significant pathways with enrichment scores are shown. (H) A schematic illustration of the proposed model depicting the role of c-Myc-induced LAST in regulating CCND1 mRNA stability via CNBP. (I) Gene homology analysis of LAST in human, chimp, gorilla, rhesus, mouse, rabbit, dog, chicken and zebrafish.
-
Figure 6—source data 1
Source data for Figure 6B, D, E and F.
- https://doi.org/10.7554/eLife.30433.026
To assess the impact of LAST deficiency on gene expression in HTC116, we performed unbiased transcriptome profiling using RNA-seq in HCT116 cells. The absence of LAST downregulated expression of 667 genes (log2 (fold change) below - 0.58) (Supplementary file 3). We then performed pathway analysis in those genes and found the top 10 significant pathways that were significantly associated with 667 differentially expressed genes. Among these 10 pathways, the majority were associated with tumorigenesis (Figure 6G).
Discussion
Cyclin D1 is a critical regulator of CDK kinase, which regulates cell cycle progression at the G1 to S-phase transition. Pre- or mature CCND1 mRNA is regulated at different hierarchical levels bymultiple protein factors. Multiple classical transcriptional factors, such as c-Myc, E2F1, OCT1,RELA and c-Jun, have been reported to modulate CCND1 at the transcriptional level (Guo et al., 2011). Epigenetic and post-transcriptional mechanisms are also involved in the regulation of cyclin D1/CCND1 (16, 29, 30). Moreover, Pitx2 and HuR, which belong to the same ribonucleoprotein complex, also control the decay rate of CCND1 mRNA (Gherzi et al., 2010). However, whether lncRNA(s) is (are) involved in the regulation of CCND1 mRNA stability remains largely unaddressed. Very recently, NcRNACCND1 was reported to negatively regulate CCND1 transcription by recruiting TLS to the CCND1 promoter (Wang et al., 2008). In this study, we characterized an overlooked mechanism of CCND1 mRNA regulation. c-Myc induced-LAST cooperates with CNBP, by which LAST is guided to the 5’ untranslated region of CCND1 messenger RNA and thus stabilizes CCND1 mRNA (Figure 6H). The detailed mechanism underlying this 5’end protection requires further characterization.
Normal growth control depends on the architecture of precise cell cycle control, and disturbing any component of this network could result in neoplastic growth and tumorigenesis. The G1/S transition is a major checkpoint in cell cycle progression, as it is a ‘point of no return’ beyond which cells are committed to dividing. Cyclin D1, along with its catalytically active partner CDK4, is a positive cell cycle regulator that advances the cell cycle from G1 to S phase (McKay et al., 2002). Instead of protein factors, in this study, we found a novel long noncoding RNA, LAST, that ensures normal cell cycle progression. Lacking this lncRNA causes cell cycle arrest at the G1/S stage due to decreased cyclin D1 and attenuates tumor growth. Both the LAST and CCND1 expression levels are higher in most tumor tissues than in their corresponding normal tissues (Figure 6—figure supplement 1A). Conceivably, LAST could be a potential target for new cancer therapeutics. However, a correlation between the expression levels of CCND1 and LAST in the 15 tumor types examined was not found (Supplementary file 4). In addition, there was no difference in survival when tumors were divided into those expressing high versus low CCND1 or LAST. These results imply that the regulation of CCND1 is more complicated than we had anticipated, and new functions of LAST need to be characterized.
CNBP encodes a nucleic-acid binding protein that has seven zinc-finger domains and a preference for binding single-stranded DNA and RNA (Flink and Morkin, 1995). Previous studies have shown that CNBP acts on cap-independent translation of ornithine decarboxylase mRNA (Sammons et al., 2010) and also functions in sterol-mediated transcriptional regulation as well as c-Myc transcription (Rajavashisth et al., 1989; Murphy et al., 2009). In this study, we found that CNBP possesses a new function. CNBP is able to guide lncRNA to bind to the 5’UTR of CCND1 mRNA, acting as a mediator between LAST and CCND1 mRNA.
lncRNAs are able to regulate their genomic neighborhoods in cis (Quinn and Chang, 2016). Examples of cis-acting lncRNAs include enhancer RNAs (eRNAs) (De Santa et al., 2010), imprinted lncRNAs (Mancini-Dinardo et al., 2006; Sleutels et al., 2002) and dosage compensation lncRNAs (Lee, 2012; Conrad and Akhtar, 2012). Homo sapiens cyclin D1/CCND1 and LAST are both located on chromosome 11, and the two genes are 1.8 Mb apart and in the same transcriptional direction (+strand). It is interesting to note that although CCND1 and LAST are both subjected to positive transcriptional regulation by c-Myc, they do not share the same promoter. Rather, CCND1 and LAST are transcribed separately by c-Myc via their respective promoters (Figures 1K and 6H). The relatively long distance between the CCND1 and LAST genes may preclude their direct interaction. Moreover, LAST was shown to borrow a trans-acting factor, CNBP, as a mediator to connect the 5’UTR of CCND1 mRNA and itself, thus affecting CCND1/cyclin D1 expression in trans. Without CNBP, LAST shows no effect on CCND1 (Figure 3—figure supplement 1F), further supporting the concept that LAST does not regulate CCND1 in cis. Therefore, co-location of CCND1 and LAST on the same chromosome appears to be a random event.
In summary, our findings from this investigation have uncovered a novel, c-Myc-induced, long non-coding RNA, LAST. The LAST gene is encoded physically on the same chromosome as CCND1. Normally, LAST interacts with CNBP, a RNA binding protein, by which it is guided towards the 5’UTR of CCND1 mRNA, leading to the stabilization of CCND1 mRNA, which in turn ensures orderly cell cycle progression. In the case of LAST dysregulation, CCND1 mRNA becomes unstable, resulting in decreased cyclin D1, inevitably causing cell cycle arrest and stoppage of cell division (Figure 6H). This is a novel mechanism for CCND1 mRNA regulation. Based on the importance of cyclin D1 in proliferative control and its ability to promote oncogenic transformation, this finding provides new insight into the complexity of the regulatory network underlying the mechanistic regulation of cyclin D1/CCND1. Moreover, this LAST/CNBP regulatory mode can be applied to other genes; three different mRNAs, SOX9, NFE2L1 and PDF, were identified with half-lives that were prolonged by LAST/CNBP. The lack of similarity between human LAST and transcripts of Mus musculus also precludes using mouse c-Myc-driven tumor models to further clarify the significance of the LAST in c-Myc-mediated cell cycle regulation and tumor growth in vivo (Figure 6I).
Materials and methods
Antibodies and reagents
Request a detailed protocolThe following antibodies were used for western blot analysis in this study: anti-c-Myc (Cell Signaling Technology); anti-GAPDH and anti-β-Actin (CMC-TAG); normal rabbit IgG, normal mouse IgG2a, anti-HUR, anti-cyclin D1, anti-CNBP and anti-NADSYN1 (Santa Cruz); anti-FLAG (Sigma-Aldrich); anti-cyclin E1, anti-CDK2, and anti-CDK4 (ImmunoWay Biotechnology Company); anti-HNRNPK (ABclonal); anti-DHCR7 (ABCAM). Anti-c-Myc used for ChIP assay was from Santa Cruz. Thymidine, Nocodazole, Mimosine, EGF, hydrocortisone, Cholera Toxin, insulin and Doxycycline was from Sigma-Aldrich. Actinomycin D was from Solarbio. Strepavidin beads for RNA pull-down assay was from Invitrogen.
Cell culture
Request a detailed protocolH1299, HCT116, IMR90, 293T and HAFF cell lines were cultured in DMEM (Dulbecco's modified Eagle's medium) medium containing 10% fetal bovine serum. P493-6 and MCF7 cell lines were cultured in RPMI medium 1640 containing 10% fetal bovine serum. MCF10A cell line were cultured in DMEM/F12 medium containing 5% horse serum, 20 μg/mL EGF, 0.5 μg/mL hydrocortisone, 100 ng/mL Cholera Toxin and 10 μg/mL insulin. P493-6 cells carrying a c-Myc tet-off system were provided by professor Ping Gao. All other cell lines were purchased from the American Type Culture Collection (ATCC, Manassas, VA, USA). All cells were tested by STR profiling (GenePrint 10 System kit from Promega and AuthentiFiler PCR Amplification Kit from ThermoFisher) to authenticate the identity. All cells were tested for mycoplasma contamination by Cell Culture Contamination Detection Kit (ThermoFisher).
Western blotting, northern blotting and real-time RT-PCR
Request a detailed protocolWestern blotting, Northern blotting and real-time RT-PCR were performed as described previously (Zhang et al., 2016).
Colony-formation assay
Request a detailed protocolHCT116 cells (1 × 10³) expressing control shRNA, lncRNA-52 shRNA-1,–2, lncRNA-51 shRNA-1 or −2 were cultured in a six-well plate. Ten days later, cells were fixed, stained with crystal violet and photographed.
Quantitationfor the expression levels of LAST
Request a detailed protocolThe exact copy numbers of LAST transcripts per HAFF, IMR90, MCF10A, HCT116, MCF7 or H1299 cell were quantified by using quantitative real-time RT-PCR assay. In this assay, serially diluted RT-PCR products of LAST were used as templates to formulate standard curves, and the exact copies of LAST per cell were calculated accordingly.
ChIP assay
Request a detailed protocolHCT116 cells were crosslinked with 1% formaldehyde for 10 min. The ChIP assay was performed by using anti-c-Myc antibody and the Pierce Agarose ChIP kit (ThermoScientific, USA) according to the manufacturer's instructions. Anti-Rabbit immunoglobulin G was used as a negative control. The bound DNA fragments were subjected to real-time PCR using the specific primers (Table 1).
Table 1
Oligomers used in this study
https://doi.org/10.7554/eLife.30433.027| Name | Application | Sequence |
|---|---|---|
| qrt-lncRNA-5639-F | qRT-PCR | GACCTTGGGCTAGTTATTTTGTG |
| qrt-lncRNA-5639-R | qRT-PCR | TCCTCTCTCCTTTCCTGTCTG |
| qrt-lncRNA-51-F | qRT-PCR | ACCACAGATCCAGTAGCCTAG |
| qrt-lncRNA-51-R | qRT-PCR | CCTAACCACACTCCAAGACAC |
| qrt-lncRNA-5630-F | qRT-PCR | CTCCAACATCACCAAAACCAC |
| qrt-lncRNA-5630-R | qRT-PCR | TCTTGGCATGTGGTATCTGTC |
| qrt-lncRNA-5690-F | qRT-PCR | TCGACATGAAACTTGGGTGG |
| qrt-lncRNA-5690-R | qRT-PCR | GGCCAAATTCACTTGATGCTC |
| qrt-LAST-F | qRT-PCR | GGATCCTCCATAAACGATCAG |
| qrt-LAST-R | qRT-PCR | AGCTGGTCGGTGGTCTCTTA |
| qrt-CNBP-F | qRT-PCR | CCTCGGATAGAGGTTTCCAG |
| qrt-CNBP -R | qRT-PCR | ACCGCAGTTATAGCAGGCTT |
| qrt-CDK4-F | qRT-PCR | CTGGTGTTTGAGCATGTAGACC |
| qrt-CDK4-R | qRT-PCR | AAACTGGCGCATCAGATCCTT |
| qrt-CDK2-F | RT-PCR | GCTAGCAGACTTTGGACTAGCCAG |
| qrt-CDK2-R | qRT-PCR | AGCTCGGTACCACAGGGTCA |
| qrt-CCNB1-F | qRT-PCR | AAGAGCTTTAAACTTTGGTCTGGG |
| qrt-CCNB1-R | qRT-PCR | CTTTGTAAGTCCTTGATTTACCATG |
| qrt-CCNE1-F | qRT-PCR | ATCAGCACTTTCTTGAGCAACA |
| qrt-CCNE1-R | qRT-PCR | TTGTGCCAAGTAAAAGGTCTCC |
| qrt-CCND1-CDS-F | qRT-PCR | ACGAAGGTCTGCGCGTGTT |
| qrt-CCND1-CDS-R | qRT-PCR | CCGCTGGCCATGAACTACCT |
| qrt-CCND1-5’UTR-F | qRT-PCR | CTGGAGCCTCCAGAGGGCTGT |
| qrt-CCND1-5’UTR-R | qRT-PCR | GCGCTCCCTCGCGCTCTTC |
| qrt-CCND1-3’UTR-1-F | qRT-PCR | GGAAAGCTTCATTCTCCTTGTTG |
| qrt-CCND1-3’UTR-1-R | qRT-PCR | TTCTTTTGCTTAAGTCAGAGATGGAA |
| qrt-CCND1-3’UTR-2-F | RT-PCR | CATTGATTCAGCCTGTTTGG |
| qrt-CCND1-3’UTR-2-R | qRT-PCR | GAATTCATCGGAACCGAACT |
| qrt-CCND1-3’UTR-3-F | RT-PCR | TCTCAATGAAGCCAGCTCACA |
| qrt-CCND1-3’UTR-3-R | RT-PCR | TTTTGGTTCGGCAGCTTG |
| qrt-CCND1-intron-1-F | qRT-PCR | CTTTGTTCAAGCAGCGAGTC |
| qrt-CCND1-intron-1-R | qRT-PCR | AAGGTCCTCCAAGCCGATA |
| qrt-CCND1-intron-2-F | qRT-PCR | CCCAGCTCCCTTGAGTCC |
| qrt-CCND1-intron-2-R | qRT-PCR | CGGTCCTGGATGTTGGAG |
| qrt-CCND1-intron-3-F | qRT-PCR | TTTGTCATCGGCCAGAAATA |
| qrt-CCND1-intron-3-R | qRT-PCR | GACCTTCAGAGCACAGACCA |
| qrt-CCND1-intron-4-F | qRT-PCR | ATGTGCGTGGCCAATAAATA |
| qrt-CCND1-intron-4-R | qRT-PCR | ATCCCAGGGTTTAACAGCAG |
| qrt-c-Myc-F | qRT-PCR | AGCGACTCTGAGGAGGAAC |
| qrt-c-Myc-R | qRT-PCR | TGTGAGGAGGTTTGCTGTG |
| qrt-PDF-F | qRT-PCR | GCTGCGGCGCTCCTATT |
| qrt-PDF-R | qRT-PCR | TTGGCACACGTGCGAGAAC |
| qrt-NFE2L1-F | qRT-PCR | TGGCTATGGTATCCACCCCA |
| qrt-NFE2L1-R | qRT-PCR | ACCAGCCAGGCATTTACCTC |
| qrt-SOX9-F | qRT-PCR | GCGAGCCCGATCTGAAGAAG |
| qrt-SOX9-R | qRT-PCR | GTTCTTGCTGGAGCCGTTGA |
| qrt-DHCR7-F | qRT-PCR | ATCTGCCATGACCACTTCGG |
| qrt-DHCR7-R | qRT-PCR | CAGACCCTGCAGCGTGTAAA |
| qrt-NADSYN1-F | qRT-PCR | GCCGTGAGGAGTGGAAATGA |
| qrt-NADSYN1-R | qRT-PCR | GTGGTCAGTATGCGTCCACA |
| qrt-TOMM6-F | qRT-PCR | TGCTGGCTCGGCTAATGAAA |
| qrt-TOMM6-R | qRT-PCR | TCCTATCAGTGGCAAAGCGG |
| qrt-CEBPG-F | qRT-PCR | GAGCATGCACACAACCTTGC |
| qrt-CEBPG-R | qRT-PCR | CATTGTCGCCATCTGCTGTC |
| qrt-PRNP-F | qRT-PCR | GGAGAACTTCACCGAGACCG |
| qrt-PRNP-R | qRT-PCR | AGGACCATGCTCGATCCTCT |
| qrt-CHMP1B-F | qRT-PCR | GTTCAACCTGAAGTTCGCGG |
| qrt-CHMP1B-R | qRT-PCR | GGCATTTTCGGCGTGTATCC |
| qrt-MSX1-F | qRT-PCR | CCACTCGGTGTCAAAGTGGA |
| qrt-MSX1-R | qRT-PCR | GAAGGGGACACTTTGGGCTT |
| qrt-THAP11-F | qRT-PCR | AACCTGGTATCTGCTTCCGC |
| qrt-THAP11-R | qRT-PCR | TGAGATCGATGGGCTTCACG |
| qrt-C16orf91-F | qRT-PCR | ATGGGAAAGGGACATCAGCG |
| qrt-C16orf91-R | qRT-PCR | CTCCCCACACCTGTCTCAAC |
| qrt-VMA21-F | qRT-PCR | CATCTGCACAGCACCTTACAGTTTGC |
| qrt-VMA21-R | qRT-PCR | GAAATGCAGCACATCCAAATCCTCCC |
| qrt-PLEC-F | qRT-PCR | CCGGGCAGTCTCTGAAGATG |
| qrt-PLEC-R | qRT-PCR | GCGTTTTCCCAAGGTTCCAG |
| qrt-DLG5-F | qRT-PCR | GATGACCCGGGAGAGAAACG |
| qrt-DLG5-R | qRT-PCR | GGATTCAGCCTGTGGTAGGG |
| qrt-EPPK1-F | qRT-PCR | GTGTGTGATGAGTGGCCACACC |
| qrt-EPPK1-R | qRT-PCR | CTCTGGGTACACTGGCCTGCTCT |
| qrt-HIST2H4A-F | qRT-PCR | GGCGGAAAAGGCTTAGGCAA |
| qrt-HIST2H4A-R | qRT-PCR | CCAGAGATCCGCTTAACGCC |
| qrt-MYH9-F | qRT-PCR | ATCTCGTGCTATCCGCCAAG |
| qrt-MYH9-R | qRT-PCR | GTTGTACGGCTCCAACAGGA |
| qrt-PPL-F | qRT-PCR | AGGCAAATACAGCCCCACTG |
| qrt-PPL-R | qRT-PCR | AGGTCACTCTGCATCTTGGC |
| qrt-PRKDC-F | qRT-PCR | GGACCTATAGCGTTGTGCCC |
| qrt-PRKDC-R | qRT-PCR | GATCACTCAGGTAAGCCGCC |
| qrt-GDF15-F | qRT-PCR | TCCAGATTCCGAGAGTTGCG |
| qrt-GDF15-R | qRT-PCR | CGAGGTCGGTGTTCGAATCT |
| qrt-Actin-F | qRT-PCR | GACCTGACTGACTACCTCATGAAGAT |
| qrt-Actin-R | qRT-PCR | GTCACACTTCATGATGGAGTTGAAGG |
| qrt-U6-F | qRT-PCR | GCTTCGGCAGCACATATACTAAAAT |
| qrt-U6-R | qRT-PCR | CGCTTCACGAATTTGCGTGTCAT |
| qrt-U1-F | qRT-PCR | GGCGAGGCTTATCCATTG |
| qrt-U1-R | qRT-PCR | CCCACTACCACAAATTATGC |
| sh-LAST-F-1 | plasmid construction | ccggAAGAGGATCCTCCATAAACGActcgagTCGTTTATGGAGGATCCTCTTtttttg |
| sh-LAST-R-1 | plasmid construction | aattcaaaaaAAGAGGATCCTCCATAAACGActcgagTCGTTTATGGAGGATCCTCTT |
| sh-LAST-F-2 | plasmid construction | ccggTCAGCCATAGCAGCTGTGATTctcgagAATCACAGCTGCTATGGCTGAtttttg |
| sh-LAST-R-2 | plasmid construction | aattcaaaaaTCAGCCATAGCAGCTGTGATTctcgagAATCACAGCTGCTATGGCTGA |
| sh-lncRNA-51-F-1 | plasmid construction | ccggAAGCAGATGGAGGGAAGTTggatcc AACTTCCCTCCATCTGCTTtttttg |
| sh-lncRNA-51-R-1 | plasmid construction | aattcaaaaaAAGCAGATGGAGGGAAGTTggatccAACTTCCCTCCATCTGCTT |
| sh-lncRNA-51-F-2 | plasmid construction | ccggGGAAGCAGAGTAAGCAAGTGAGGATCCTCACTTGCTTACTCTGCTTCCtttttg |
| sh-lncRNA-51-R-2 | plasmid construction | aattcaaaaaGGAAGCAGAGTAAGCAAGTGAGGATCCTCACTTGCTTACTCTGCTTCC |
| LAST-DNA-1-sense | lncRNA pull down | (biotin-)TAAACGATCAGCCATAGCA |
| LAST-DNA-1-antisense | lncRNA pull down | (biotin-)TGCTATGGCTGATCGTTTA |
| LAST-DNA-2-sense | lncRNA pull down | (biotin-)TCATCGTGCCTCAGTTTCC |
| LAST-DNA-2-antisense | lncRNA pull down | (biotin-)GGAAACTGAGGCACGATGA |
| LAST-DNA-3-sense | lncRNA pull down | (biotin-)ACAGACACAGTTCTTGGTC |
| LAST-DNA-3-antisense | lncRNA pull down | (biotin-)GACCAAGAACTGTGTCTGT |
| LAST-DNA-4-sense | lncRNA pull down | (biotin-)ATGGGTCATATATTACATG |
| LAST-DNA-4-antisense | lncRNA pull down | (biotin-)CATGTAATATATGACCCAT |
| LAST-DNA-5-sense | lncRNA pull down | (biotin-)GTTGAATATGTATGTTTAG |
| LAST-DNA-5-antisense | lncRNA pull down | (biotin-)CTAAACATACATATTCAAC |
| LAST-DNA-6-sense | lncRNA pull down | (biotin-)CCAGCCTCAGACAGATGGC |
| LAST-DNA-6-antisense | lncRNA pull down | (biotin-)GCCATCTGTCTGAGGCTGG |
| CCND1-DNA-1-sense | mRNA pull down | (biotin-)GCGCAGTAGCAGCGAGCAGCA |
| CCND1-DNA-1-antisense | mRNA pull down | (biotin-)TGCTGCTCGCTGCTACTGCGC |
| CCND1-DNA-2-sense | mRNA pull down | (biotin-)CCGCTGGCCATGAACTACCTG |
| CCND1-DNA-2-antisense | mRNA pull down | (biotin-)CAGGTAGTTCATGGCCAGCGG |
| CCND1-DNA-3-sense | mRNA pull down | (biotin-)AACACGCGCAGACCTTCGTTG |
| CCND1-DNA-3-antisense | mRNA pull down | (biotin-)CAACGAAGGTCTGCGCGTGTT |
| CCND1-DNA-4-sense | mRNA pull down | (biotin-)CGTAGGTAGATGTGTAACCTCT |
| CCND1-DNA-4-antisense | mRNA pull down | (biotin-)AGAGGTTACACATCTACCTACG |
| CCND1-DNA-5-sense | mRNA pull down | (biotin-)AGAGTCATCTGATTGGACAGGC |
| CCND1-DNA-5-antisense | mRNA pull down | (biotin-GCCTGTCCAATCAGATGACTCT |
| CCND1-DNA-6-sense | mRNA pull down | (biotin-)AATGAAGCCAGCTCACAGTGCT |
| CCND1-DNA-6-antisense | mRNA pull down | (biotin-)AGCACTGTGAGCTGGCTTCATT |
| ChIP-LAST-a-F | qRT-PCR for ChIP | TTCCTGACAGCAGATTCCAG |
| ChIP-LAST-a-R | qRT-PCR for ChIP | TCTGCCATGTTTGGAGAATG |
| ChIP-LAST-b-F | qRT-PCR for ChIP | ACCTGCTCACCTGGGCAAGC |
| ChIP-LAST-b-R | qRT-PCR for ChIP | GGCAATCGCTGACATCATCCGGG |
| ChIP-LAST-c-F | qRT-PCR for ChIP | GGGATCCCAGCTGACCAGCTG |
| ChIP-LAST-c-R | qRT-PCR for ChIP | GAGGCACGATGATCCAGGTGATGAG |
| ChIP-LAST-d-F | qRT-PCR for ChIP | CTGAGCCACAGTGCGAGCCG |
| ChIP-LAST-d-R | qRT-PCR for ChIP | GACAGTAAGGCCTGTTACCCGAGC |
| ChIP-LAST-e-F | qRT-PCR for ChIP | AAGTCAAACAGCACGAACCC |
| ChIP-LAST-e-R | qRT-PCR for ChIP | CGGATGGGCATTGACGTTAT |
| ChIP-LAST-f-F | qRT-PCR for ChIP | TCAAGTGCAGTTCCTGTAGTTTC |
| ChIP-LAST-f-R | qRT-PCR for ChIP | GATGGCGCTGAATTCTTGGGAACC |
| ChIP-LAST-g-F | qRT-PCR for ChIP | TCCCTTCTTGTCCCTTCAAA |
| ChIP-LAST-g-R | qRT-PCR for ChIP | CCTAAAGACCAACGGGAAAC |
| ChIP-LAST-h-F | qRT-PCR for ChIP | TCTAGGGTTCTGGGCTGTCT |
| ChIP-LAST-h-R | qRT-PCR for ChIP | GTCAGGCTCACGAGACGAT |
Luciferase reporter assay
Request a detailed protocolTo determine the effect of c-Myc on LAST promoter, either p3xflag-Myc-CMV-24 or p3xflag-Myc-CMV-24-c-Myc was co-transfected into HCT116 cells together with individual pGL3, pGL3-BS2, pGL3-BS2M, pGL3-BS3 or pGL3-BS3M construct plus Renilla luciferase reporter plasmid. Twenty-four hours after transfection, firefly and Renilla luciferase activity were measured by a Dual-Luciferase Reporter Assay System (Promega, Madison, WI, USA). The data are represented as mean ± SD of three independent experiments.
Cell cycle analysis
Request a detailed protocolHCT116 cells were infected with lentiviruses and screened by puromycin, followed by plating into 6 mm dishes. During the proliferative exponential phase (50% confluency), cells were fixed in 70% ethanol overnight. Cells were then stained with propidium iodide and analyzed by flow cytometry.
RNA in situ hybridization
Request a detailed protocolTo detect LAST, RNA FISH was carried out as previously described with in vitro transcribed antisense probes labeled by Nucleic Acid Labeling Kits (Life technologies, USA) with Alexa Fluor 488 (Yin et al., 2012). The sequence of RNA probe was CGUCUUUUCAGGACACAAAGGCAUGCAGGUGCAUCAUCUCUCUCUAUUAACGGGUCAGCUGGUCGGCAUGGUCAGCUGGUCGGUGGUCUCUUAUUAGGAGAAAGUCACUGAAAUCAGUCUCUUGUCCAAUCACAGCUGCUAUGGCUGAUCGUUUAUGGAGGAUCCUCUUCGCCCCGGGACGUGAGCCCUAGGACCAAGAACUGUGUCUGUUUUGCUCCUUGCGGUGCACCGGCGCCUGGACAUACGCUCCAUCAAUGUGCGUCGCGAGCCGCUGAAGCCCCAUUUGCCGAGGGGGAAACUGAGGCACGAUG. The nuclei were counterstained with PI.
Cytosolic/nuclear fractionation
Request a detailed protocolHCT116 cells (1 × 10⁷) were incubated with hypotonic buffer (25 mM Tris-HCl, PH 7.4, 1 mM MgCl2, 5 mM KCl) on ice for 5 min. An equal volume of hypotonic buffer containing 1% NP-40 was then added, and each sample was left on ice for another 5 min. After centrifugation at 5000 g for 5 min, the supernatant was collected as the cytosolic fraction. The pellets were re-suspended in nucleus resuspension buffer (20 mM HEPES, PH 7.9, 400 mM NaCl2, 1 mM EDTA, 1 mM EGTA, 1 mM DTT, 1 mM PMSF), and incubated at 4°C for 30 min. Nuclear fraction was collected after removing insoluble membrane debris by centrifugation at 12000 g for 10 min.
RNA immunoprecipitation RT-PCR
Request a detailed protocolRNA immunoprecipitation (RIP) was performed as described previously (Yang et al., 2014). 1 × 10⁷ cells were lysed in RIP buffer supplemented with RNase A inhibitor and DNase I before centrifugation. Cell lysates were precleared with protein A/G beads (Pierce) before they were incubated with protein A/G beads coated with the indicated antibodies at 4°C for 3 hr. After extensive washing, the bead-bound immunocomplexes were eluted using elution buffer (50 mM Tris [pH 8.0], 1% SDS, and 10 mM EDTA) at 65°C for 10 min. To isolate protein-associated RNAs from the eluted immunocomplexes, samples were treated with proteinase K, and RNAs were extracted by phenol/chloroform. Purified RNAs were then subjected to RT-PCR analysis.
RIP-seq (RIP sequencing)
Request a detailed protocolRIP was performed as described previously (Xiang et al., 2014). Briefly, two 10 cm2 dishes of HCT116 cells were washed three times with cold PBS and irradiated at 200 mJ/cm2 at 254 nm in HL-2000 HybriLinkerTM UV Crosslinker. Cells were collected and resuspended in 1 ml RIP buffer. Cells were then homogenized and followed by 3 rounds of sonication on ice. Cell lysates were precleared with protein A/G beads (Pierce) before they were incubated with protein A/G beads coated with the indicated antibodies at 4°C for 3 hr. After extensive washing, the bead-bound immunocomplexes were eluted using elution buffer (50 mM Tris [pH 8.0], 1% SDS, and 10 mM EDTA) at 65°C for 10 min. To isolate protein-associated RNAs from the eluted immunocomplexes, samples were treated with proteinase K, and RNAs were extracted by phenol/chloroform. The sequencing was performed and analyzed by KangChen Bio-tech, Shanghai, China. The sequencing data were deposited in the National Center for Biotechnology Information Gene Expression Omnibus database (GSE106918).
mRNA-seq (mRNA sequencing)
Request a detailed protocolTotal RNA from HCT116 cells expressing either control shRNA or LAST shRNA-1 was extracted by phenol/chloroform. The mRNA-seq was performed and analyzed by KangChen Bio-tech, Shanghai, China. The sequencing data were deposited in the National Center for Biotechnology Information Gene Expression Omnibus database (GSE106917).
G-rich motifs analysis in RIP sequencing data
Request a detailed protocolThe peak-calling tool MACS2 (Zhang et al., 2008) (https://github.com/taoliu/MACS/) with default parameter settings was used to call enriched peaks with RIP.bed as input and input.bed as control. A PERL script was written to calculate the proportion of the peaks containing each of the five given motifs (TGGAGNW, TGGAG, GGAGNW, GGAG and GGR) in all the RIP peaks. To test the significance of G-rich motif enrichment, another PERL script was used to perform statistical simulations by generating 1000 random samples of DNA sequences with the same size and the same length distribution as that of the RIP peaks. For each given motif, the average proportion (with standard deviation) of motif-containing sequences in random samples was calculated. A U-test was performed for each G-rich motif to test the significance of the difference between the proportion of the motif-containing sequences in RIP peaks and that in random DNA samples.
Biotin pull-down assay
Request a detailed protocolAll processes were performed in the RNase-free conditions. For antisense oligomer affinity pull-down assay, sense or antisense biotin-labeled DNA oligomers corresponding to LAST or CCND1 mRNA (1 μM) were incubated with lysates from HCT116 cells (1 × 10⁷) or the cytosolic/nuclear extracts. One hour after incubation, streptavidin-coupled agarose beads (Invitrogen) were added to isolate the RNA-protein complex or RNA-RNA complex. For in vitro RNA pull-down assay, 5 μg in vitro-synthesized biotin-labeled RNA was incubated with lysates from HCT116 cells (1 × 10⁷) for 3 hr. Streptavidin-coupled agarose beads (Invitrogen) were then added to the reaction mix to isolate the RNA-protein complex or RNA-RNA complex. Immunocomplexes were then analyzed by real-time RT-PCR or western blotting.
Electrophoretic mobility shift assay
Request a detailed protocolThe electrophoretic mobility shift assay (EMSA) was performed by using an EMSA/gel shift kit (Beyotime, China). Flag-CNBP protein was purified from 293T cells expressing Flag-CNBP. The biotin-labeled RNA fragments (as shown in Figure 4D and E) in vitro transcribed by T7 Transcription Kit (Epicentre, USA) were used in EMSA.
Xenograft mouse model
Request a detailed protocolHCT116 cells expressing control RNA or LAST (3 × 10⁶) were subcutaneously injected into the dorsal flank of 4-week-old male athymic nude mice (Shanghai SLAC Laboratory Animal Co. Ltd.) (n = 7 mice per group). After 3 weeks, mice were sacrificed, and tumors were excised and weighed. HCT116 cells expressing control shRNA or LAST shRNA-1 (3 × 10⁶) were subcutaneously injected into the dorsal flank of 4-week-old male athymic nude mice (Shanghai SLAC Laboratory Animal Co. Ltd.) (n = 7 mice per group). After 6 weeks, mice were sacrificed, and tumors were excised and weighed. Mice were randomly assigned to different experimental groups. During testing the tumors' weight, the experimentalists were blinded to the information and shape of tumor tissue masses. Studies on animals were conducted with approval from the Animal Research Ethics Committee of the University of Science and Technology of China (Permit Number: USTCACUC1701003).
Data availability
-
Myc regulates gene expression in P493-6 cell lines which carry a Myc tet-off systemPublicly available at the NCBI Gene Expression Omnibus (accession no: GSE106916).
-
The impact of lncRNA LAST knockdown on gene expression profile in HCT116 cellsPublicly available at the NCBI Gene Expression Omnibus (accession no: GSE106917).
-
Identification of CNBP binding mRNA and the binding sites/motifs in HCT116 cellsPublicly available at the NCBI Gene Expression Omnibus (accession no: GSE106918).
-
The Cancer Genome AtlasThe National Cancer Institute (NCI) provides access to all individuals seeking information on www.cancer.gov, including individuals who are disabled. To provide this information, the NCI website complies with Section 508 of the Rehabilitation Act (as amended).
-
The high-quality transcription factor binding profile database (JASPAR)The database is ready to be deployed quickly for genome-wide studies through the JASPAR API.
-
InterPro: protein sequence analysis & classificationNew SOAP-based Web Services have been added to complement the existing InterProScan Web Service. These allow users to programmatically retrieve InterPro entry data such as the abstract, integrated signature lists or GO terms. Users can download a range of clients from http://www.ebi.ac.uk/Tools/webservices/clients/dbfetch, including PERL, C#.NET and Java clients, to access this data.
References
-
Transcriptional regulation and transformation by Myc proteinsNature Reviews Molecular Cell Biology 6:635–645.https://doi.org/10.1038/nrm1703
-
Cellular nucleic acid binding protein binds G-rich single-stranded nucleic acids and may function as a nucleic acid chaperoneJournal of Cellular Biochemistry 103:1013–1036.https://doi.org/10.1002/jcb.21474
-
Regulation of transcription by long noncoding RNAsAnnual Review of Genetics 48:433–455.https://doi.org/10.1146/annurev-genet-120213-092323
-
PVT1: a rising star among oncogenic long noncoding RNAsBioMed Research International 2015:1–10.https://doi.org/10.1155/2015/304208
-
Dosage compensation in Drosophila melanogaster: epigenetic fine-tuning of chromosome-wide transcriptionNature Reviews Genetics 13:123–134.https://doi.org/10.1038/nrg3124
-
c-Myc controls proliferation versus differentiation in human pancreatic endocrine cellsThe Journal of Clinical Endocrinology & Metabolism 87:3475–3485.https://doi.org/10.1210/jcem.87.7.8700
-
CCND1 amplification and cyclin D1 expression in breast cancer and their relation with proteomic subgroups and patient outcomeBreast Cancer Research and Treatment 109:325–335.https://doi.org/10.1007/s10549-007-9659-8
-
Genomic targets of the human c-Myc proteinGenes & Development 17:1115–1129.https://doi.org/10.1101/gad.1067003
-
Akt2-mediated phosphorylation of Pitx2 controls Ccnd1 mRNA decay during muscle cell differentiationCell Death and Differentiation 17:975–983.https://doi.org/10.1038/cdd.2009.194
-
The tight junction protein ZO-2 blocks cell cycle progression and inhibits cyclin D1 expressionAnnals of the New York Academy of Sciences 1165:121–125.https://doi.org/10.1111/j.1749-6632.2009.04024.x
-
The elements of human cyclin D1 promoter and regulation involvedClinical Epigenetics 2:63–76.https://doi.org/10.1007/s13148-010-0018-y
-
InterPro: the integrative protein signature databaseNucleic Acids Research 37:D211–D215.https://doi.org/10.1093/nar/gkn785
-
QGRS Mapper: a web-based server for predicting G-quadruplexes in nucleotide sequencesNucleic Acids Research 34:W676–W682.https://doi.org/10.1093/nar/gkl253
-
Role of MYC-regulated long noncoding RNAs in cell cycle regulation and tumorigenesisJNCI: Journal of the National Cancer Institute 107:.https://doi.org/10.1093/jnci/dju505
-
MYC: connecting selective transcriptional control to global RNA productionNature Reviews Cancer 15:593–607.https://doi.org/10.1038/nrc3984
-
A link between c-Myc-mediated transcriptional repression and neoplastic transformationJournal of Clinical Investigation 97:1687–1695.https://doi.org/10.1172/JCI118595
-
Epigenetic regulation by long noncoding RNAsScience 338:1435–1439.https://doi.org/10.1126/science.1231776
-
Elongation of the Kcnq1ot1 transcript is required for genomic imprinting of neighboring genesGenes & Development 20:1268–1282.https://doi.org/10.1101/gad.1416906
-
Analysis of key cell-cycle checkpoint proteins in colorectal tumoursThe Journal of Pathology 196:386–393.https://doi.org/10.1002/path.1053
-
Cellular Nucleic Acid Binding Protein (CNBP) in Aging and DiseaseThe Faseb Journal 23:671.7.https://doi.org/10.1096/fj.1530-6860
-
Cyclin D as a therapeutic target in cancerNature Reviews Cancer 11:558–572.https://doi.org/10.1038/nrc3090
-
Colon cancer associated transcript-1: a novel RNA expressed in malignant and pre-malignant human tissuesInternational Journal of Cancer 130:1598–1606.https://doi.org/10.1002/ijc.26170
-
Novel RNA-binding activity of MYF5 enhances Ccnd1/Cyclin D1 mRNA translation during myogenesisNucleic Acids Research 44:2393–2408.https://doi.org/10.1093/nar/gkw023
-
Repression of cyclin D1: a novel function of MYCMolecular and Cellular Biology 14:4032–4043.https://doi.org/10.1128/MCB.14.6.4032
-
Unique features of long non-coding RNA biogenesis and functionNature Reviews Genetics 17:47–62.https://doi.org/10.1038/nrg.2015.10
-
Acceleration of the G1/S phase transition by expression of cyclins D1 and E with an inducible systemMolecular and Cellular Biology 14:1669–1679.https://doi.org/10.1128/MCB.14.3.1669
-
Cell cycle regulation of the c-Myc transcriptional activation domainMolecular and Cellular Biology 13:4125–4136.https://doi.org/10.1128/MCB.13.7.4125
-
D-type cyclinsTrends in Biochemical Sciences 20:187–190.https://doi.org/10.1016/S0968-0004(00)89005-2
-
The Cancer Genome Atlas Pan-Cancer analysis projectNature Genetics 45:1113–1120.https://doi.org/10.1038/ng.2764
-
Long noncoding RNAs with snoRNA endsMolecular Cell 48:219–230.https://doi.org/10.1016/j.molcel.2012.07.033
-
Model-based analysis of ChIP-Seq (MACS)Genome Biology 9:R137.https://doi.org/10.1186/gb-2008-9-9-r137
Article and author information
Author details
Funding
Ministry of Science and Technology of the People's Republic of China (2016YFC1302302)
- Mian Wu
National Natural Science Foundation of China (81430065)
- Mian Wu
National Natural Science Foundation of China (31371388)
- Mian Wu
The funders had no role in study design, data collection and interpretation, or the decision to submit the work for publication.
Acknowledgements
The results shown in Figure 6E and F, Figure 6—figure supplements 1 and 2 are based upon data generated by the TCGA Research Network: http://cancergenome.nih.gov/. We would like to thank Professor Ping Gao for providing P493-6 cells carrying a c-Myc tet-off system. This work was supported by grants from the National Key R and D Program of China (2016YFC1302302) and National Natural Science Foundation of China (81430065 and 31371388).
Ethics
Animal experimentation: Studies on animals in this paper were conducted with approval from the Animal Research Ethics Committee of the University of Science and Technology of China (Permit Number: USTCACUC1701003).
Copyright
© 2017, Cao et al.
This article is distributed under the terms of the Creative Commons Attribution License, which permits unrestricted use and redistribution provided that the original author and source are credited.
Metrics
-
- 3,379
- views
-
- 698
- downloads
-
- 81
- citations
Views, downloads and citations are aggregated across all versions of this paper published by eLife.
Citations by DOI
-
- 81
- citations for umbrella DOI https://doi.org/10.7554/eLife.30433
Download links
A two-part list of links to download the article, or parts of the article, in various formats.
Downloads (link to download the article as PDF)
Open citations (links to open the citations from this article in various online reference manager services)
Cite this article (links to download the citations from this article in formats compatible with various reference manager tools)
LAST, a c-Myc-inducible long noncoding RNA, cooperates with CNBP to promote CCND1 mRNA stability in human cells
eLife 6:e30433.
https://doi.org/10.7554/eLife.30433


