Neurexin–Neuroligin 1 regulates synaptic morphology and functions via the WAVE regulatory complex in Drosophila neuromuscular junction
- Southeast University, China
- Nantong University, China
- University of Toronto, Canada
Figures
Figure 1 with 1 supplement
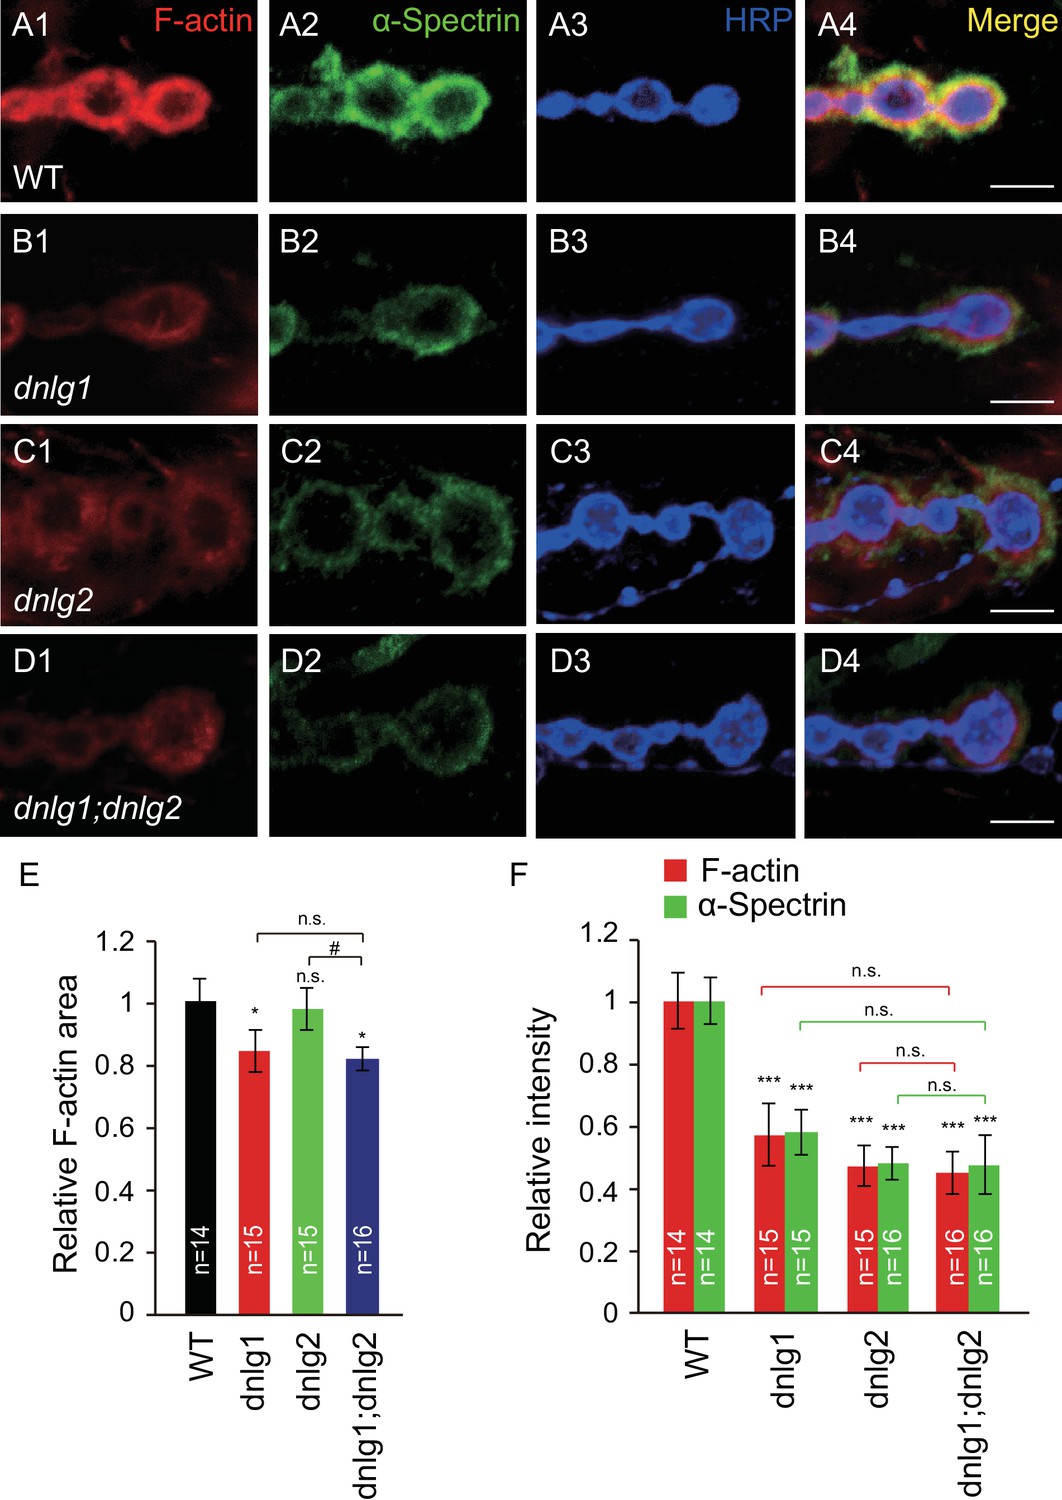
DNlg1 and DNlg2 promote postsynaptic F-actin assembly.
(A–D) Confocal images of (A) WT, (B) dnlg1 mutant (dnlg1ex1.9/ex2.3), (C) dnlg2 mutant (dnlg2KO70/KO70), and (D) dnlg1; dnlg2 double mutant (dnlg2KO70/KO70; dnlg1ex1.9/ex2.3) third instar larvae NMJ type Ib boutons at muscles 12/13 labeled with Texas Red phalloidin (red), anti-α-Spectrin (green), and anti-HRP (blue). (E) Summary graph showing a significant decrease in the relative area of F-actin in dnlg1 single mutants and dnlg1; dnlg2 double mutants compared with WT. Note that the relative F-actin area is normal in the dnlg2 mutants. (F) Summary graph showing the relative fluorescence intensity of F-actin and α-Spectrin in various genotypes. Note that the relative fluorescence intensity of F-actin and α-Spectrin is significantly decreased in the dnlg1 single mutants, dnlg2 single mutants and dnlg1; dnlg2 double mutants. The data in (E) and (F) are shown as the mean ± SEM; n represents the number of boutons analyzed; asterisks indicate significant differences between WT and the indicated genotypes. *p<0.05; ***p<0.001; n.s., not significant. Hashes indicate significant differences between two indicated groups. #p<0.05; n.s., not significant. Scale bars: (A–D) 5 μm.
-
Figure 1—source data 1
Sample size (n), mean, SEM, and one-way ANOVA (and nonparametric) with Tukey's multiple comparisons test are presented for the data in Figure 1E and F.
- https://doi.org/10.7554/eLife.30457.004
Figure 1—figure supplement 1
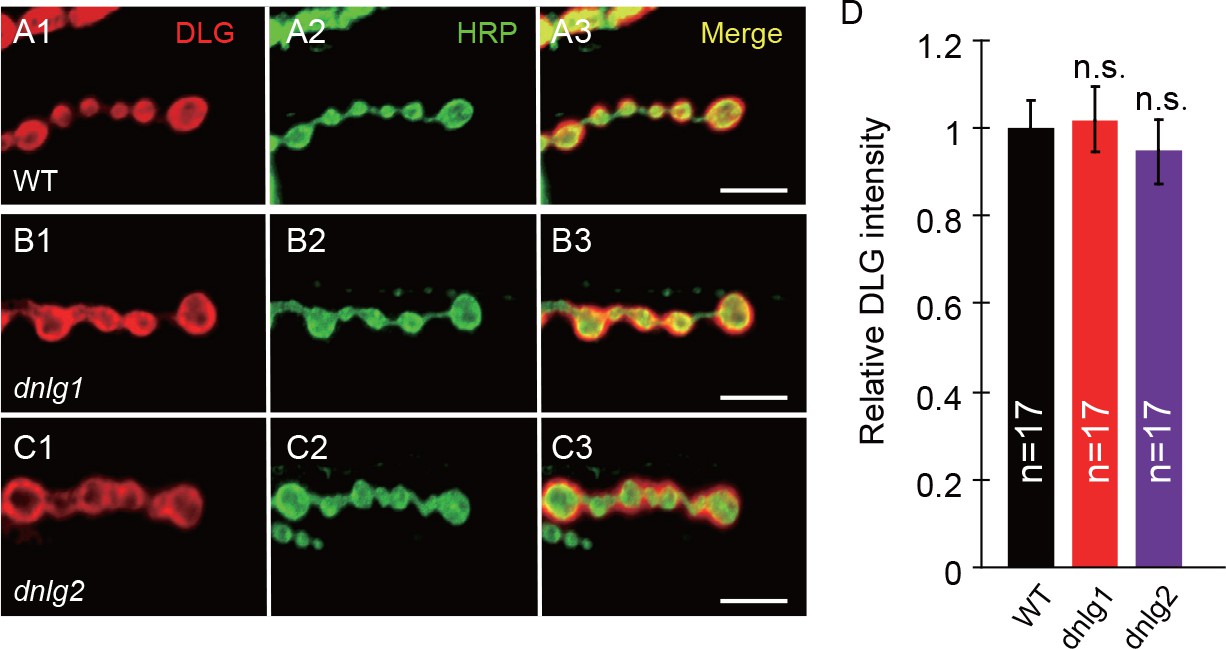
The distribution and localization of DLG are normal in neuroligin mutants.
(A–C) Confocal images of (A) WT, (B) dnlg1 mutant (dnlg1ex1.9/ex2.3), and (C) dnlg2 mutant (dnlg2KO17/KO70) third instar larvae NMJ type Ib boutons labeled with anti-DLG (red) and anti-HRP (green). The distribution and protein level of DLG are normal in the dnlg1 and dnlg2 mutants compared with those in the WT control. (D) Statistical analysis of the relative DLG fluorescent intensity in the three tested lines. The data in (D) are shown as mean ± SEM; n represents the number of NMJ samples analyzed; n.s., not significant. Scale bars: (A–C) 10 μm.
-
Figure 1—figure supplement 1—source data 1
Sample size (n), mean, SEM, and Mann–Whitney test in Figure 1—figure supplement 1D.
- https://doi.org/10.7554/eLife.30457.005
Figure 2
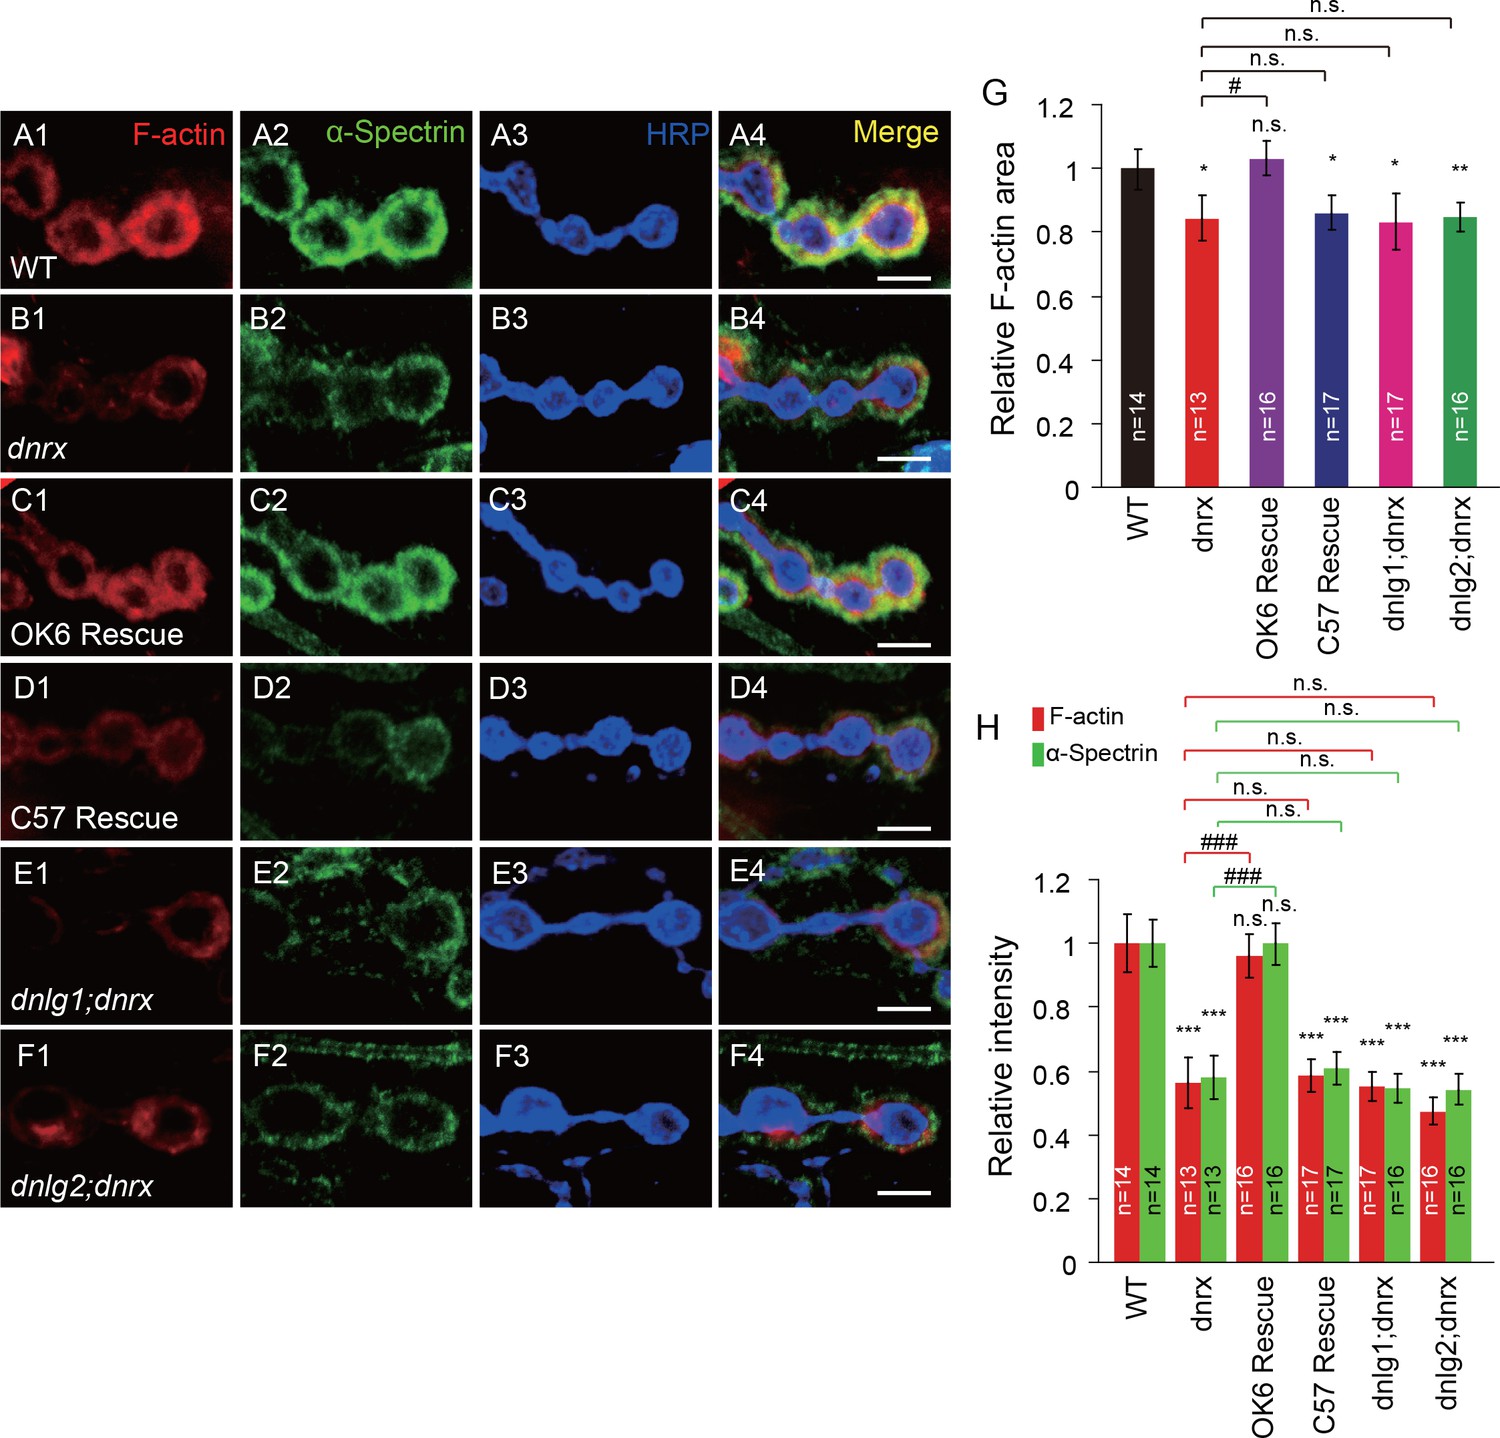
DNlg1 and DNlg2 mediate the effect of DNrx on postsynaptic F-actin.
(A–F) Confocal images of (A) WT, (B) dnrx mutant (dnrx83/174), (C) OK6 rescue (OK6-Gal4/UAS-DNrx;dnrx83/174), (D) C57 rescue (UAS-DNrx/+,dnrx174/dnrx83,C57-Gal4), (E) dnlg1; dnrx double mutant (dnrx83,dnlg1ex2.3/dnrx174,dnlg1ex1.9), and (F) dnlg2; dnrx double mutant (dnlg2KO70/K070;dnrx83/174) third instar larvae NMJ type Ib boutons at muscles 12/13 labeled with Texas Red phalloidin (red), anti-α-Spectrin (green), and anti-HRP (blue). (G) Summary graph showing a significant decrease in the relative F-actin area in the dnrx mutants, C57 rescue, dnlg1; dnrx double mutants, and dnlg2; dnrx double mutants compared with the WT. (H) Summary graph showing a significant decrease in the relative fluorescence intensity of F-actin and α-Spectrin in the dnrx mutants, C57 rescue, dnlg1; dnrx double mutants, and dnlg2; dnrx double mutants compared with the WT. The data in (G) and (H) are shown as the mean ± SEM; n represents the number of boutons analyzed; asterisks indicate significant differences between the WT and the indicated genotypes. *p<0.05; **p<0.01; ***p<0.001; n.s., not significant. Hashes indicate significant differences between two indicated genotypes, #p<0.05; ###p<0.001; n.s., not significant. Scale bars: (A–F) 5 μm.
-
Figure 2—source data 1
Sample size (n), mean, SEM, and one-way ANOVA (and nonparametric) with Tukey's multiple comparisons test are presented for the data in Figure 2G and H.
- https://doi.org/10.7554/eLife.30457.007
Figure 3 with 2 supplements
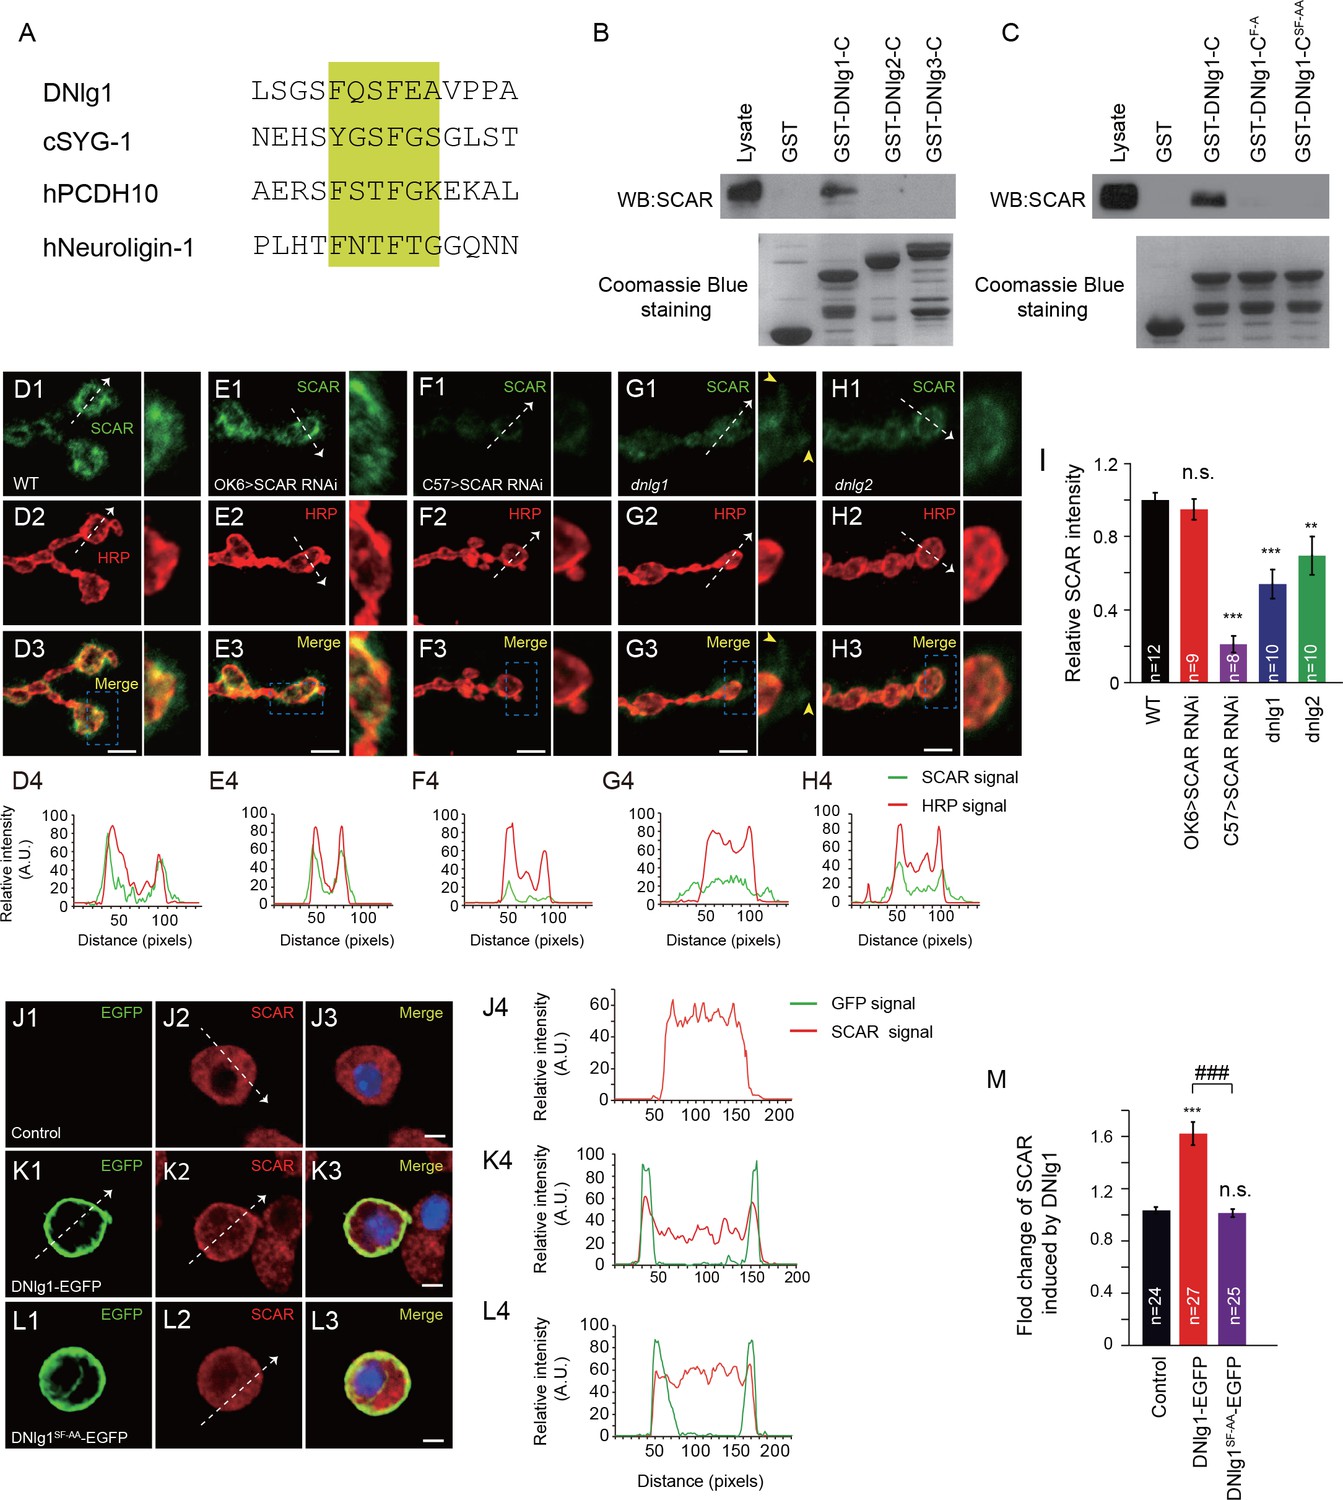
DNlg1, but not DNlg2 or DNlg3, binds to the WRC through its WIRS motif and recruits the WRC to the postsynaptic membrane.
(A) Amino acid sequence alignment of DNlg1, C. elegans SYG-1 (cSYG-1), human PCDH10 (hPCDH10), and human Neuroligin 1 (hNeuroligin-1). The WIRS motifs are highlighted in yellow. (B) Lysates of WT fly brains were incubated with GST and GST-fused cytoplasmic domains of DNlg1 (GST-DNlg1-C), DNlg2 (GST-DNlg2-C), and DNlg3 (GST-DNlg3-C), respectively. The proteins pulled down with the GST or GST-fused proteins were analyzed by western blots using anti-SCAR antibody. Endogenous WRC was retained from the protein lysate by immobilized GST-DNlg1-C, but not by GST, GST-DNlg2-C, or GST-DNlg3-C. GST and GST-fused proteins were detected by Coomassie Blue staining. (C) Western blots showing that endogenous WRC was retained from fly-head lysates by immobilized GST-DNlg1-C, but not by the mutant forms of the WIRS motif GST-DNlg1-CF-A (F changed to A at the first amino acid residue in the WIRS motif) and GST-DNlg1-CSF-AA (SF changed to AA at the third and fourth amino acid residues in the WIRS motif). GST and GST-fused proteins were detected by Coomassie Blue staining. (D–H) Confocal images of (D) WT, (E) OK >SCAR RNAi (OK6-Gal4/+; UAS-SCAR RNAi/+), (F) C57 >SCAR RNAi (C57-Gal4/+; UAS-SCAR RNAi/+), (G) dnlg1 mutant (dnlg1ex1.9/ex2.3), and (H) dnlg2 mutant (dnlg2KO70/KO17) third instar larvae NMJ type Ib boutons labeled with anti-SCAR (green) and anti-HRP (red). The majority of SCAR protein was docked on the postsynaptic site. The loss of DNlg1 or DNlg2 caused a reduction in the level of SCAR. Line profile analyses show the distribution and intensity fluctuation of SCAR and HRP in each genotype. Dotted white lines indicate the regions analyzed in the line profile analysis. The directions are indicated by white arrows. Yellow arrow heads indicate diffused SCAR immunostaining signals in the dnlg1 mutants. (I) Summary graphs of the relative fluorescence intensity of SCAR signals in the indicated genotypes. (J–L) Low-density culture of (J) control S2 cells and (K) cells expressing DNlg1-EGFP or (L) the WIRS mutant form SF-AA (DNlg1SF-AA–EGFP) labeled with anti-SCAR and anti-GFP. SCAR was distributed throughout the cytoplasm of control S2 cells but was highly enriched at or near the cell membrane in the cells expressing DNlg1-EGFP, but not in those expressing DNlg1SF-AA-EGFP. Line profile analyses show that WT DNlg1, but not DNlg1SF-AA, induced the recruitment of SCAR to the plasma membrane and caused the co-localization of DNlg1 and SCAR. Dotted white lines indicate the regions analyzed in the line profile analysis. The directions are indicated by white arrows. (M) The ratio of SCAR intensity at the plasma membrane to that within the cytoplasm was calculated to indicate the recruitment of SCAR to the plasma membrane. A summary graph shows that WT DNlg1, but not DNlg1SF-AA, induced the recruitment of SCAR to the plasma membrane. The data in (I) and (M) are shown as the mean ± SEM; n represents the number of boutons analyzed; asterisks indicate significant differences between the WT and the indicated genotypes. **p<0.01; ***p<0.001; n.s., not significant. Hashes indicate significant differences between two indicated genotypes, ###p<0.001. Scale bars: (D–H) 5 μm, (J–L) 5 μm. A. U., artificial unit.
-
Figure 3—source data 1
Sample size (n), mean, SEM, and one-way ANOVA (and nonparametric) with Tukey's multiple comparisons test are presented for the data in Figure 3I and M.
- https://doi.org/10.7554/eLife.30457.011
Figure 3—figure supplement 1
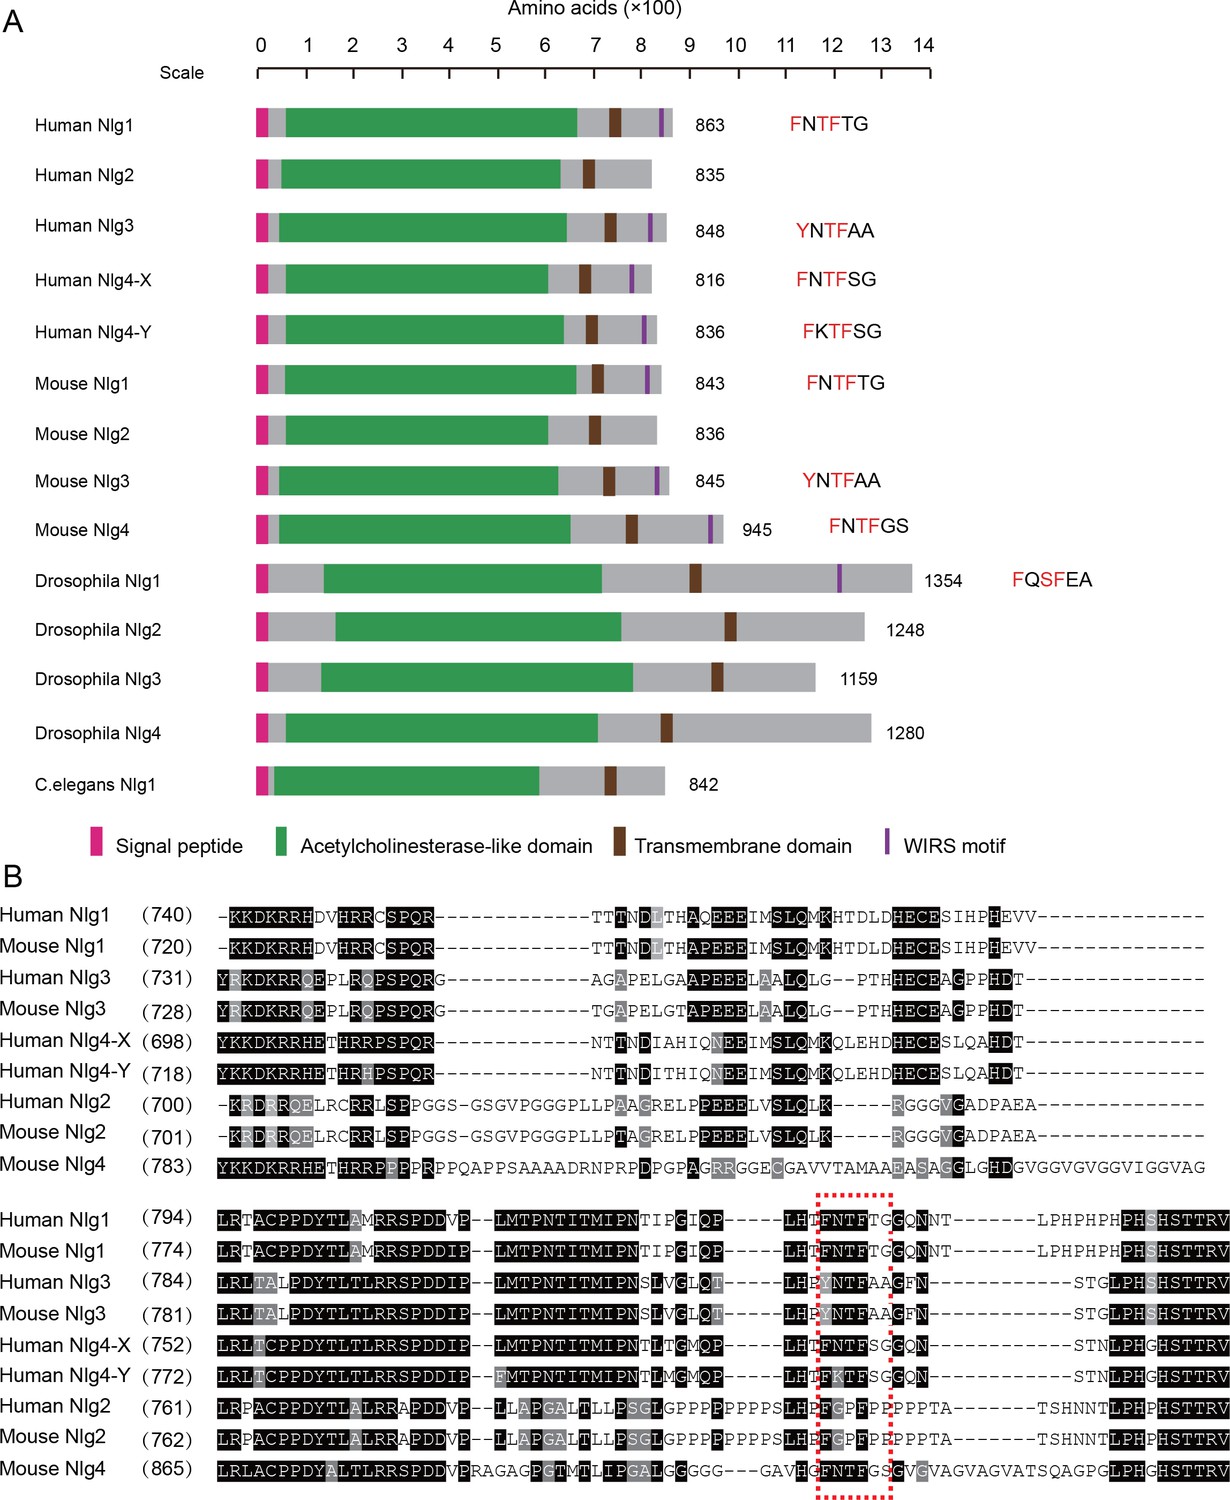
The WIRS motif is prevalent in neuroligins.
(A) Sequence analysis of neuroligins from human, mouse, Drosophila, and C.elegans shows that WIRS is prevalent in neuroligins, especially in mammalian neuroligins. Neuroligin structures are indicated, and their WIRS motifs are marked if they have the motif. The WIRS sequence is also shown with the core amino acids highlighted in red color. (B) Sequence alignment of C termini of human and mouse neuroligins shows that Nlg1, Nlg3, and Nlg4 (Nlg4-X and Nlg4-Y) are more similar to each other than to Nlg2. Note that mouse Nlg4 is less conserved and was previously identified as an Nlg-like protein. The WIRS motif is highlighted by a red, dotted rectangle. Note that a core amino acid in the WIRS motif is mutated to P in Nlg2 and thus disrupts the property of WIRS.
Figure 3—figure supplement 2
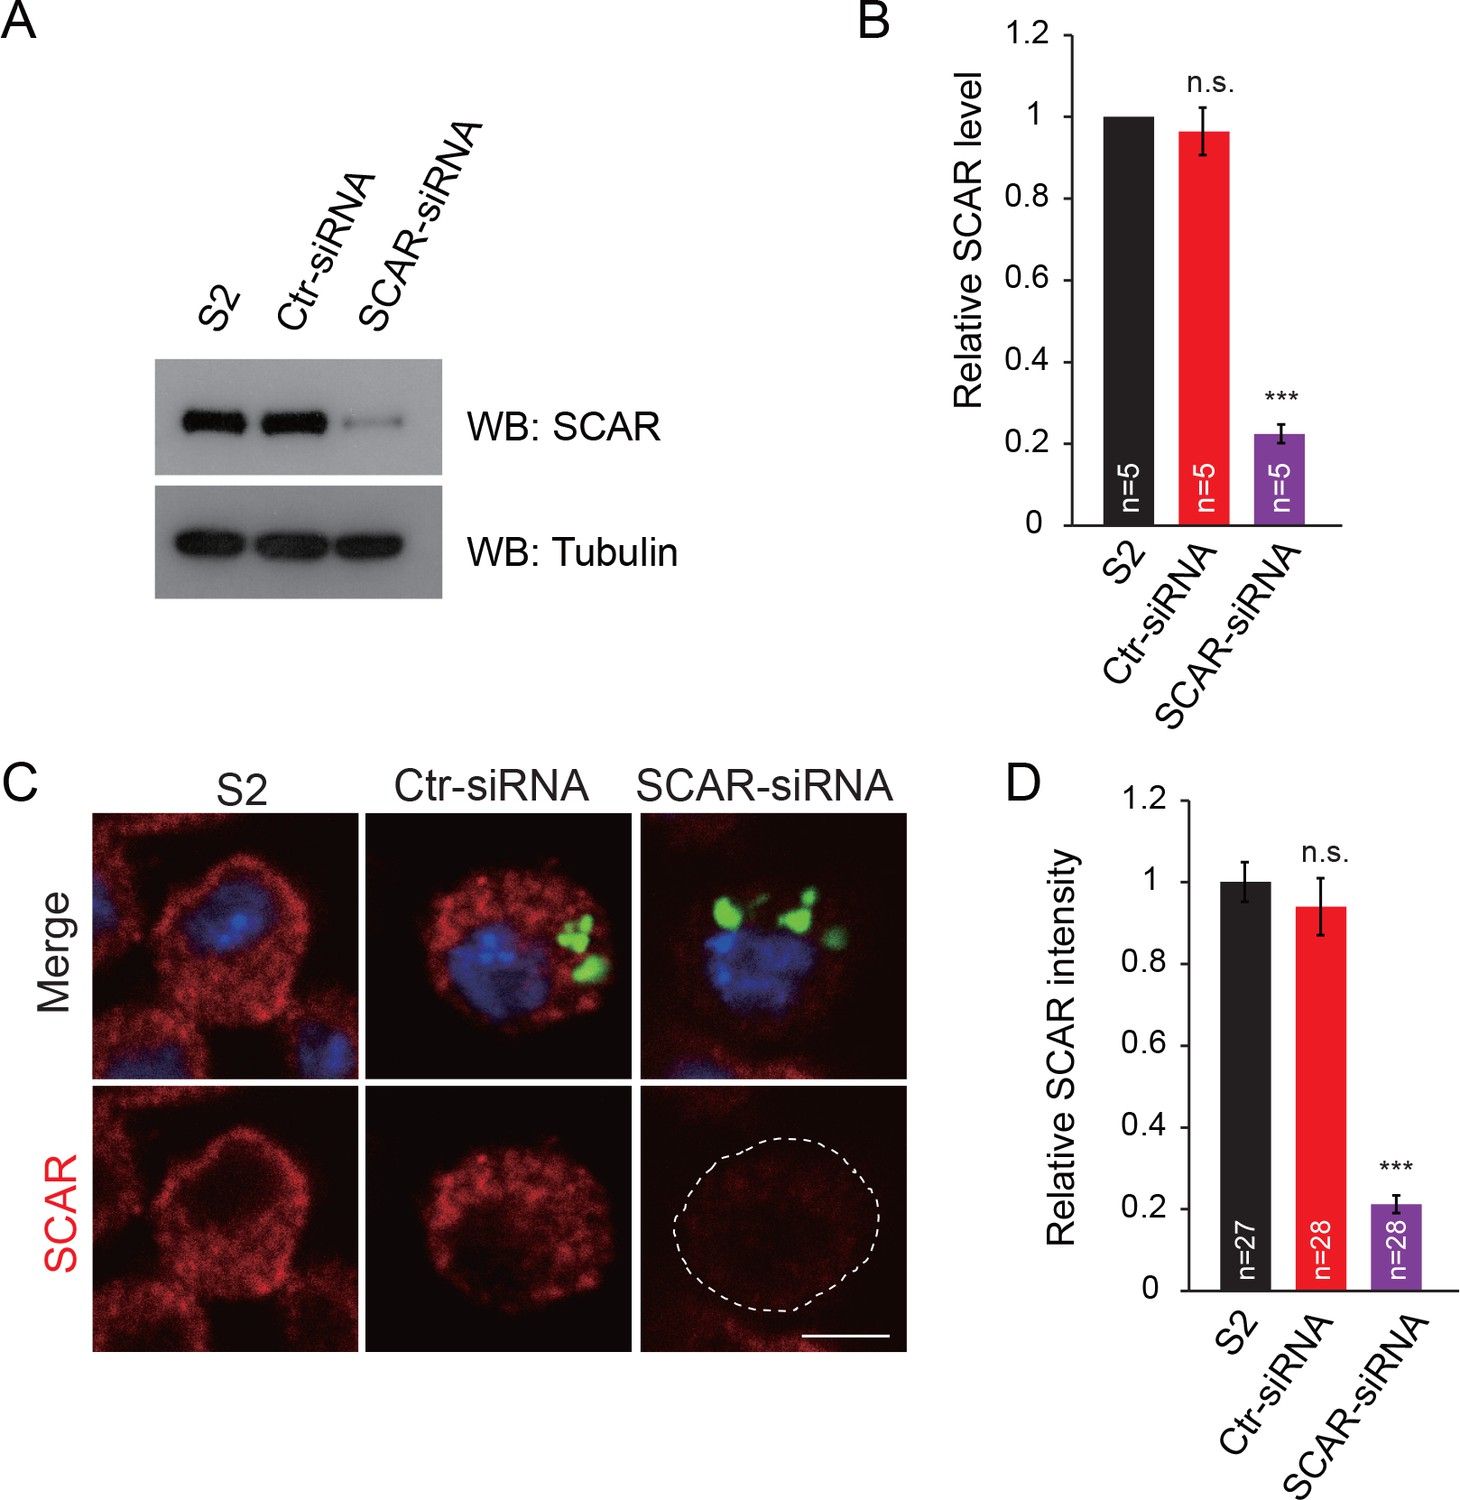
Examination of SCAR expression and distribution in S2 cells by siRNA.
(A) S2 cells were transfected with control siRNA (Ctr-siRNA) or SCAR siRNA or for 3 days, and the resulting lysates were subjected to western blots with anti-SCAR antibody, using tubulin as a loading control and nontransfected S2 cells as a positive control. (B) Quantitative analysis of the SCAR level in (A). (C) Same as (A); nontransfected and transfected cells were immunostained with anti-SCAR antibody (red) and DAPI (blue). Note that siRNA foci were labeled with FAM (carboxyfluorescein) to indicate transfection. (D) Quantitative analysis of the SCAR intensity in (C). The data in (B) and (D) are shown as mean ± SEM; n represents the number of replicate experiments in (B) and the number of cells analyzed in (D); asterisks indicate significant differences between the WT and the indicated genotypes. ***p<0.001; n.s., not significant. Scale bar: (C) 5 μm.
-
Figure 3—figure supplement 2—source data 1
Sample size (n), mean, SEM, and one-way ANOVA (and nonparametric) Turkey's multiple comparisons test are presented for the data in Figure 3—figure supplement 2B and D.
- https://doi.org/10.7554/eLife.30457.012
Figure 4

Postsynaptic knockdown of SCAR impairs F-actin assembly and inhibits bouton growth.
(A) Brain lysates from WT and Elav > SCAR RNAi (Elav/+; UAS-SCAR RNAi/+) flies were subjected to western blots with anti-SCAR antibody. SCAR expression was dramatically inhibited in the Elav > SCAR RNAi line. A summary graph shows the relative SCAR intensity in both lines. (B–C) Confocal images of (B) WT and (C) 24B > SCAR RNAi (UAS-SCAR RNAi/+; 24B-Gal4/+) third instar larvae NMJ type Ib boutons at muscles 12/13 labeled with Texas Red phalloidin (red), anti-α-Spectrin (green), and anti-HRP (blue). (D–E) Confocal images of WT and 24B > SCAR RNAi third instar larvae NMJs at muscles 6/7 segment A2 labeled with anti-HRP. (F–H) Quantitative analysis of the relative F-actin area, intensity of F-actin and α-Spectrin, and bouton number in WT and 24B > SCAR RNAi flies. The data in (A) and (F–H) are shown as the mean ± SEM; n represents the number of replicate experiments in (A), the number of boutons analyzed in (F) and (G), and the number of NMJs analyzed in (H); asterisks indicate significant differences between the WT and the indicated genotypes. *p<0.05; ***p<0.001. Scale bars: (B, C) 5 μm, (D, E) 50 μm.
-
Figure 4—source data 1
Sample size (n), mean, SEM, and Mann–Whitney test or Student’s t-test for Figures 4A, F, G and H.
- https://doi.org/10.7554/eLife.30457.014
Figure 5 with 1 supplement
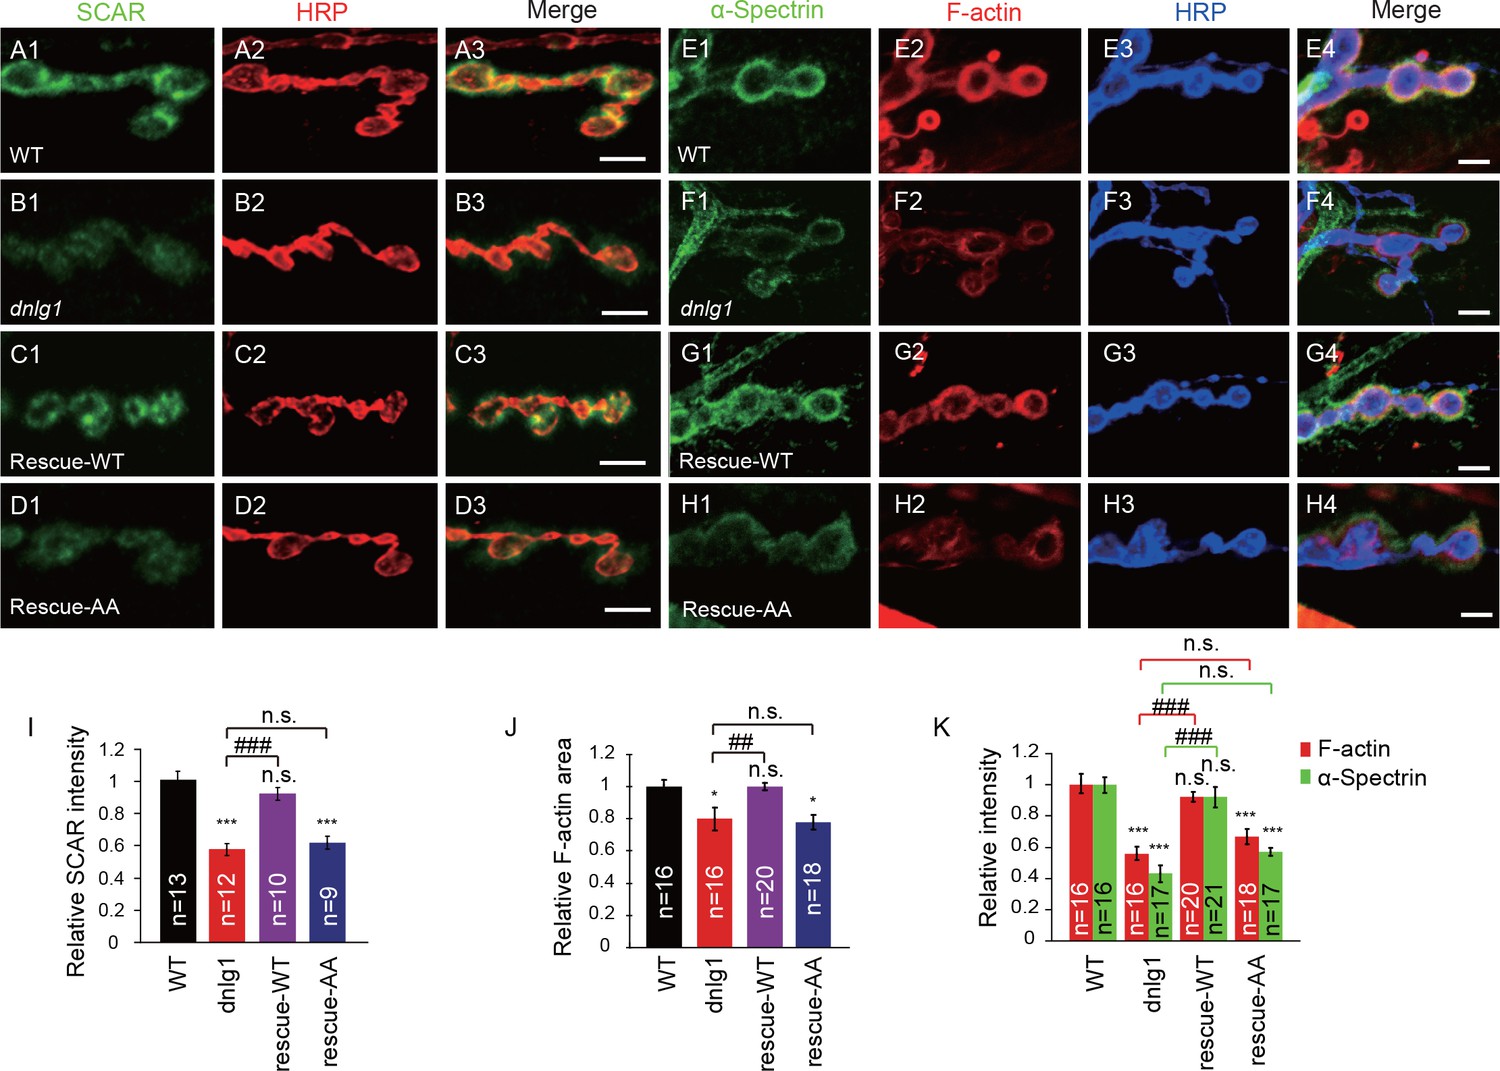
The interaction between DNlg1 and the WRC is required for WRC localization and F-actin assembly.
(A–D) Confocal images of third instar larvae NMJ type Ib boutons double labeled with anti-SCAR (green) and anti-HRP (red). (A) WT. (B) dnlg1 mutant (dnlg1ex1.9/ex2.3). (C) Muscle-specific rescue line using Mef2-Gal4 driving a full-length DNlg1 coding sequence in a dnlg1 mutant (Mef2-Gal4/+; dnlg1ex1.9, UAS-DNlg1/dnlg1ex2.3; rescue-WT). (D) Muscle-specific line using Mef2-Gal4 driving a full-length DNlg1 coding sequence containing a WIRS mutation in a dnlg1 mutant (Mef2-Gal4/+; dnlg1ex1.9, UAS-DNlg1SF-AA/dnlg1ex2.3; rescue-AA). The altered SCAR distribution and protein level in the dnlg1 mutants were rescued in the rescue-WT line, but not in the rescue-AA line. (E–H) Confocal images of (E) WT, (F) dnlg1 mutant, (G) rescue-WT, and (H) rescue-AA third instar larvae NMJ type Ib boutons at muscles 12/13 labeled with Texas Red phalloidin (red), anti-α-Spectrin (green) and anti-HRP (blue). The impaired F-actin and α-Spectrin cytoskeleton assemblies in the dnlg1 mutants were rescued in the rescue-WT line, but not in the rescue-AA line. (I) A summary graph showing that the reduced relative SCAR fluorescence intensity in the dnlg1 mutants was rescued in the rescue-WT line, but not in the rescue-AA line. (J, K) Summary graphs of the relative F-actin area and the relative fluorescence intensity of F-actin and α-Spectrin in the indicated genotypes. The data shown in (I–K) are mean ± SEM; n represents the number of boutons analyzed; asterisks indicate significant differences between the WT and the indicated genotypes. *p<0.05; ***p<0.001. n.s., not significant. Hashes indicate significant differences between two indicated genotypes, ##p<0.01; ###p<0.001; n.s., not significant. Scale bars: (A–D) 5 μm; (E–H) 5 μm.
-
Figure 5—source data 1
Sample size (n), mean, SEM, and one-way ANOVA (and nonparametric) with Tukey's multiple comparisons test are presented for the data in Figure 5I.
- https://doi.org/10.7554/eLife.30457.017
Figure 5—figure supplement 1
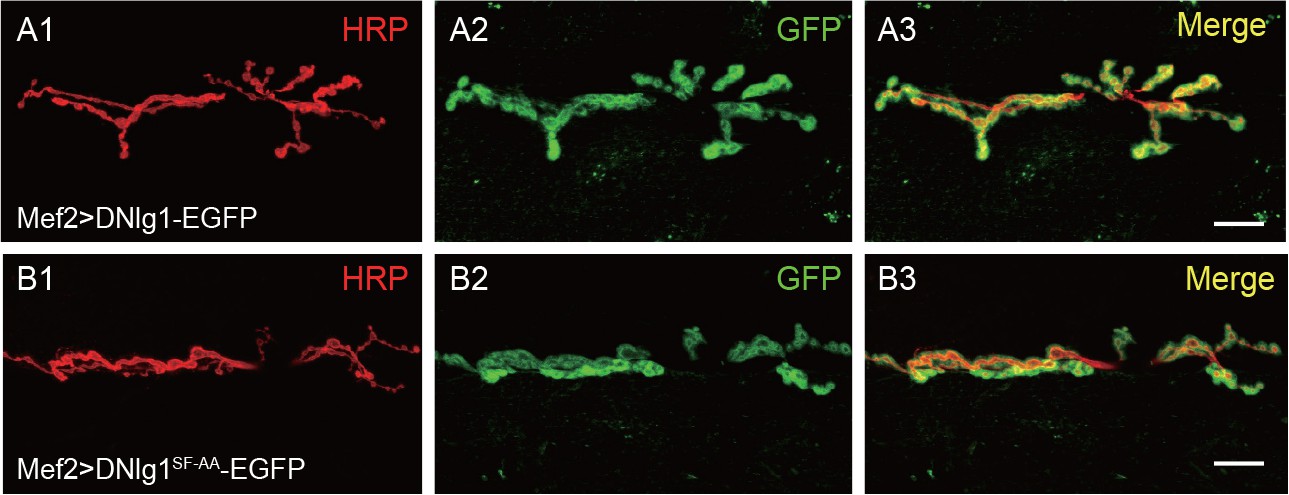
DNlg1SF-AA, the mutant form of DNlg1, can be normally targeted to postsynaptic sites.
Confocal images of (A) Mef2 >DNlg1 EGFP (Mef2-Gal4/+; UAS-DNlg1-EGFP/+) and (B) Mef2 >DNlg1 SF-AA-EGFP (Mef2-Gal4/+; UAS-DNlg1SF-AA-EGFP/+) third instar larvae NMJ type Ib boutons labeled with anti-HRP (red). Note that the green fluorescence signal indicates the expression of the EGFP protein. Both DNlg1-EGFP and DNlg1SF-AA-EGFP could be targeted to postsynaptic sites when they were driven by muscle-specific Gal4 Mef2-Gal4. Scale bars: (A, B) 20 μm.
Figure 6 with 1 supplement
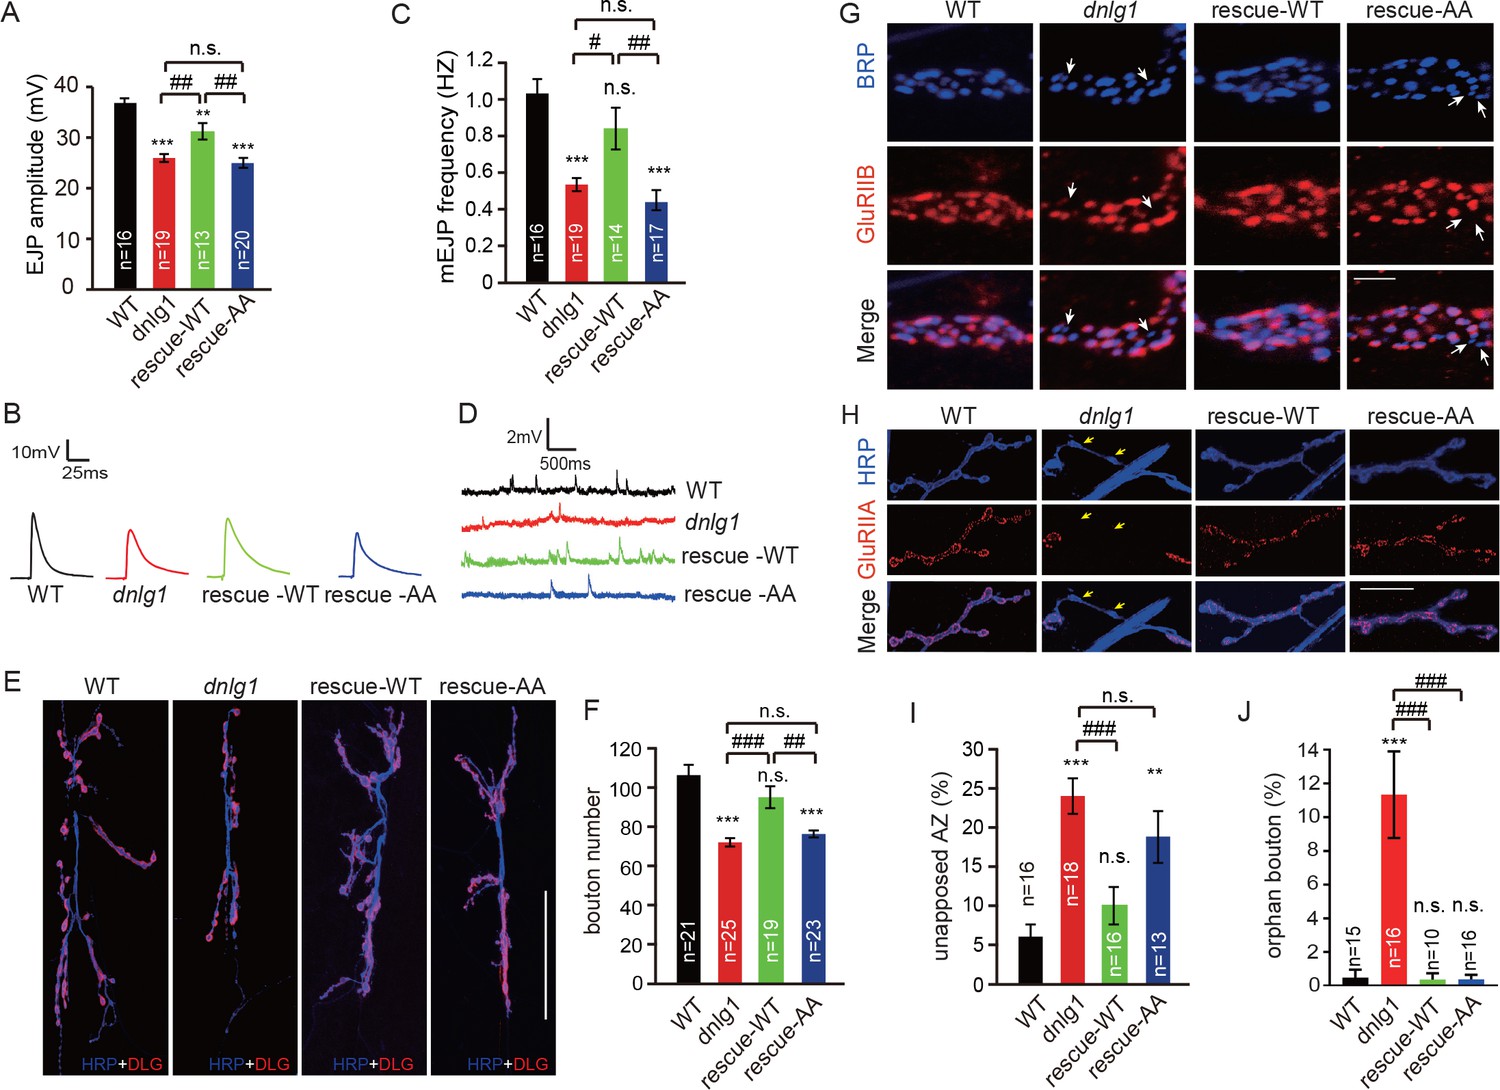
The interaction between DNlg1 and the WRC is critical for the functions of DNlg1 in bouton growth, synaptic transmission, and GluR recruitment.
(A–D) Electrophysiological analysis of control and dnlg1 mutant NMJs on muscles 6/7 of third instar larvae indicated that postsynaptic expression of WT DNlg1, but not mutant DNlg1SF-AA, rescued the reduced synaptic transmission in the dnlg1 mutants. (A) Bar graphs of the mean EJP (in mV) and (B) representative traces of the EJP amplitudes in WT, dnlg1 mutant (dnlg1ex1.9/ex2.3), rescue-WT (Mef2-Gal4/+; dnlg1ex1.9/dnlg1ex2.3, UAS-DNlg1-EGFP), and rescue-AA (Mef2-Gal4/+; dnlg1ex1.9/dnlg1ex2.3, UAS-DNlg1SF-AA-EGFP) NMJs. (C) Bar graphs of the mean mEJP frequency and (D) representative traces of the mEJP frequency in WT, dnlg1 mutant, rescue-WT, and rescue-AA NMJs. (E–F) Postsynaptic expression of WT DNlg1, but not mutant DNlg1SF-AA, could rescue the reduced bouton number in the dnlg1 mutants. (E) Confocal images of WT, dnlg1 mutant, rescue-WT, and rescue-AA third instar larvae NMJ type Ib boutons at muscles 6/7 labeled with DLG (red) and anti-HRP (blue). (F) Quantitative data of bouton numbers in (E). (G) Confocal images of third instar larvae NMJ type Ib boutons at muscle four labeled with GluRIIB (red) and postsynaptic active zone marker Brp (blue) to quantify GluR unaligned with the active zone in the same four lines. (H) Confocal images of third instar larvae NMJ type I boutons at muscle four labeled with GluRIIA (red) and HRP (blue) to quantify orphan boutons in the same four lines. (I and J) Statistical analysis of (I) unopposed active zone and (J) orphan boutons that have a presynaptic (HRP) site but lack postsynaptic GluR localization. The green fluorescence signal indicates the expression of EGFP. White arrow: unopposed GluRIIB and BRP; yellow arrow: orphan boutons completely losing GluRIIA positioning. The data in (A), (C), (F), (I), and (J) are shown as the mean ± SEM; n represents the number of NMJ samples analyzed; asterisks indicate significant differences between the WT and the indicated genotypes. **p<0.01; ***p<0.001; n.s., not significant. Hashes indicate significant differences between genotypes. #p<0.05; ##p<0.01; ###p<0.001; n.s., not significant. Scale bars: (E) 50 μm, (G) 1 μm, (H) 20 μm.
-
Figure 6—source data 1
Sample size (n), mean, SEM, and one-way ANOVA (and nonparametric) with Tukey's multiple comparisons test are presented for the data in Figures 6A, C, F, I and J.
- https://doi.org/10.7554/eLife.30457.020
Figure 6—figure supplement 1
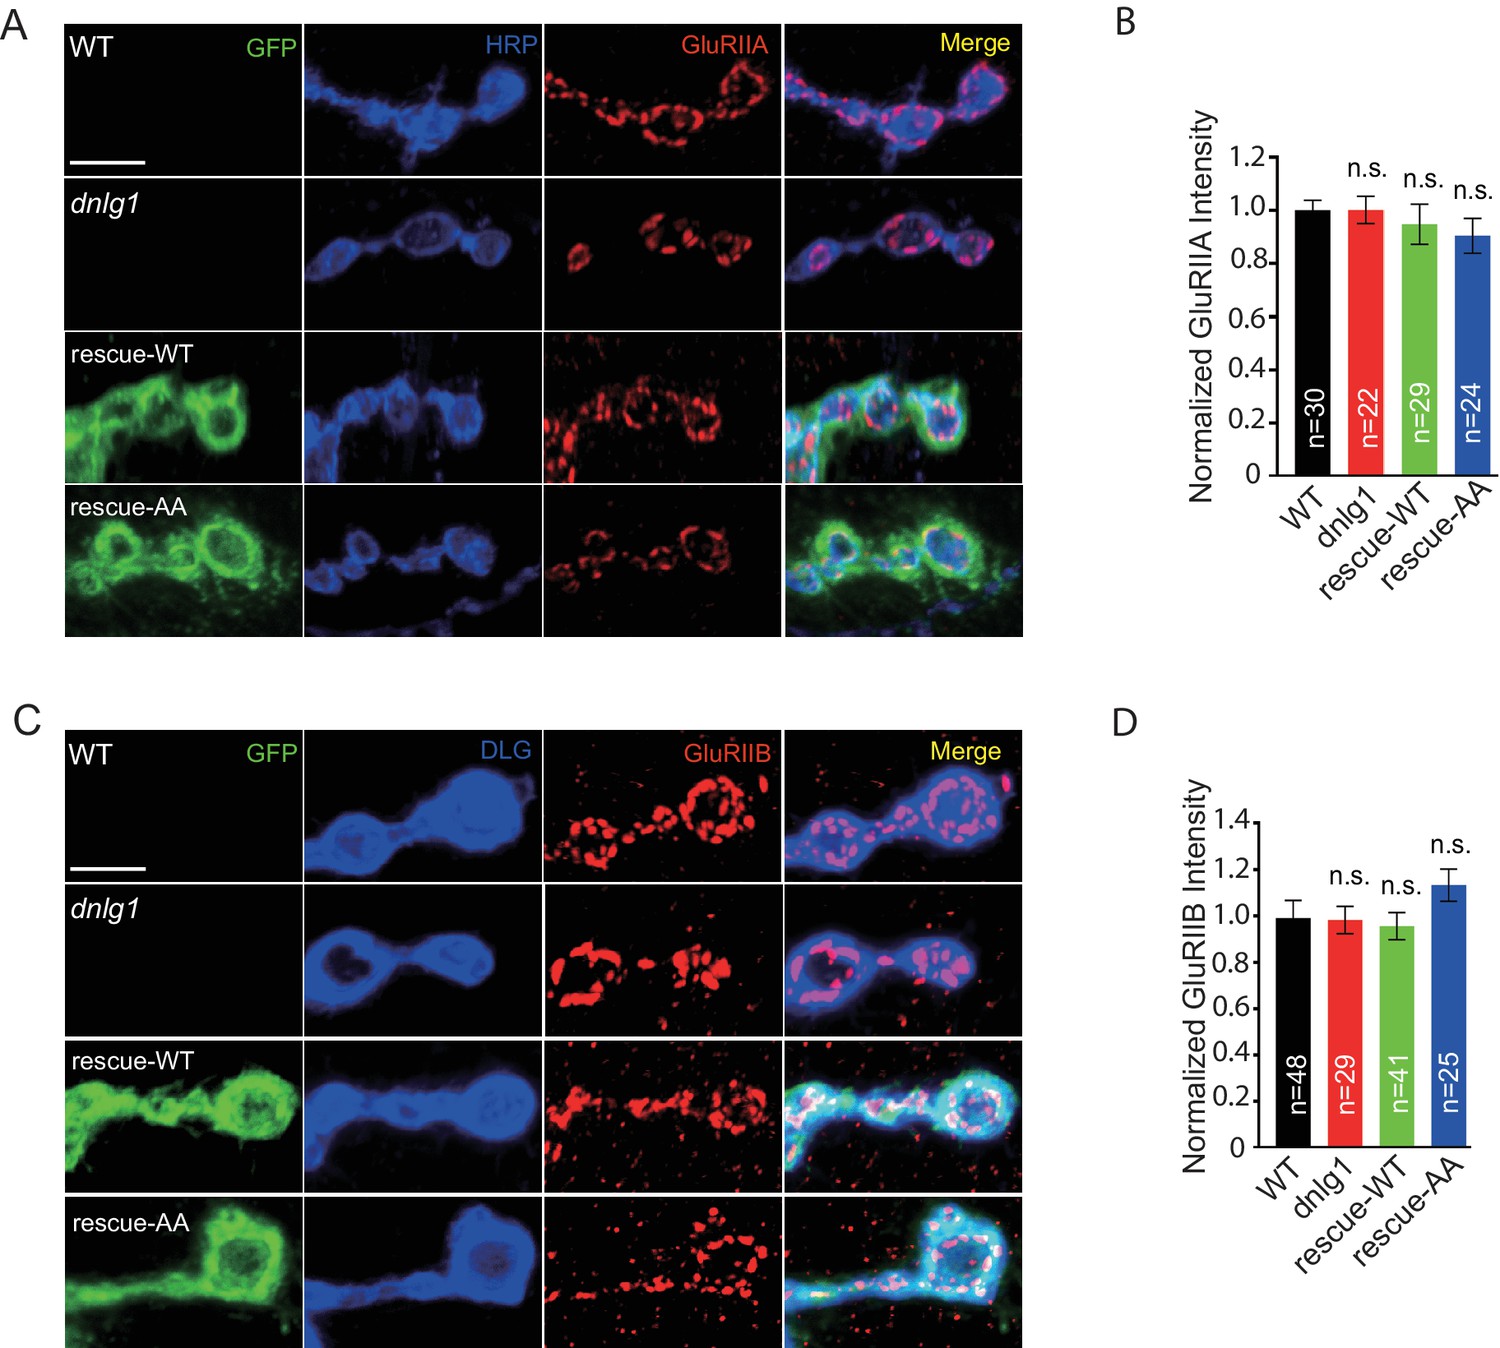
Protein levels of GluRIIA and GluRIIB appear normal in dnlg1 mutants and rescue lines.
(A) Confocal images of third instar larvae NMJ type Ib boutons at muscle four labeled with anti-GluRIIA (red) and presynaptic marker HRP (blue) to compare the GluRIIA intensity in four Drosophila lines: WT, dnlg1(dnlg1ex1.9/ex2.3), rescue-WT (Mef2-Gal4/+; dnlg1ex1.9/dnlg1ex2.3, UAS-DNlg1-EGFP), and rescue-AA (Mef2-Gal4/+; dnlg1ex1.9/dnlg1ex2.3, UAS-DNlg1SF-AA-EGFP). (B) Quantitative analysis of GluRIIA intensity in (A). (C) Confocal images of WT, dnlg1 mutant, rescue-WT, and rescue-AA third instar larvae NMJ type Ib boutons at muscle four labeled with anti-GluRIIB (red) and postsynaptic marker anti-DLG (blue) to compare the GluRIIB intensity. (D) Quantitative analysis of the GluRIIB intensity in (C). The data in (B) and (D) are shown as the mean ± SEM; n represents the number of boutons analyzed; n.s., not significant. Scale bars (A, C): 5μm.
-
Figure 6—figure supplement 1—source data 1
Sample size (n), mean, SEM, one-way ANOVA (and nonparametric) with Tukey's multiple comparisons test are presented for the data in Figure 6—figure supplement 1B and D.
- https://doi.org/10.7554/eLife.30457.021
Figure 7

Ectopic expression of DNlg1 at type II boutons is sufficient to induce new F-actin assembly.
(A–C) Confocal images of (A) WT, (B) Mef2 >DNlg1 EGFP (Mef2-Gal4/+; UAS-DNlg1-EGFP/+), and (C) Mef2 >DNlg1SF-AA-EGFP (Mef2-Gal4/+; UAS-DNlg1SF-AA-EGFP/+) third instar larvae NMJ type II boutons at muscles 12/13 labeled with phalloidin (red) and anti-HRP (blue). High-magnification images in A’, B’, and C’ correspond to the view in the dotted rectangles in A, B, and C. The green fluorescence signal indicates the expression of the EGFP protein. The expression of DNlg1-EGFP at the postsynaptic site of type II boutons induced the formation of new F-actin at type II boutons, whereas the expression of DNlg1SF-AA -EGFP failed to do so. Yellow wedges in Figure A3 indicate type I bouton, and pink wedges indicate type II boutons. Dotted lines indicate the regions analyzed in (D–F), and the directions are indicated by white arrows. (D–F) Line profile analyses showing that WT DNlg1, but not DNlg1SF-AA, induced the formation of F-actin and led to the co-localization of DNlg1 and F-actin at type II boutons. (G) The ratio of F-actin intensity at type II boutons to that of adjacent background was calculated to indicate the recruitment of F-actin at type II boutons by DNlg1. A summary graph shows that WT DNlg1, but not DNlg1SF-AA, induced the recruitment of F-actin to type II boutons. The data in (G) are shown as the mean ± SEM; n represents the number of boutons analyzed; asterisks indicate significant differences between the WT and the indicated genotypes. ***p<0.001; n.s., not significant. Hashes indicate significant differences between two indicated genotypes. ###p<0.001. Scale bars: (A–C) 20 μm, (A’–C’) 10 μm. A.U., artificial unit.
-
Figure 7—source data 1
Sample size (n), mean, SEM, and one-way ANOVA (and nonparametric) with Tukey's multiple comparisons test are presented for the data in Figure 7G.
- https://doi.org/10.7554/eLife.30457.023
Figure 8
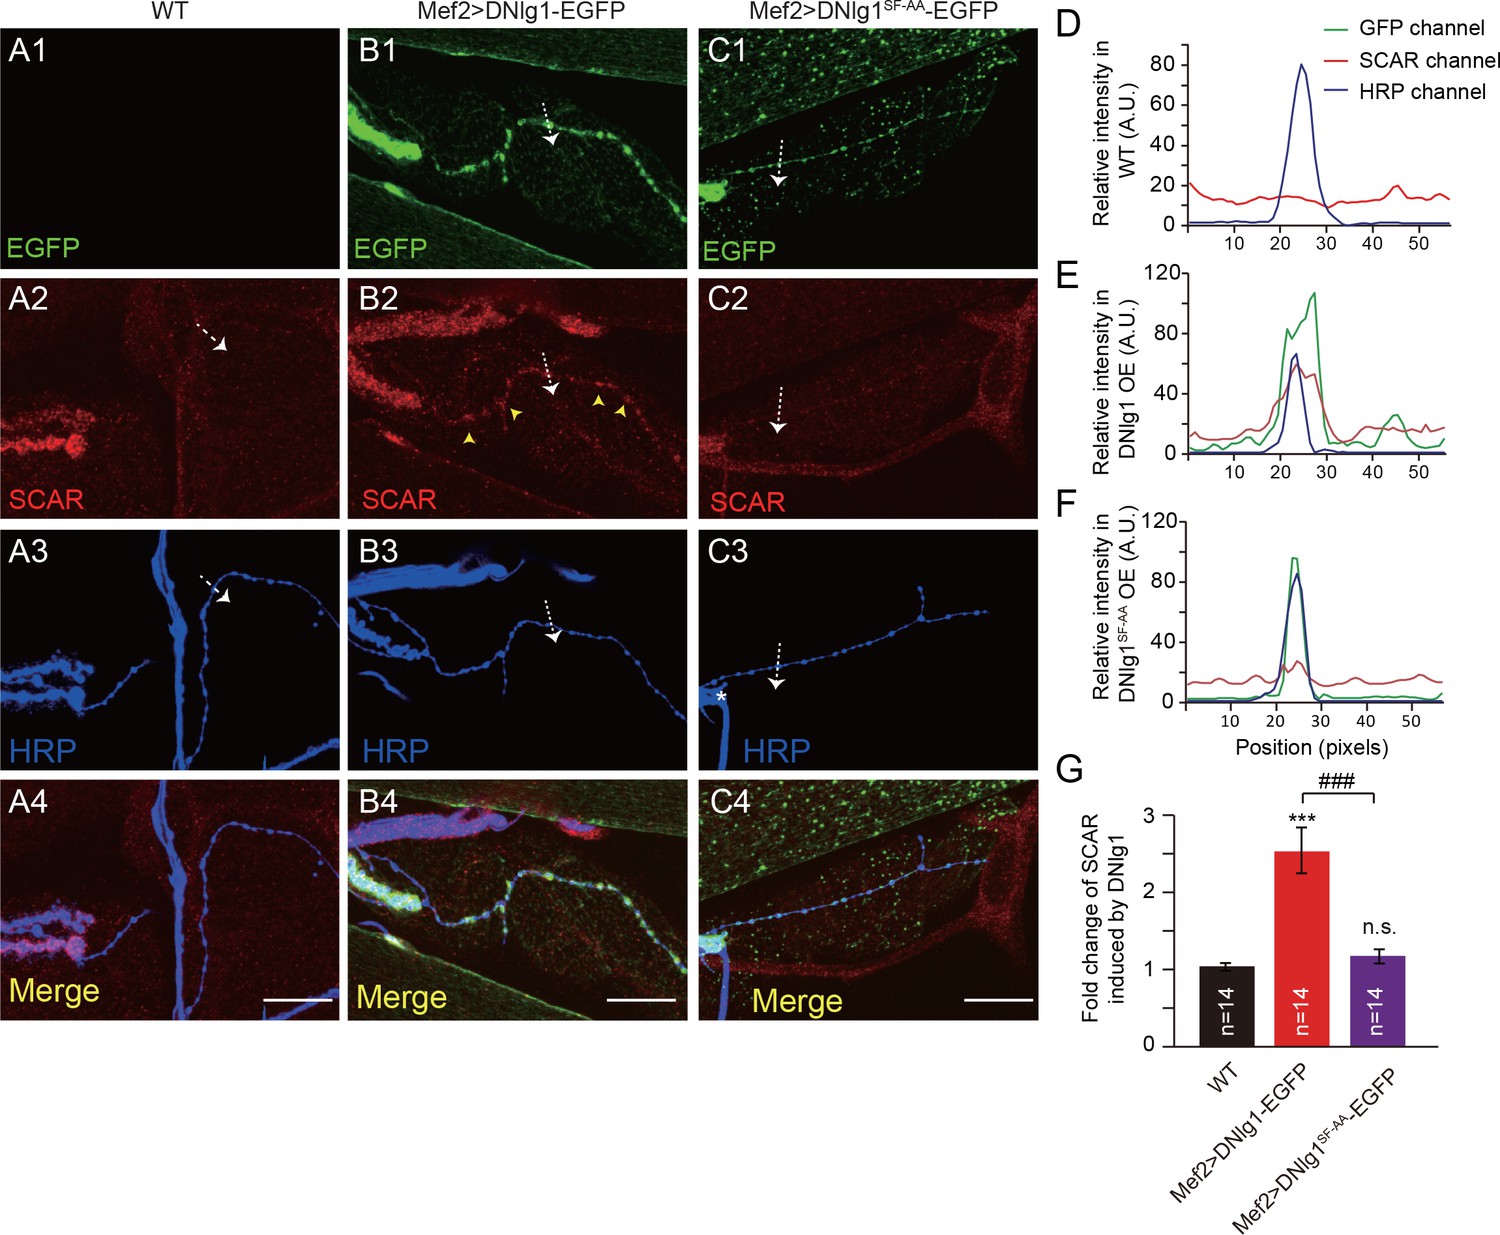
Ectopic expression of DNlg1 is sufficient to recruit WRC to type II boutons.
(A–C) Confocal images of (A) WT, (B) Mef2 >DNlg1 EGFP (Mef2-Gal4/+; UAS-DNlg1-EGFP/+), and (C) Mef2>DNlg1SF-AA -EGFP (Mef2-Gal4/+; UAS-DNlg1SF-AA-EGFP/+) third instar larvae NMJ at muscles 12/13 labeled with anti-SCAR (red) and anti-HRP (blue). The green fluorescence signal indicates the expression of the EGFP protein. The expression of DNlg1-EGFP at the postsynaptic site of type II boutons induced clusters of SCAR (yellow arrow heads in B2), whereas that of DNlg1SF-AA -EGFP did not. Dotted lines indicate the regions analyzed in (D–F), and the direction is marked by an white arrows. (D–F) Line profile analyses show that WT DNlg1, but not DNlg1SF-AA, induced SCAR clusters and co-localization of DNlg1 and SCAR at type II boutons. (G) Quantification of SCAR intensity at type II boutons relative to that in the adjacent background. The data in (G) are shown as mean ± SEM; n represents the number of boutons; asterisks indicate significant differences between the WT and the indicated genotypes. ***p<0.001; n.s., not significant. Hashes indicate significant differences between two indicated genotypes. ###p<0.001. Scale bars: (A–C) 20 μm. A.U., artificial unit. Figure supplements (5).
-
Figure 8—source data 1
Sample size (n), mean, SEM, and one-way ANOVA (and nonparametric) with Tukey's multiple comparisons test are presented for the data in Figure 8G.
- https://doi.org/10.7554/eLife.30457.025
Tables
Key resources table
| Reagent type (species) or resource | Designation | Source or reference | Identifiers | Additional information |
|---|---|---|---|---|
| genetic reagent (D. melanogaster) | dnlg1ex1.9 | PMID: 20547130 | ||
| genetic reagent (D. melanogaster) | dnlg1ex2.3 | PMID: 20547130 | ||
| genetic reagent (D. melanogaster) | dnlg2KO70 | PMID: 21228178 | ||
| genetic reagent (D. melanogaster) | dnlg2KO17 | PMID: 21228178 | ||
| genetic reagent (D. melanogaster) | dnrx83 | PMID: 23352167; PMID: 17498701 | ||
| genetic reagent (D. melanogaster) | dnrx174 | PMID: 23352167; PMID: 17498701 | ||
| genetic reagent (D. melanogaster) | UAS-DNrx | PMID: 23352167; PMID: 17498701 | ||
| genetic reagent (D. melanogaster) | UAS-SCAR RNAi | Center of Biomedical Analysis, Tsinghua University | TH: 02179 .N; RRID: BDSC_51803 | |
| genetic reagent (D. melanogaster) | UAS-DNlg1 | lab generated; this paper | ||
| genetic reagent (D. melanogaster) | UAS-DNlg1SF-AA | lab generated; this paper | ||
| genetic reagent (D. melanogaster) | UAS-DNlg1-EGFP | lab generated; this paper | ||
| genetic reagent (D. melanogaster) | UAS-DNlg1SF-AA-EGFP | lab generated; this paper | ||
| genetic reagent (D. melanogaster) | OK6-Gal4 | Bloomington Drosophila Stock center | BDSC: 64199 | |
| genetic reagent (D. melanogaster) | Elav-Gal4 | Bloomington Drosophila Stock center | BDSC: 458 | |
| genetic reagent (D. melanogaster) | C57-Gal4 | PMID: 8893021 | ||
| genetic reagent (D. melanogaster) | 24B-Gal4 | Kyoto Stock center | DGGR:106496 | |
| genetic reagent (D. melanogaster) | Mef2-Gal4 | Bloomington Drosophila Stock center | BDSC: 27390 | |
| cell line (D. melanogaster) | S2 | China Center for Type Culture Collection, CCTCC | GDC138; RRID:CVCL_Z992 | Improved STR profiling Mycoplasma contamination test: negative |
| antibody | Mouse anti-α-Spectrin | Developmental Studies Hybridoma Bank | DSHB: 3A9; RRID: AB_528473 | 1:50 for IHC |
| antibody | anti-DLG | Developmental Studies Hybridoma Bank | DSHB:4F3; RRID: AB_528203 | 1:50 for IHC |
| antibody | anti-Brp | Developmental Studies Hybridoma Bank | DSHB:nc82;RRID:AB_2314866 | 1:50 for IHC |
| antibody | anti-SCAR | Developmental Studies Hybridoma Bank | DSHB: P1C1-SCAR; RRID:AB_2618386 | 1:50 for IHC, 1:200 forwestern blotting |
| antibody | rabbit anti-HRP | Jackson ImmunoResearch | Jackson ImmunoResearch: 323-005-021 RRID: AB_2314648 | 1:1000 for IHC |
| antibody | Goat anti-HRP | Jackson ImmunoResearch | Jackson ImmunoResearch: 123-005-021 RRID: AB_2338952 | 1:1000 for IHC |
| antibody | Mouse anti-Tubulin | Sigma | Sigma: Clone DM1A; RRID:AB_477593 | 1:10000 for western blotting |
| antibody | Alexa 488-, 555-, or 637- secondaries | Molecular Probes | ||
| Other | Texas Red-conjugated Phalloidin | Molecular Probes | ThermoFisher: T7471 | 1:6 for IHC |
Additional files
-
Transparent reporting form
- https://doi.org/10.7554/eLife.30457.026
Download links
A two-part list of links to download the article, or parts of the article, in various formats.
Downloads (link to download the article as PDF)
Open citations (links to open the citations from this article in various online reference manager services)
Cite this article (links to download the citations from this article in formats compatible with various reference manager tools)
Neurexin–Neuroligin 1 regulates synaptic morphology and functions via the WAVE regulatory complex in Drosophila neuromuscular junction
eLife 7:e30457.
https://doi.org/10.7554/eLife.30457


