Single-molecule force spectroscopy of protein-membrane interactions
- Yale University School of Medicine, United States
- Institute of Physics, Chinese Academy of Sciences, China
- Howard Hughes Medical Institute, Yale University School of Medicine, United States
- China Jiliang University, China
- Yale University, United States
- Columbia University, United States
- Kavli Institute for Neuroscience, Yale University School of Medicine, United States
- Centre National de la Recherche Scientifique (CNRS) UMR 8250, Université Paris Descartes, France
Figures
Figure 1 with 7 supplements
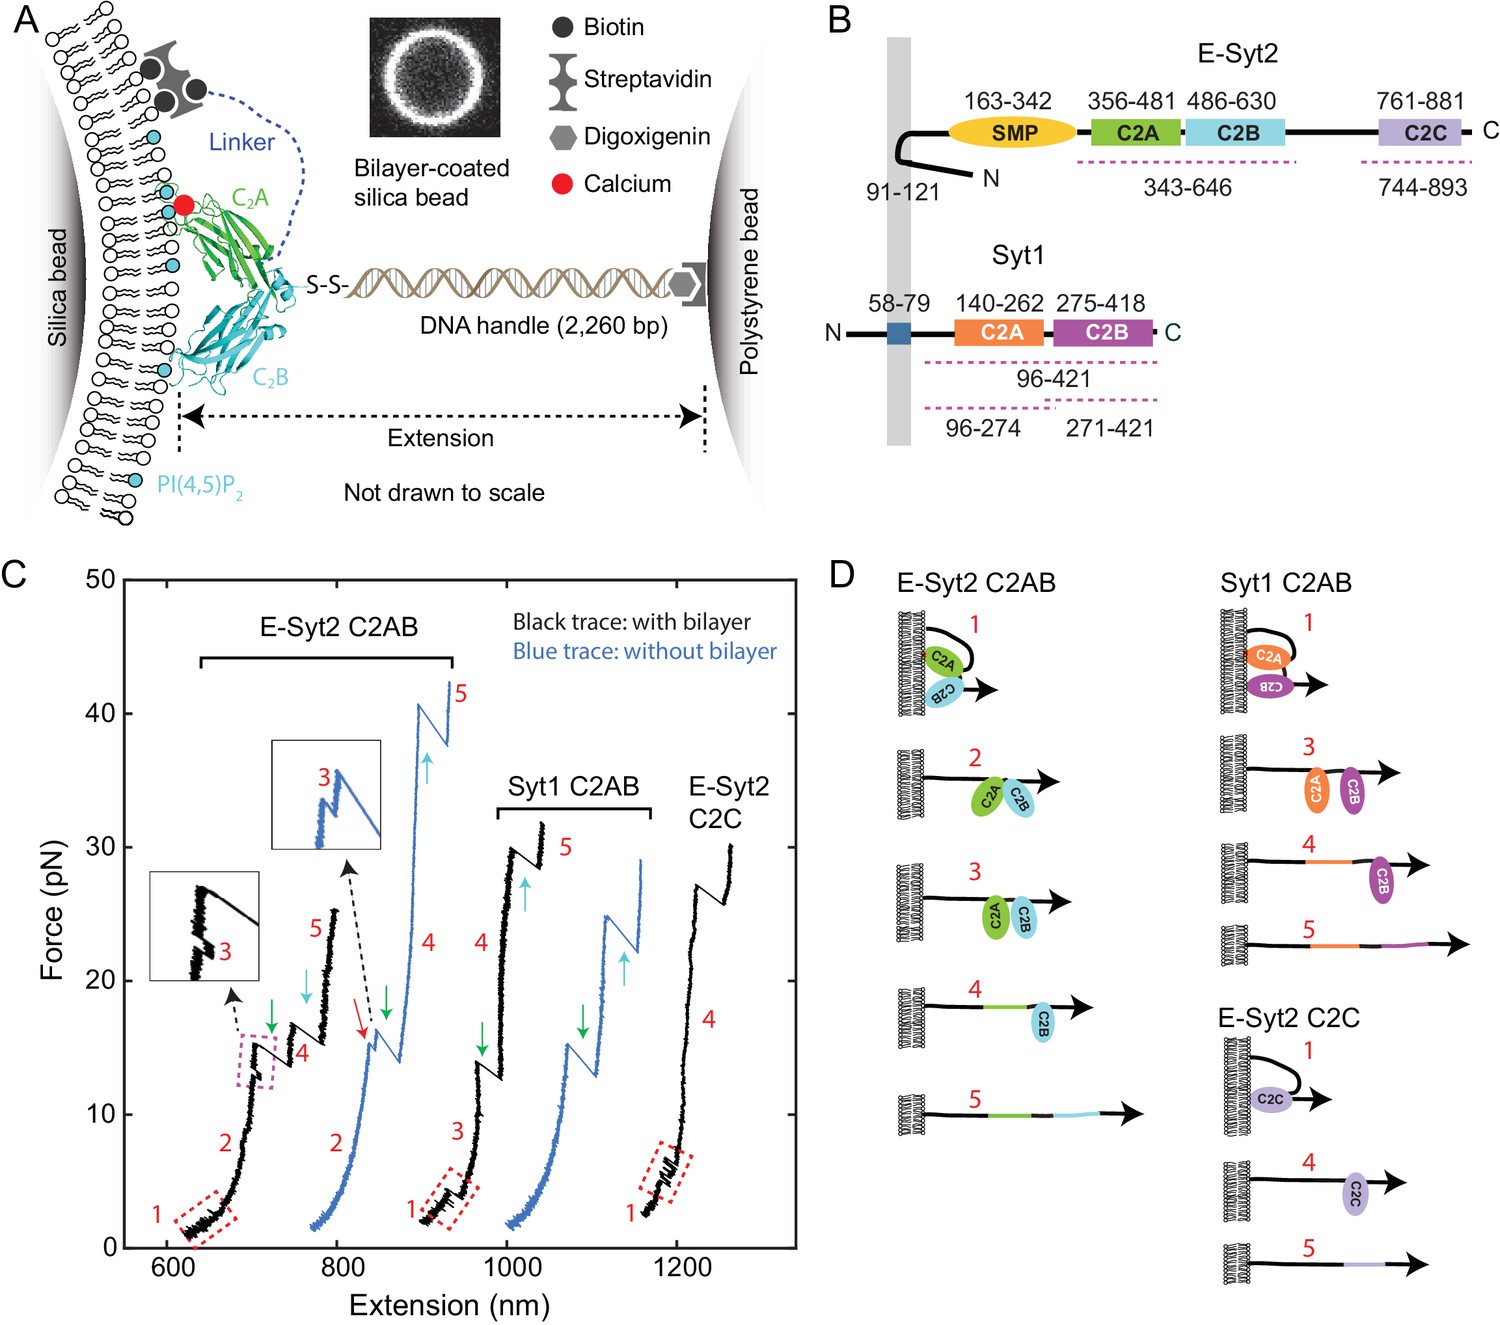
Experimental setup to study membrane binding and unfolding of C2 domains and interactions between C2 domains.
(A) Schematic diagram of the experimental setup to pull a single C2 domain (E-Syt2 C2AB shown) anchored on a lipid bilayer supported on a silica bead. The inset shows the fluorescence image of the bilayer on a silica bead of 5 µm in diameter. (B) Domain diagrams of Syt1 and E-Syt2. The dashed lines mark the truncated domains used in this study. (C) Force-extension curves (FECs) obtained by pulling C2 domains in the presence of supported bilayers (black) or in its absence (blue). Red-dashed rectangles mark reversible membrane binding and unbinding, while the cyan dashed rectangle indicates reversible C2AB association and dissociation. Green and cyan arrows mark unfolding of C2A and C2B domains, respectively. The insets show the transient state 3. Throughout the text, the FECs were mean-filtered to 100 Hz and shown. The E-Syt2 C2AB was pulled in the presence of membranes composed of 75% POPC, 20% DOPS, 5% PI(4,5)P2, and 0.03% biotin-PEG-DSPE. E-Syt2 C2C and Syt1 C2AB were tested on membranes with a similar composition, except for a decrease in DOPS to 10% and a corresponding increase in POPC to 85%. The solution contained 25 mM HEPES (pH 7.4), 200 mM NaCl, and 100 µM Ca2+ for E-Syt2 C2AB and Syt1 C2AB or no Ca2+ for E-Syt2 C2C. (D) Diagram of different C2 domain states derived from the FECs: 1, membrane-bound state; 2, unbound state with two associated C2 domains; 3, unbound state with two dissociated C2 domains; 4, state with a single folded C2 domain; 5, fully unfolded state.
Figure 1—figure supplement 1
Procedures to make membrane-coated silica beads.
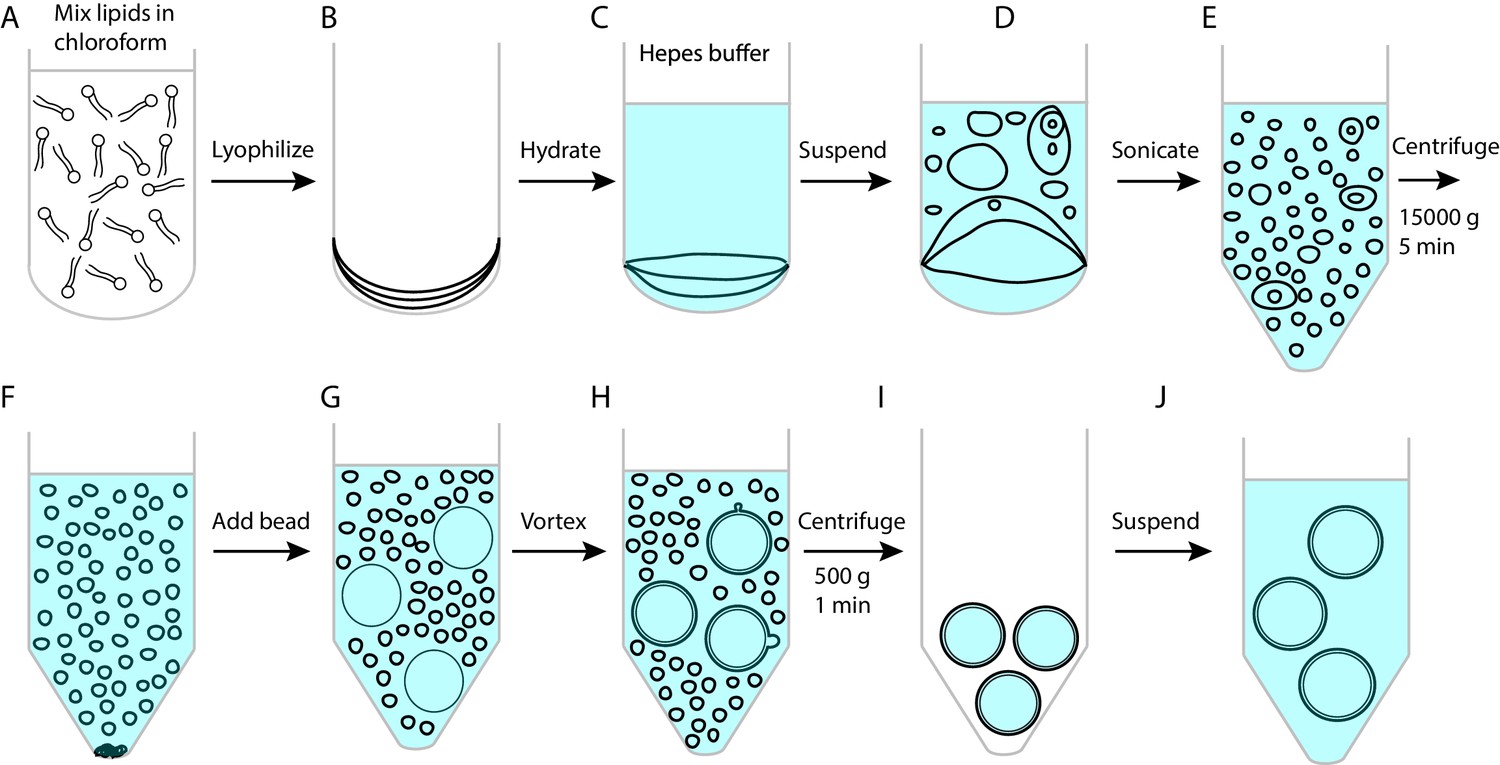
(A) Mix a total of 250 nmol lipids in 45 μL chloroform in a 15 mL glass tube. (B) Dry lipids under a nitrogen flow followed by lyophilization for 1 hr. (C) Hydrate dried lipids by adding 500 μL suspension buffer containing 25 mM HEPES, pH7.4, 200 mM NaCl. (D) Re-suspended lipids by pipetting up and down the solution. (E) Transfer the vesicle solution to an Eppendorf tube and sonicate the vesicle solution until the solution became clear. This step generates small unilamellar vesicles. (F) Centrifuge the vesicle solution at 15,000 g for 5 min to precipitate any large vesicles or lipid aggregates. Collect the small vesicles in the supernatant. (G) Add 70 μL silica beads with a diameter of 2.06 µm (Part number: SS04N, Bangs Laboratories, Inc, IN) into the vesicle solution. Vesicles spontaneously collapse on silica surfaces to form supported bilayers. (H) Vortex the beads at 1500 rpm in 37°C for 45 min to strip away excessive membranes from bead surfaces using Thermal Mixer C (Eppendorf). (I) Centrifuge the bead solution at 500 g and at room temperature for 1 min to precipitate the beads and then remove the excessive membranes in the supernatant. The membranes that cover the beads slightly shrank upon the temperature decrease (Petrache et al., 2000), which increased the tension of the membranes and their mechanical strength against the pulling force perpendicular to the membranes. (J) Add 1 mL suspension buffer and re-suspend the beads by pipetting the bead solution. Repeat the steps I and J twice to remove residual vesicles in the bead solution. All lipids were obtained from Avanti Polar Lipids (POPC: 850457P; DOPS: 840035P; Brain PI(4,5)P2: 840046X; DSPE-PEG(2000) Biotin: 880129P).
Figure 1—figure supplement 2
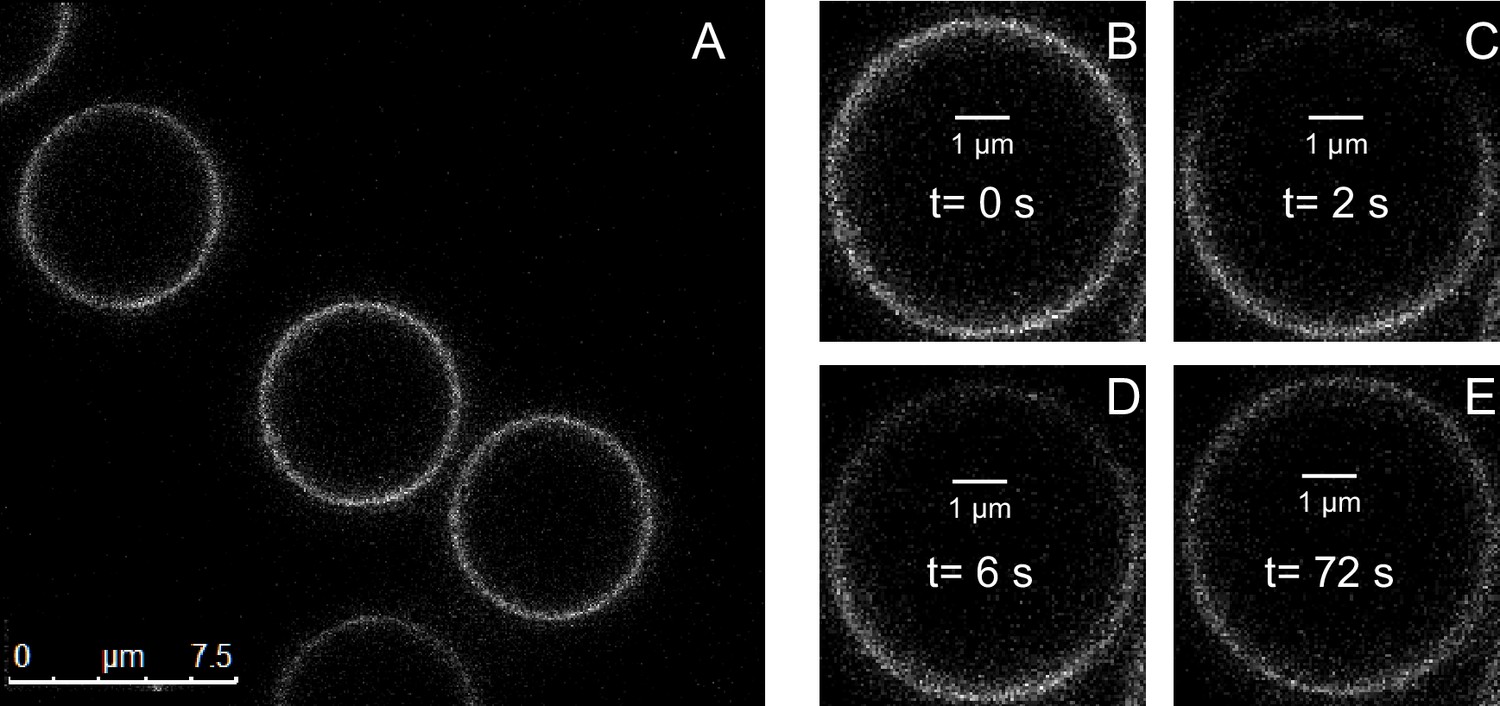
Lipid bilayers supported on silica beads are uniform and mobile.
(A) Confocal fluorescence images of bilayers containing 1% NBD-labeled PE lipids. (B–E) Fluorescence images of the same bilayer taken before photobleaching (B) and at the indicated time after photobleaching (C–E).
Figure 1—figure supplement 3
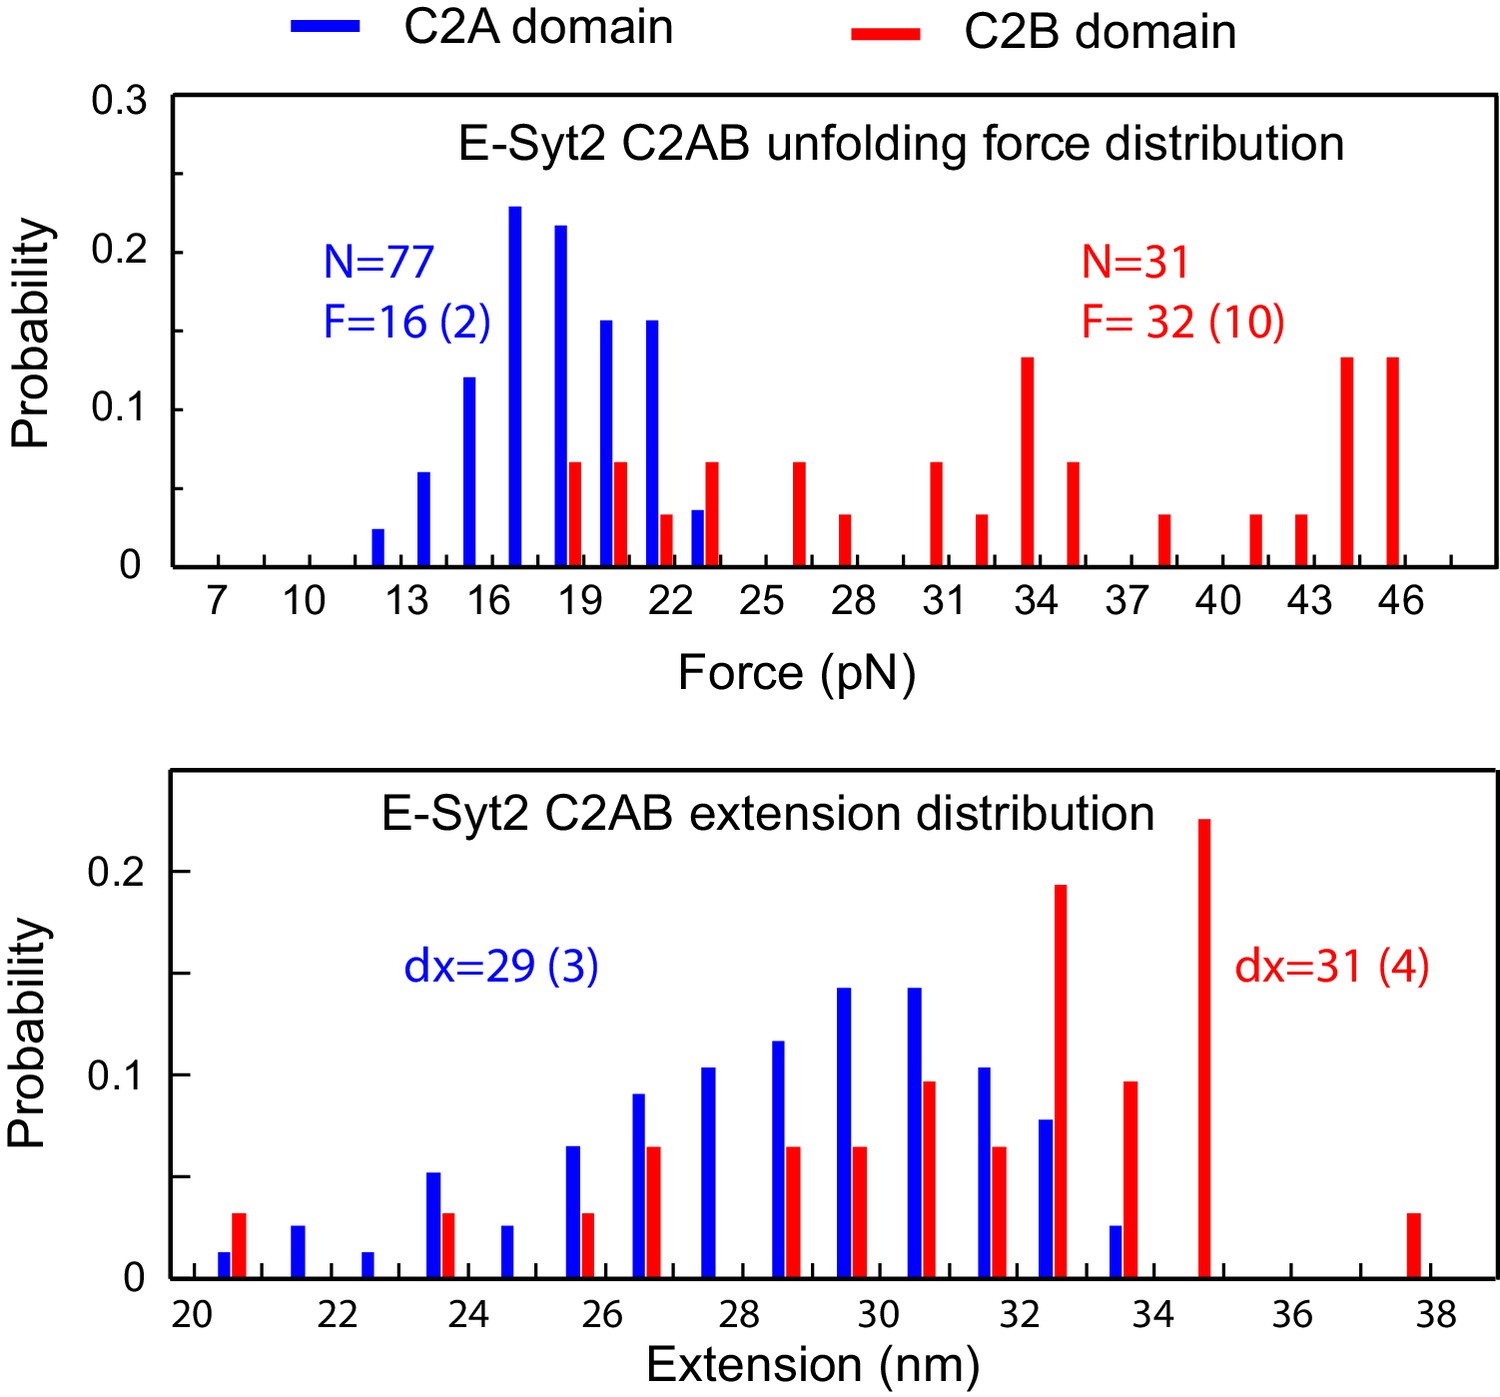
Histogram distributions of the unfolding forces (top panel) and extension increases (bottom panel) associated with E-Syt2 C2A and C2B unfolding.
The average unfolding force (F) and extension increase (dx) and the total number unfolding events measured (N) are indicated. The numbers in parenthesis represent the standard deviation.
Figure 1—figure supplement 4

Histogram distributions of the unfolding forces (top panel) and extension increases (bottom panel) associated with Syt1 C2A and C2B unfolding.
The average unfolding force (F) and extension increase (dx) and the total number of unfolding events measured (N) are indicated. The numbers in parenthesis represents the standard deviation.
Figure 1—figure supplement 5
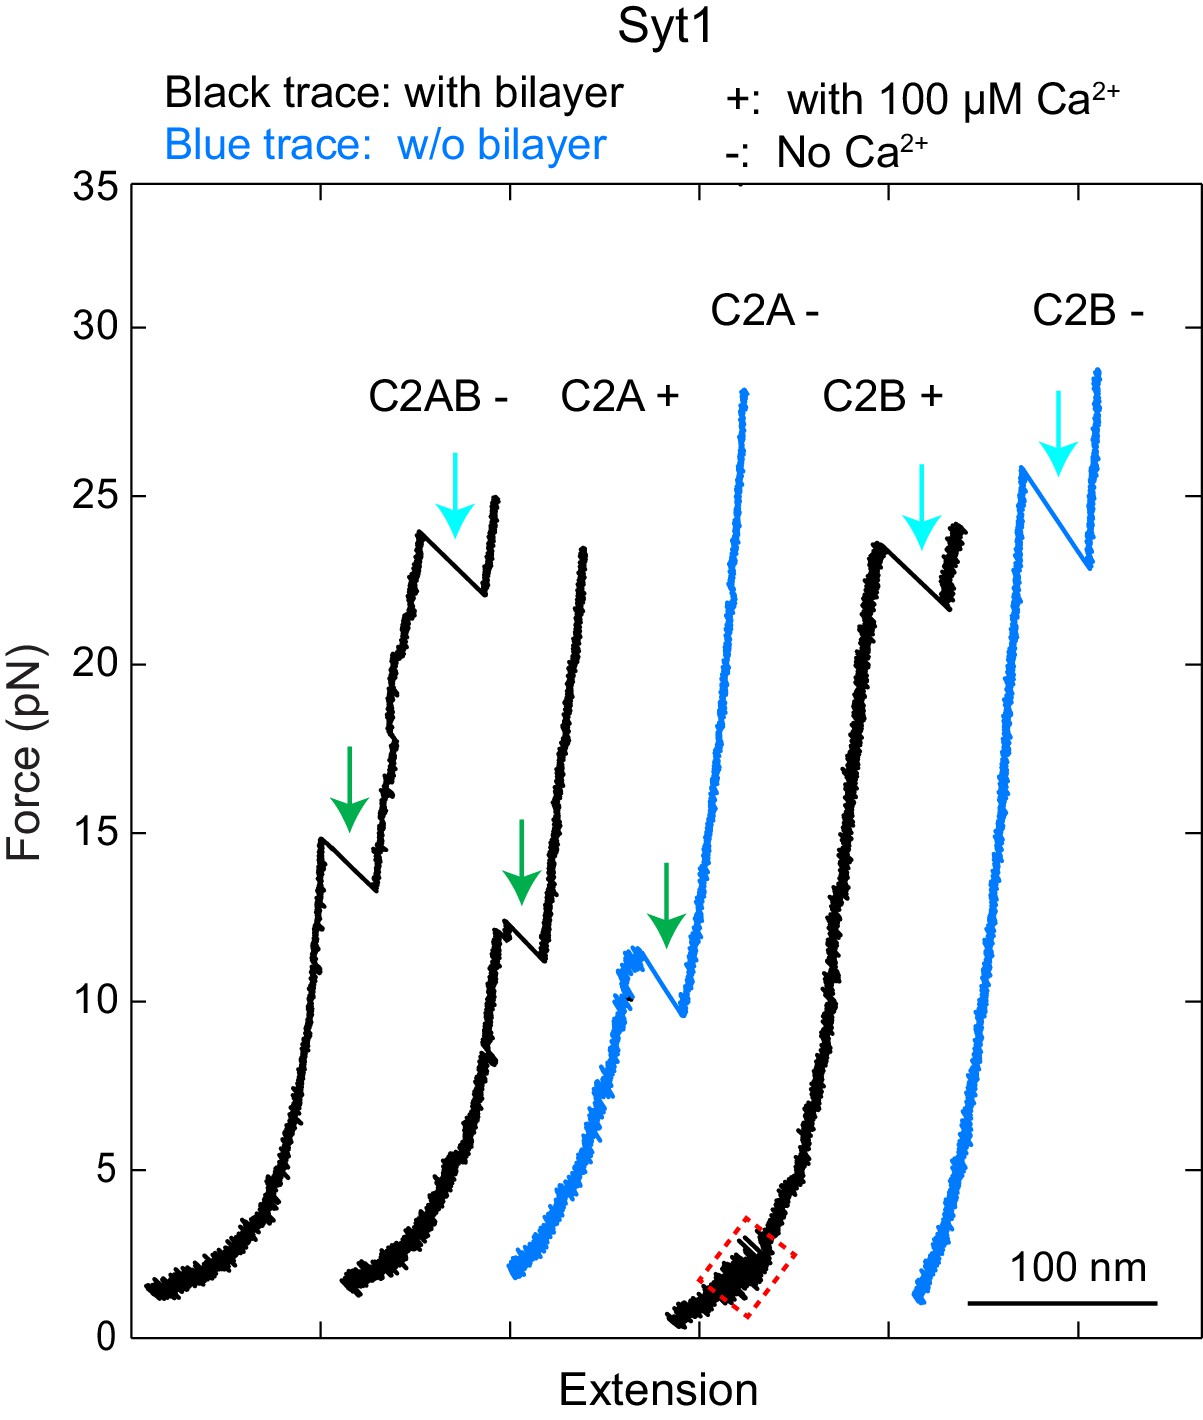
Force-extension curves (FECs) obtained by pulling Syt1 C2AB, C2A or C2B domain anchored on the supported bilayers (black) or on the streptavidin-coated beads without membranes (blue) in the presence (‘+') or absence of (‘-') of 100 µM Ca2+ in the solution.
Green and cyan arrows indicated unfolding of C2A and C2B domains, respectively. While the C2A alone barely bound to membranes in our assay, the C2B alone bound to membranes in a Ca2+- and PI(4,5)P2-dependent manner (region marked by magenta rectangle, and Figure 1—figure supplement 6).
Figure 1—figure supplement 6
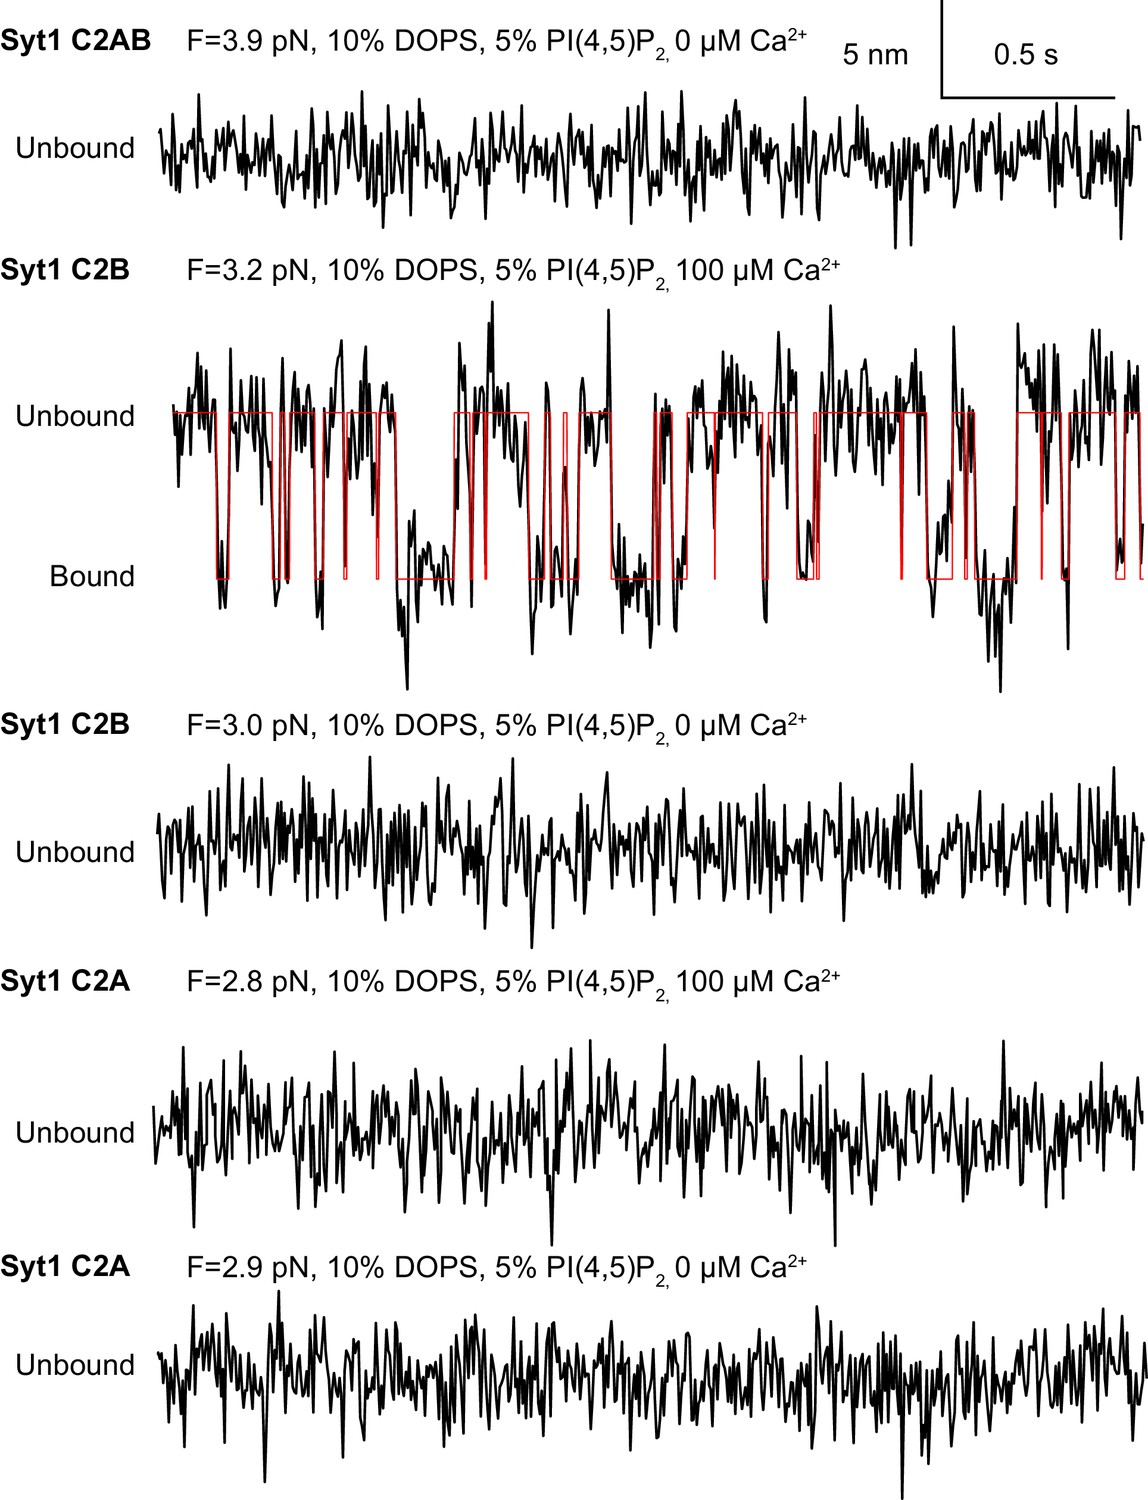
Extension-time trajectories (black) of Syt1 C2AB domain pair or individual C2A and C2B domains at the indicated constant mean forces and calcium concentrations and their idealized transition (red) derived from hidden-Markov modeling.
https://doi.org/10.7554/eLife.30493.008
Figure 1—figure supplement 7
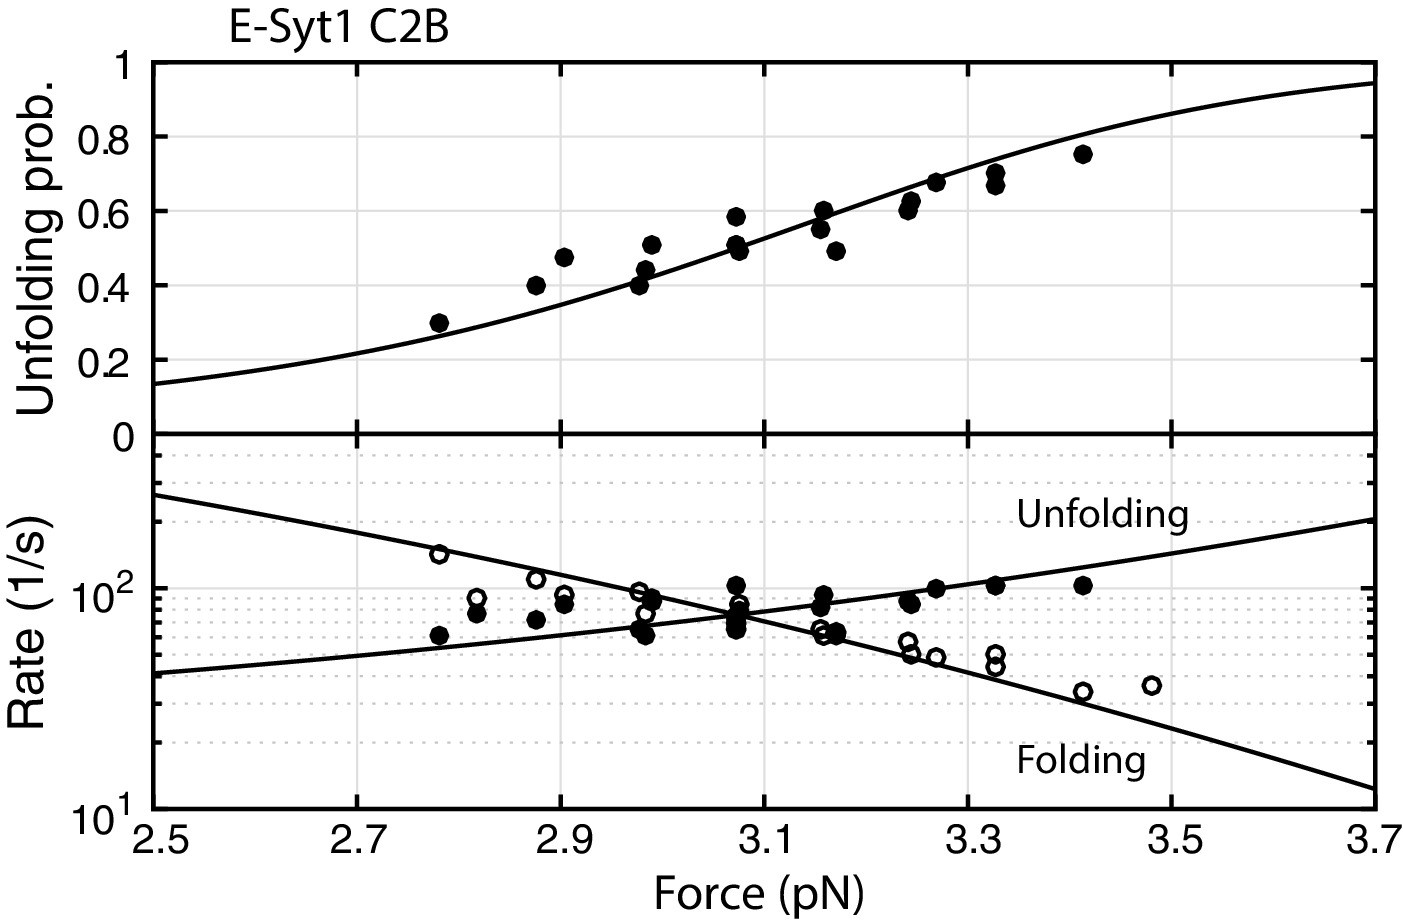
Force-dependent unbinding probabilities (top) and transition rates (bottom) of Syt1 C2B domain.
Unbinding probabilities and rates are indicated by solid symbols, while binding rates are shown by hollow symbols. Model fits (solid and dashed curves) of these measurements revealed the Syt1 C2B binding energy and kinetics (Table 1).
Figure 2
Force-dependent reversible membrane binding and unbinding of C2 domains.
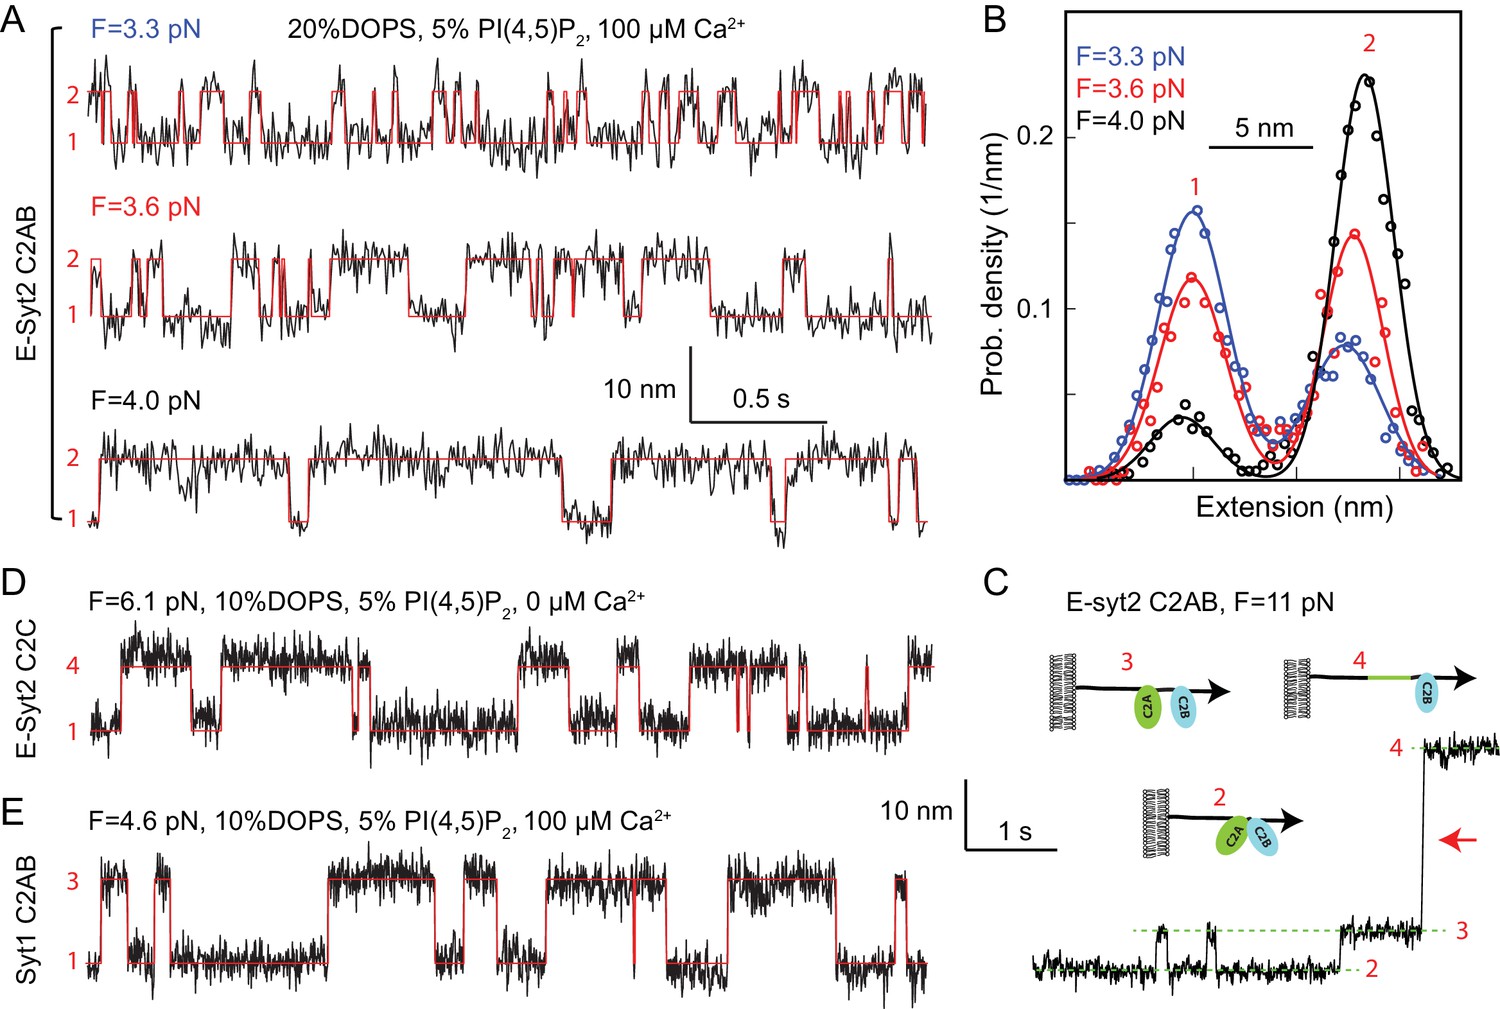
(A) Extension-time trajectories (black) of E-Syt2 C2AB at three indicated constant mean forces (F) and their idealized transitions (red) derived from hidden-Markov modeling (HMM). Positions of different states are marked by their corresponding state numbers as in Figure 1D. Throughout the text, the extension-time traces were mean-filtered to 200 Hz and shown. (B) Probability density distributions of the extensions (symbols) shown in A and their best-fits by a sum of two Gaussian functions (curves). (C) Extension-time trajectory at 11 pN force revealing reversible E-Syt2 C2AB domain dissociation and association before C2A unfolding (red arrow). Different states are marked by green dashed lines and depicted as insets. (D–E) Extension-time trajectories (black) of E-Syt2 C2C (D) and Syt1 (E) at constant forces. Note that the trajectories in C-E share the same extension and time scales.
Figure 3 with 1 supplement
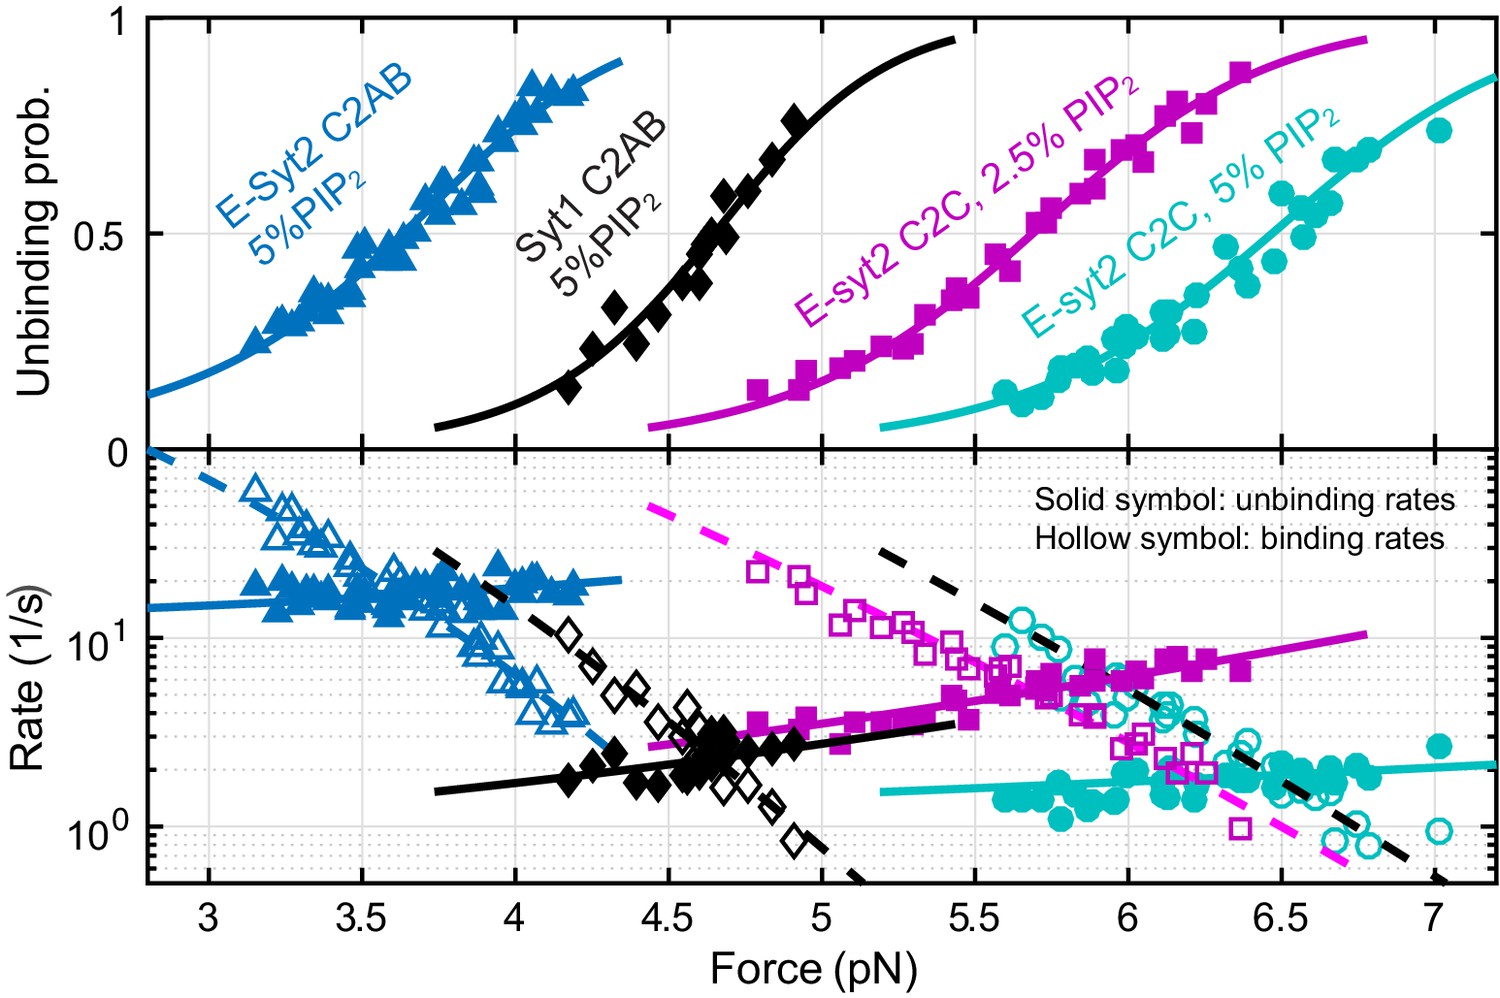
Force-dependent unbinding probabilities (top) and transition rates (bottom) and their best model fits (solid and dashed curves) reveal the energy and kinetics of C2 binding at zero force (Table 1).
Unbinding probabilities and rates are indicated by solid symbols, while binding rates are shown by hollow symbols.
Figure 3—figure supplement 1
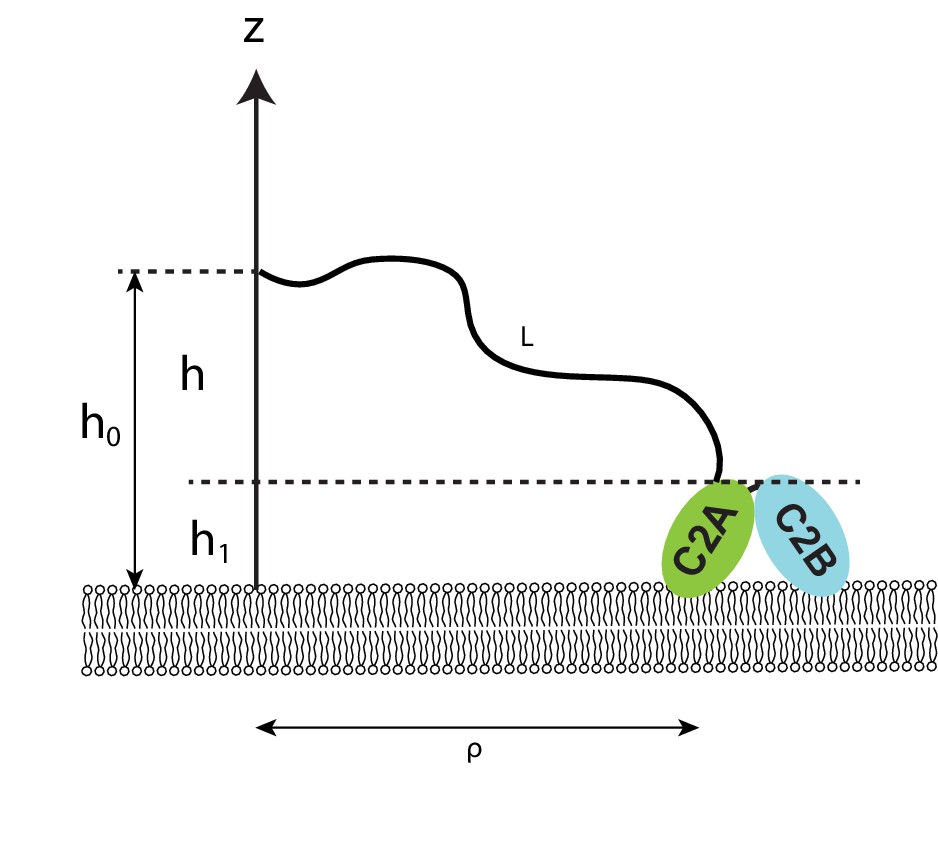
Diagram illustrating the effect of membrane tethering on protein binding to the membrane.
The protein, shown here as the E-Syt2 C2AB, is tethered on the membrane at a point h0 away from the membrane surface, via a flexible polypeptide linker with a contour length L. The other end of the linker is attached to the membrane-bound protein at a point h1 away from the membrane.
Figure 4 with 3 supplements
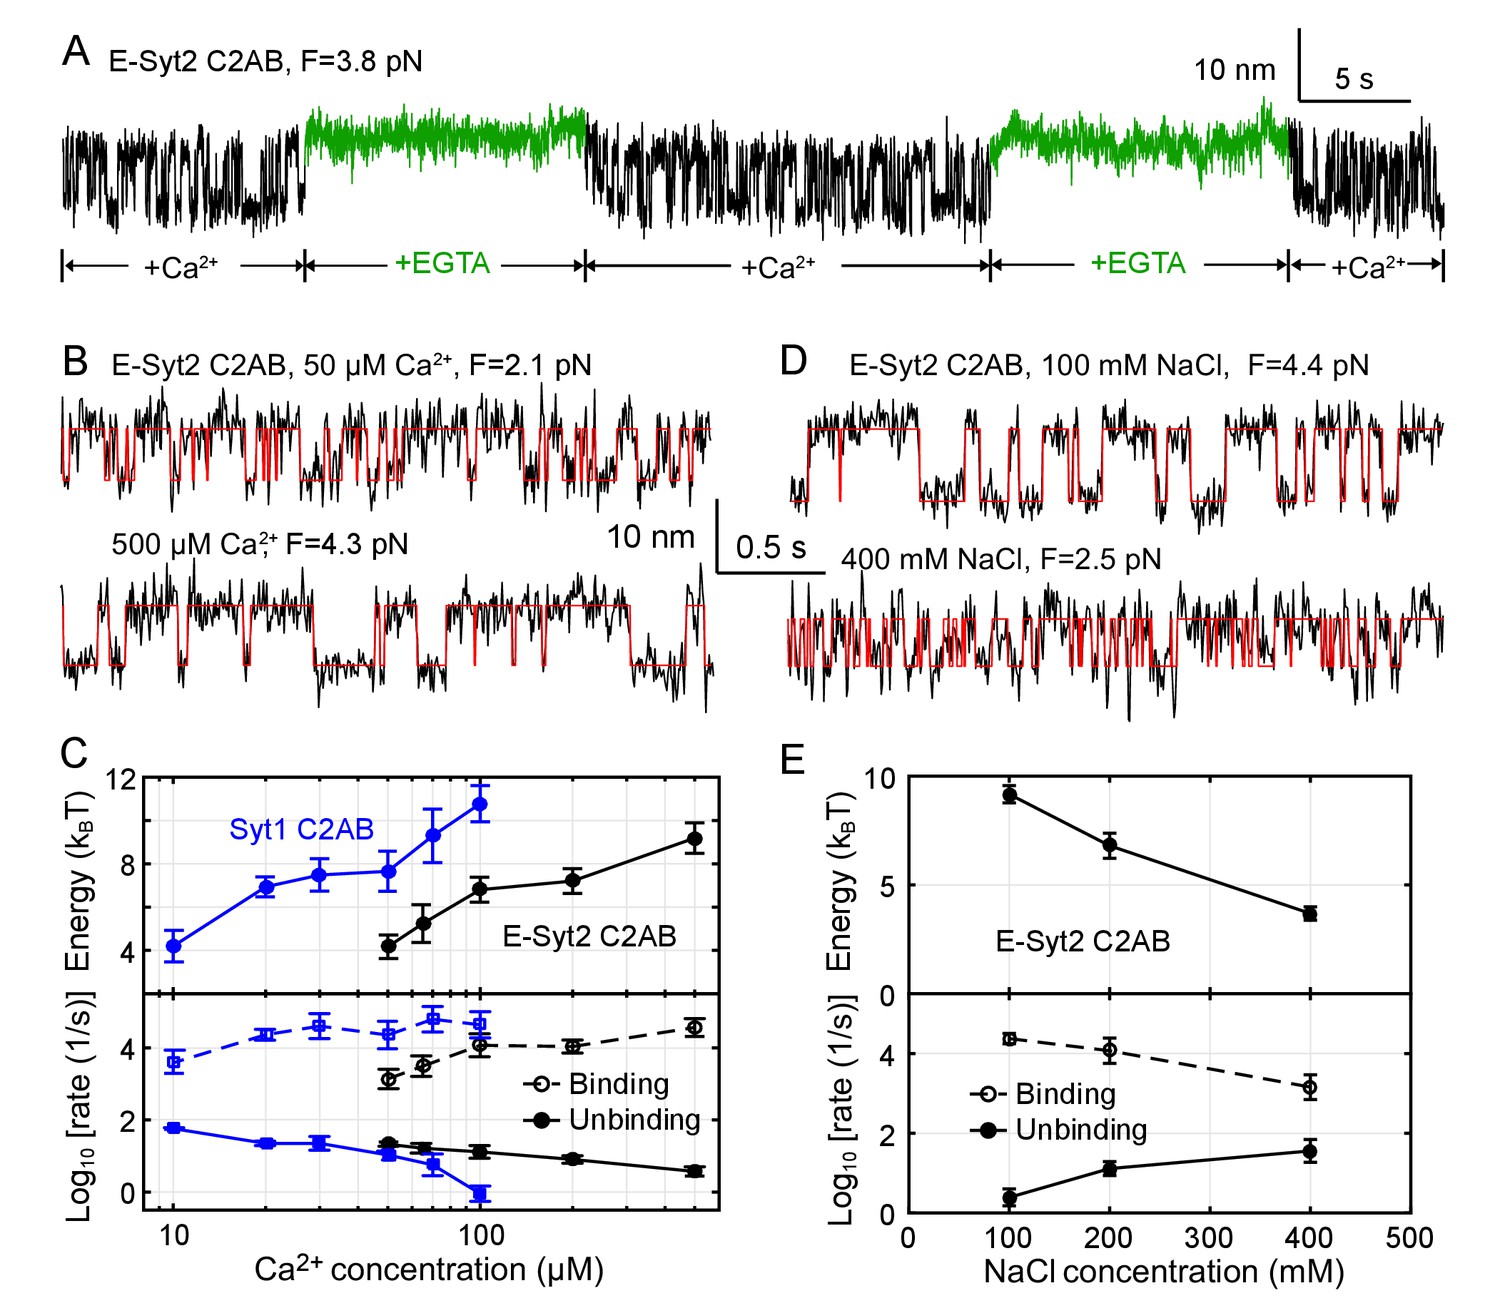
Membrane binding of E-Syt2 C2AB and Syt1 C2AB is sensitive to Ca2+ and ionic strength.
(A) Extension-time trajectories of a single E-Syt2 C2AB domain in the presence of flows of solutions containing either 100 µM Ca2+ (black) or 1 mM EGTA (green). (B, D) Extension-time trajectories (black) in different concentrations of Ca2+ (B) or NaCl (D) in the solution. Idealized transitions are shown in red lines. Same scales are used in both B and D. (C, E) Ca2+-dependent (C) or NaCl-dependent (E) Esyt2-C2AB (black) or Syt1 (blue) binding energy (top) and binding and unbinding rates (bottom).
Figure 4—figure supplement 1
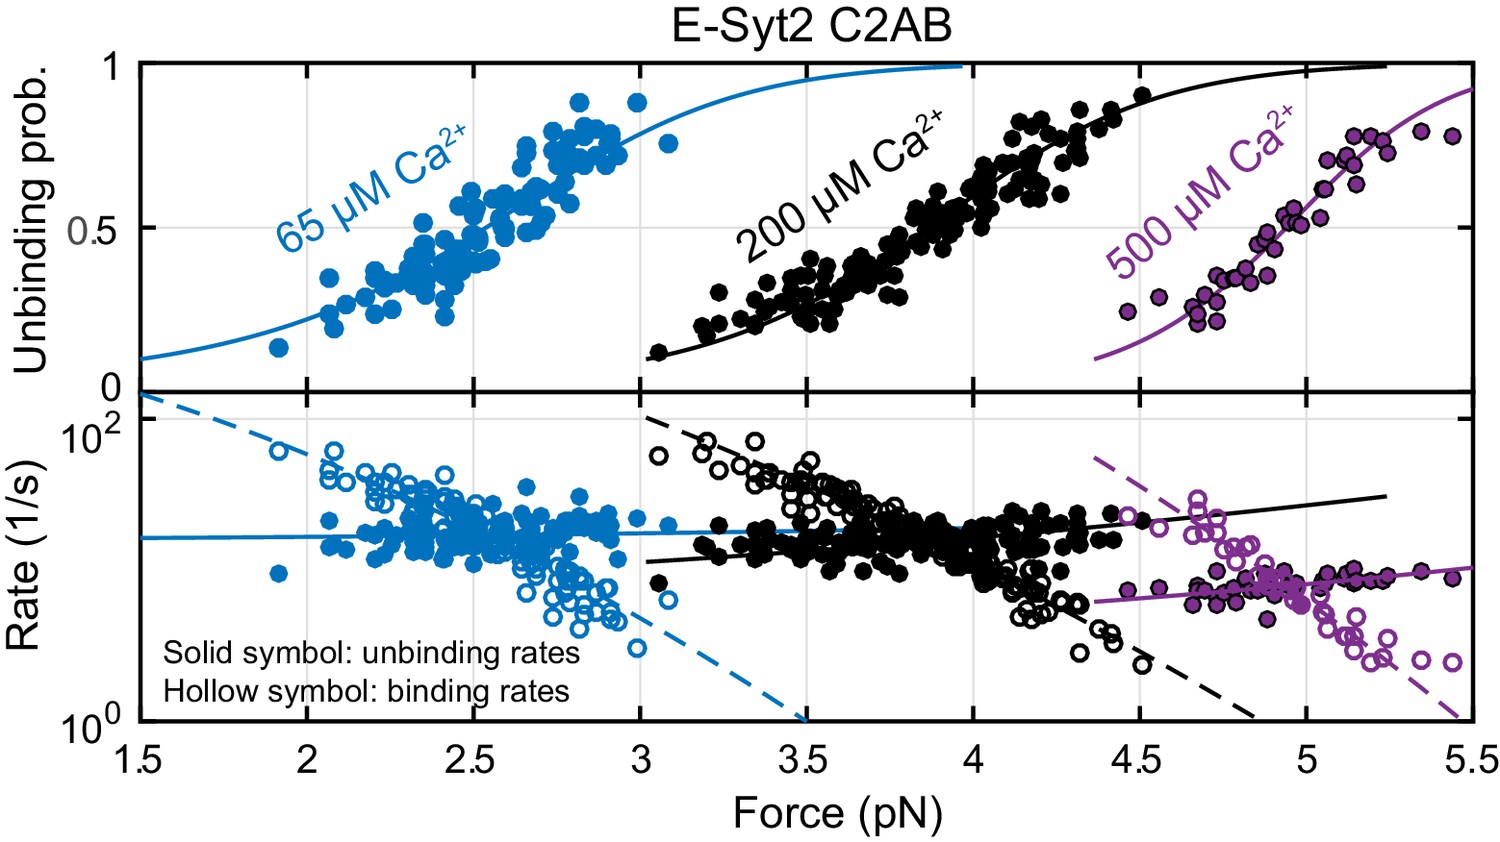
Force-dependent unbinding probabilities (top) and transition rates (bottom) of E-Syt2 C2AB measured at 65 µM (blue), 200 µM (black), and 500 µM (purple) Ca2+ concentrations.
Unbinding probabilities and rates are indicated by solid symbols, while binding rates are shown by hollow symbols. Model fits (solid and dashed curves) of these measurements revealed Ca2+-dependent E-Syt2 C2AB binding energy and kinetics (Figure 4C).
Figure 4—figure supplement 2
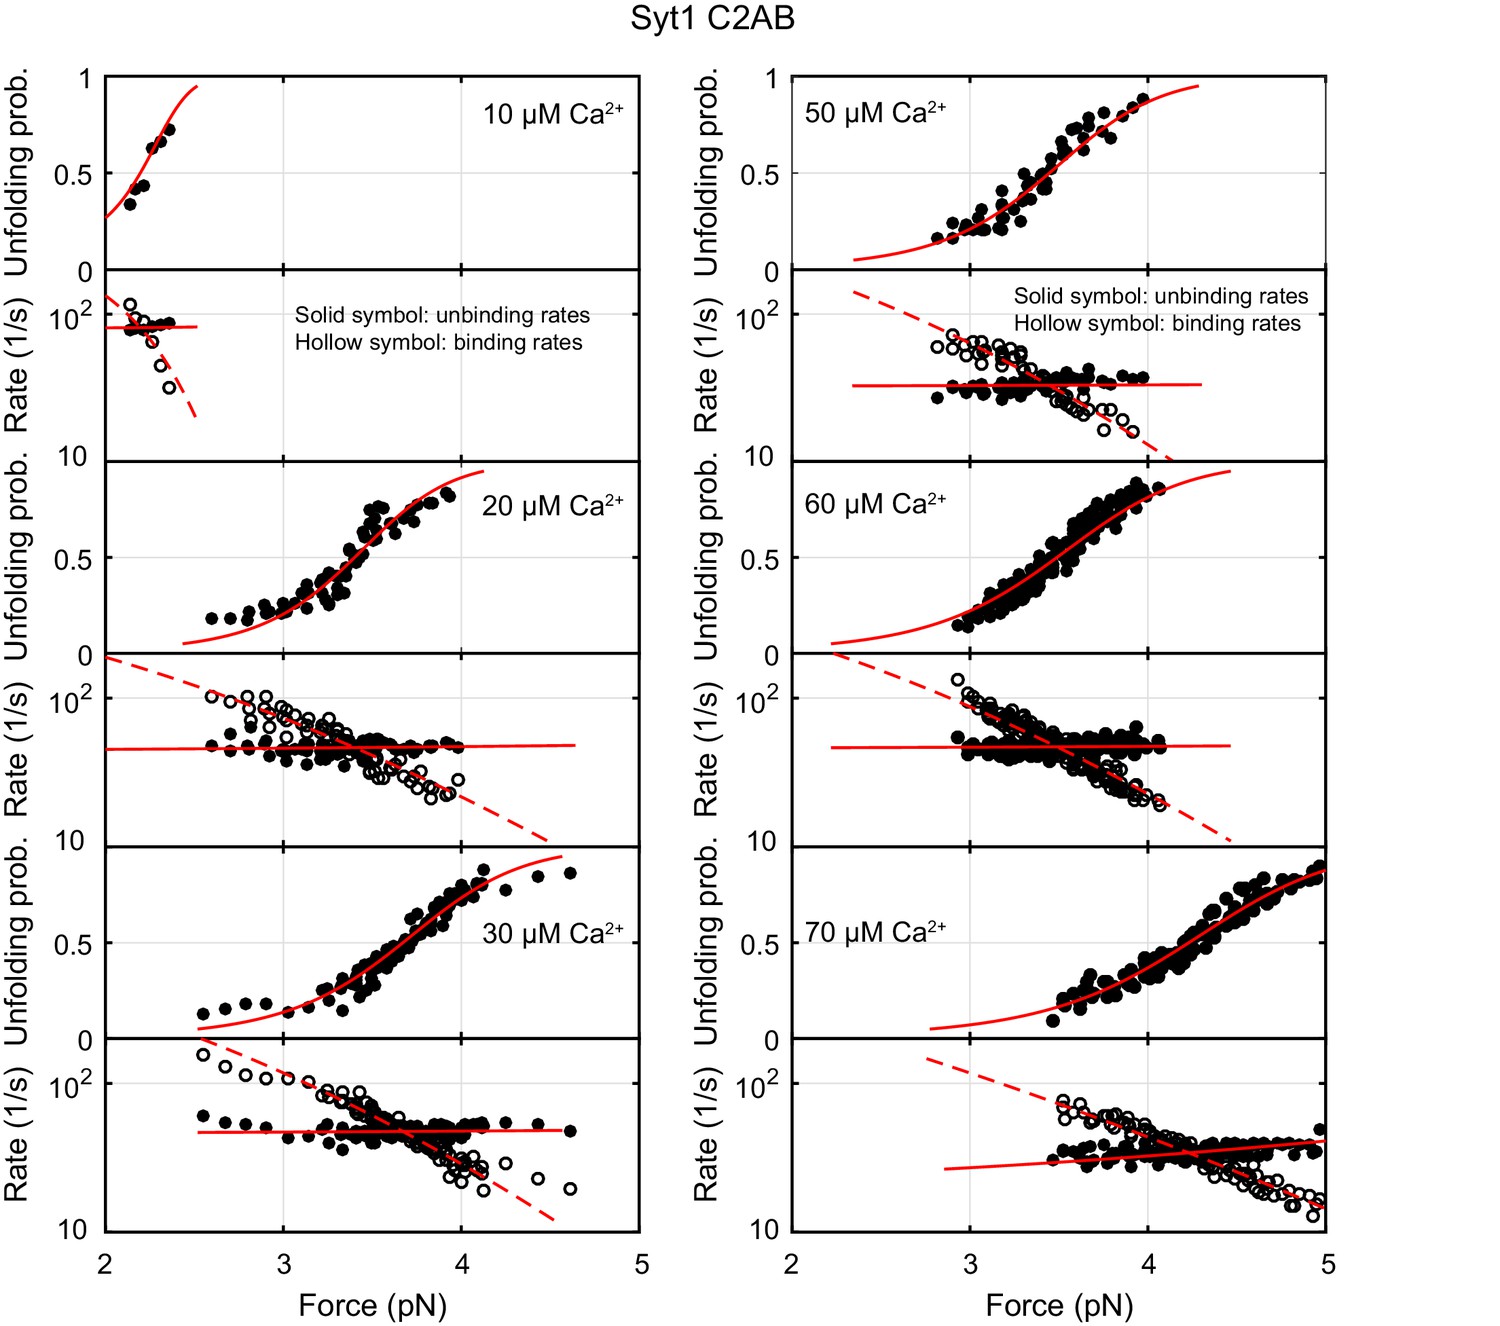
Force-dependent unbinding probabilities (top) and transition rates (bottom) of Syt1 measured at different Ca2+ concentrations.
Unbinding probabilities and rates are indicated by solid symbols, while binding rates are shown by hollow symbols. Model fits (solid and dashed curves) of these measurements revealed Ca2+-dependent E-Syt2 C2AB binding energy and kinetics (Figure 4C).
Figure 4—figure supplement 3
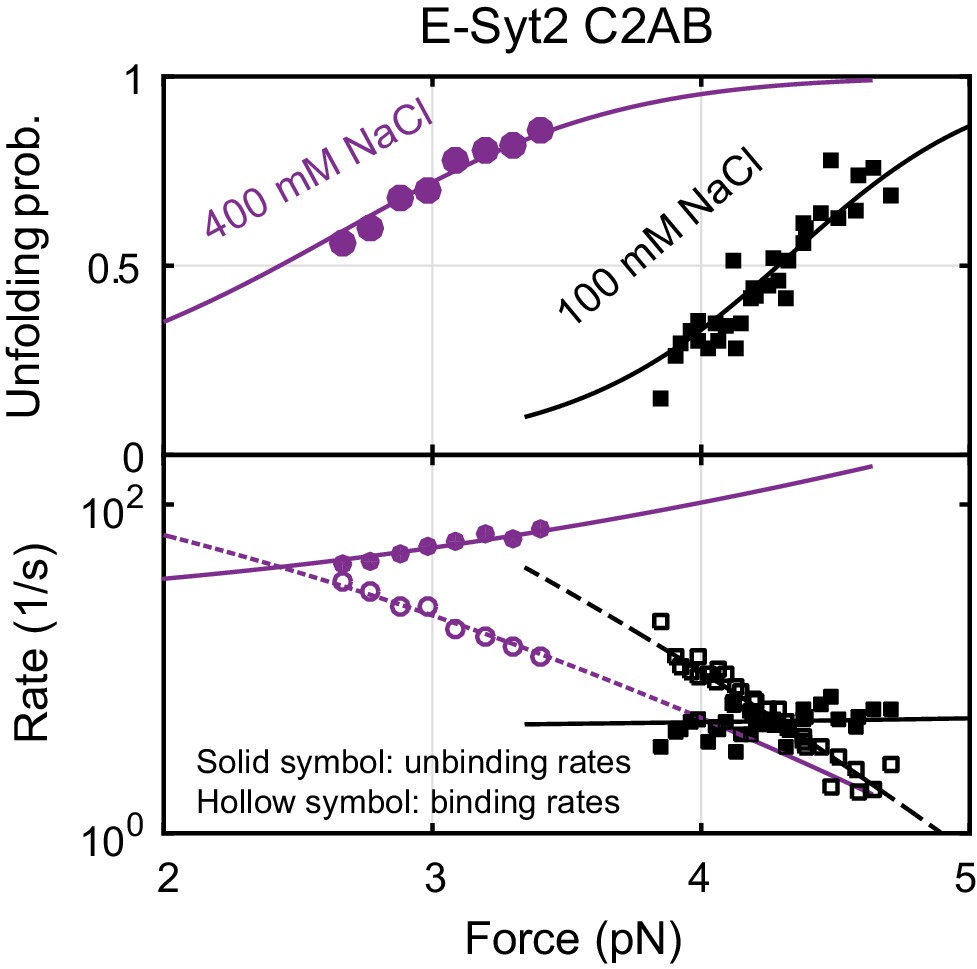
Force-dependent unbinding probabilities (top) and transition rates (bottom) of E-Syt2 C2AB measured at 100 mM and 400 mM NaCl concentrations.
Unbinding probabilities and rates are indicated by solid symbols, while binding rates are shown by hollow symbols. Model fits (solid and dashed curves) of these measurements revealed NaCl-dependent E-Syt2 C2AB binding energy and kinetics (see also Figure 4E).
Figure 5 with 1 supplement

Membrane binding of E-Syt2 C2AB and Syt1 C2AB depend on DOPS and PI(4,5)P2.
(A–B) Extension-time trajectories of E-Syt2 C2AB (A) or Syt1 C2AB (B) with different concentrations of DOPS or PI(4,5)P2 in the membrane. Idealized transitions are shown in red lines. Same scales are used in both A and B.
Figure 5—figure supplement 1
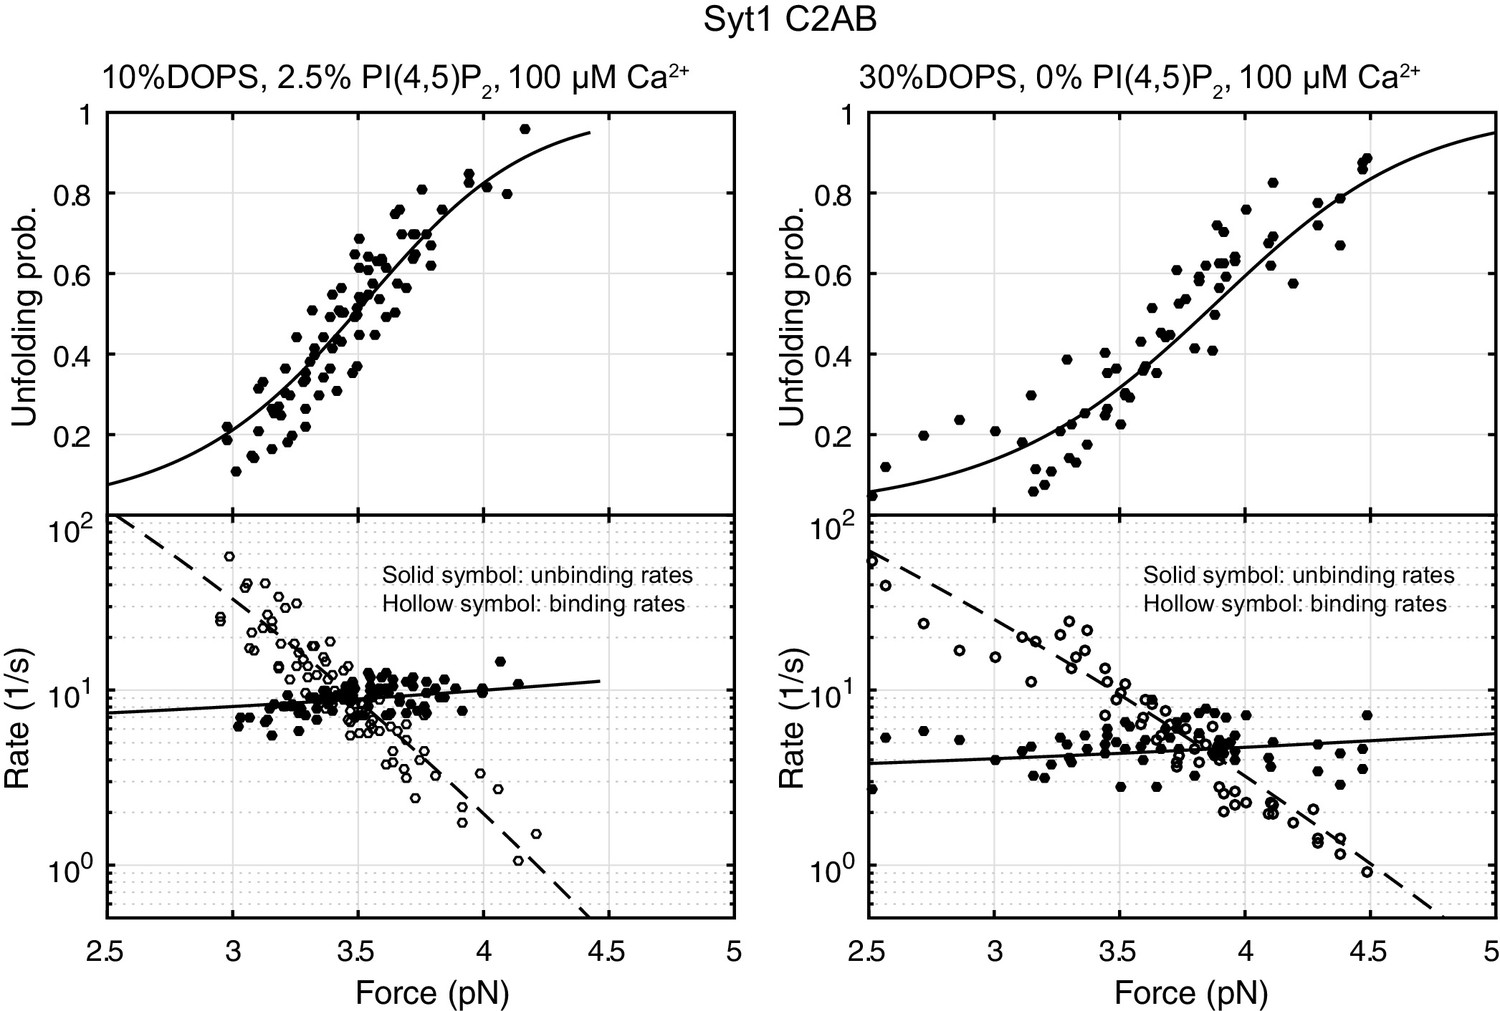
Force-dependent unbinding probabilities (top) and transition rates (bottom) of Syt1 C2AB measured at different lipid compositions as indicated.
Unbinding probabilities and rates are indicated by solid symbols, while binding rates are shown by hollow symbols. Model fits (solid and dashed curves) of these measurements revealed lipid-dependent Syt1 C2AB binding energy and kinetics (Table 1).
Tables
Table 1
Binding energies, binding rates, and unbinding rates of C2 domains at zero force.
The bimolecular binding energies (Eon) and rates (kon) in the absence of membrane tethers were derived from the corresponding energies (Eb) and rates (kb) measured by our assay in the presence of membrane tethers by Equations (9) and (7), respectively, whereas the unbinding rates (kub) are independent of membrane tethers. Also shown are the equilibrium forces under which the C2 domains bind to membranes with a probability of 0.5.
| [Ca2+] (µM) | PI(4,5)P2% | DOPS% | Equilibrium force (pN) | Binding energy with tether (Eb) (kBT) | Binding energy without tether (Eon) (kBT) | Log10[kb (s−1)] | Log10[kon (M−1s−1)] | Log10[kub (s−1)] | |
|---|---|---|---|---|---|---|---|---|---|
| E-Syt2 C2AB | 100 | 5 | 10 | 2.9 (0.1) | 4.6 (0.1) | 6.6 (0.1) | 3.5 (0.1) | 4.3 (0.1) | 1.5 (0.1) |
| 100 | 5 | 20 | 3.6 (0.4) | 7 (1) | 9 (1) | 4.1 (0.3) | 4.9 (0.3) | 1.1 (0.2) | |
| E-Syt2 C2C | 0 | 5 | 10 | 6.5 (0.6) | 12 (1) | 14 (1) | 5.2 (0.9) | 6.1 (0.9) | −0.2 (0.2) |
| 0 | 2.5 | 10 | 5.7 (0.3) | 10.2 (0.6) | 12.5 (0.6) | 4.3 (0.2) | 5.3 (0.2) | −0.1 (0.1) | |
| Syt1 C2AB | 100 | 5 | 10 | 4.7 (0.2) | 10.8 (0.8) | 12.8 (0.8) | 4.6 (0.4) | 5.4 (0.4) | 0 (0.2) |
| 100 | 2.5 | 10 | 3.5 (0.1) | 7.8 (0.2) | 9.8 (0.2) | 4.1 (0.3) | 4.9 (0.3) | 0.7 (0.3) | |
| 100 | 0 | 30 | 3.8 (0.2) | 8.7 (0.3) | 10.7 (0.3) | 4.2 (0.3) | 5.0 (0.3) | 0.4 (0.3) | |
| Syt1 C2B | 100 | 5 | 10 | 3.1 (0.2) | 7.4 (0.5) | 9.4 (0.5) | 4.2 (0.2) | 5.1 (0.2) | 1.0 (0.3) |
Additional files
-
Transparent reporting form
- https://doi.org/10.7554/eLife.30493.020
Download links
A two-part list of links to download the article, or parts of the article, in various formats.
Downloads (link to download the article as PDF)
Open citations (links to open the citations from this article in various online reference manager services)
Cite this article (links to download the citations from this article in formats compatible with various reference manager tools)
Single-molecule force spectroscopy of protein-membrane interactions
eLife 6:e30493.
https://doi.org/10.7554/eLife.30493


