A picorna-like virus suppresses the N-end rule pathway to inhibit apoptosis
- Wuhan University, China
- Wuhan Institute of Virology, Chinese Academy of Sciences, China
- Institute of Insect Science and Technology & School of Life Sciences, South China Normal University, China
Figures
Figure 1
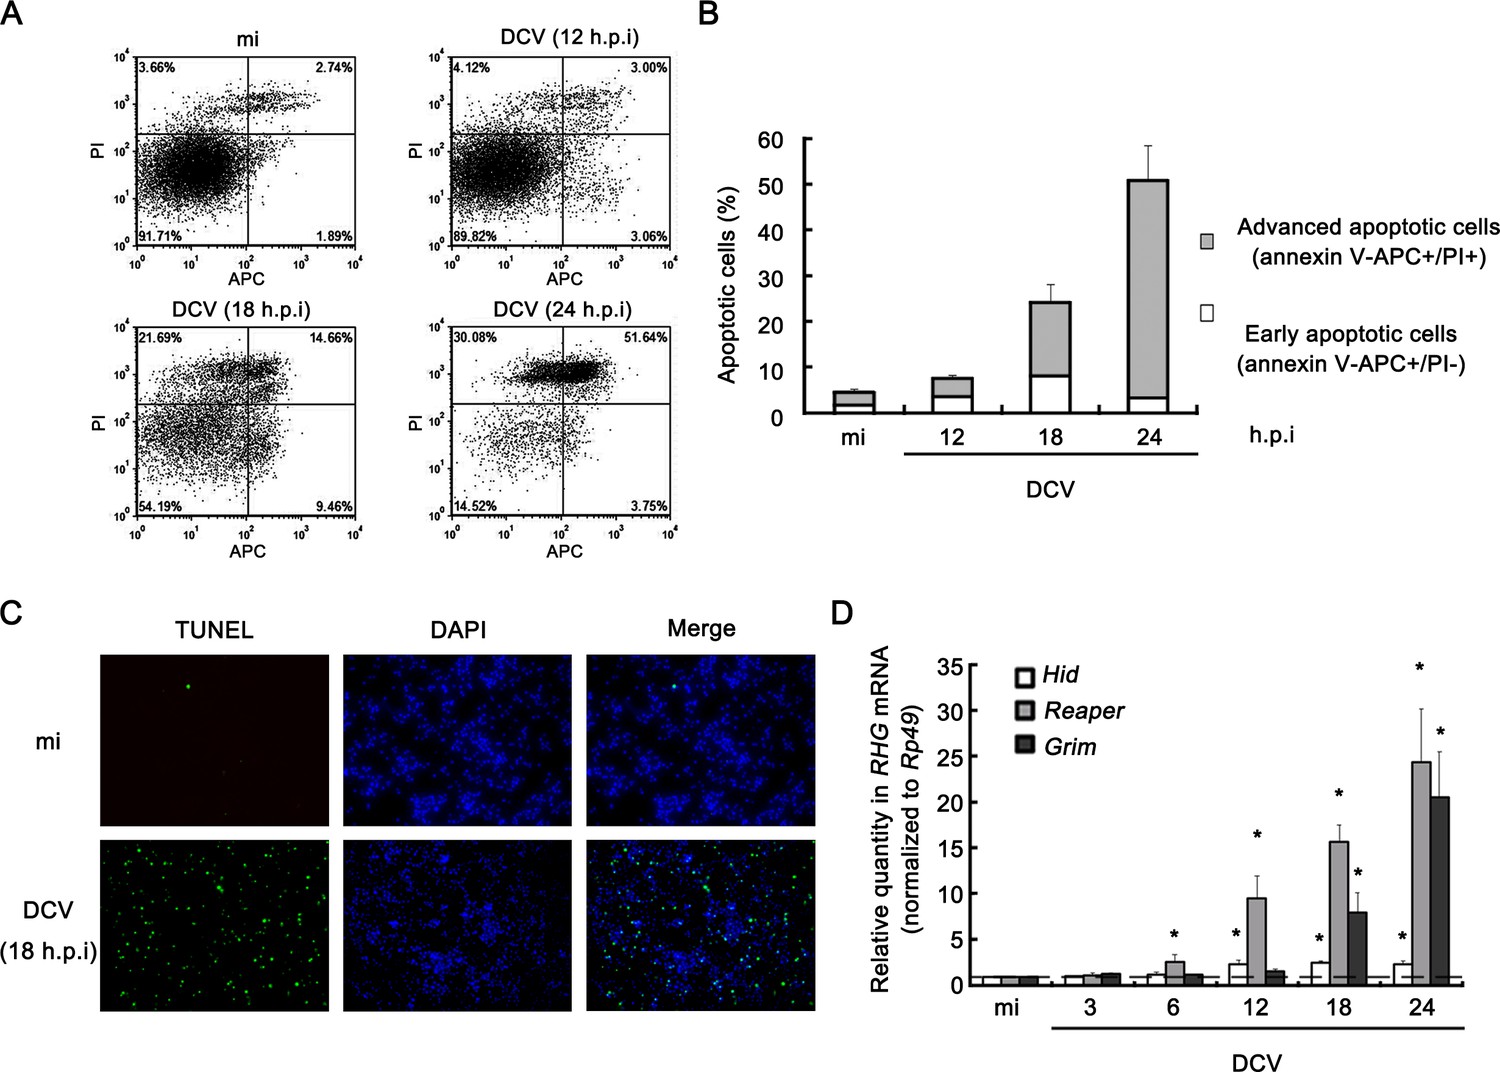
Viral infection induces apoptosis in Drosophila S2 cells.
(A) Cultured S2 cells were mock infected for 24 hr or infected with DCV (MOI = 5) for indicated time. Annexin-V-APC/PI double staining and flow cytometry assay was performed to quantify viable (Annexin-V-APC-/PI-), early apoptotic (Annexin-V-APC+/PI-) and late apoptotic cells (Annexin-V-APC+/PI+). (B) The percentage of early apoptotic cells and late apoptotic cells after mock infected for 24 hr or infected with DCV (MOI = 5) for indicated time (n = 3; error bars, s.d.). (C) S2 cells were mock infected or infected with DCV (MOI = 5) for 18 hr and analyzed by a TUNEL assay. Detection of DNA using DAPI staining was performed in the same experiment. TUNEL+ signals are green and DAPI+ signals are blue. (D) Cultured S2 cells were mock infected for 24 hr or infected with DCV (MOI = 5) for indicated time. After that, total RNA extracts were prepared for qRT-PCR assay of hid, reaper or grim mRNA (normalized to Rp49; n = 3; error bars, s.d.). mi, mock infection.
-
Figure 1—source data 1
Quantification data for Figure 1.
- https://doi.org/10.7554/eLife.30590.003
Figure 2

Apoptosis plays an antiviral role.
(A) Cultured S2 cells were transfected with empty vector or the plasmid expressing DIAP1 as indicated, and then infected with DCV (MOI = 5) for 24 hr. The percentages of early apoptotic and late apoptotic cells were measured by Annexin-V-APC/PI double staining and flow cytometry assay (n = 3; error bars, s.d.). (B–C) Cultured S2 cells were transfected and infected as described in (A). After that, total RNAs in cells (B) and in 5% of cultured fluids (C) were extracted, followed by qRT-PCR assay of viral genomic RNA (n = 3; *, p<0.05 by two-tailed Student's t test; error bars, s.d.). For (B), viral genomic RNAs were normalized to Rp49. (D) Cultured S2 cells were transfected with dsRNAs against indicated genes and then infected with DCV (MOI = 5) for 24 hr. The percentages of early apoptotic and late apoptotic cells were measured by Annexin-V-APC/PI double staining and flow cytometry assay (n = 3; error bars, s.d.). (E–F) Cultured S2 cells were transfected and infected as described in (D). After that, total RNAs in cells (E) and in 5% of cultured fluids (F) were extracted, followed by qRT-PCR assay of viral genomic RNA (n = 3; *p<0.05 by two-tailed Student's t test; error bars, s.d.). For (E), viral genomic RNAs were normalized to Rp49. (G) Survival of adult flies with indicated genotypes after DCV (1011.5 TCID50/ml) oral infection or mock infection (n = 3; each group contains 15 female flies and 15 male flies; error bars, s.d.). (H) Total RNA extracts from adult flies with indicated genotypes after DCV (1011.5 TCID50/ml) oral infection for 3 days were prepared for qRT-PCR assay of viral genomic RNA (normalized to Rp49, n = 3; *p<0.05 by two-tailed Student's t test; error bars, s.d.).
-
Figure 2—source data 1
Quantification data for Figure 2.
- https://doi.org/10.7554/eLife.30590.005
Figure 3 with 2 supplements
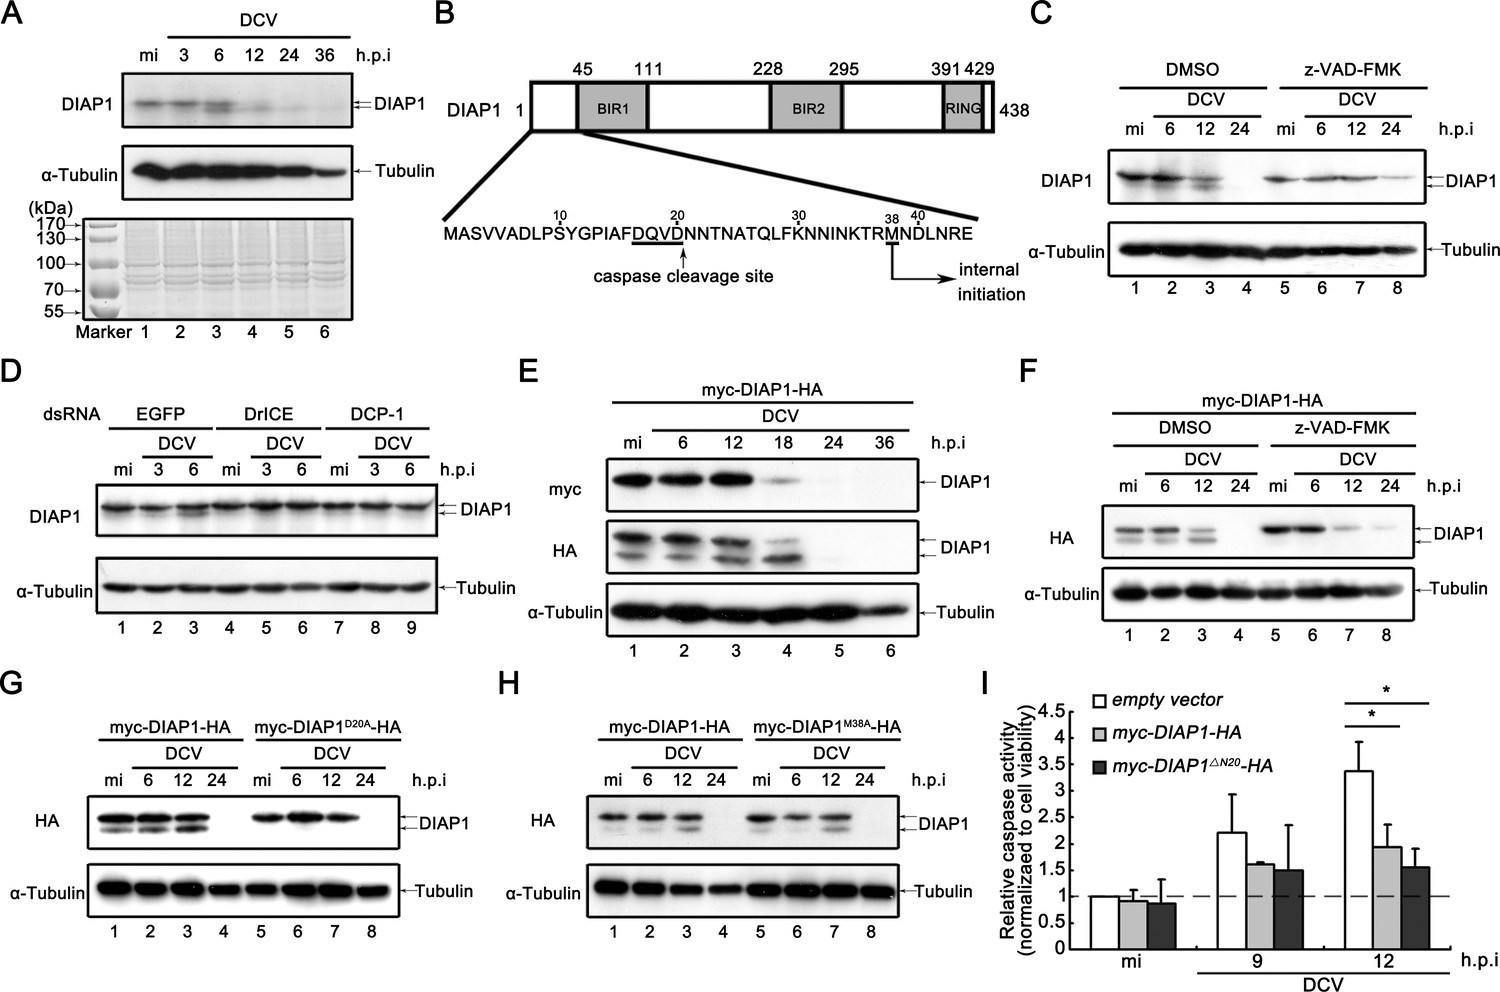
Viral infection promotes the accumulation of cleaved DIAP1 in Drosophila S2 cells.
(A) Cultured S2 cells were mock infected for 36 hr or infected with DCV (MOI = 5) for indicated time. Cell lysates were subjected to SDS-PAGE, followed by western blots using the indicated antibodies or Coomassie Blue staining. (B) Schematic diagram of two distinct mechanisms to produce a smaller form of DIAP1. (C) Cultured S2 cells were treated with DMSO or z-VAD-FMK as indicated, and then mock infected for 24 hr or infected with DCV (MOI = 5) for indicated time. (D) Cultured S2 cells were transfected with dsRNAs against the indicated genes, and then mock infected for 6 hr or infected with DCV (MOI = 5) for indicated time. (E) Cultured S2 cells were transfected with plasmid expressing myc-DIAP1-HA, and then mock infected for 36 hr or infected with DCV (MOI = 5) for indicated time. (F) Cultured S2 cells were transfected with plasmid expressing myc-DIAP1-HA, and then treated with DMSO or z-VAD-FMK as indicated. After that cells were mock infected for 24 hr or infected with DCV (MOI = 5) for indicated time. (G–H) Cultured S2 cells were transfected with plasmid expressing myc-DIAP1-HA, myc-DIAP1D20A-HA (G) or myc-DIAP1M38A-HA (H) as indicated, and then mock infected for 24 hr or infected with DCV (MOI = 5) for indicated time. (C–H) Cell lysates were subjected to western blots using the indicated antibodies. (I) Cultured S2 cells were transfected with empty vector or plasmid expressing myc-DIAP1-HA or myc-DIAP1ΔN20-HA as indicated, and then mock infected or infected with DCV (MOI = 5) for indicated time. The relative caspase activity was measured, and normalized to cell viability (n = 3; *p<0.05 by two-tailed Student's t test; error bars, s.d.).
-
Figure 3—source data 1
Quanitification data for Figure 3 and Figure 3—figure supplement 1.
- https://doi.org/10.7554/eLife.30590.009
Figure 3—figure supplement 1
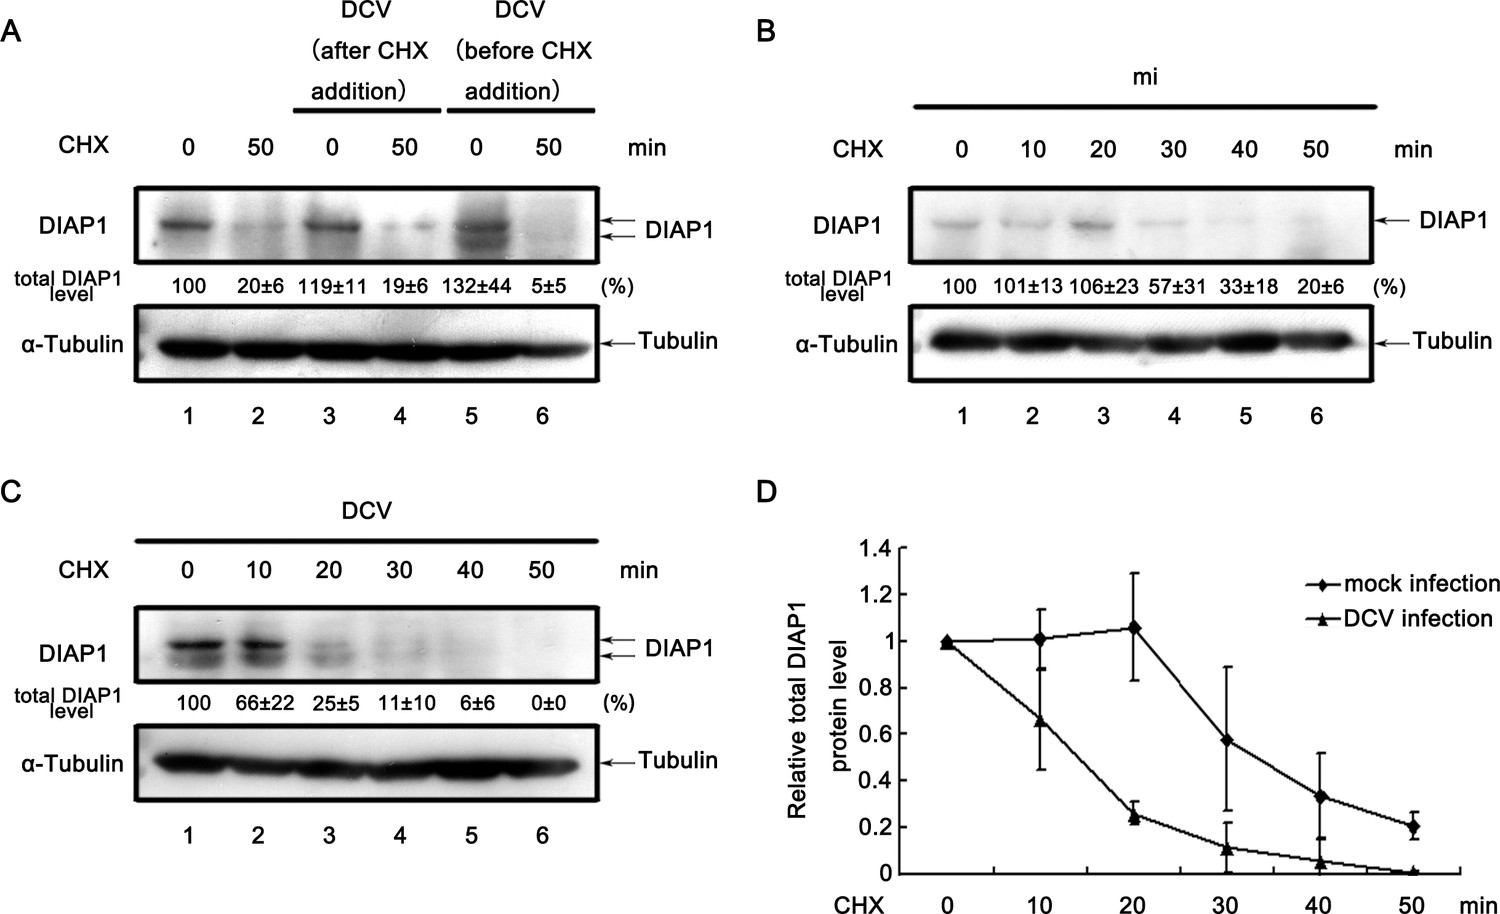
DCV infection promotes the degradation of DIAP1.
(A) Cultured S2 cells were treated with 50 μg/ml CHX for 0 (lanes 1, 3, and 5) or 50 min (lanes 2, 4, and 6). Cells were infected with DCV immediately after CHX addition (lanes 3 and 4) or 8 hr before CHX addition (lanes 5 and 6). Cell lysates were then prepared and subjected to western blots using the indicated antibodies. (B–C) Cultured S2 cells were mock infected (B) or infected with DCV (MOI = 5) for 8 hr (C) and then treated with 50 μg/ml CHX for the indicated periods. Cell lysates were prepared and subjected to western blots using the indicated antibodies. For (A–C), the values listed below the blots indicate the relative total DIAP1 protein levels following ɑ-tubulin normalization using Quantity One software. The DIAP1 level at 0 min CHX treatment (lanes 1) was defined as 100% (or 1). (D) The relative levels of total DIAP1 protein shown in (B) and (C) were plotted. All data represent means and SD of three independent experiments.
Figure 3—figure supplement 2

The DIAP1 overexpressed samples had the similar levels of transfection.
Cultured S2 cells were cultured in a 100 mm plate and were firstly transfected with plasmid expressing myc-DIAP1-HA. After 24 hr, the transfected cells were divided into a six-well plate, and cultured for six more hrs to reach 80% confluence (about 3 × 10⁶ cells per well). After that, total RNAs in cells were extracted, followed by qRT-PCR assay of DIAP1 mRNA (n = 3; *p<0.05 by two-tailed Student's t test; error bars, s.d.). Of note, endogenous DIAP1 mRNA was ignored here.
Figure 4
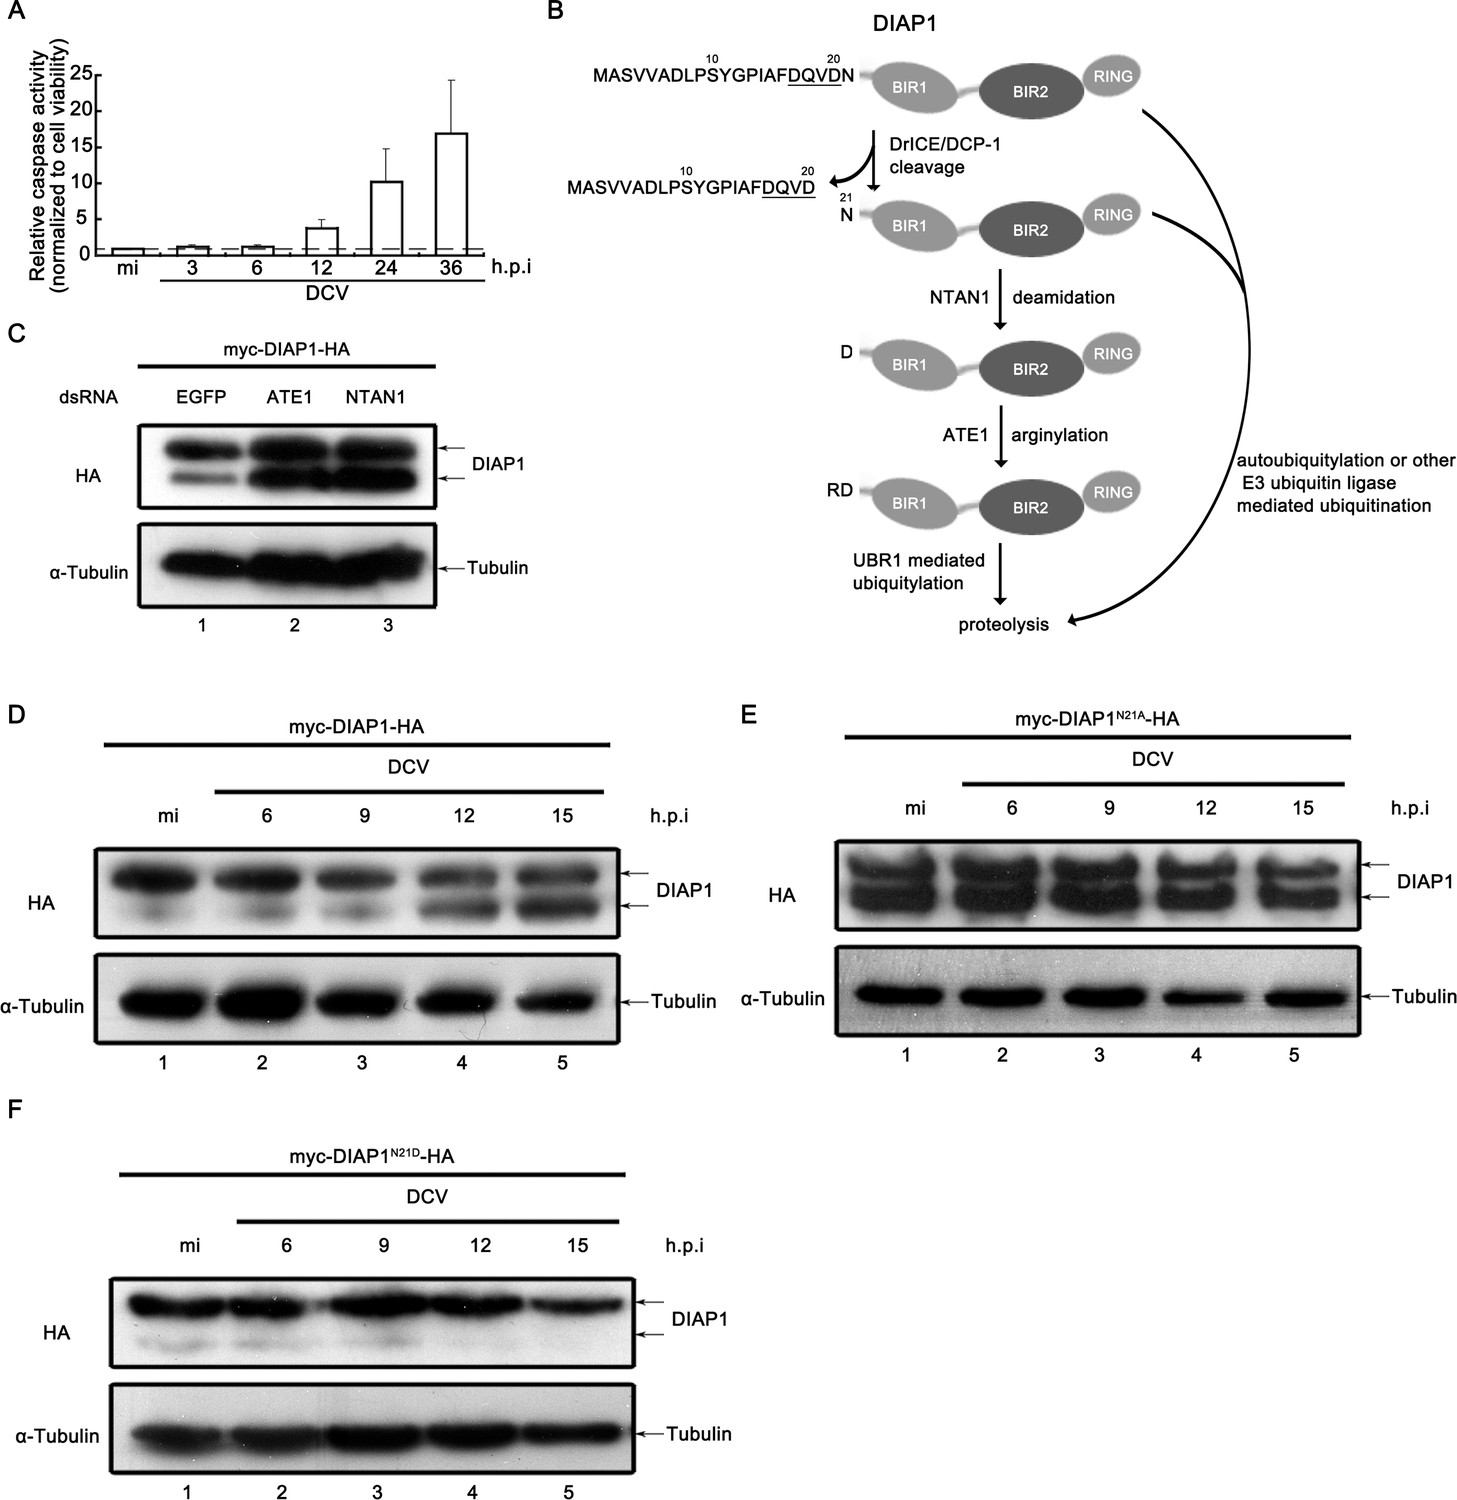
Viral infection inhibited the N-terminal Asn deamidation of cleaved DIAP1.
(A) Cultured S2 cells were infected as described in Figure 3A. The relative caspase activity was measured, and normalized to cell viability (n = 3; *p<0.05 by two-tailed Student's t test; error bars, s.d.). (B) Schematic diagram of the mechanisms of DIAP1 degradation. (C) Cultured S2 cells were transfected with the plasmid expressing myc-DIAP1-HA, and the dsRNAs against the indicated genes. (D–F) Cultured S2 cells were transfected with plasmid expressing myc-DIAP1-HA (D) or its mutants (E and F) as indicated, and then mock infected for 18 hr or infected with DCV (MOI = 5) for indicated time. (C–F) Cell lysates were subjected to western blots using the indicated antibodies.
Figure 5 with 1 supplement
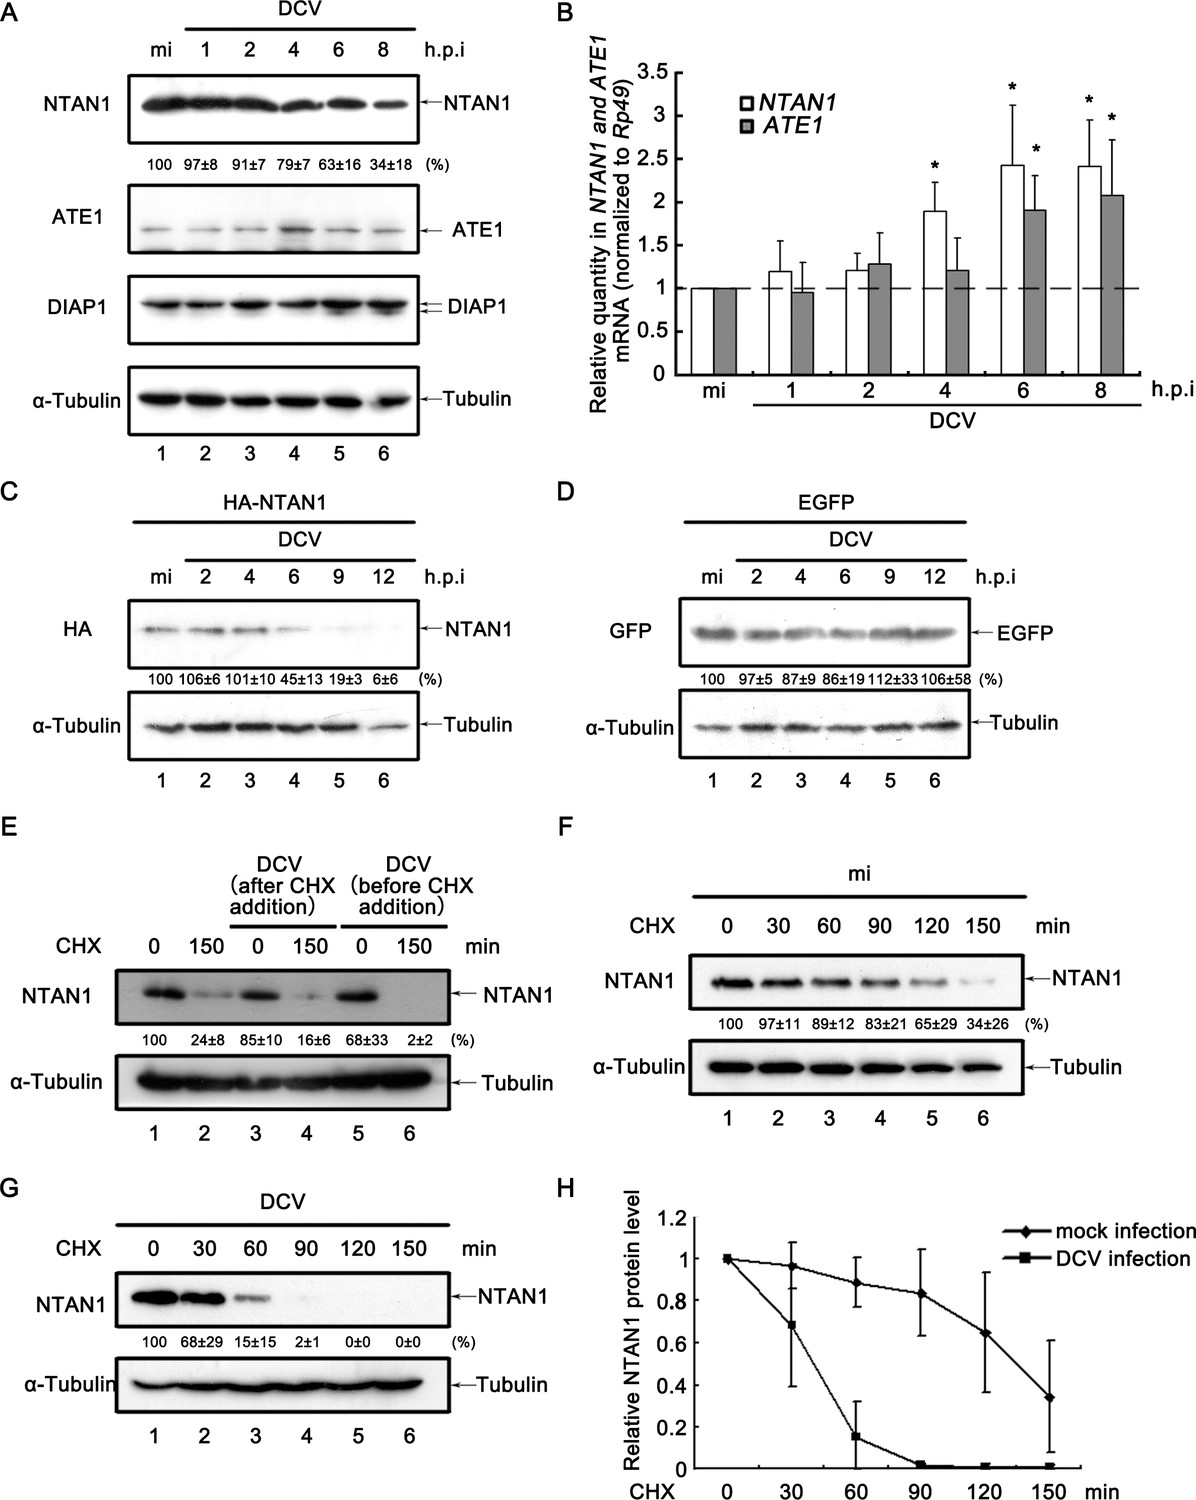
Viral infection promotes the degradation of NTAN1.
(A) Cultured S2 cells were mock infected for 8 hr or infected with DCV (MOI = 5) for indicated time. Cell lysates were subjected to western blots using the indicated antibodies. (B) Cultured S2 cells were infected as described in (A). Total RNA extracts were prepared for qRT-PCR assay of indicated mRNA (normalized to Rp49; n = 3; error bars, s.d.). (C–D) Cultured S2 cells were transfected with plasmid expressing HA-NTAN1 (C) or EGFP (D) as indicated, and then mock infected for 12 hr or infected with DCV (MOI = 5) for indicated time. Cell lysates were subjected to Western blots using the indicated antibodies. (E) Cultured S2 cells were treated with 50 μg/ml CHX for 0 (lanes 1, 3 and 5) or 150 min (lanes 2, 4 and 6). Cells were infected with DCV immediately after CHX addition (lanes 3 and 4) or 6 hr before CHX addition (lanes 5 and 6). Cell lysates were then prepared and subjected to western blots using the indicated antibodies. (F–G) Cultured S2 cells were mock infected (F) or infected with DCV (MOI = 5) (G) for 6 hr and then treated with 50 μg/ml CHX for the indicated periods. Cell lysates were prepared and subjected to western blots using the indicated antibodies. For (A, C–G), the values listed below the blots indicate the relative NTAN1 or EGFP protein levels following ɑ-Tubulin normalization using Quantity One software. The protein level shown in lanes 1 was defined as 100% (or 1). (H) The relative levels of NTAN1 protein shown in (F) and (G) were plotted. All data represent means and SD of three independent experiments.
-
Figure 5—source data 1
Quantification data for Figure 5.
- https://doi.org/10.7554/eLife.30590.013
Figure 5—figure supplement 1

Viral infection promotes the accumulation of NTAN1 after 12 h.p.i.
Cultured S2 cells were mock infected for 18 hr or infected with DCV (MOI = 5) for indicated time. Cell lysates were examined by western blots using the indicated antibodies.
Figure 6 with 2 supplements
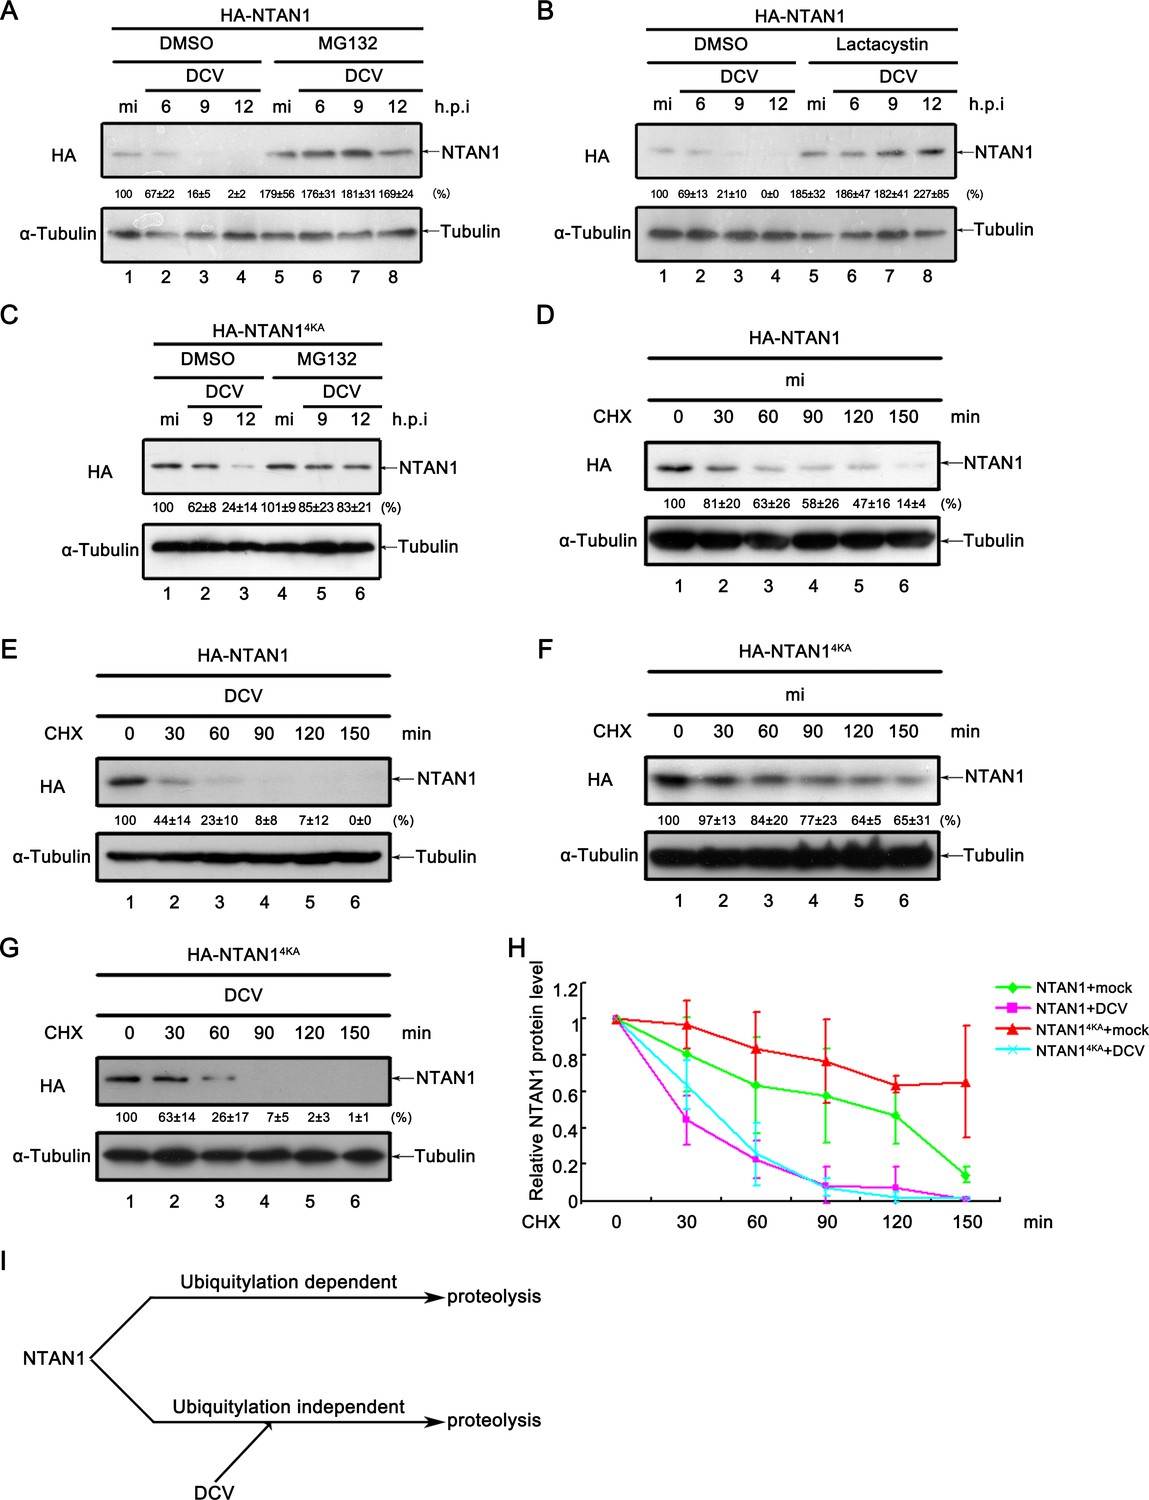
Viral infection promotes the degradation of NTAN1 via the proteasome pathway.
(A–B) Cultured S2 cells were transfected with plasmid expressing HA-NTAN1, and then treated with DMSO, MG132 (A) or lactacystin (B) as indicated. After that, cells were mock infected for 12 hr or infected with DCV (MOI = 5) for indicated time. (C) Cultured S2 cells were transfected with plasmid expressing HA-NTAN14KA, and then treated with DMSO or MG132 as indicated. After that, cells were mock infected for 12 hr or infected with DCV (MOI = 5) for indicated time. (D–G) Cultured S2 cells were transfected with plasmid expressing HA-NTAN1 (D and E) or HA-NTAN14KA (F and G) and then mock infected (D and F) or infected with DCV (MOI = 5) (E and G) for 6 hr. After that, cells were treated with 50 μg/ml CHX for the indicated periods. (A–G) Cell lysates were subjected to western blots using the indicated antibodies. The values listed below the blots indicate the relative NTAN1 protein levels compared to lane 1 following ɑ-tubulin normalization using Quantity One software. (H) The relative levels of NTAN1 protein shown in (D), (E), (F) and (G) were plotted. All data represent means and SD of three independent experiments. (I) Proposed model of NTAN1 degradation strategies.
-
Figure 6—source data 1
Quantification data for Figure 6.
- https://doi.org/10.7554/eLife.30590.017
Figure 6—figure supplement 1
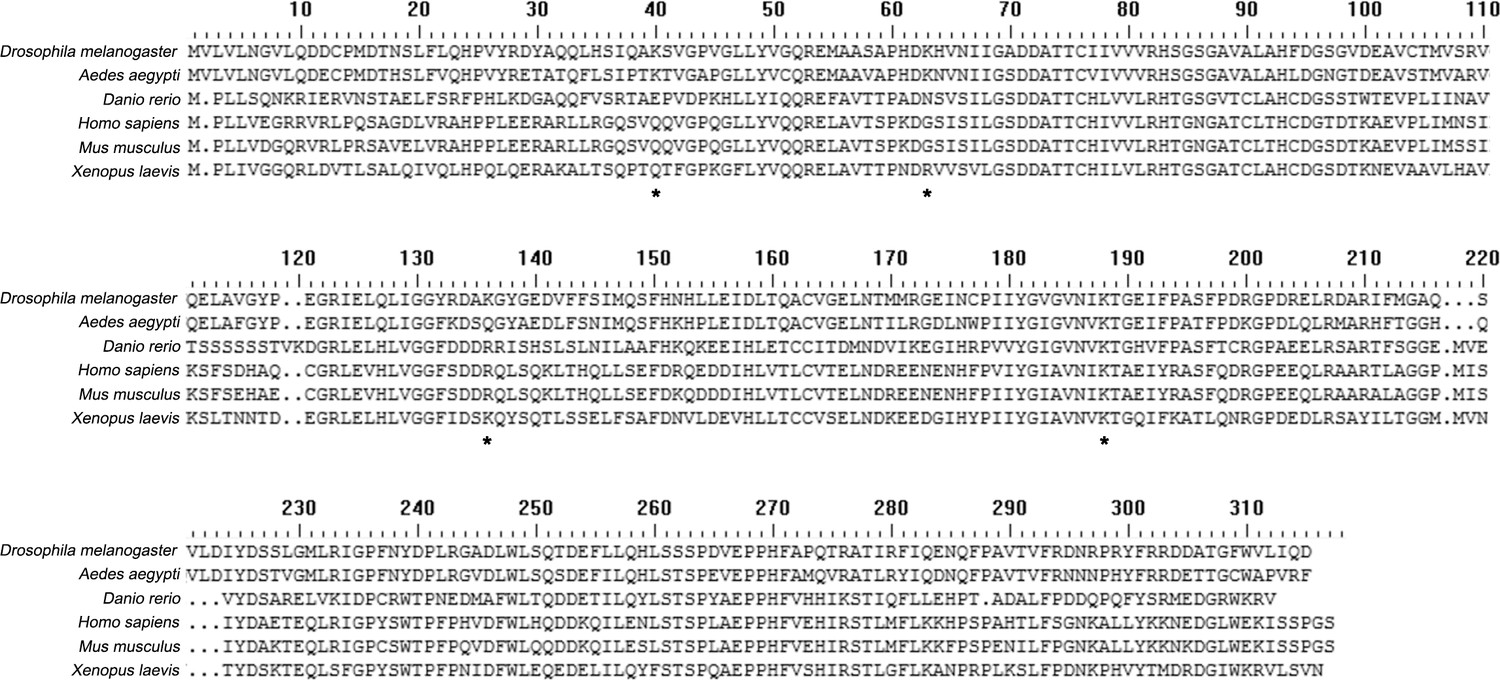
Amino acid sequence analyses of NTAN1 proteins in different organisms.
The amino acid sequence of Drosophila melanogaster NTAN1 is compared with those of indicated NTAN1s. Lysine residues are marked with asterisk.
Figure 6—figure supplement 2
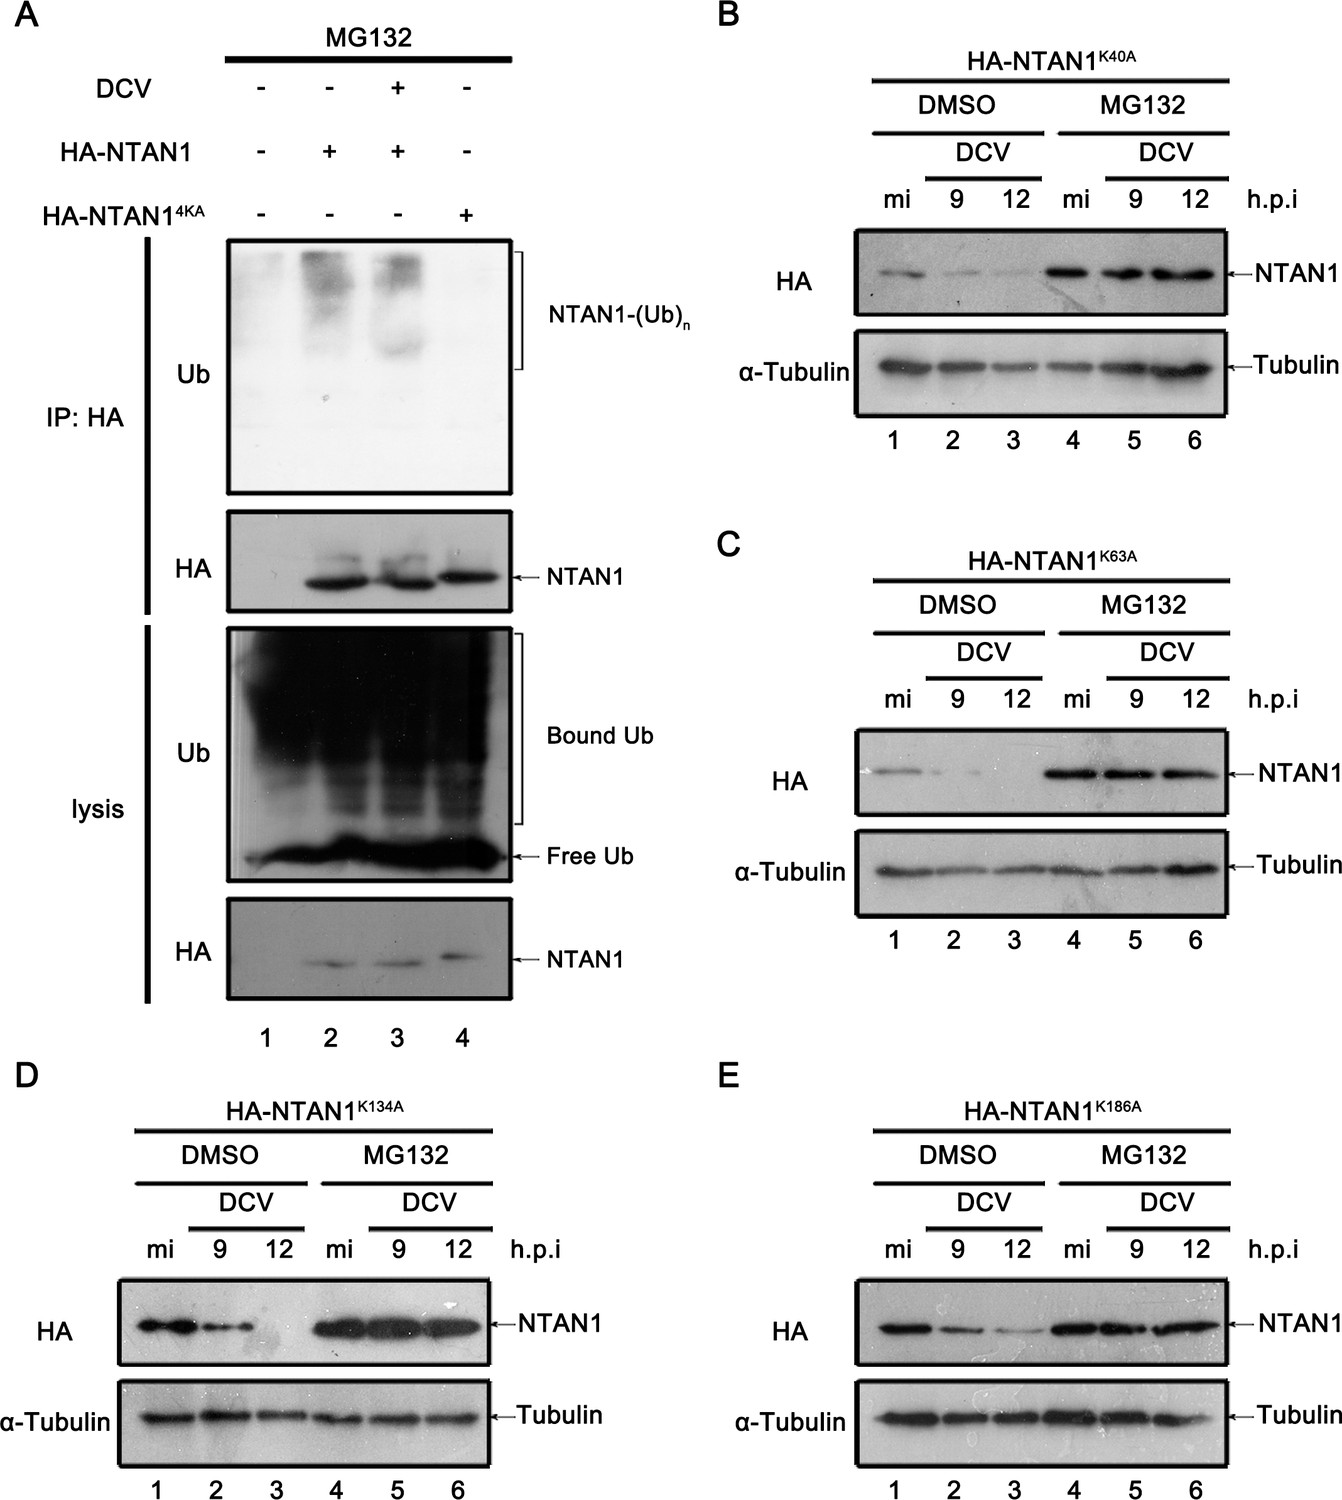
K186 is the critical lysine residue for ubiquitylation of NTAN1.
(A) Cultured S2 cells were transfected with empty vector or plasmid expressing HA-NTAN1 or NTAN14KA as indicated, and treated with MG-132. After that, cells were mock infected (lanes 1, 2 and 4) or infected with DCV (MOI = 5) (lane 3) for 12 hr. The cells were lysed and subjected to immunoprecipitation using an anti-HA antibody. Cell lysates and immunoprecipitates were subjected to western blots using the indicated antibodies. (B–E) Cultured S2 cells were transfected with plasmid expressing HA-NTAN1K40A (B), HA-NTAN1K63A (C), HA-NTAN1K134A (D) or HA-NTAN1K186A (E). After that, cells were treated with DMSO or MG132 as indicated, and then mock infected for 12 hr or infected with DCV (MOI = 5) for indicated time. Cell lysates were examined by western blots using the indicated antibodies.
Figure 7 with 1 supplement
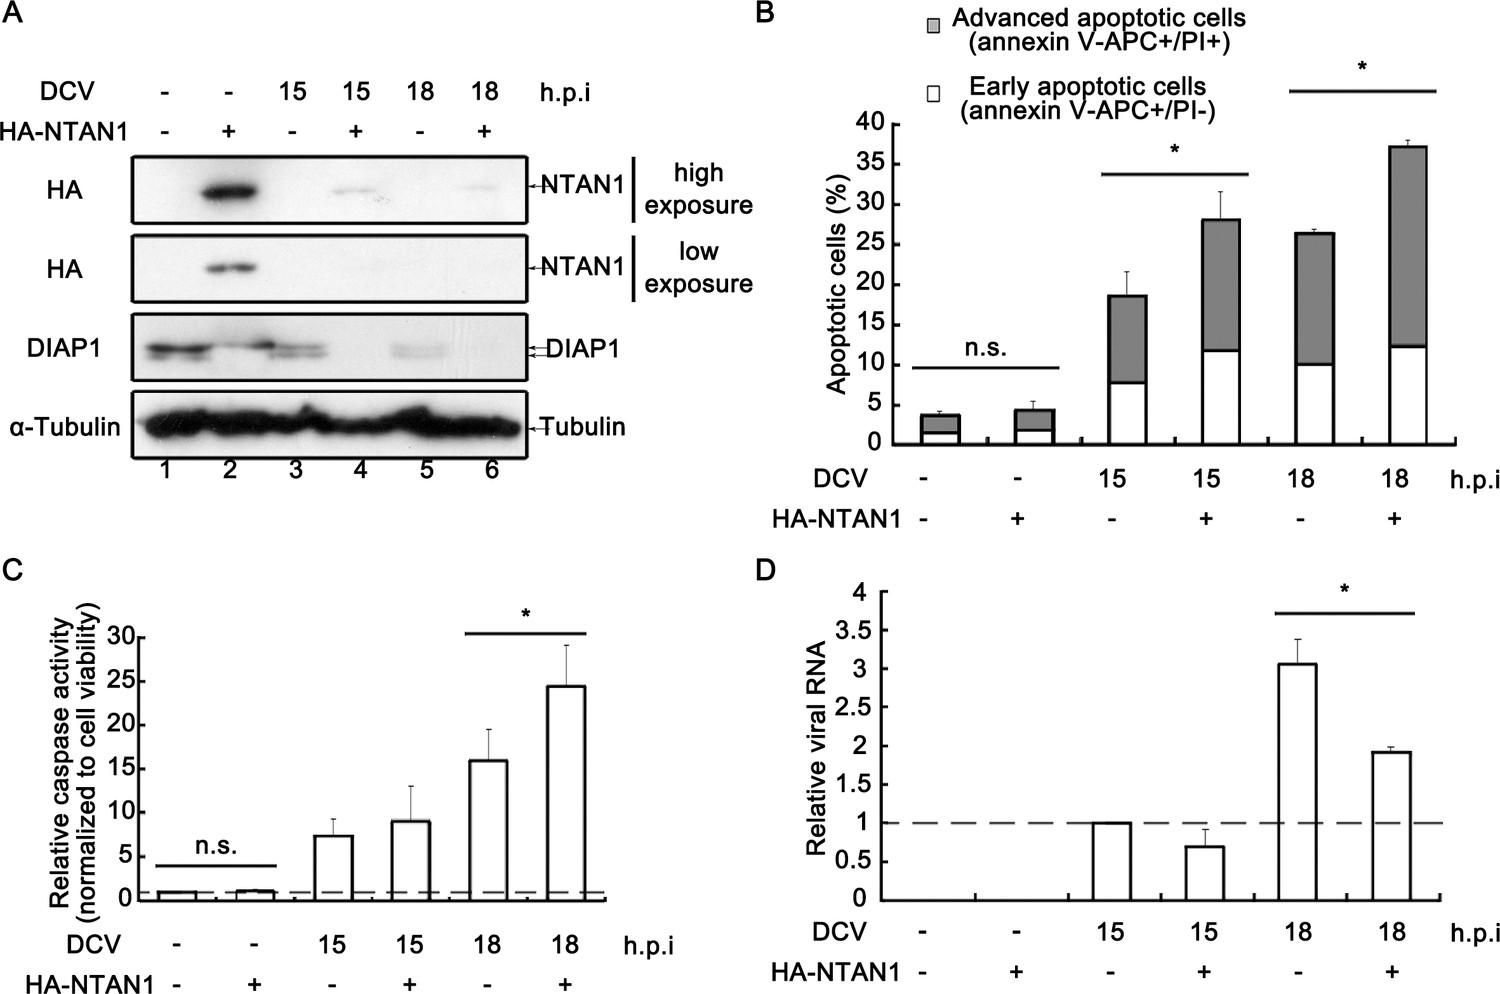
Restoring NTAN1 expression enhances virus-induced apoptosis and restricts viral replication in cells.
(A–D) Cultured S2 cells were transfected with empty vector or plasmid expressing HA-NTAN1 as indicated, and then mock infected for 18 hr or infected with DCV (MOI = 5) for indicated time. (A) Cell lysates were prepared and subjected to western blots using the indicated antibodies. (B) The percentages of early apoptotic and late apoptotic cells were measured by Annexin-V-APC/PI double staining and flow cytometry assay (n = 6; *p<0.05 by two-tailed Student's t test; error bars, s.d.). (C) The relative caspase activity was measured, and normalized to cell viability (n = 3; *p<0.05 by two-tailed Student's t test; error bars, s.d.). (D) Total RNAs were extracted and then subjected to qRT-PCR assay of viral genomic RNA (n = 3; *p<0.05 by two-tailed Student's t test; error bars, s.d.).
-
Figure 7—source data 1
Quanification data for Figure 7 and Figure 7—figure supplement 1.
- https://doi.org/10.7554/eLife.30590.020
Figure 7—figure supplement 1

Knockdown of NTAN1 inhibits virus-induced apoptosis and promotes viral replication.
(A–B) Cultured S2 cells were transfected with dsRNAs against indicated genes, and then infected with DCV (MOI = 5) for 15 hr. (A) The percentages of early apoptotic and late apoptotic cells were measured by Annexin-V-APC/PI double staining and flow cytometry assay (n = 3; *p<0.05 by two-tailed Student's t test; error bars, s.d.). (B) Total RNAs were extracted and then subjected to qRT-PCR assay of viral genomic RNA (n = 3; *p<0.05 by two-tailed Student's t test; error bars, s.d.). Viral genomic RNAs were normalized to Rp49.
Figure 8
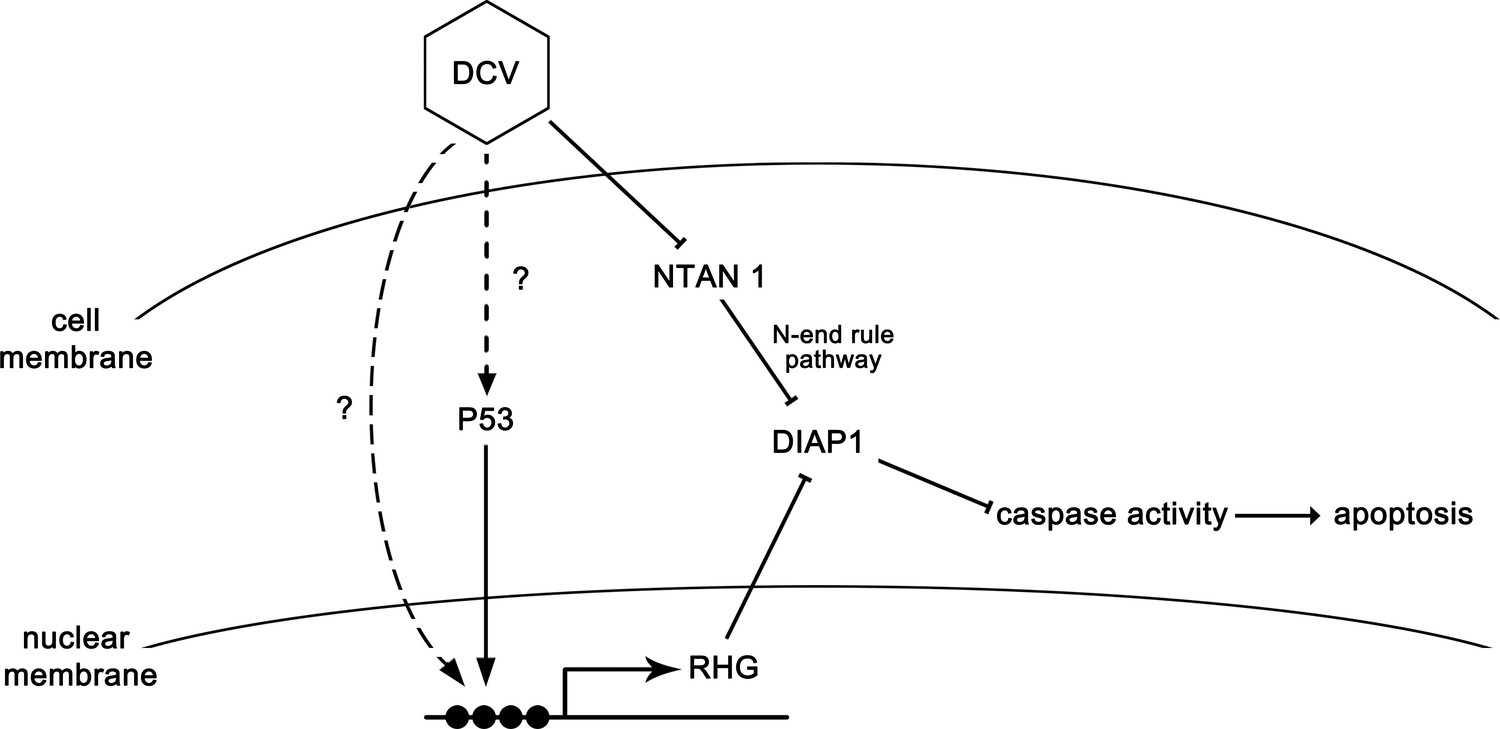
The model of apoptosis regulation during DCV infection.
DCV infection induces RHG genes transcription and further induces apoptosis in Drosophila. On the other hand, DCV infection causes the degradation of NTAN1. This process suppresses the degradation of caspase-cleaved DIAP1 by inhibiting the N-end rule pathway, resulting in the suppression of apoptosis.
Tables
Key resources table
| Reagent type (species) or resource | Designation | Source or reference | Identifiers | Additional information |
|---|---|---|---|---|
| cell line (Drosophila melanogaster) | S2 | ATCC | ATCC, Cat# CRL-1963; RRID: CVCL_Z232 | |
| antibody | anti-Flag M2 (mouse monoclonal) | Sigma | Sigma,Cat# F1804; RRID: AB_262044 | 1:2000 |
| antibody | anti-myc (mouse monoclonal) | MBL | MBL, Cat# M192-3; RRID: AB_11160947 | 1:2000 |
| antibody | anti-HA (mouse monoclonal) | ProteinTech | ProteinTech, Cat# 66006–1-Ig | 1:5000 |
| antibody | anti-α-Tubulin (mouse monoclonal) | ProteinTech | ProteinTech, Cat# 66031–1-Ig; RRID: AB_11042766 | 1:3000 |
| antibody | anti-DIAP1 (goat polyclonal) | Santa Cruz Biotechnology | Santa Cruz Biotechnology, Cat# sc-32414; RRID: AB_639332 | 1:200 |
| antibody | HRP-conjugated anti-GFP | ProteinTech | ProteinTech, Cat# HRP-66002 | 1:5000 |
| antibody | anti-ubiquitin (mouse monoclonal) | Cell Signaling Technology | Cell Signaling Technology, Cat# 3936; RRID:AB_331292 | 1:2000 |
| commercial assay or kit | Annexin-V-APC/PI double staining kit | BioLegend | BioLegend, Cat# 640932 | |
| commercial assay or kit | TUNEL staining kit | Roche | Roche, Cat# 11684817910 | |
| commercial assay or kit | CellTiter-Blue Cell Viability kit | Promega | Promega, Cat# G8080 | |
| commercial assay or kit | Caspase-Glo 3/7 kit | Promega | Promega, Cat# G8090 | |
| other | z-VAD-FMK | MedChem Express | MedChem Express, Cat# HY-16658 | 20 μM |
| other | CHX | Sigma | Sigma, Cat# C7698 | 50 μg/ml |
| other | MG-132 | Sigma | Sigma, Cat# C2211 | 50 μM |
| other | lactacystin | Merck | Merck, Cat# 426100 | 10 μM |
Additional files
-
Transparent reporting form
- https://doi.org/10.7554/eLife.30590.022
Download links
A two-part list of links to download the article, or parts of the article, in various formats.
Downloads (link to download the article as PDF)
Open citations (links to open the citations from this article in various online reference manager services)
Cite this article (links to download the citations from this article in formats compatible with various reference manager tools)
A picorna-like virus suppresses the N-end rule pathway to inhibit apoptosis
eLife 6:e30590.
https://doi.org/10.7554/eLife.30590


