AKT isoforms have distinct hippocampal expression and roles in synaptic plasticity
- University of Colorado-Boulder, United States
- Linda Crnic Institute, United States
Figures
Figure 1
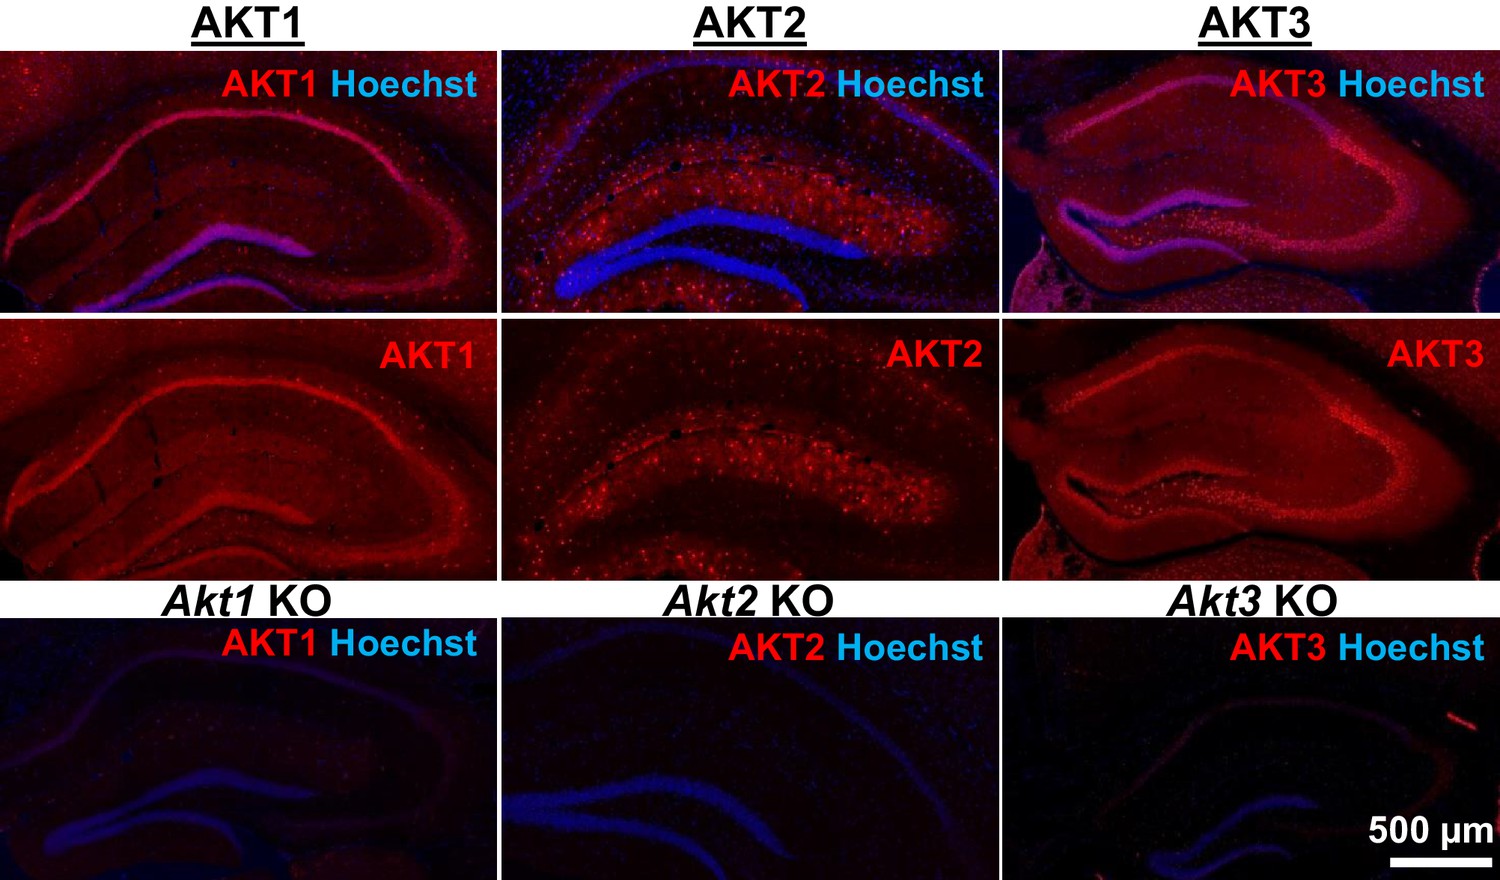
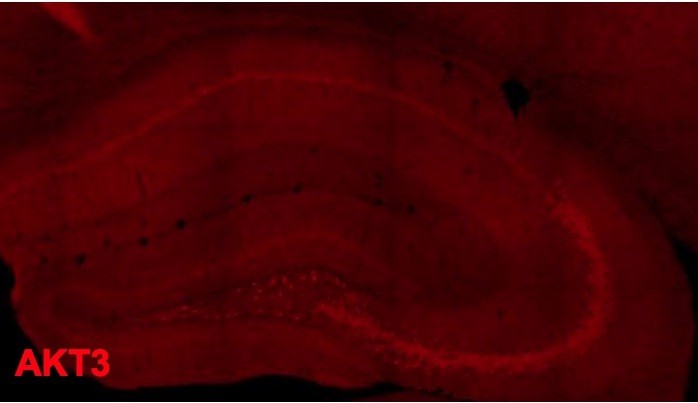
AKT isoform-specific expression in the hippocampus.
Immunohistology using isoform-specific antibodies revealed distinct expression patterns for each AKT isoform in the hippocampus. AKT1 was mainly expressed in the cell body layers, with the greatest levels in stratum pyramidale of CA1. AKT2 was mostly expressed in specific cells in the molecular layer of the dentate gyrus, CA3 and CA1. AKT3 was also mainly expressed in the cell body layers of the hippocampus and showed strong expression in the hilus and CA3. Bottom panels show single Akt knockout (KO) tissue to validate the specificity of the antibodies.
Figure 2 with 1 supplement

Cell-type-specific expression of AKT isoforms in hippocampal area CA1.
(a). AKT1 was mainly expressed in neuronal cell bodies, indicated by co-localization with NeuN. Certain neurons in the pyramidal layer, stratum oriens and molecular layer showed greater expression levels of AKT1 (yellow arrows). AKT2 was specifically expressed in astrocytes, shown by co-localization with the astrocyte marker GFAP. AKT3 co-localized with NeuN like AKT1 but was also expressed in the stratum radiatum, most likely within dendrites. (b) Higher magnification showed no specific co-localization of AKT1 with GFAP and that certain neurons in the stratum oriens expressed high levels of AKT1 (yellow arrows). AKT2 was mainly expressed in the cell bodies of astrocytes. AKT3 showed high expression levels in neuronal cell bodies and dendrites and some expression in astrocytes.
Figure 2—figure supplement 1
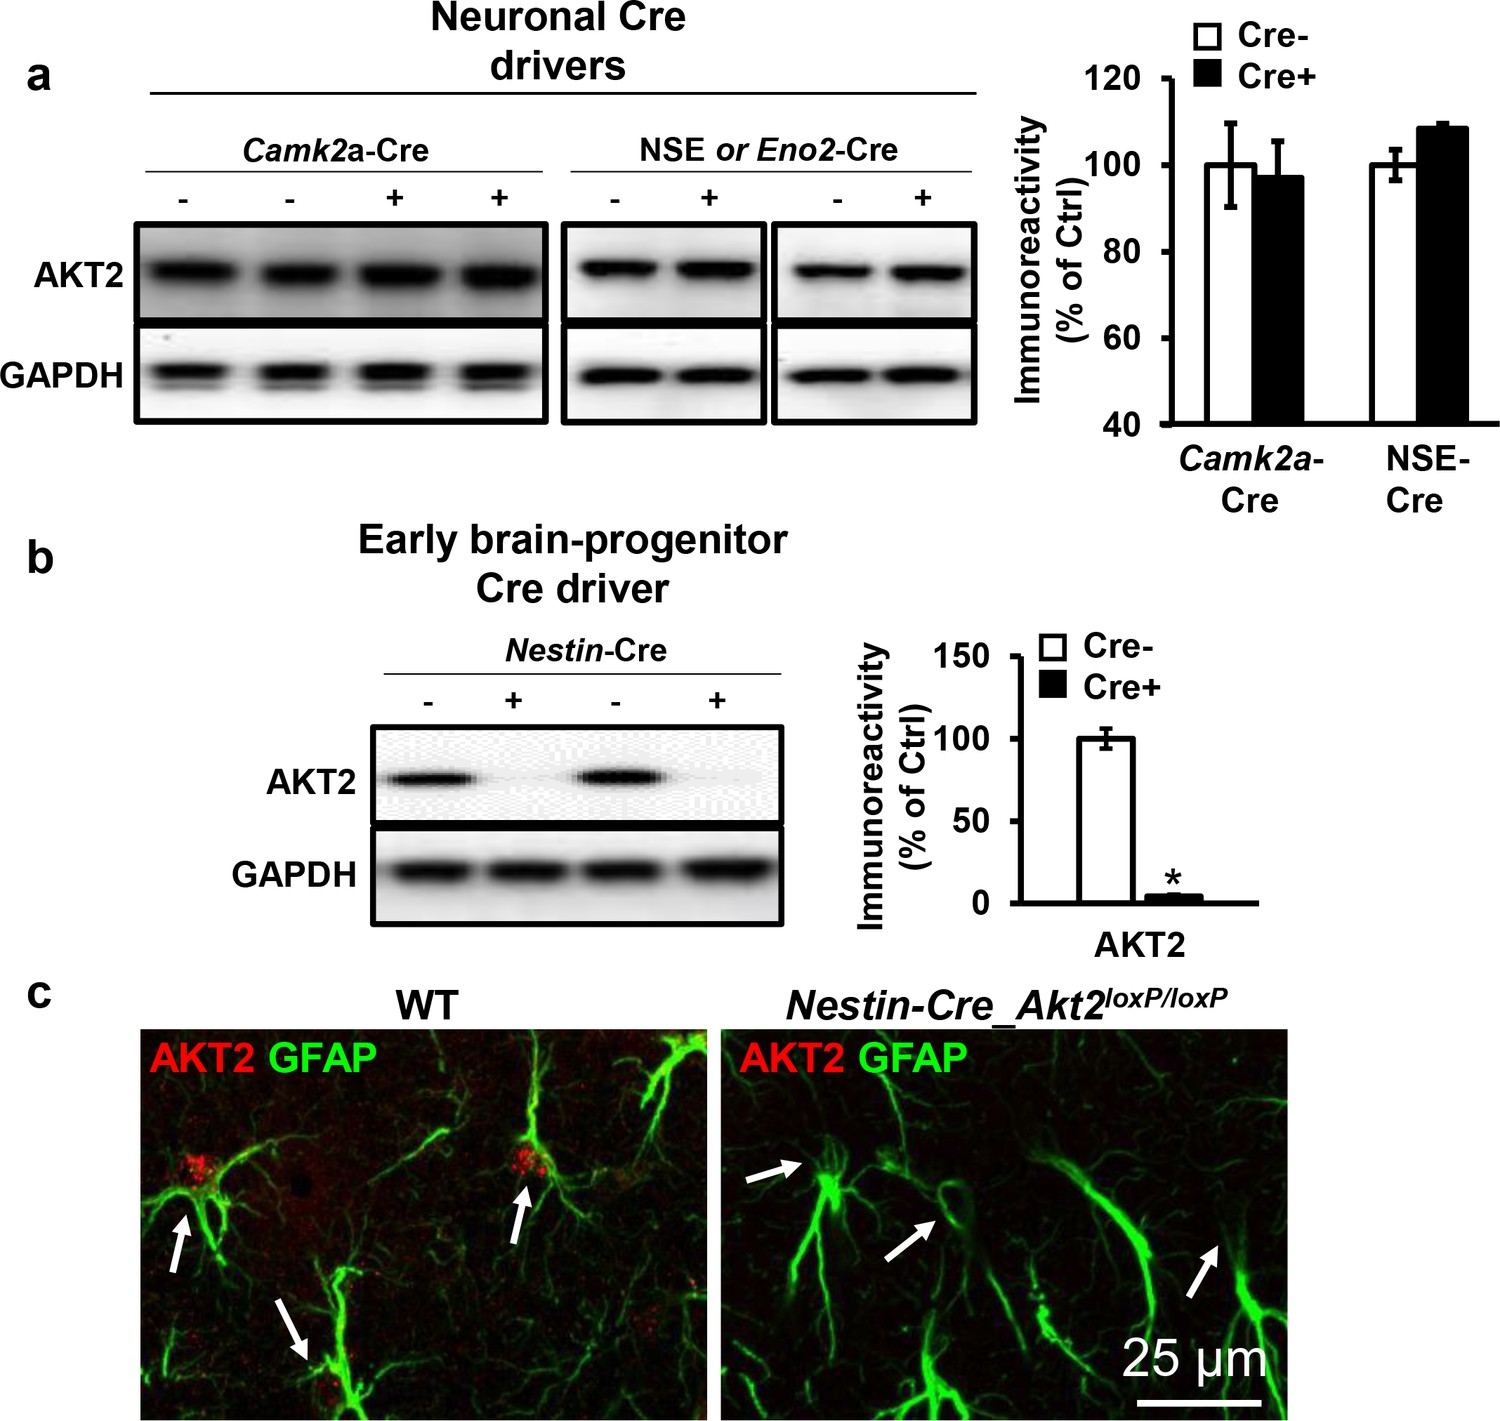
Cell-type-specific expression of AKT2 in the hippocampus.
(a) Akt2 deletion in the hippocampus of Akt2loxP/loxP mice using two different neuronal Cre drivers, Camk2a-Cre (T29) and NSE-Cre, did not affect AKT2 levels (p>0.05), 3–5 mice/group. (b) The early neural progenitor Cre driver Nestin-Cre abolished AKT2 expression in the hippocampus compared with control mice lacking Cre expression (t(7)=4.302, p=0.004), 2 mice/group. (c) Immunostaining of area CA1 also shows complete removal of AKT2 from astrocytes (arrows) in Nestin-Cre-Akt2loxP/loxP mice.
Figure 3 with 1 supplement
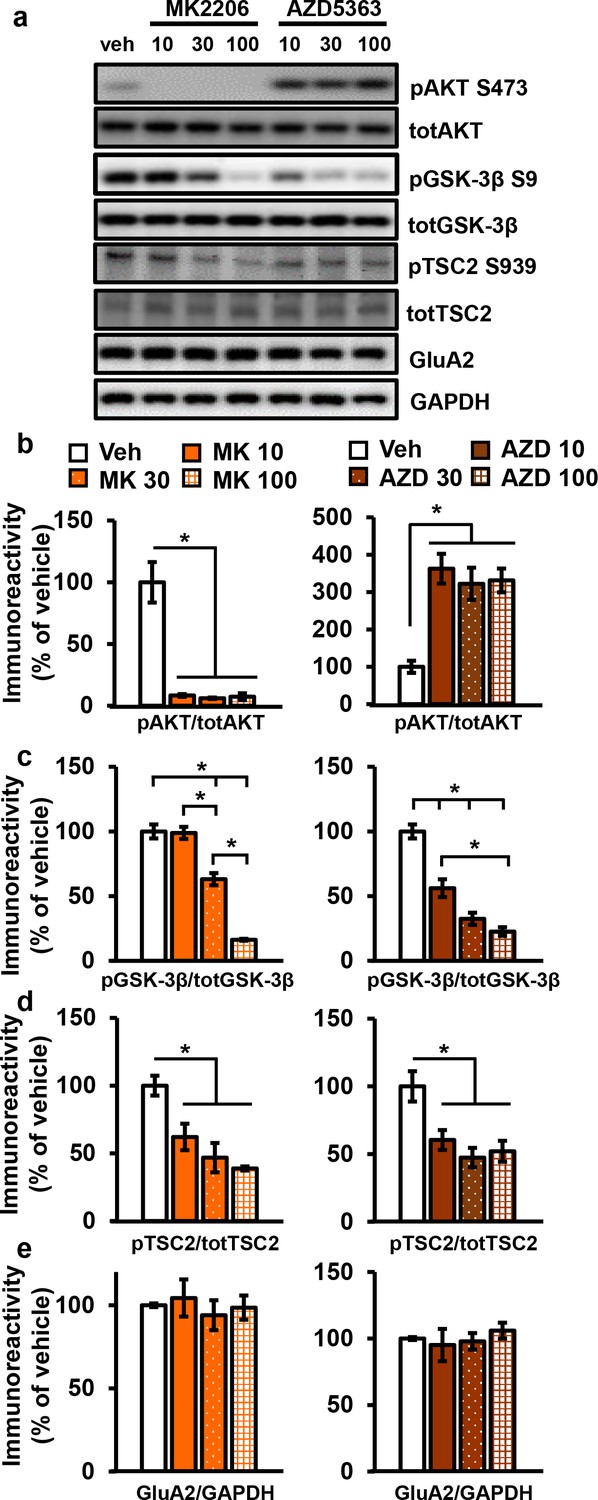
AKT inhibitors MK2206 and AZD5363 effectively inhibit AKT activity in hippocampal slices.
(a) MK2206 and AZD5363 blocked AKT activity effectively, shown by reduced phosphorylation levels of the AKT substrate GSK-3β on serine 9 (pGSK-3β S9), but had different effects on phosphorylation levels of AKT itself on serine 473 (pAKT S473). (b) MK2206 (MK) significantly reduced pAKT S473 levels normalized to total AKT (totAKT) levels, while AZD5363 (AZD) significantly increased pAKT S473 levels (MK F(3.8) = 30.93, p<0.0001; AZD F(3.8) = 12.30, p=0.0023). (c) MK had a dose-dependent effect on pGSK-3β S9 levels normalized to total GSK-3β (totGSK-3β) levels, with no effect at 10 µM but significantly reduced levels at 30 and 100 µM compared with vehicle treatment (MK F(3,8)=74.56, p<0.001; post hoc comparisons: veh vs. MK10 p=0.998; veh vs. MK30 p=0.002; veh vs. MK100 p<0.001, MK10 vs. MK30 p=0.002, MK30 vs. MK100 p<0.001). AZD also had a dose-dependent effect on pGSK3β-S9 levels, with significant reduction at 10 µM in addition to the 30 and 100 µM doses compared with vehicle (AZD F(3,8)=39.69, p<0.001; post hoc comparisons: veh vs. AZD10 p=0.002; veh vs. AZD30 p<0.001; veh vs. AZD100 p<0.001; AZD10 vs. AZD100 p=0.01). (d) MK and AZD treatment significantly reduced phosphorylation of TSC2 at serine 939 (pTSC2 S939) (MK F(3,9)=10.27, p=0.0041; AZD F(3,9)=7.893, p=0.0089). (e) Levels of GluA2 normalized to GAPDH was not significantly altered after MK or AZD treatment (MK F(3, 8)=0.279, p=0.838; AZD F(3,9)=0.378, p=0.771). Veh = vehicle, MK10 = 10 µM, MK30 = 30 µM, MK100 = 100 µM; AZD10 = 10 µM, AZD30 = 30 µM, AZD100 = 100 µM, 3–4 mice/group, *p<0.05.
Figure 3—figure supplement 1
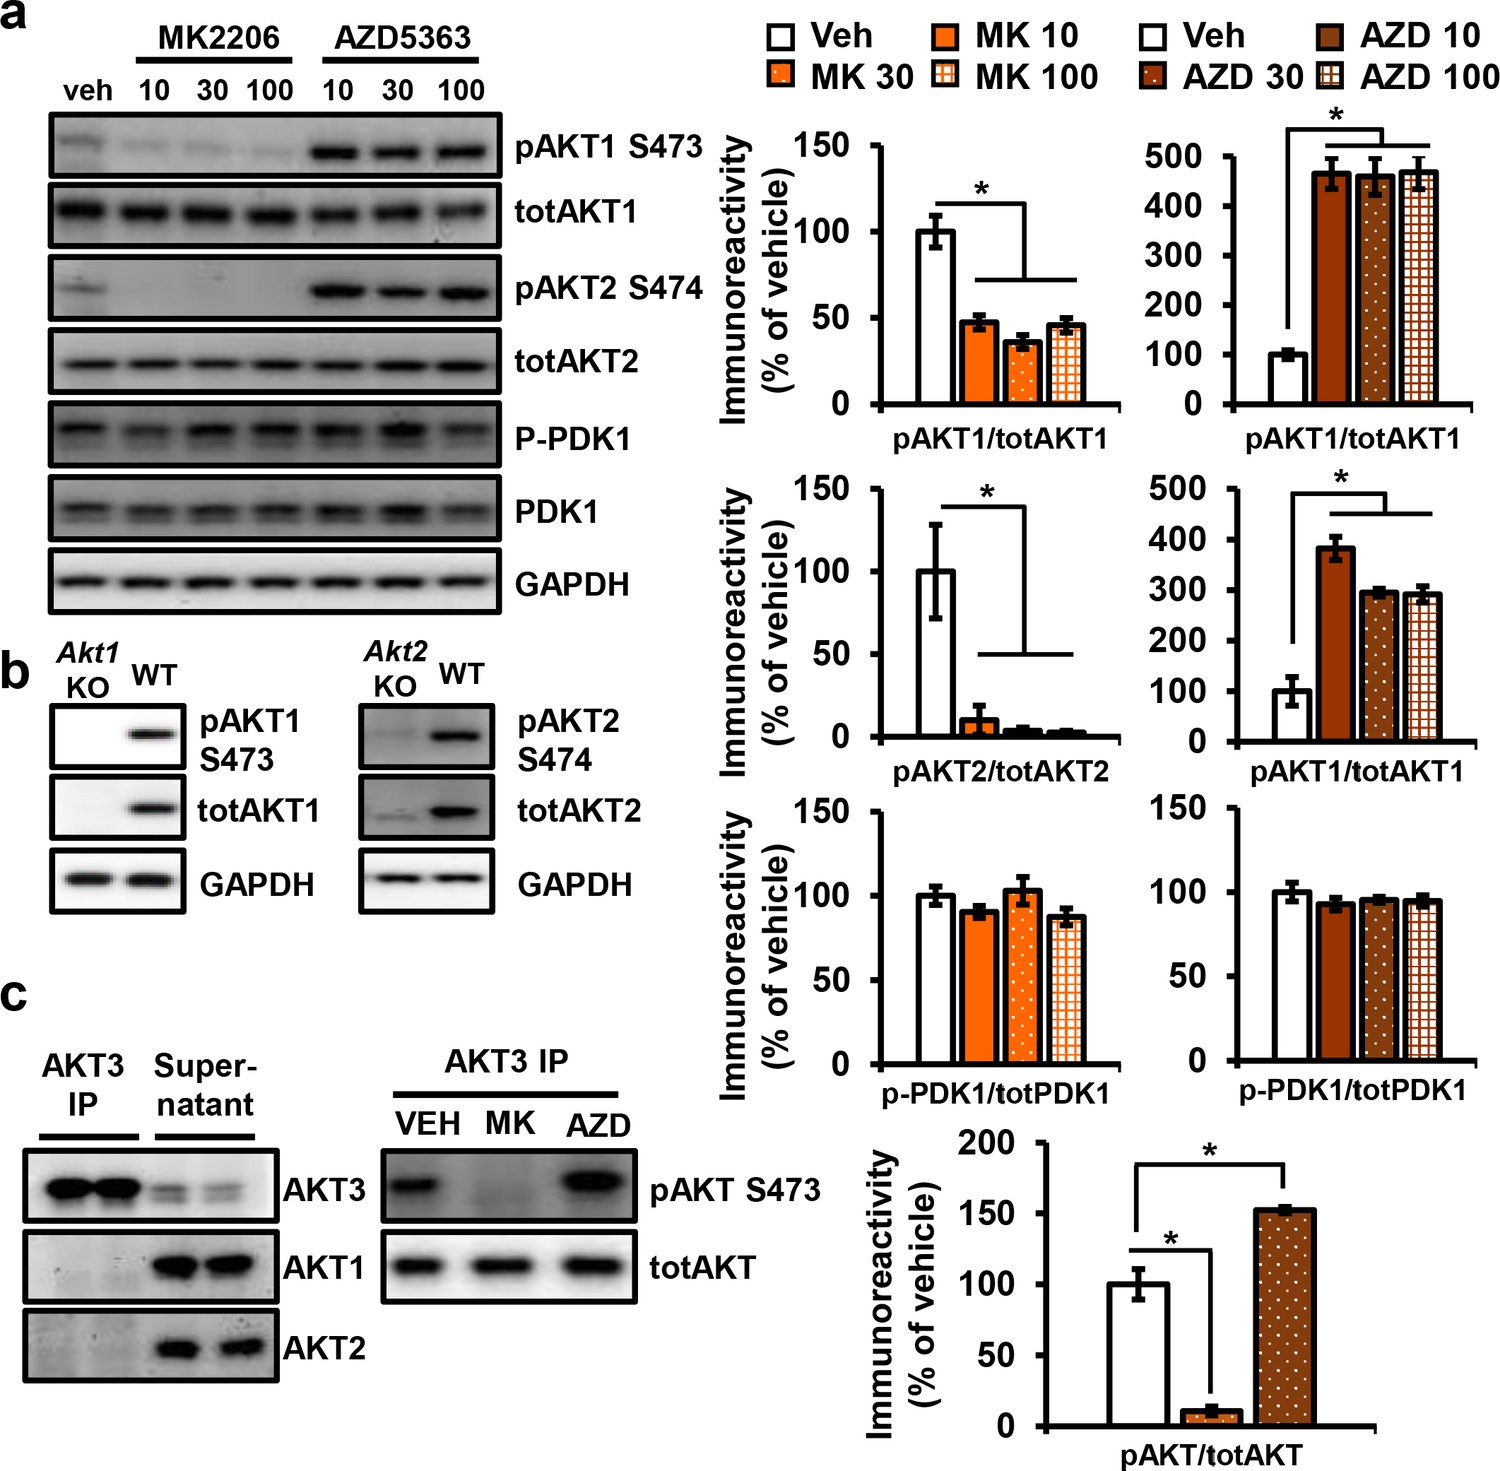
Effect of MK2206 or AZD5363 on phosphorylation of AKT isoforms and PDK1 in the hippocampus.
(a) AKT1 and AKT2 isoforms showed decreased phosphorylation after MK2206 incubation, while AZD5363 resulted in hyperphosphorylation (AKT1: MK2206 F(3, 8)=24.80, p=0.0002, AZD F(3, 8)=37.03, p<0.0001; AKT2: MK2206 F(3, 8)=10.19, p<0.0042, AZD F(3, 8)=34.67, p<0.0001), 3 mice/group. No feedback on PDK1 was observed after incubation with AKT inhibitors (MK2206 F(3, 8)=1.665, p>0.05; AZD5363 F(3, 8)=0.636, p>0.05). (b) Validation of specificity of AKT1 and AKT2 phospho-antibodies. (c) AKT3 immunoprecipitation specifically pulls down AKT3, leaving AKT1 and AKT2 isoforms in the supernatant. Treatment with 30 µM MK2006 or AZD5363 leads to AKT3 dephosphorylation or hyperphosphorylation.
Figure 4 with 4 supplements
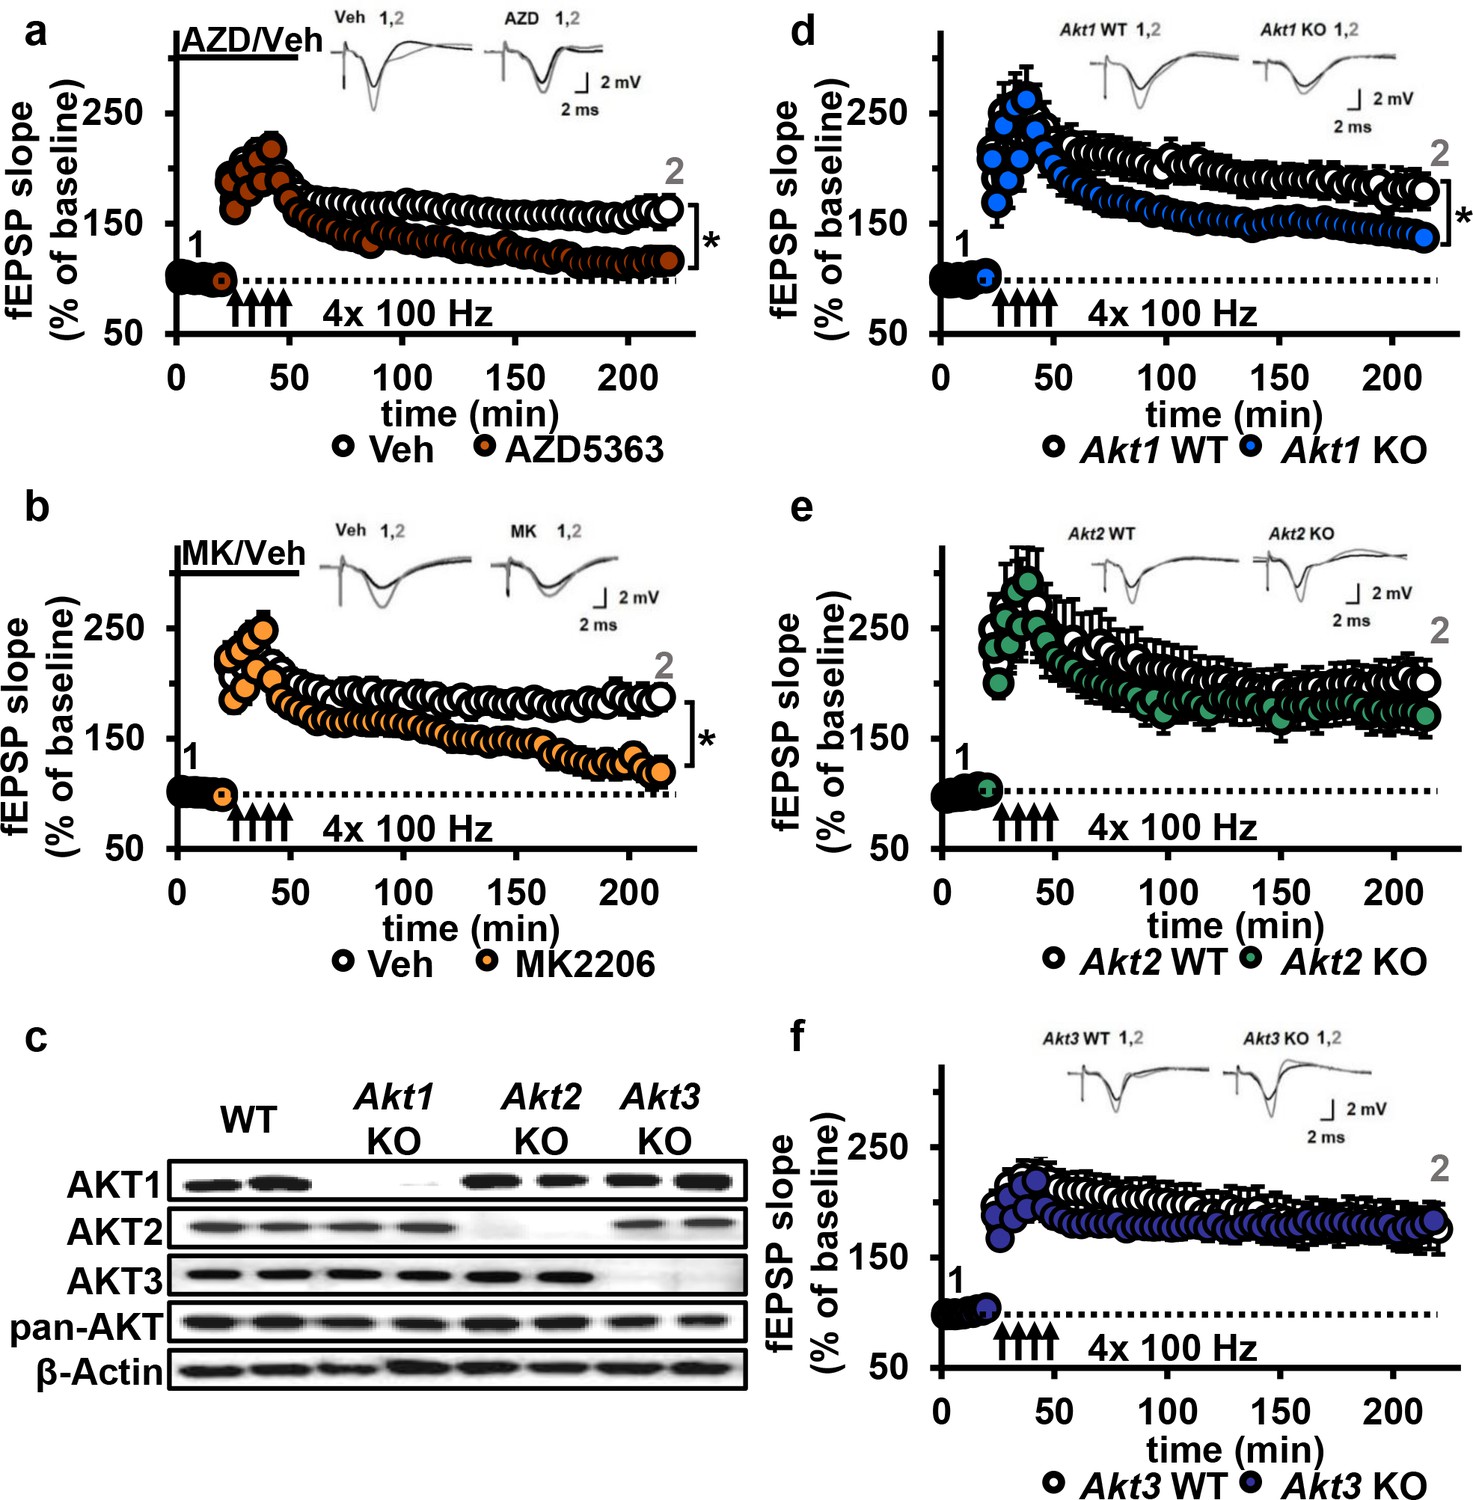
AKT inhibition and Akt1 deletion results in impaired L-LTP.
(a) Inhibiting AKT activity in hippocampal slices with AZD5363 (30 µM) prior to four trains of HFS (100 Hz) resulted in significantly impaired L-LTP in hippocampal area CA1 compared with vehicle treatment (F(1,24)=6.896, p=0.015), n = 13 slices/group, 5 mice/group. (b) AKT inhibitor MK2206 (30 µM) also significantly impaired L-LTP compared with vehicle treatment (F(1,13)=18.639, p<0.001), n = 7–8 slices/group, 4 mice/group. (c) Western blot validation of AKT1, AKT2 and AKT3 removal using cortical tissue from Akt isoform-specific KO mice. β-actin, loading control. (d) Akt1 KO mice showed significantly impaired L-LTP in hippocampal area CA1 compared with WT mice (F(1,28)=5.049, p=0.033), n = 15 slices/group, 6 mice/group. (e) Akt2 KO mice displayed similar levels of L-LTP to WT mice (F(1,20)=1.121, p=0.302), n = 10–12 slices/group, 4–5 mice/group. (f) Akt3 KO mice showed similar levels of L-LTP to WT mice (F(1,20)=0.33, p=0.857), n = 8–14 slices/group, 5–7 mice/group. *p<0.05.
Figure 4—figure supplement 1
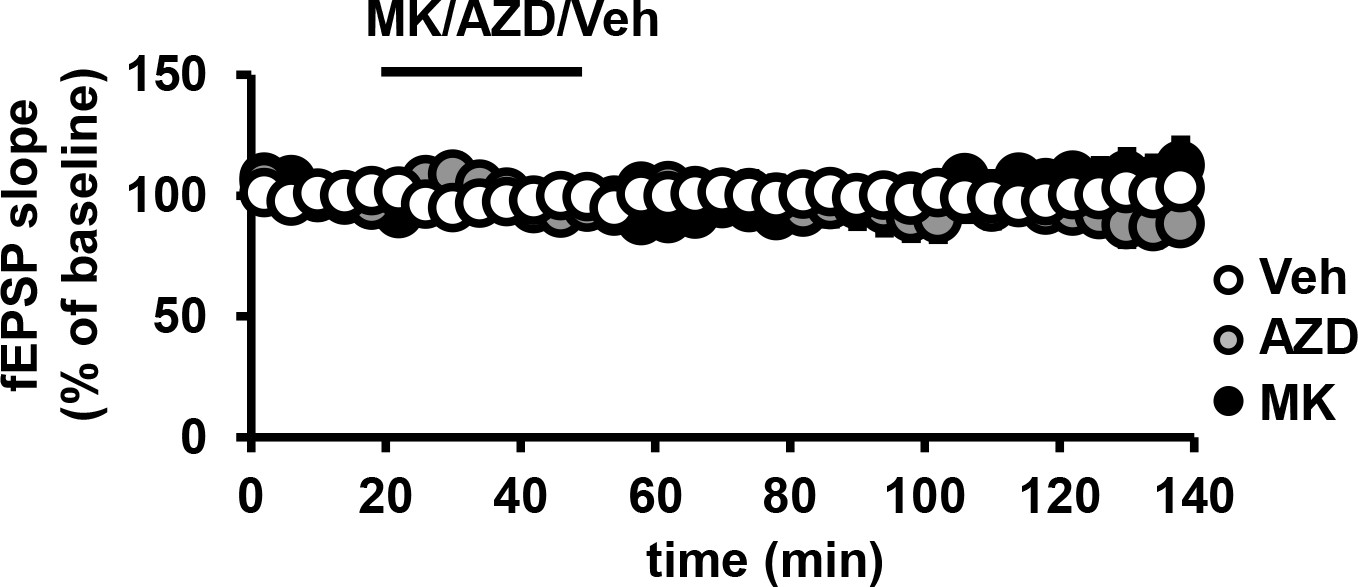
Effect of MK2206 or AZD5363 on basal fEPSPs in the hippocampus.
Baseline recordings of field excitatory postsynaptic potentials (fEPSPs) in CA1 remain stable after incubation with MK2206 or AZD5363 (p>0.05), n= 9–11 slices/group, 4 mice/group respectively, (F(2,6)=120.3, p<0.0001), 3 mice/group.
Figure 4—figure supplement 2
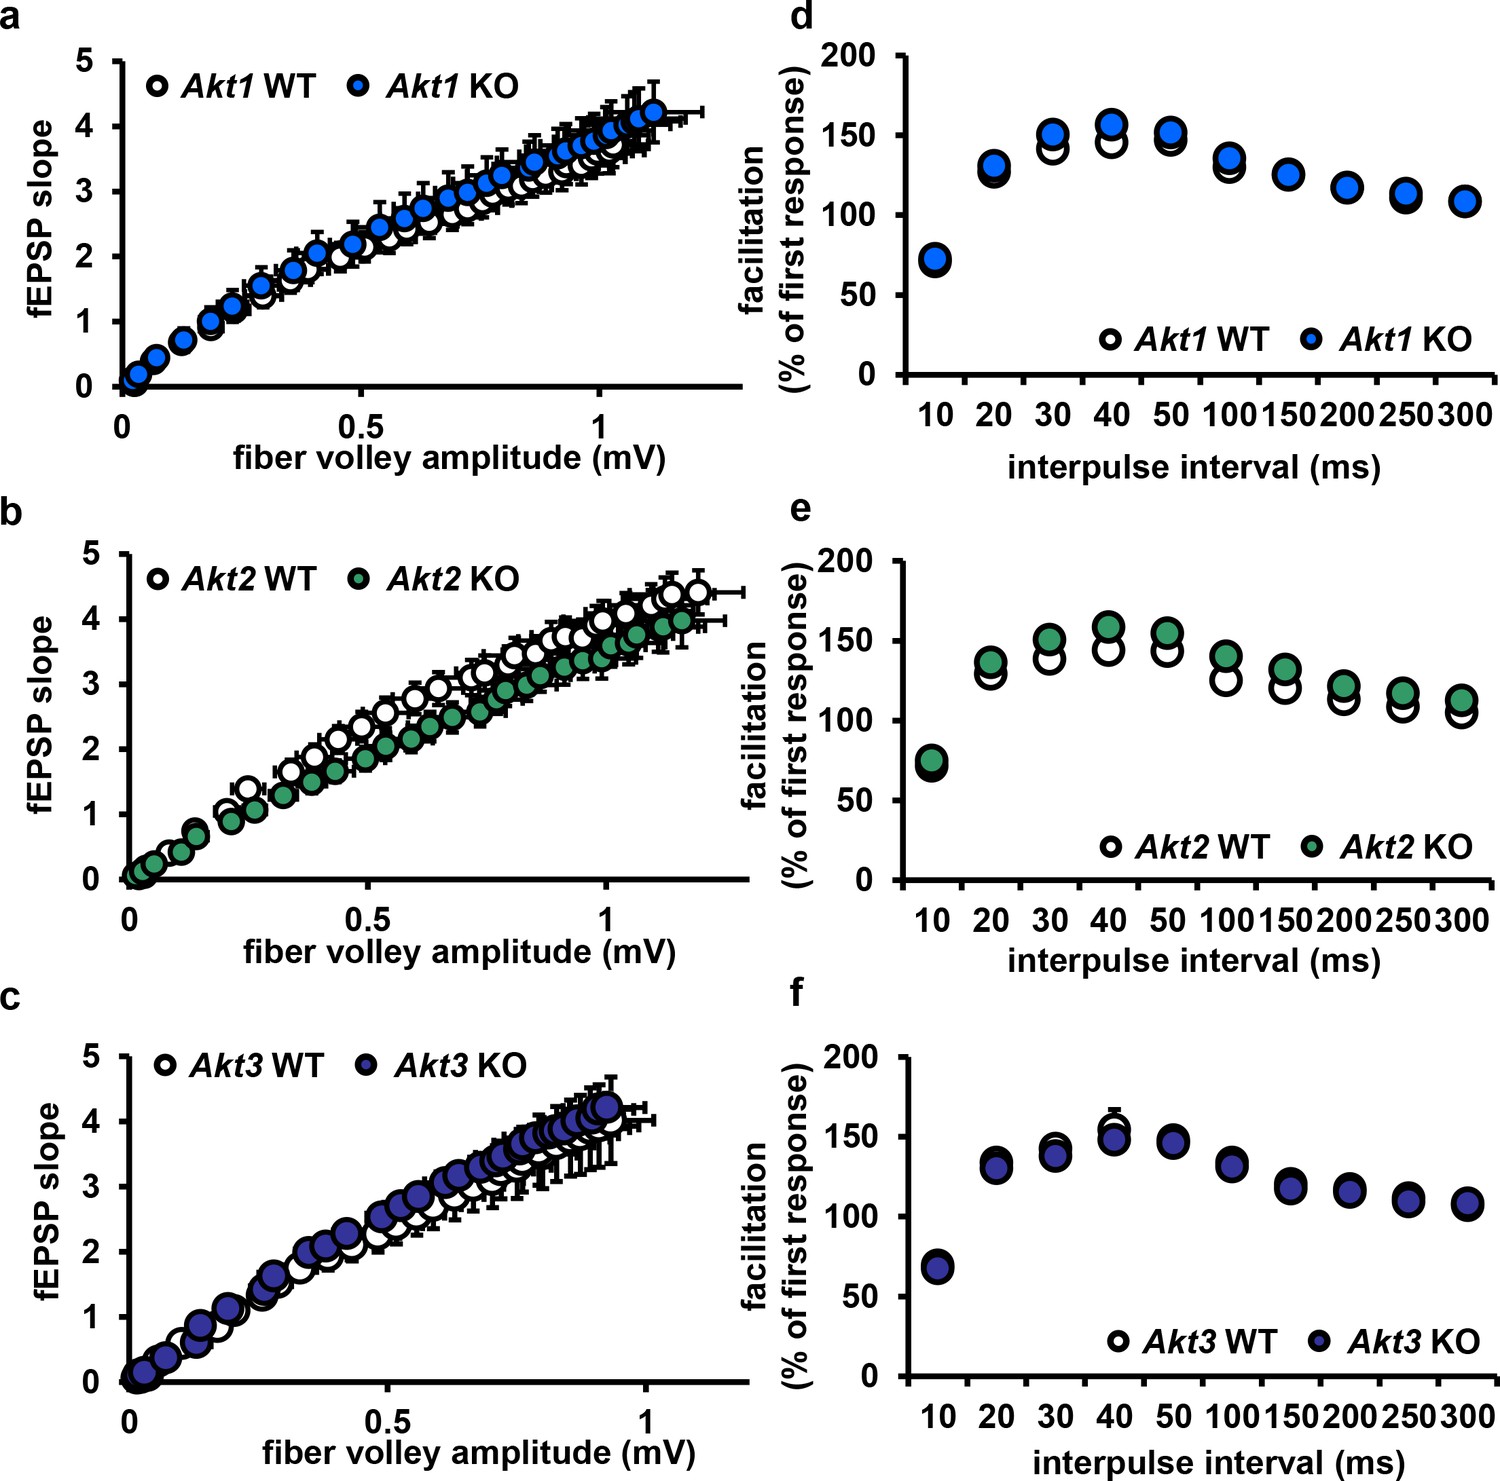
Deletion of single Akt isoforms has no effect on basal transmission or presynaptic plasticity.
(a–c) Hippocampal slices from Akt1, Akt2 or Akt3 KO mice show normal basal transmission measured by input-output responses compared to WT mice (p>0.05). (d–f) Akt1, Akt2 or Akt3 KO slices show normal presynaptic plasticity measured by paired-pulse facilitation responses compared to WT slices (p>0.05), n = 11–19 slices, 5–7 mice/group.
Figure 4—figure supplement 3
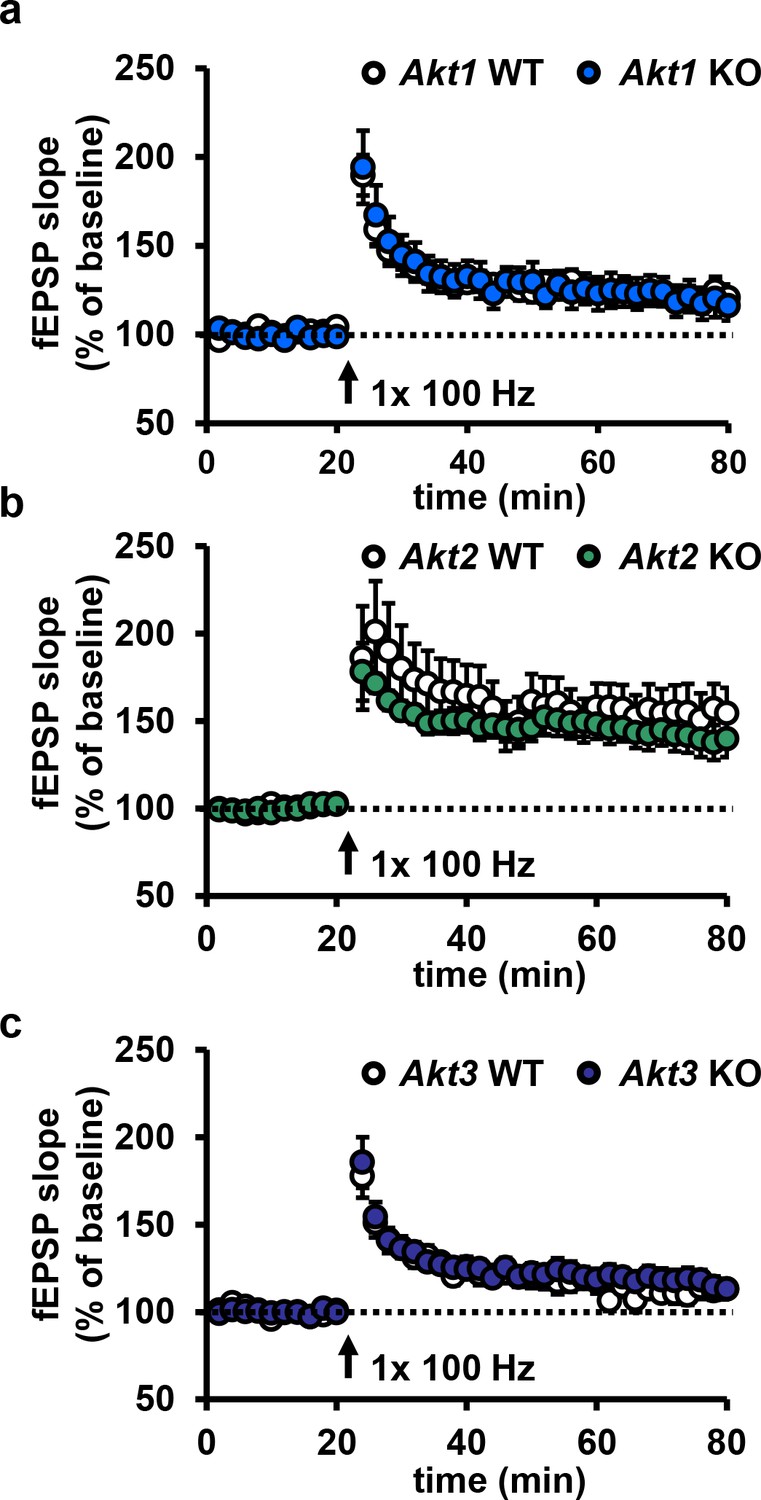
Deletion of single Akt isoforms have no effect on E-LTP.
(a–c) Hippocampal slices from Akt1, Akt2 or Akt3 KO mice show normal E-LTP (p>0.05), n = 13–16 slices/group, 5–6 mice/group.
Figure 4—figure supplement 4
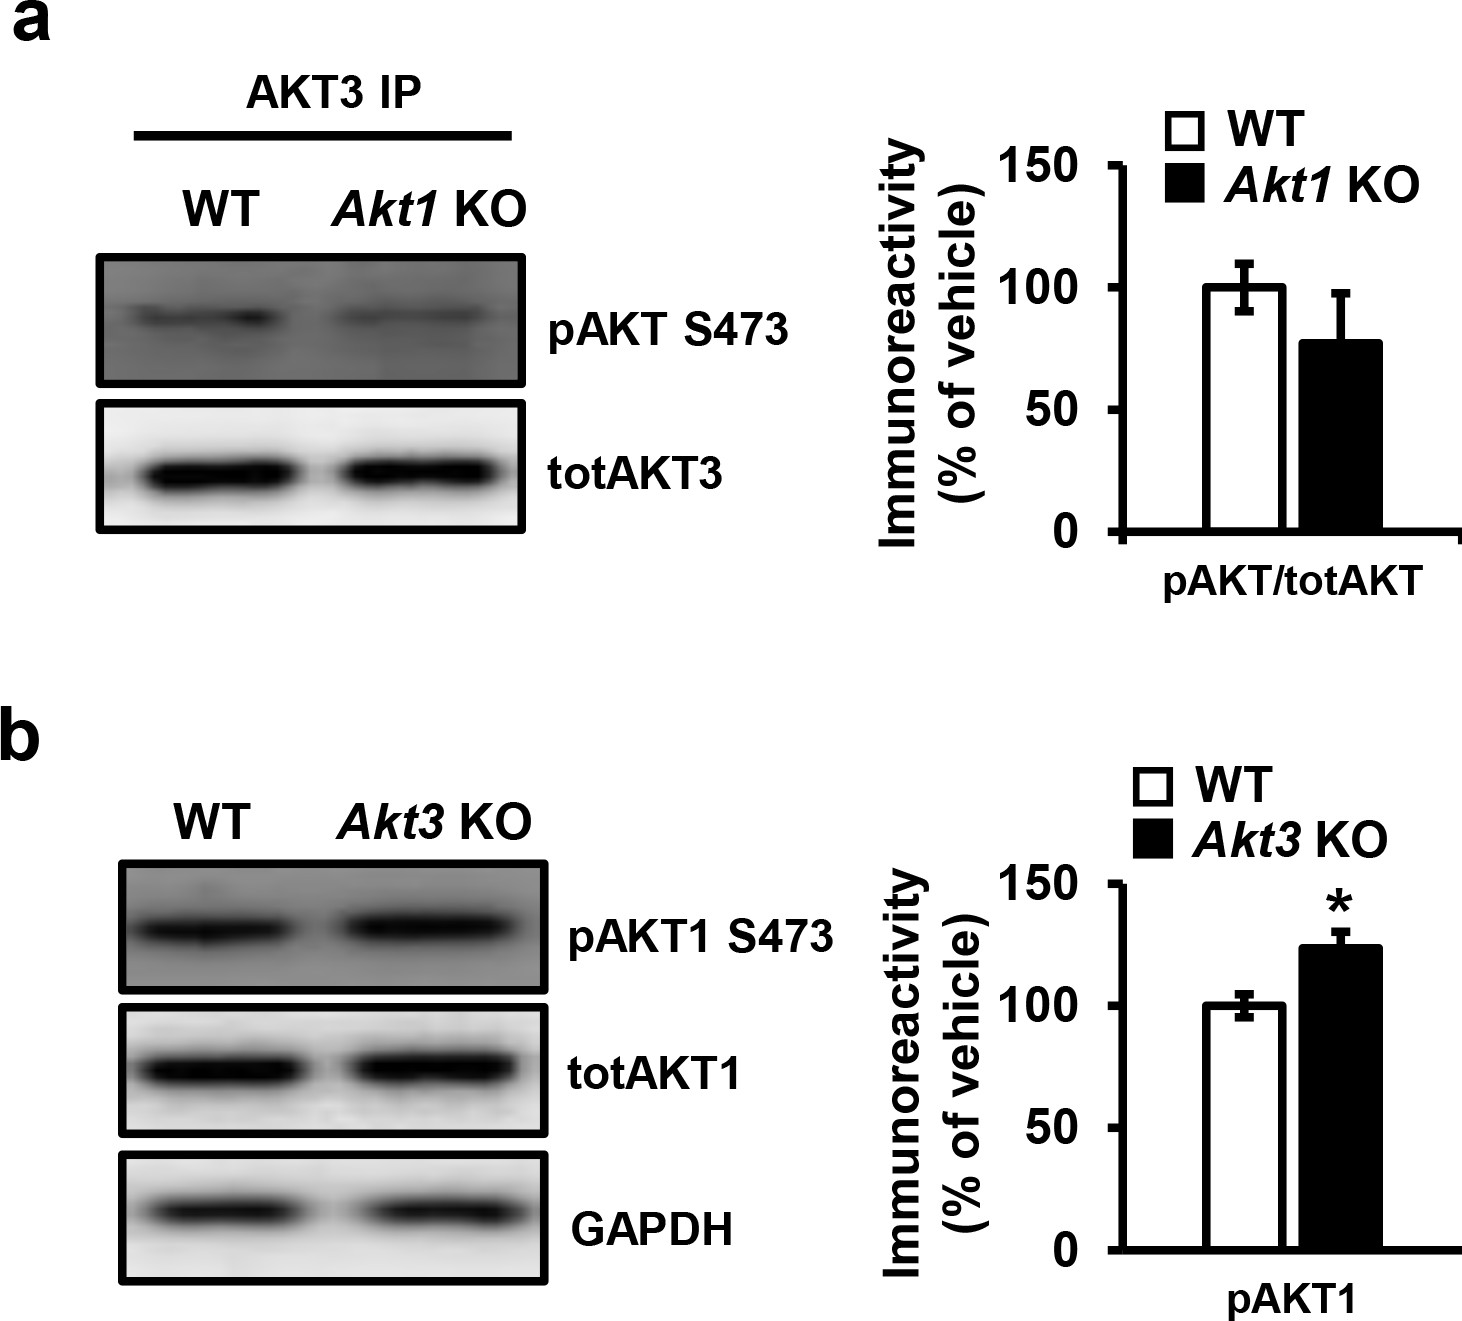
Single isoform phosphorylation in Akt1 and Akt3 KO mice.
(a) Phosphorylation of AKT3 in Akt1 KO mice is not significantly different from WT mice (t(21)=2.228, p=0.338). (b) Akt3 KO mice show significantly increased AKT1 phosphorylation compared to WT mice (t(21)=2.855, p=0.021). 5–6 mice/group, *p<0.05.
Figure 5
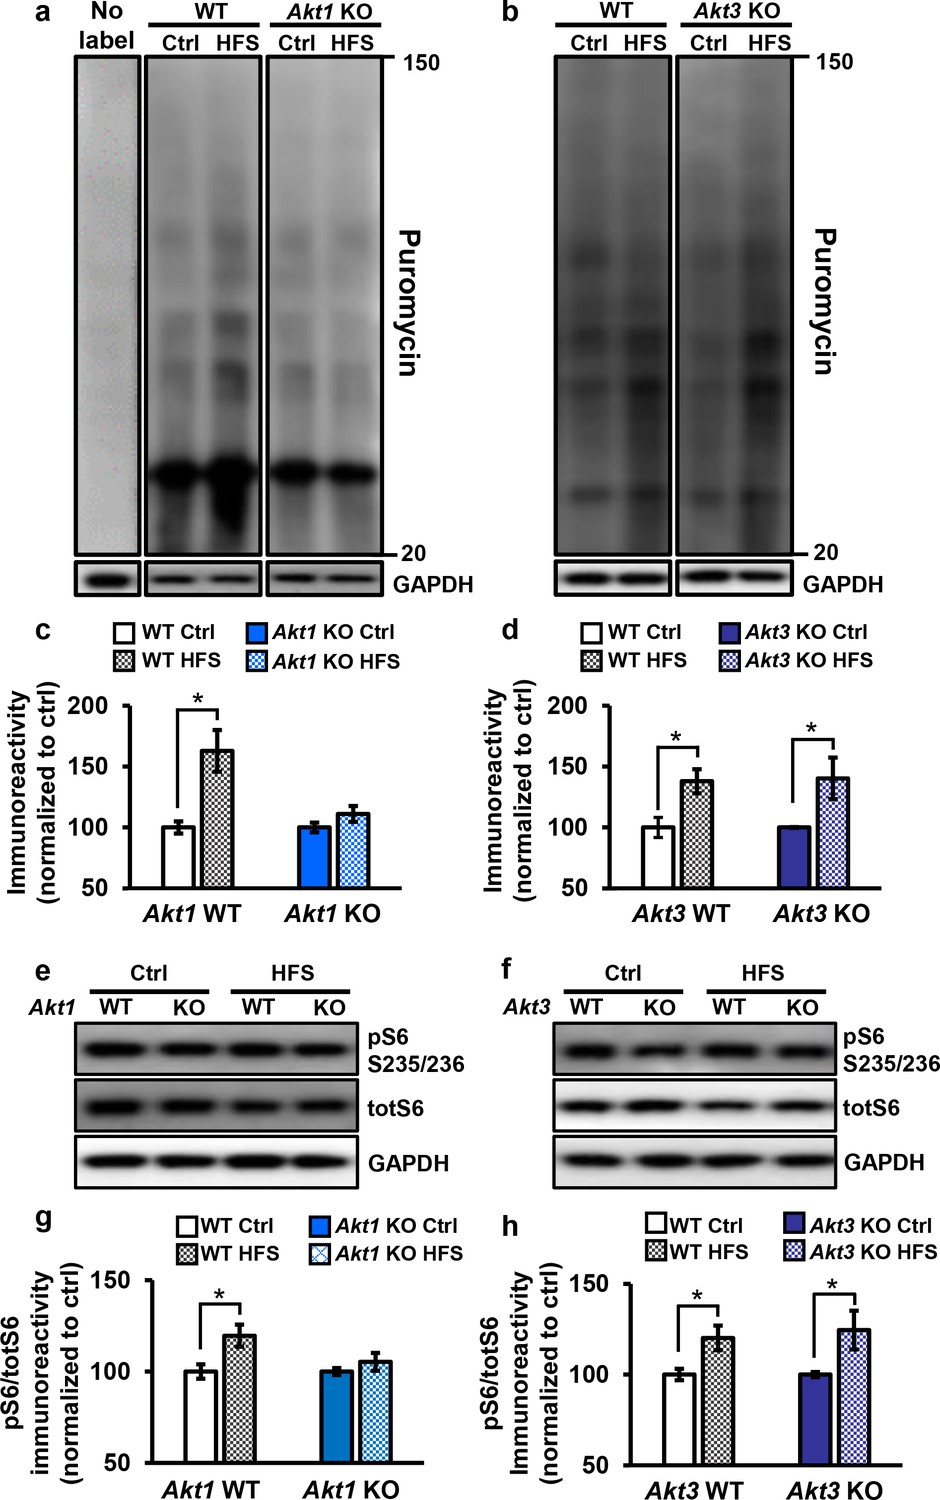
Only Akt1 KO mice show an impaired protein synthesis response after tetanic stimulation.
(a,c) Puromycin labeling of newly synthesized proteins showed that four trains of HFS in area CA1 to induce L-LTP results in increased protein synthesis levels compared with no stimulation (Ctrl) in WT hippocampal slices (t(14)= −3.52, p=0.005), while stimulated Akt1 KO slices fail to increase protein synthesis from unstimulated levels (t(14)=-1.45, p=0.167). GAPDH, loading control. (b,d) Akt3 KO hippocampal slices showed a normal increase in protein synthesis after four trains of HFS (Akt3 WT Ctrl vs. HFS t(12)=-2.75, p=0.018; Akt3 KO Ctrl vs. HFS t = −2.20, p=0.047). GAPDH, loading control. (e,g) Akt1 KO slices failed to show an increase in S6 phosphorylation (pS6 S235/236) normalized to total S6 (totS6) levels after tetanic stimulation (Akt1 WT Ctrl vs. HFS t(14)=-2.71, p=0.016; Akt1 KO Ctrl vs. HFS t(14)=-1.01, p=0.33). (f,h) Akt3 KO slices showed a normal increase in pS6 S235/236 levels after tetanic stimulation (Akt3 WT Ctrl vs. HFS t(14)=-2.92, p=0.01, Akt3 KO Ctrl vs. HFS t(14)=-2.59, p=0.02). n= 7–11 slices/group, 4–6 mice/group, *p<0.05.
Figure 6
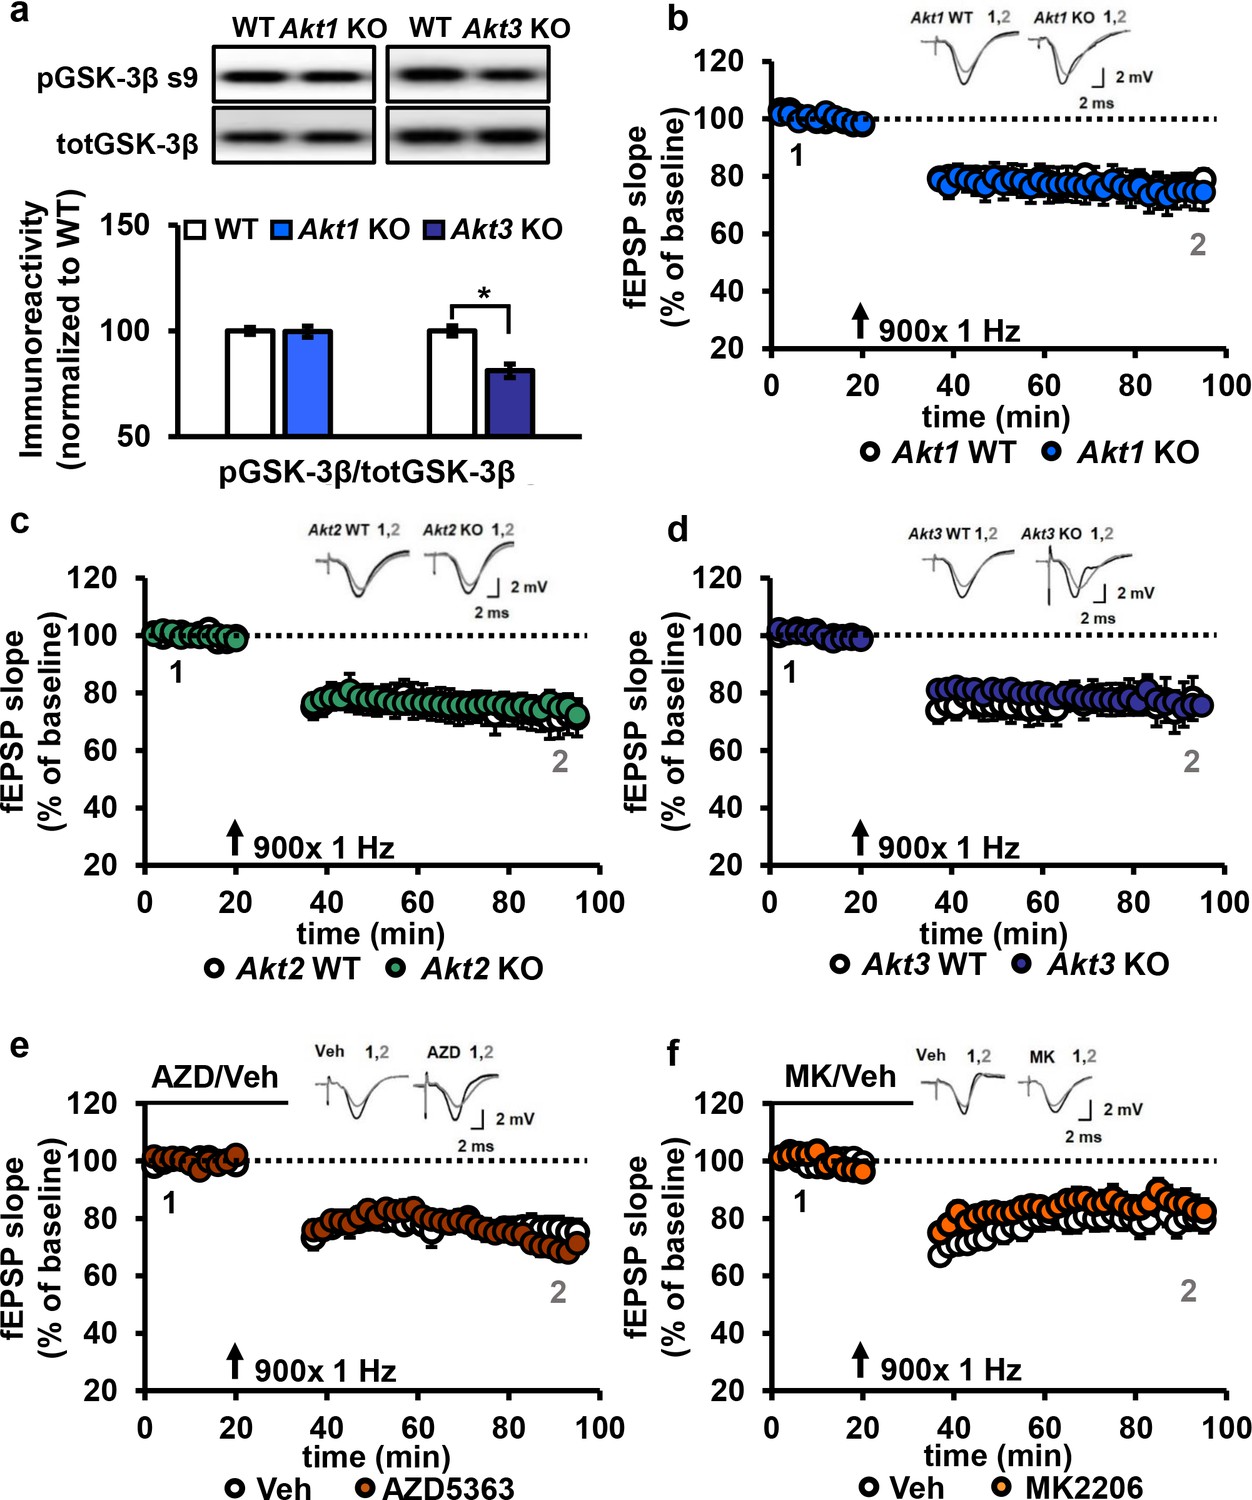
AKT is not involved in LFS-LTD.
(a) pGSK-3β levels were significantly reduced in the hippocampus of Akt3 KO mice but normal in Akt1 KO mice (Akt3 KO t(20)=-4.725, p<0.001; Akt1 KO t(14)=0.104, p=0.918), 4–6 mice/group. (b–d) Hippocampal slices from Akt1 KO, Akt2 KO or Akt3 KO mice showed normal LFS-LTD induced by 900 stimuli of 1 Hz compared to WT slices (p>0.05 for all genotypes), n = 12–20 slices/group, 5–7 mice/group. (e) Blocking AKT activity in hippocampal slices with AZD5363 (30 µM) prior to 900 stimuli of 1 Hz did not affect LFS-LTD compared to vehicle-treated slices (p>0.05), n = 12–13 slices/group, 6 mice/group. (f) AKT activity blocked by MK2206 (30 µM) also resulted in normal LFS-LTD in hippocampal slices compared to vehicle-treated slices (p>0.05), n = 10–12 slices/group, 5 mice/group.
Figure 7
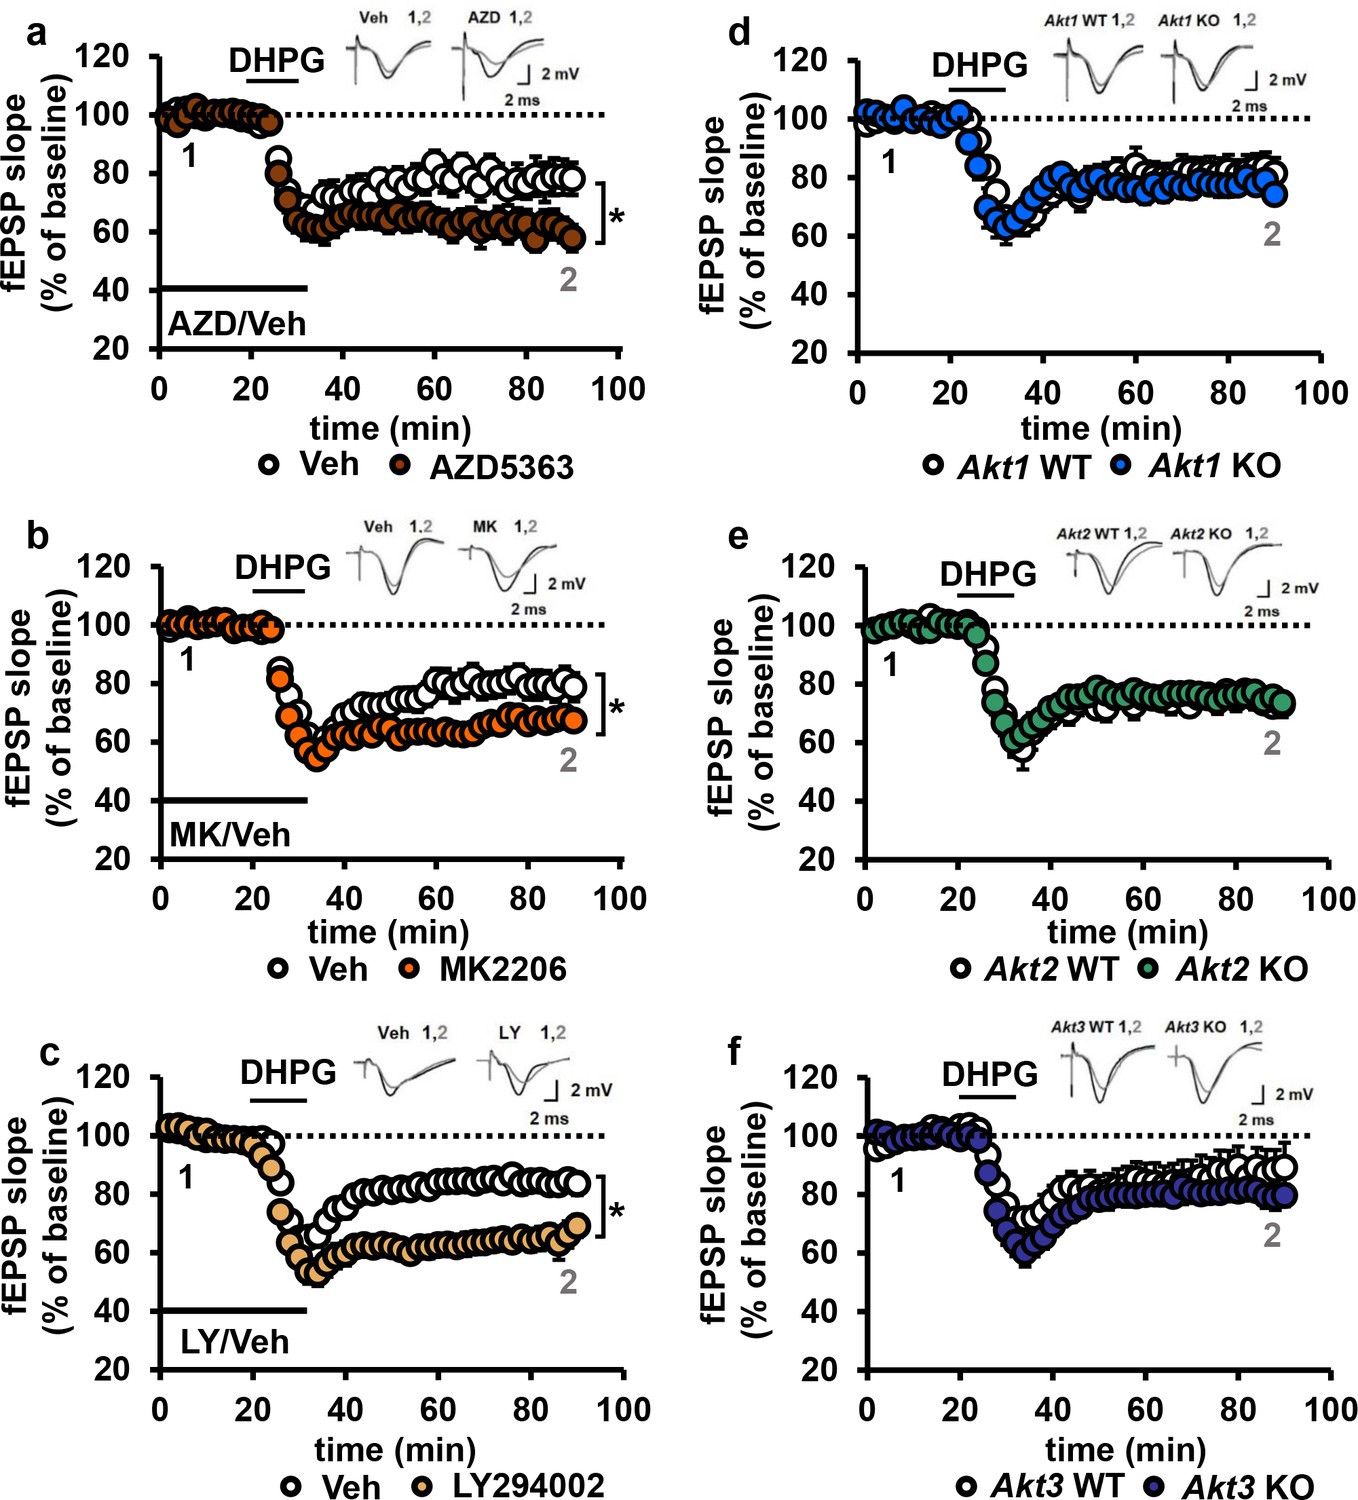
Blocking AKT activity leads to enhanced mGluR-LTD.
(a,b) Blocking AKT activity using AZD5363 or MK2206 resulted in enhanced mGluR-LTD induced with 3,5 RS-DHPG (100 µM) in hippocampal area CA1 (AZD F(1,23)=5.010, p=0.035; MK F(1,40)=7.216, p=0.010), n = 12–20 slices/group, 5–6 mice/group. (c) Blocking PI3K using LY294002 resulted in enhanced mGluR-LTD (F(1,27)=10.809, p=0.003), n = 13–16 slices/group, 7–8 mice/group. (d–f) Akt1, Akt2 or Akt3 KO mice show normal mGluR-LTD compared to WT controls (p>0.05), n = 13–20 slices/group, 5–7 mice/group. *p<0.05.
Figure 8 with 1 supplement
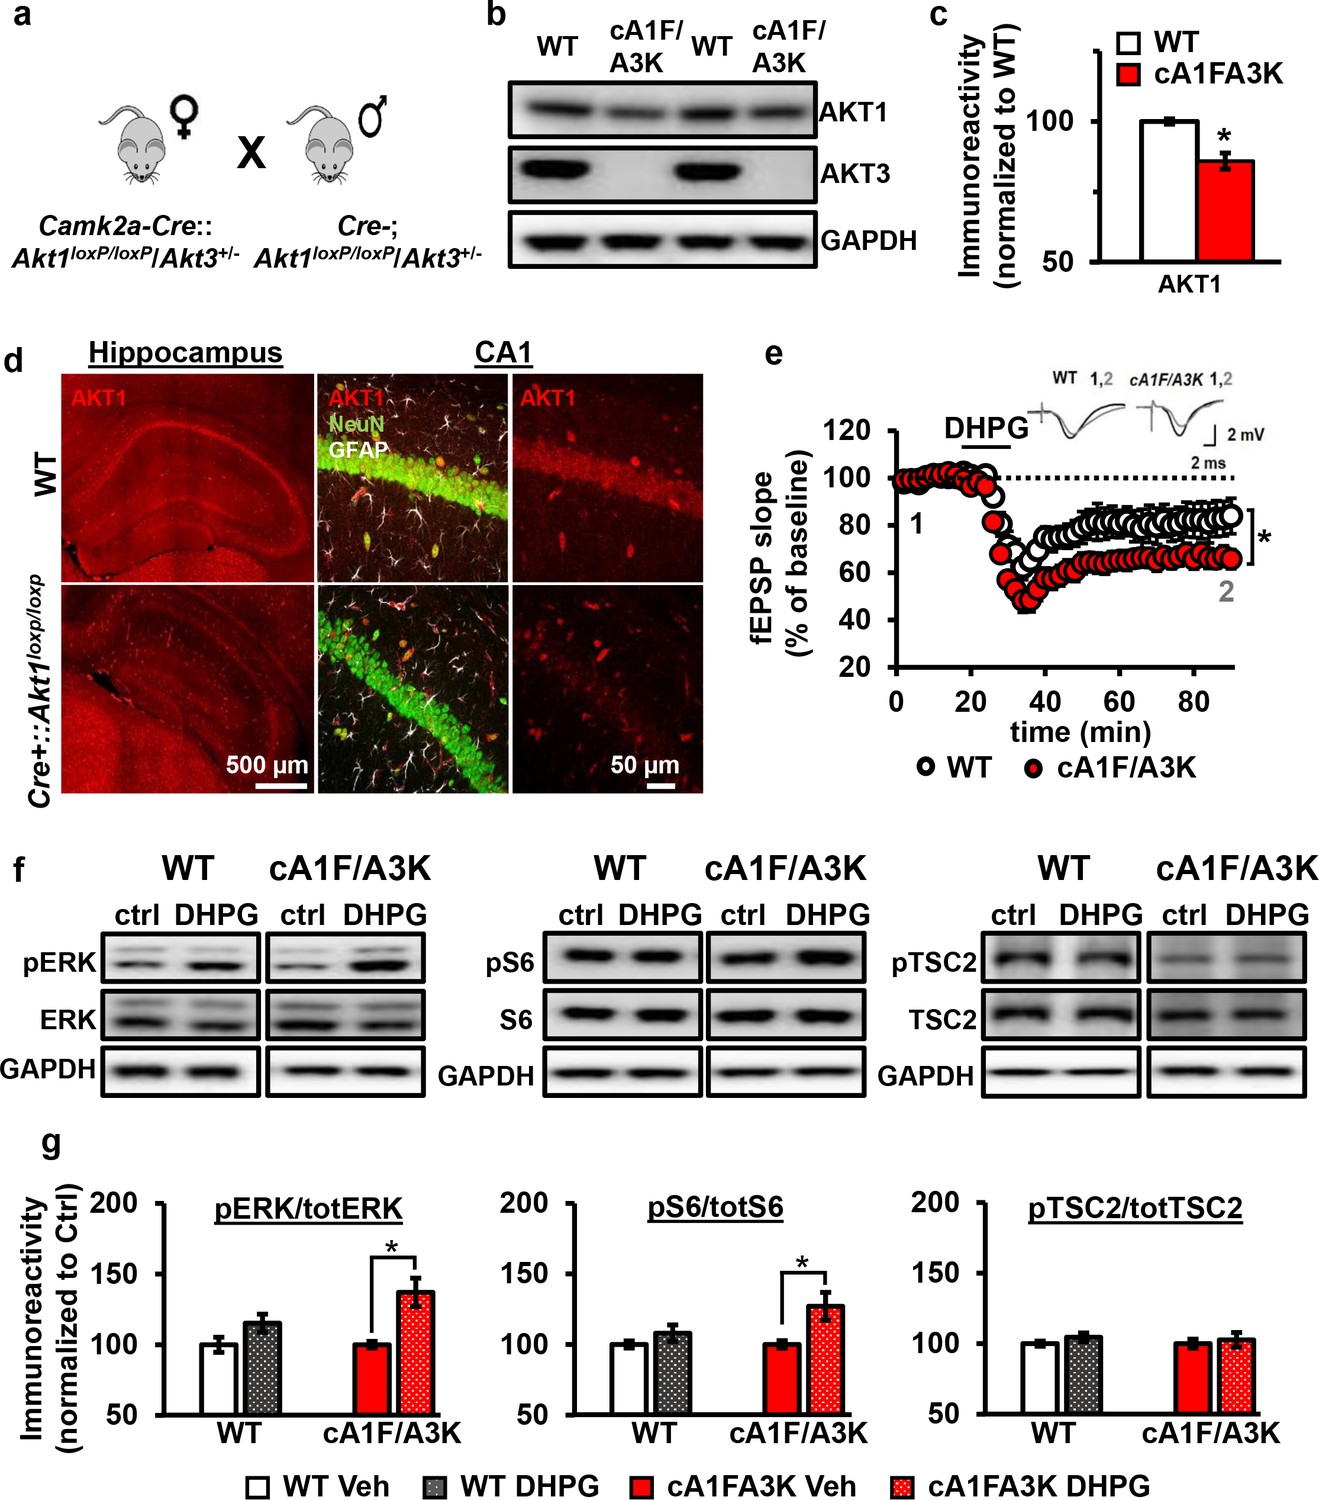
AKT1 and AKT3 are involved in mGluR-LTD.
(a) Double Akt1 and Akt3 mutant (cA1F/A3K) mice with Cre-mediated removal of both Akt1 alleles in the Akt3 KO background were generated with WT littermate controls by breeding Camk2a-Cre::Akt1loxP/+/Akt3+/- female mice with Akt1loxP/+/Akt3+/- males. (b,c) Western blot analysis showing significantly reduced AKT1 levels and no AKT3 expression in the hippocampus of cA1F/A3K mice compared with WT mice (AKT1 levels: t(6)=3.802, p=0.008). (d) Immunostaining confirming reduced neuronal AKT1 expression by Camk2a-driven Cre removal of Akt1 in the hippocampus, especially in the pyramidal cell body layer of CA1. (e) mGluR-LTD is enhanced in cA1F/A3K hippocampal slices (F(1,30)=7.923, p=0.009), n = 16 slices/group, 5 mice/group. (f,g) Western blot analysis showing significantly increased phosphorylation of ERK Thr202/Tyr204 and S6 S235/236 but not TSC2 S939 in cA1F/A3K hippocampal slices at 60 min post-DHPG, while WT slices had no differences (pERK: WT Ctrl vs. DHPG t(22)=1.814, p=0.083, cA1F/A3K Ctrl vs. DHPG t(14)=2.918, p=0.011; pS6: WT Ctrl vs. DHPG t(22)=1.252, p=0.224, cA1F/A3K Ctrl vs. DHPG t(14)=2.647, p=0.019; pTSC2: WT Ctrl vs. DHPG t(20)=1.252, p=0.225, cA1F/A3K Ctrl vs. DHPG t(14)=0.374, p=0.714). n= 8–12 slices/group, 4–6 mice/group, *p<0.05.
Figure 8—figure supplement 1
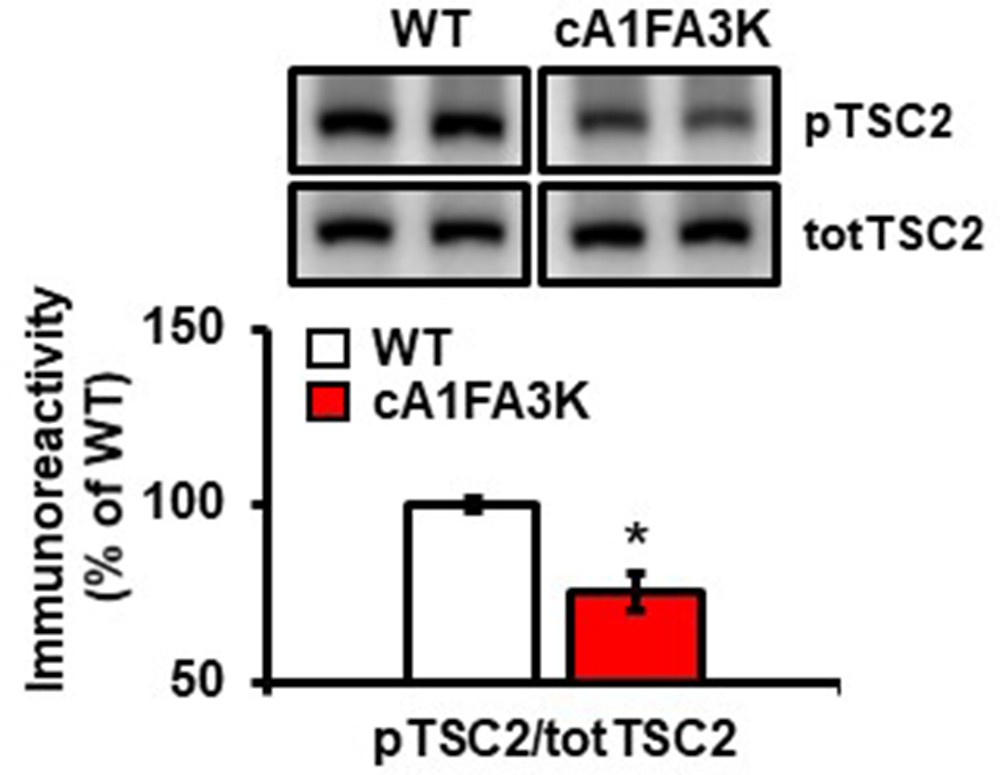
cA1FA3K mutant mice show decreased phosphorylation of TSC2 S939 under basal conditions (pTSC2: t(19)=4.401, p=0.0004; 4–6 mice/group, *p<0.05.
https://doi.org/10.7554/eLife.30640.016
Author response image 1
Tables
Key resources table
| Reagent type (species) or resource | Designation | Source or reference | Identifiers | Additional information |
|---|---|---|---|---|
| Antibody | Rabbit anti-AKT1 (Western blot) | Cell Signaling | Cat# 2938; RRID:AB_915788 | 1:1000 |
| Antibody | Rabbit anti-AKT1 (Immunostaining) | Cell Signaling | Cat# 75692; RRID:AB_2716309 | 1:100 |
| Antibody | Rabbit anti-AKT1 phospho serine 473 | Cell Signaling | Cat# 9081; RRID:AB_11178946 | 1:1000 |
| Antibody | Mouse anti-AKT2 (Western blot) | LSBio | Cat# LS-C156232; RRID:AB_2716310 | 1:1000 |
| Antibody | Rabbit anti-AKT2 (Immunostaining) | Cell Signaling | Cat# 2964; RRID:AB_331162 | 1:100 |
| Antibody | Rabbit anti-AKT2 phospho serine 474 | Cell Signaling | Cat# 8599; RRID:AB_2630347 | 1:1000 |
| Antibody | Rabbit anti-AKT3 (Western blot) | Cell Signaling | Cat# 14293; RRID:AB_2629491 | 1:1000 |
| Antibody | Mouse anti-AKT3 (Western blot) | Cell Signaling | Cat# 8018; RRID:AB_10859371 | 1:1000 |
| Antibody | Rabbit anti-AKT3 (Immunostaining and immunoprecipitation) | Cell Signaling | Cat# 14982; RRID:AB_2716311 | 1:100 Immunostaining1:50 immunoprecipitation |
| Antibody | Rabbit anti-AKT phospho serine 473 | Cell Signaling | Cat# 3787; RRID:AB_331170 | 1:1000 |
| Antibody | Rabbit anti-AKT | Cell Signaling | Cat# 4685; RRID:AB_2225340 | 1:2000 |
| Antibody | Rabbit anti-TSC2 S939 phospho serine 939 | Cell Signaling | Cat# 3615; RRID:AB_2207796 | 1:1000 |
| Antibody | Rabbit anti-TSC2 | Cell Signaling | Cat# 3635; RRID:AB_10692893 | 1:1000 |
| Antibody | Rabbit anti-PDK1 phospho serine 241 | Cell Signaling | Cat# 3061; RRID:AB_2161919 | 1:3000 |
| Antibody | Rabbit anti-PDK1 | Cell Signaling | Cat# 3062; RRID:AB_2236832 | 1:2000 |
| Antibody | Rabbit anti-GAPDH | Cell Signaling | Cat# 2118; RRID:AB_561053 | 1:10000 |
| Antibody | Mouse anti-β actin | Abcam | Cat# 8226; RRID:AB_306371 | 1:10000 |
| Antibody | Mouse anti-NeuN | Novus | Cat# NBP1-92693; RRID:AB_11036146. | 1:1000 |
| Antibody | Chicken anti-GFAP | PhosphoSolutions | Cat# 621-GFAP; RRID:AB_2492125 | 1:1000 |
| Antibody | Rabbit anti-GSK-3β phospho serine 9 | Cell Signaling | Cat# 9323; RRID:AB_2115201 | 1:3000 |
| Antibody | Rabbit anti- GSK-3β | Cell Signaling | Cat# 9315; RRID:AB_490890 | 1:3000 |
| Antibody | Mouse anti-GluA2 | NeuroMAB | Clone N355/1; RRID:AB_2315839 | 1:1000 |
| Antibody | Rabbit anti-S6 phospho S235/236 | Cell Signaling | Cat# 4856; RRID:AB_2181037 | 1:2000 |
| Antibody | Rabbit anti-S6 | Cell Signaling | Cat# 2217; RRID:AB_331355 | 1:2000 |
| Antibody | Mouse anti-puromycin | Abcam | 12D10; RRID:AB_2566826 | 1:1000 |
| Antibody | Rabbit anti-phospho-p44/42 MAPK (Erk1/2) (Thr202/Tyr204) | Cell Signaling | Cat# 9101; RRID:AB_331646 | 1:4000 |
| Antibody | Rabbit p44/42 MAPK (Erk1/2) Antibody | Cell Signaling | Cat#9102; 9102S RRID:AB_330744 | 1:4000 |
| Antibody | Donkey anti-Rabbit-Cy3 | Jackson ImmunoResearch | Cat# 711-165-152; RRID:AB_2307443 | 1:200 |
| Antibody | Donkey anti-Mouse Alexa 488 | Jackson ImmunoResearch | Cat# 715-545-150; RRID:AB_2340846 | 1:200 |
| Antibody | Donkey anti-Chicken Alexa 647 | Jackson ImmunoResearch | Cat# 703-605-155; RRID:AB_2340379 | 1:200 |
| Chemical compound, drug | Hoechst | Sigma | Cat# H6024 | 1:3000 |
| Antibody | Goat anti-mouse HRP | Promega | W4020 | 1:5000 |
| Antibody | Goat anti-rabbit HRP | Promega | W4011 | 1:5000 |
| Chemical compound, drug | MK-2206-2HCl | Selleckchem | Cat # S1078 | |
| Chemical compound, drug | AZD5363 | Selleckchem | Cat # S1078 | |
| Chemical compound, drug | LY294002 | Sigma | Cat # L9908 | |
| Other | A/G agarose beads | Pierce | Cat# 20421 | |
| Chemical compound, drug | Protease inhibitor | Sigma | P8340 | |
| Chemical compound, drug | Phosphatase inhibitor II | Sigma | P5726 | |
| Chemical compound, drug | Phosphatase inhibitor III | Sigma | P0044 | |
| Chemical compound, drug | Puromycin | Sigma | P8833 | |
| Chemical compound, drug | (RS)−3,5- DHPG | Tocris | Cat# 0342 | |
| Commercial assay or kit | ECL Prime Western blot Detection | GE Healthcare | RPN2236 | |
| Mus Musculus, Akt1tm1Mbb, C57BL/6 () | Akt1 KO | Jackson Laboratory | Stock # 004912; RRID:IMSR_JAX:004912 | |
| Mus Musculus, Akt2tm1.1Mbb, C57BL/6 () | Akt2 KO | Jackson Laboratory | Stock # 006966; RRID:IMSR_JAX:006966 | |
| Mus Musculus, Akt3tm1.3Mbb, C57BL/6 () | Akt3 KO | Easton et al. (2005); PMCID: PMC549378 | Obtained from Birnbaum lab (UPenn) in 2012 | |
| Mus musculus, Akt1tm2.2Mbb, C57BL/6 () | Akt1loxP/loxP | Jackson Laboratory | Stock #026474; RRID:IMSR_JAX:026474 | |
| Mus Musculus, Akt2tm1.2Mbb, C57BL/6 () | Akt2loxP/loxP | Jackson Laboratory | Stock #026475; RRID:IMSR_JAX:026475 | |
| Mus Musculus, Tg(CamkIIa-Cre)T29Stl, C57BL/6 () | CamK2a-Cre | Hoeffer et al., 2008; PMCID: PMC2630531 | Obtained from Kelleher lab (MIT) in 2008 | |
| Mus Musculus, Tg(Eno2-cre)39Jme, C57BL/6 () | Eno2-Cre -or- NSE39-Cre | Jackson Laboratory | Stock # 005938; RRID:IMSR_JAX:005938 | |
| Mus Musculus, Tg(Nes-cre)1Kln, C57BL/6 () | Nestin-Cre | Jackson Laboratory | Stock # 003771; RRID:IMSR_JAX:003771 | |
| Software, algorithm | IBM SPSS Statistics | IBM Analytics | RRID:SCR_002865 | |
| Software, algorithm | pCLAMP software | Molecular Devices | RRID:SCR_011323 | |
| Software, algorithm | ImageQuant TL | GE Healthcare | RRID:SCR_014246 | |
| Software, algorithm | ICY Imaging | Other | RRID:SCR_010587 | Open Source; http://icy.bioimageanalysis.org/ |
| Other | Cryostat | Leica CM1850 | ||
| Other | Nikon A1R Laser Scanning Confocal | Nikon | ||
| Other | Vibratome | Leica VT1200S | ||
| Other | Brain slice incubation chamber | Scientific Systems Design Inc | BSC1 | |
| Other | Proportional Temperature Controller | Scientific Systems Design Inc | PTC03 | |
| Other | Microelectrode AC Amplifier Model 1800 | A-M Systems | Cat # 70000 | |
| Other | Axon CNS Digidata 1440A | Molecular Devices | ||
| Other | Sonicator XL2000 | QSonica | ||
| Other | Synergy 2 Multimode reader | BioTek | ||
| Other | XCell II Surelock Western blot | ThermoFisher Scientific | EI0002 | |
| Other | Novex 4–12% Bis-Tris gels (15 or 26 well) | Life Technologies | 15 well: NP0336 | |
| 26 well: WG1403 | ||||
| Other | FluorChem E system | Proteinsimple |
Additional files
-
Transparent reporting form
- https://doi.org/10.7554/eLife.30640.017
Download links
A two-part list of links to download the article, or parts of the article, in various formats.
Downloads (link to download the article as PDF)
Open citations (links to open the citations from this article in various online reference manager services)
Cite this article (links to download the citations from this article in formats compatible with various reference manager tools)
AKT isoforms have distinct hippocampal expression and roles in synaptic plasticity
eLife 6:e30640.
https://doi.org/10.7554/eLife.30640


