FoxP2 isoforms delineate spatiotemporal transcriptional networks for vocal learning in the zebra finch
- University of California, Los Angeles, United States
- Stanford University, Stanford, United States
Figures
Figure 1 with 2 supplements

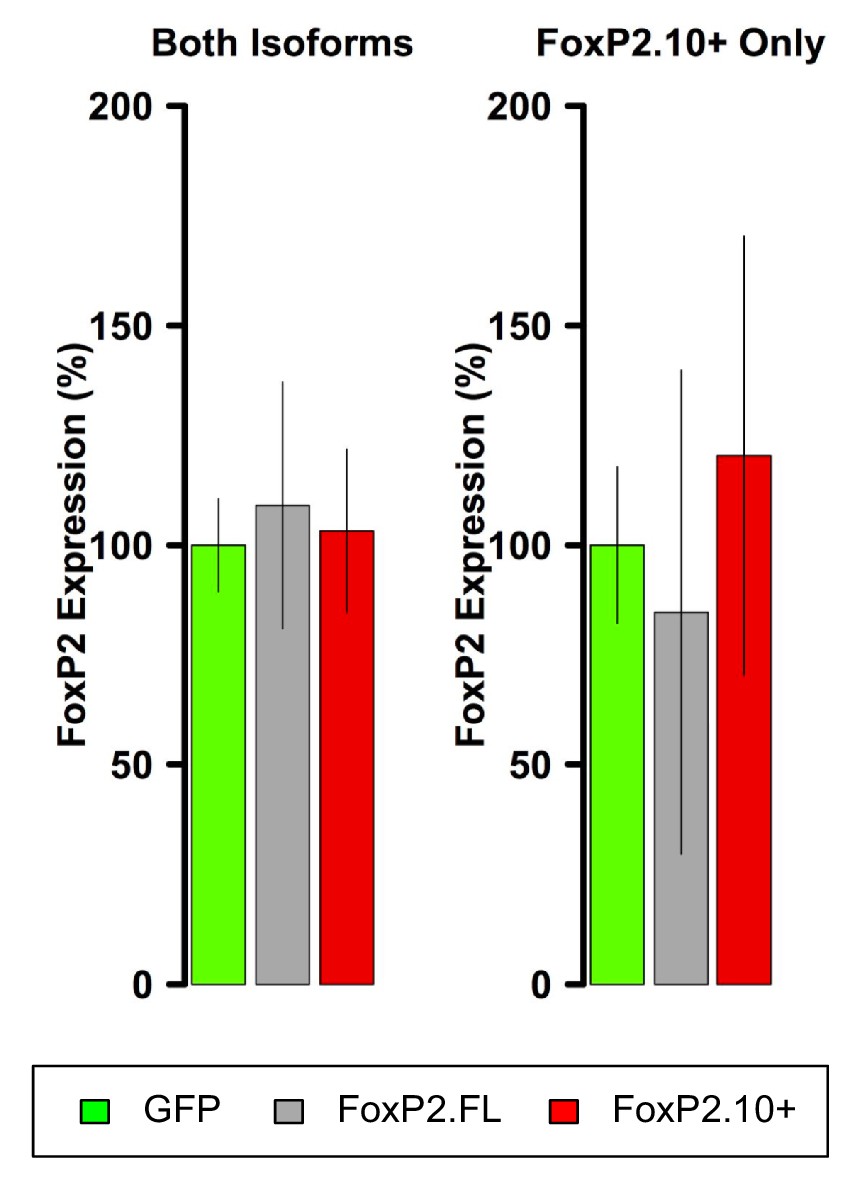
Overexpression of FoxP2 isoforms.
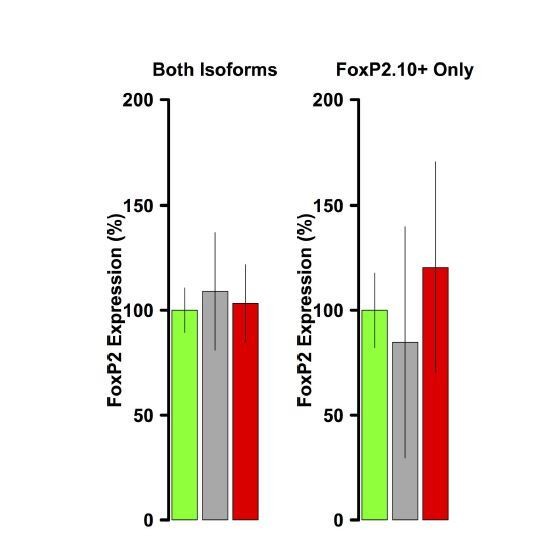
(A) Schematics show full-length (FoxP2.FL) and 10+ (FoxP2.10+) isoforms. Regions whose transcripts were targeted by the complementary riboprobes are shown in red. (B) Left panel depicts experimental design to test for isoform-specific expression in vivo. Middle and right images depict two sections from the same female brain. For purposes of validation only, the bird’s right hemisphere (shown on left) was injected with an AAV expressing FoxP2.FL while the left hemisphere was injected with the FoxP2.10+ construct. Two weeks post-injection, robust signals were observed in the striatopallidum of both hemispheres using the mid probe but only in the hemisphere injected with the FoxP2.FL construct using the 3’ probe. Signals reflect both the endogenous FoxP2 expression pattern (Teramitsu and White, 2006; Teramitsu et al., 2004; Teramitsu et al., 2010) as well as enhanced levels due to viral-driven expression. (C) FoxP2 expression quantified by qRT-PCR in juvenile males that were bilaterally injected with one of the constructs at 35d using primers that identify both isoforms (left graph) or only the FoxP2.10+ isoform (right graph). Using the former primers, enhanced expression is observed in the FoxP2.FL (grey; 126.5 ± 13.53%; n = 6) and FoxP2.10+ (red; 162.4 ± 26.77%; n = 6) groups relative to levels of birds that received the GFP control construct (green; 100 ± 7.54%; n = 7). Using the ‘FoxP2.10+ Only’ primers, enhanced expression is only observed in the FoxP2.10+ group (red; 279 ± 52.69%; n = 6) vs. the FoxP2.FL (grey; 126.16 ± 24.61%; n = 6) and GFP (green; 100 ± 22.95%; n = 7). Values represent percentage relative to GFP ±SEM. * and # denote p=0.031 and p=0.084, respectively, of an unpaired two-tailed bootstrap test. (D) A cell in the zebra finch striatopallidum expressing GFP (indicating viral transduction; green), endogenous FoxP2 as revealed by an antibody directed to the C-terminus (red), and Xpress-FoxP2.10+ revealed by an antibody to the Xpress tag (cyan). The Xpress signal is reminiscent of FoxP2.10+ aggresomes observed by Vernes et al. (Vernes et al., 2006). Orthogonal views of the cell are presented below. Scale bar = 5 µM.
-
Figure 1—source data 1
Contains averaged Ct values for each triplicate qPCR reaction presented in (C).
- https://doi.org/10.7554/eLife.30649.006
-
Figure 1—source data 2
Vector maps of AAV and HSV used in this study.
- https://doi.org/10.7554/eLife.30649.007
Figure 1—figure supplement 1

FoxP2 isoform protein expression.
Immunoblot loaded with 20 and 10 micrograms of zebra finch whole brain homogenate. Incubation with an antibody (Proteintech, Rosemont, IL, USA, Cat. No. 20529–1-AP) against the N-terminus of FoxP2 reveals bands at the predicted molecular weights in zebra finch (FL,~77 and 79 kDa, 10+,~47 kDa). GAPDH signals (~32 kDa) were used as a loading control.
Figure 1—figure supplement 2
FoxP2 qRT-PCR in VSP samples.
In contrast to Area X, FoxP2 overexpression is not observed in VSP samples.
Figure 2 with 1 supplement
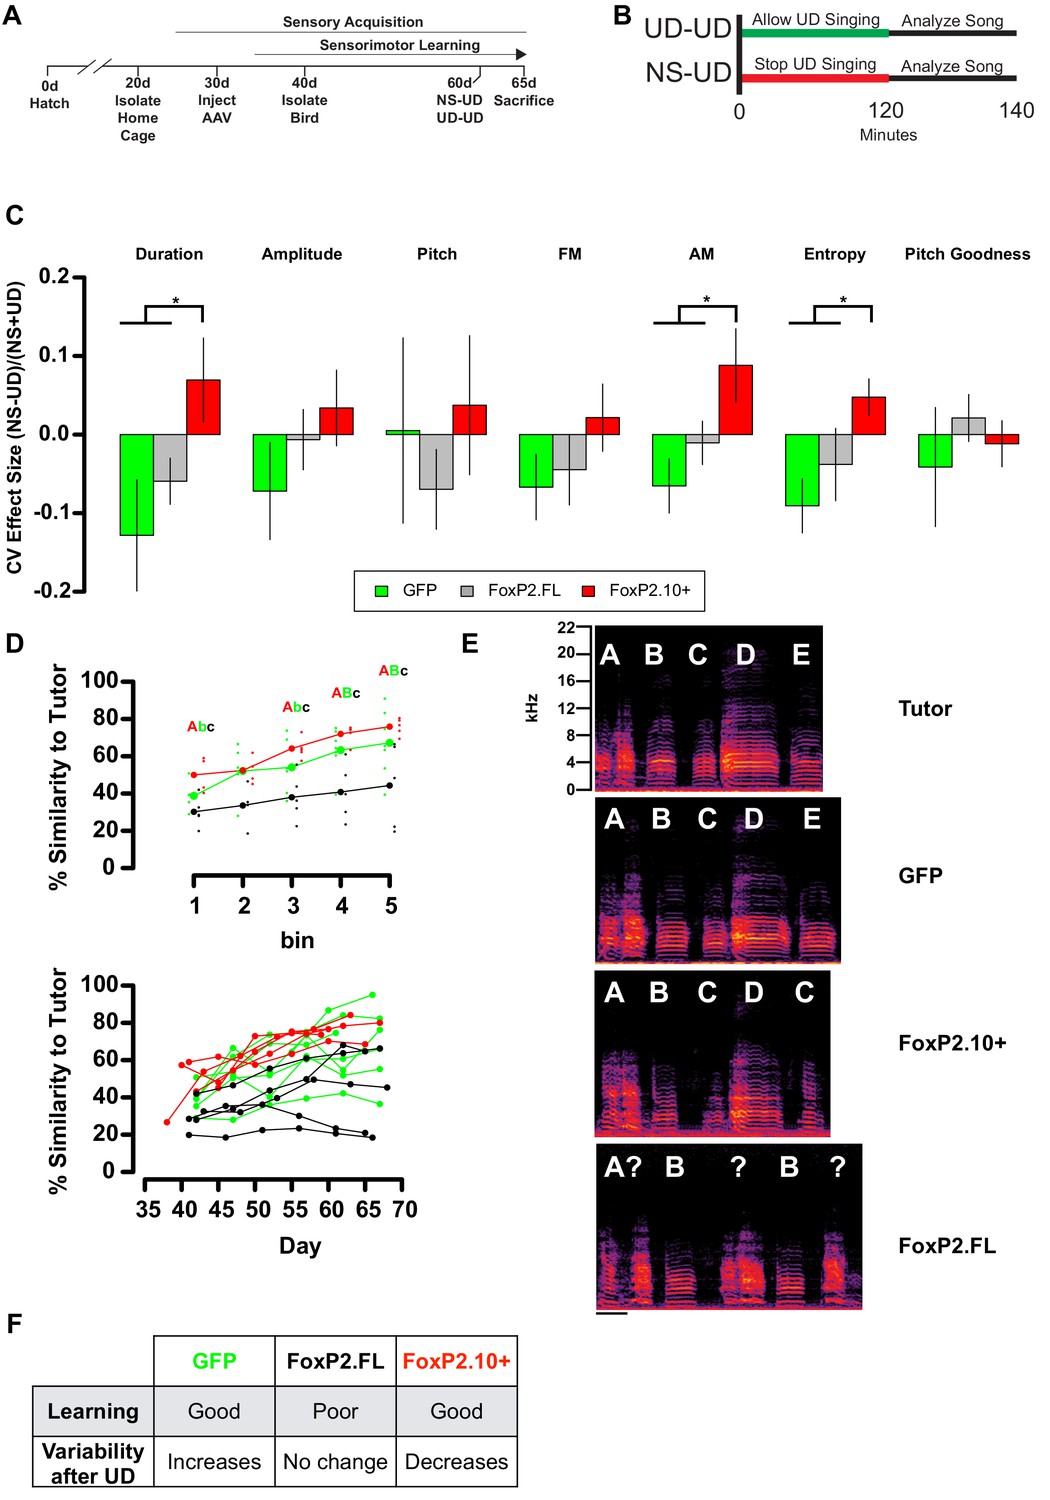
Overexpression of FoxP2 isoforms affect song learning and/or song variability.
(A) Timeline of experimental procedures relative to critical periods in song development. (B) Schematic illustrates NS-UD or UD-UD experiments performed on adjacent days. (C) The effect size of two hours of UD singing on syllable CV was calculated using the formula (NS-UD)/(NS + UD) after an NS-UD, UD-UD experiment performed at ~60d and 61d as in (B). Overexpression of FoxP2.FL (grey bars; n = 16 syllables; Duration = −0.059 ± 0.029; AM = −0.010 ± 0.028; Entropy = −0.038 ± 0.04) diminishes singing induced variability relative to that seen in GFP-expressing controls (green bars; n = 9 syllables; Duration = −0.128 ± 0.071; AM = −0.065 ± 0.035; Entropy = −0.091 ± 0.034). In contrast, overexpression of FoxP2.10+ (red bars; n = 13 syllables; Duration = 0.070 ± 0.054; AM = 0.088 ± 0.047; Entropy = 0.048 ± 0.029) leads to a singing-induced state of relative invariability. Values and bar heights represent the average effect size for all syllables within the virus construct group ±SEM. * denotes significant result in one-way ANOVA (Duration: F(2,35) = 3.95, p=0.028; AM: F(2,35) = 3.96, p=0.028; Entropy: F(2,35) = 3.63, p=0.037) and Tukey’s HSD post-hoc test (p<0.05). (D) Learning curves plot the relationship between percentage similarity to tutor as a function of time. Animals overexpressing GFP (green; letter ‘B’; n = 7 birds;~65 d similarity = 67.2 ± 6.64%) or FoxP2.10+ (red, letter ‘A’; n = 5 birds;~65 d similarity = 75.8 ± 2%) learn significantly better than those overexpressing FoxP2.FL (grey, letter ‘C’; n = 5 birds;~65 d similarity = 44.3 ± 10.1%). Values are mean ±SEM. Data are binned by day (top panel; bold points represent group mean and shifted smaller points are individual birds) or by individuals (bottom panel). Significantly different groups tested by one-way ANOVA (Bin 1:~40d F(2,11) = 6.06, p=0.016; Bin 3:~55d F(2,13) = 6.04, p=0.014; Bin 4:~60d F(2,14) = 9.94, p=0.002; Bin 5:~65d F(2,14) = 4.76, p=0.026) and Tukey HSD post-hoc test (p<0.05) are denoted by capital and lowercase lettering. (E) Exemplar motifs of a tutor and three of his 65d pupils, each of which was injected with a different viral construct at 30d. These examples illustrate the percent similarity depicted in panel D. (F) Summary of the learning and variability phenotypes observed after virus injection.
-
Figure 2—source data 1
Contains the effect sizes for each syllable that are presented in (C).
- https://doi.org/10.7554/eLife.30649.010
-
Figure 2—source data 2
Contains the binned similarity scores presented in the upper plot in (D).
- https://doi.org/10.7554/eLife.30649.011
Figure 2—figure supplement 1
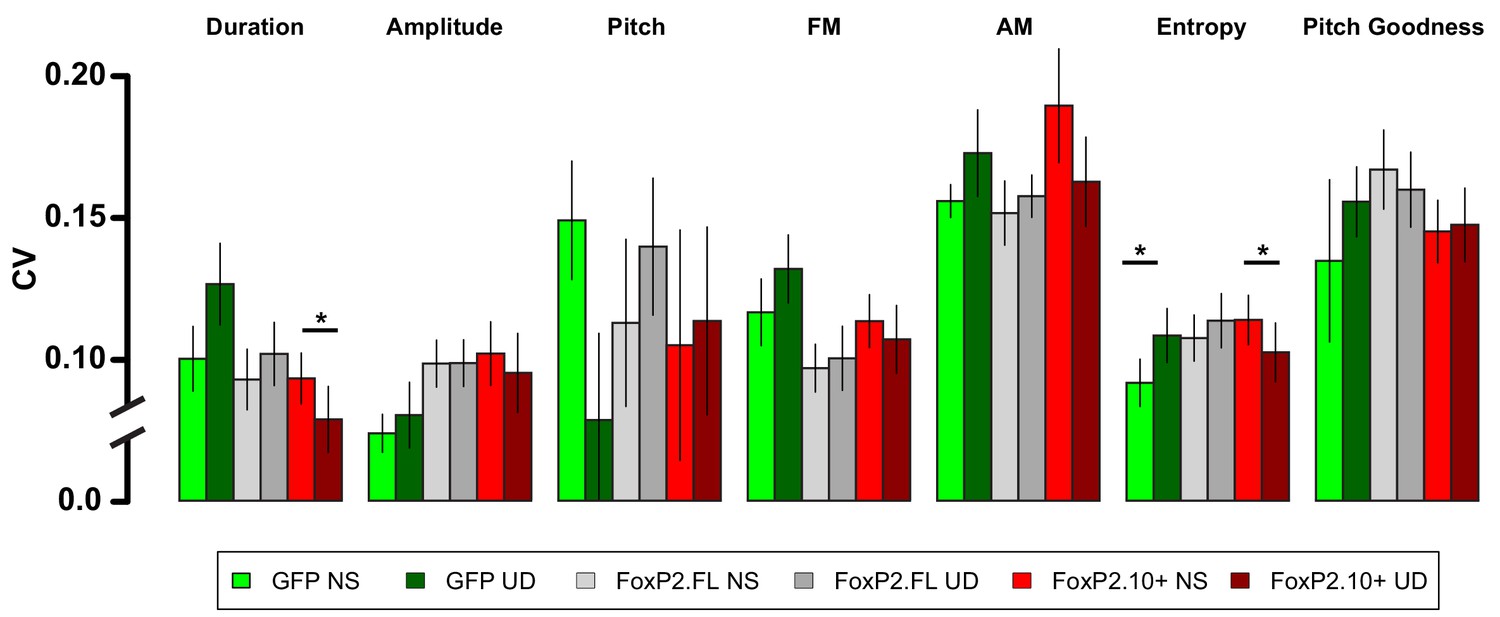
Raw acoustic feature variability in the NS-UD and UD-UD conditions by virus group.
The raw acoustic feature CVs transformed by the calculation in Figure 2C show the variability relationship between NS-UD and UD-UD paradigms for all measured acoustic features. For most song features, UD singing drives increases in CV in the GFP group. This effect is blocked or reversed in the FoxP2.FL and FoxP2.10+ groups, respectively. Notably, the songs of FoxP2.10+ animals following 2 hr of UD song were significantly less variable than those after 2 hr of non-singing. Asterisks indicate a significant difference (p<0.05) in a paired resampling test within virus construct. See Materials and methods for more information regarding the transformation of raw data to effect size.
Figure 3 with 6 supplements
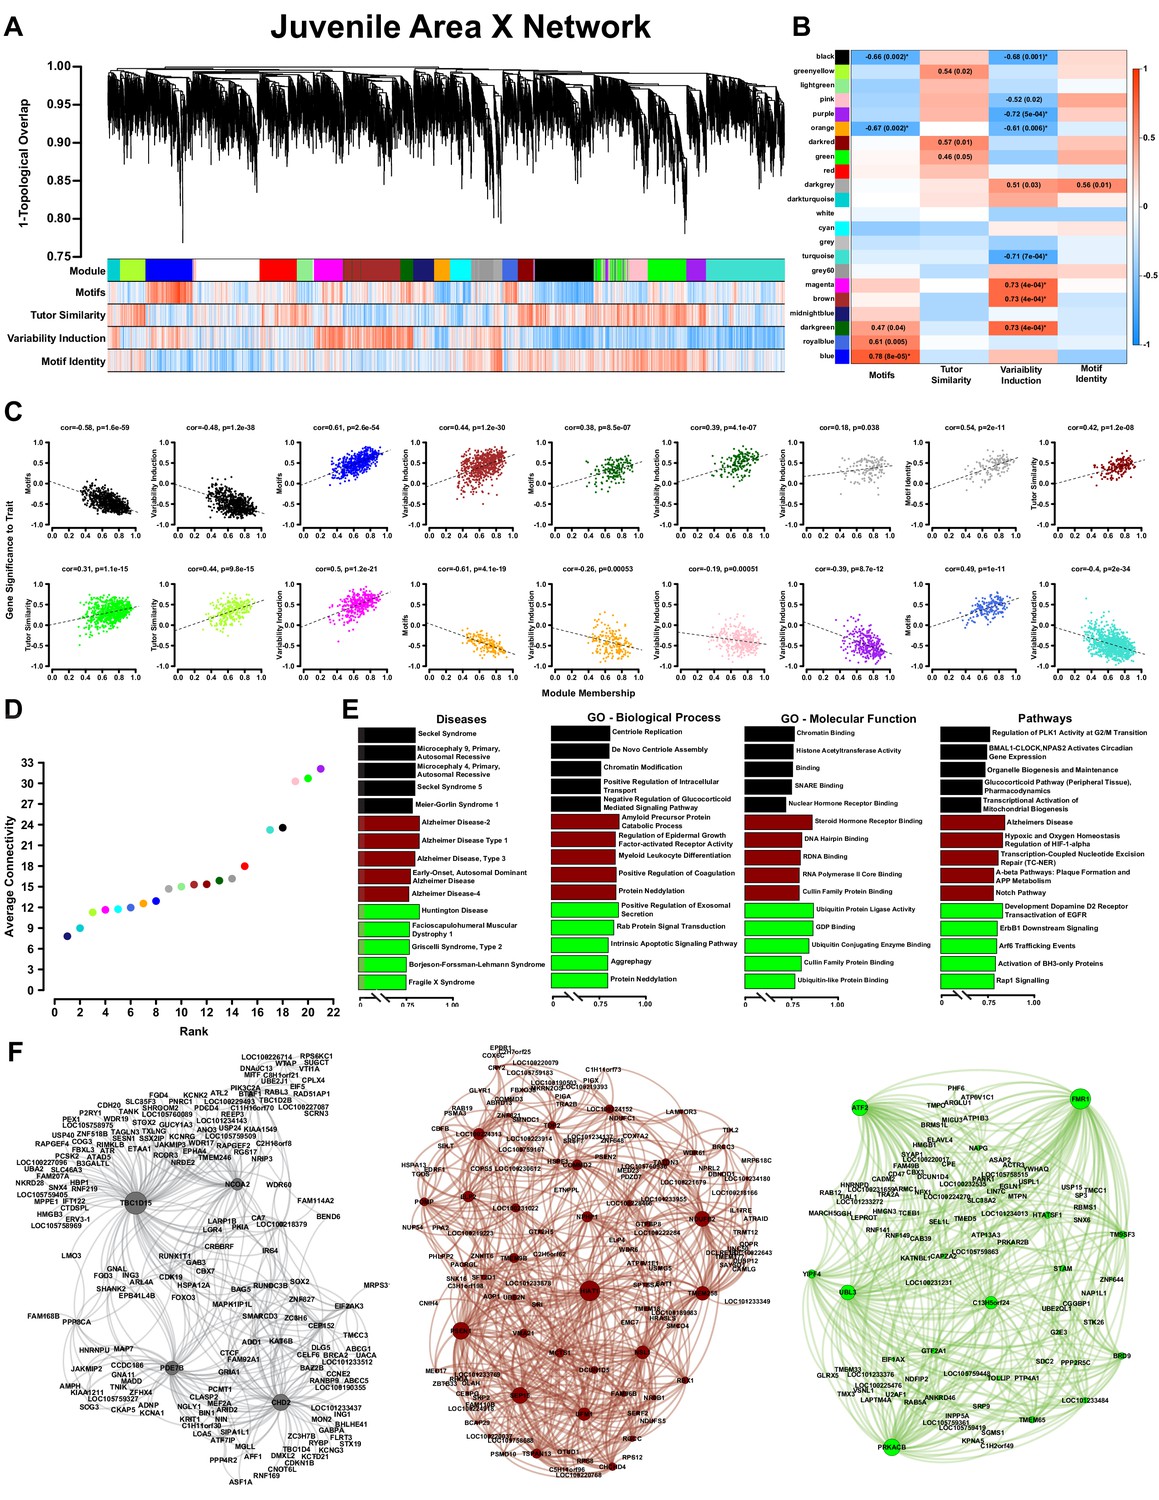
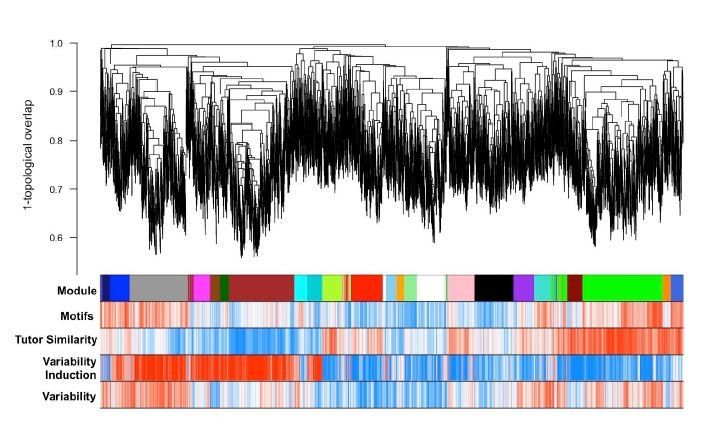
WGCNA yields behaviorally relevant modules.
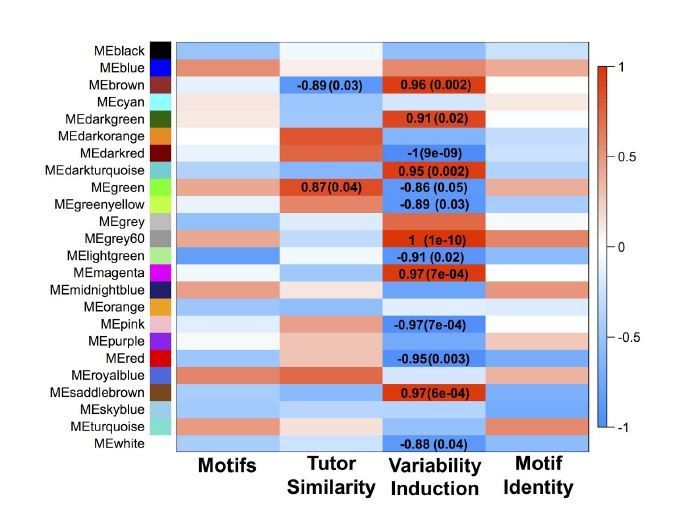
(A) Dendrogram (top) illustrates the topological overlap between genes in the juvenile Area X overall network. Modules delineated by automated tree trimming are shown below and are depicted by arbitrary colors. Beneath the color bar, gene significances to the quantified behaviors (number of motifs sung, tutor similarity, acute variability changes, and overall variability; see Results) are indicated by a heatmap wherein red indicates a positive correlation and blue indicates a negative correlation (see B for scale). (B) Correlations between module eigengenes and each behavior are presented as a heatmap. The Pearson’s ρ and, in parentheses, Student’s asymptotic p-values for modules where p≤0.05 are displayed. P-values are uncorrected for multiple hypothesis testing but those that pass FDR correction at p≤0.05 are denoted by * (See ‘Correlation of behavior to gene expression’ in Materials and methods). (C) For all significant module-trait correlations, the relationship between gene significance and module membership is plotted for each gene in the module. Dashed lines represent the linear regression and the Pearson’s ρ (‘cor’) and p-value as determined by Fisher’s z-transformation are indicated above each plot. (D) The average whole network connectivity (kTotal) within each module reveals that the purple, green, and pink modules are composed of the most strongly connected genes in the network. (E) Term significances for the black, darkred, and green modules are indicated for disease, gene ontology biological process and molecular function, as well as for pathways for categories annotated as ‘neuronal’ in the GeneCards GeneAnalytics software. (F) Network plots of the modules presented in panel E where nodes represent genes scaled by the node’s intramodular connectivity and edge width displays the topological overlap between genes.
-
Figure 3—source data 1
The behavioral metrics that were correlated to the network to generate (A) and (B).
- https://doi.org/10.7554/eLife.30649.019
-
Figure 3—source data 2
An R workspace containing the network presented in (A).
- https://doi.org/10.7554/eLife.30649.020
-
Figure 3—source data 3
An R workspace containing the processed expression data for the network presented in (A).
- https://doi.org/10.7554/eLife.30649.021
-
Figure 3—source data 4
The Pearson correlation values for each module eigengene and the behavioral metrics in Figure 3—source data 1.
These data are the basis for panel 3B.
- https://doi.org/10.7554/eLife.30649.022
Figure 3—figure supplement 1

GFP-only Area X network.
A gene coexpression network built only from GFP birds is presented. Significant module-trait correlations are shown in a heatmap, right. Colors are consistent with Figure 3A.
Figure 3—figure supplement 2
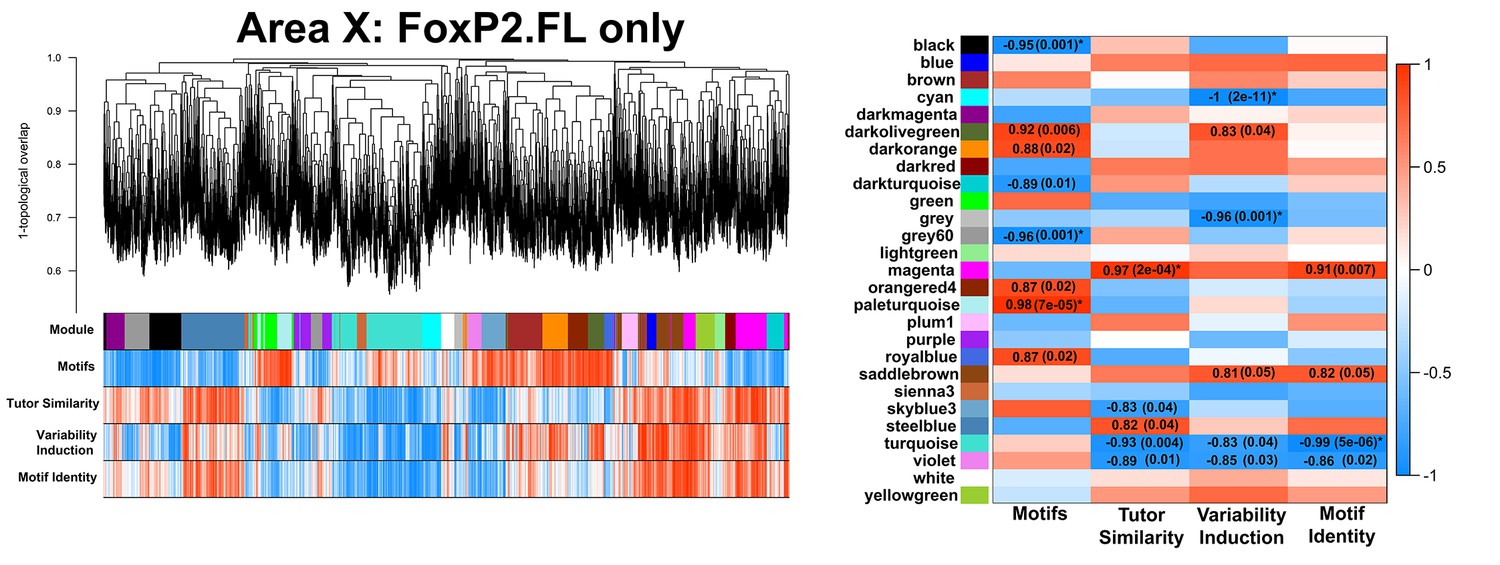
FoxP2.FL-only Area X network.
A gene coexpression network built only from FoxP2.FL birds is presented. Significant module-trait correlations are shown in a heatmap, right. Colors are consistent with Figure 3A.
Figure 3—figure supplement 3
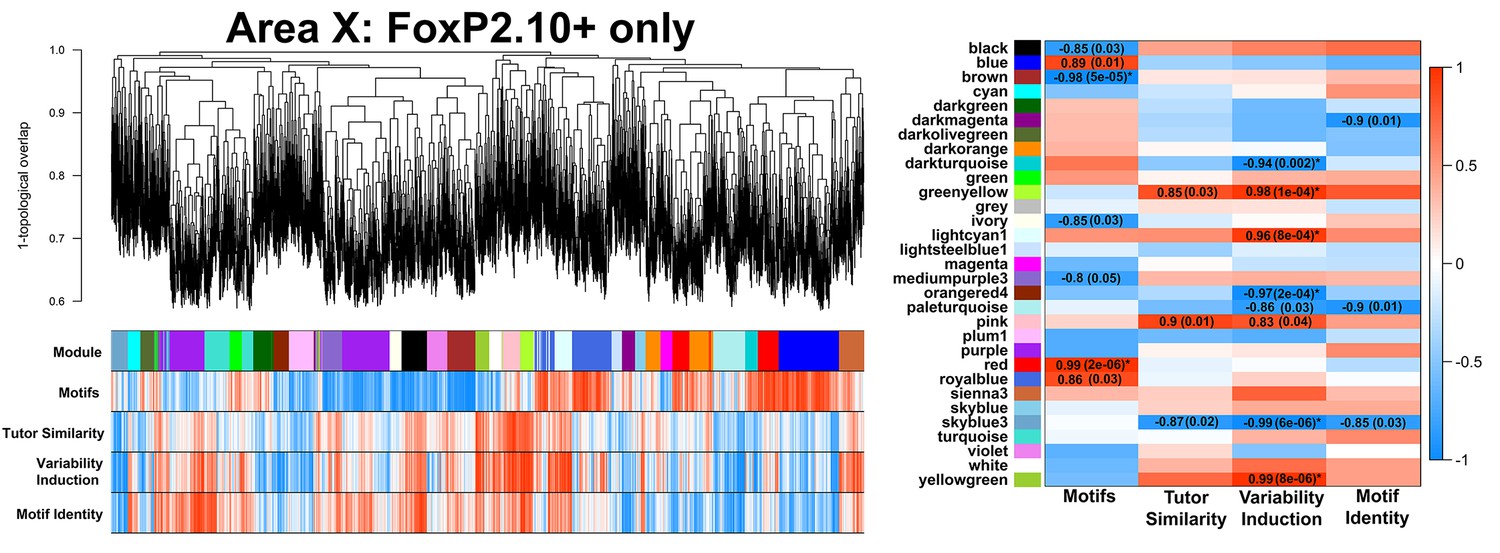
FoxP2.10+-only Area X network.
A gene coexpression network built only from FoxP2.10 + birds is presented. Significant module-trait correlations are shown in a heatmap, right. Colors are consistent with Figure 3A.
Figure 3—figure supplement 4
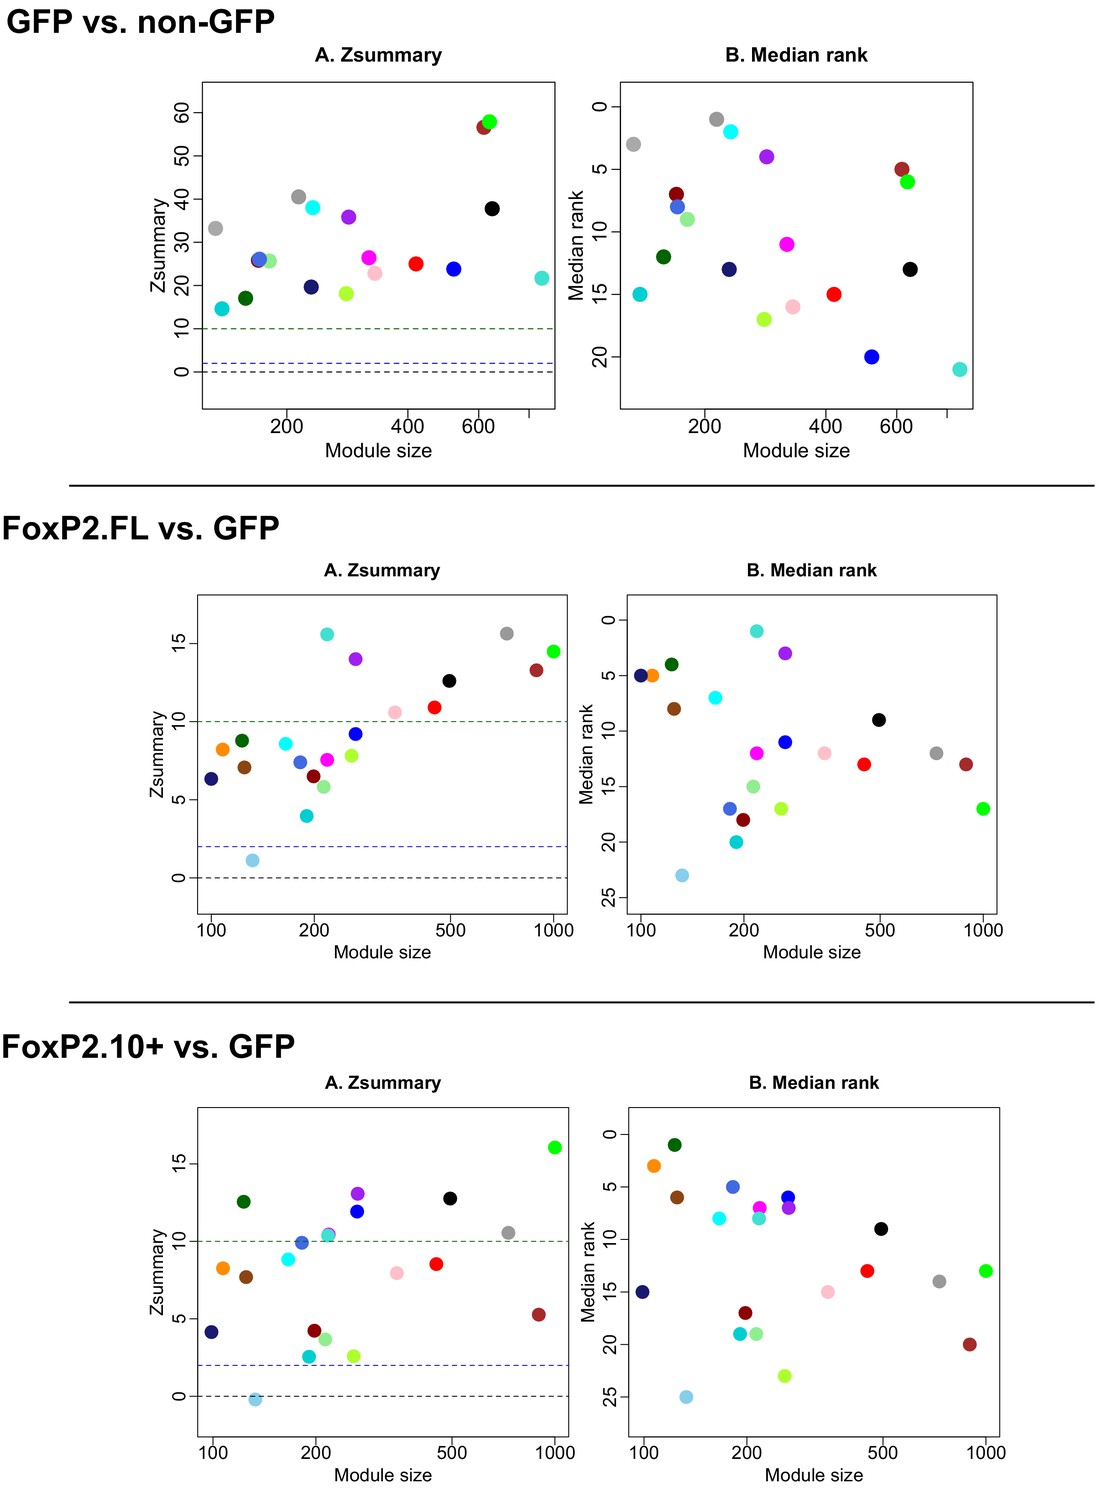
Module preservation between GFP vs FoxP2.
FL and FoxP2.10+ combined, GFP vs. FoxP2-FL, and GFP vs. FoxP2.10+ networks. Plots depict module preservation vs. module size for each virus construct pair and allow for visual assessment of whether a specific module exists in two conditions. Middle and upper dashed horizontal lines indicate thresholds for low and high preservation, respectively.
Figure 3—figure supplement 5
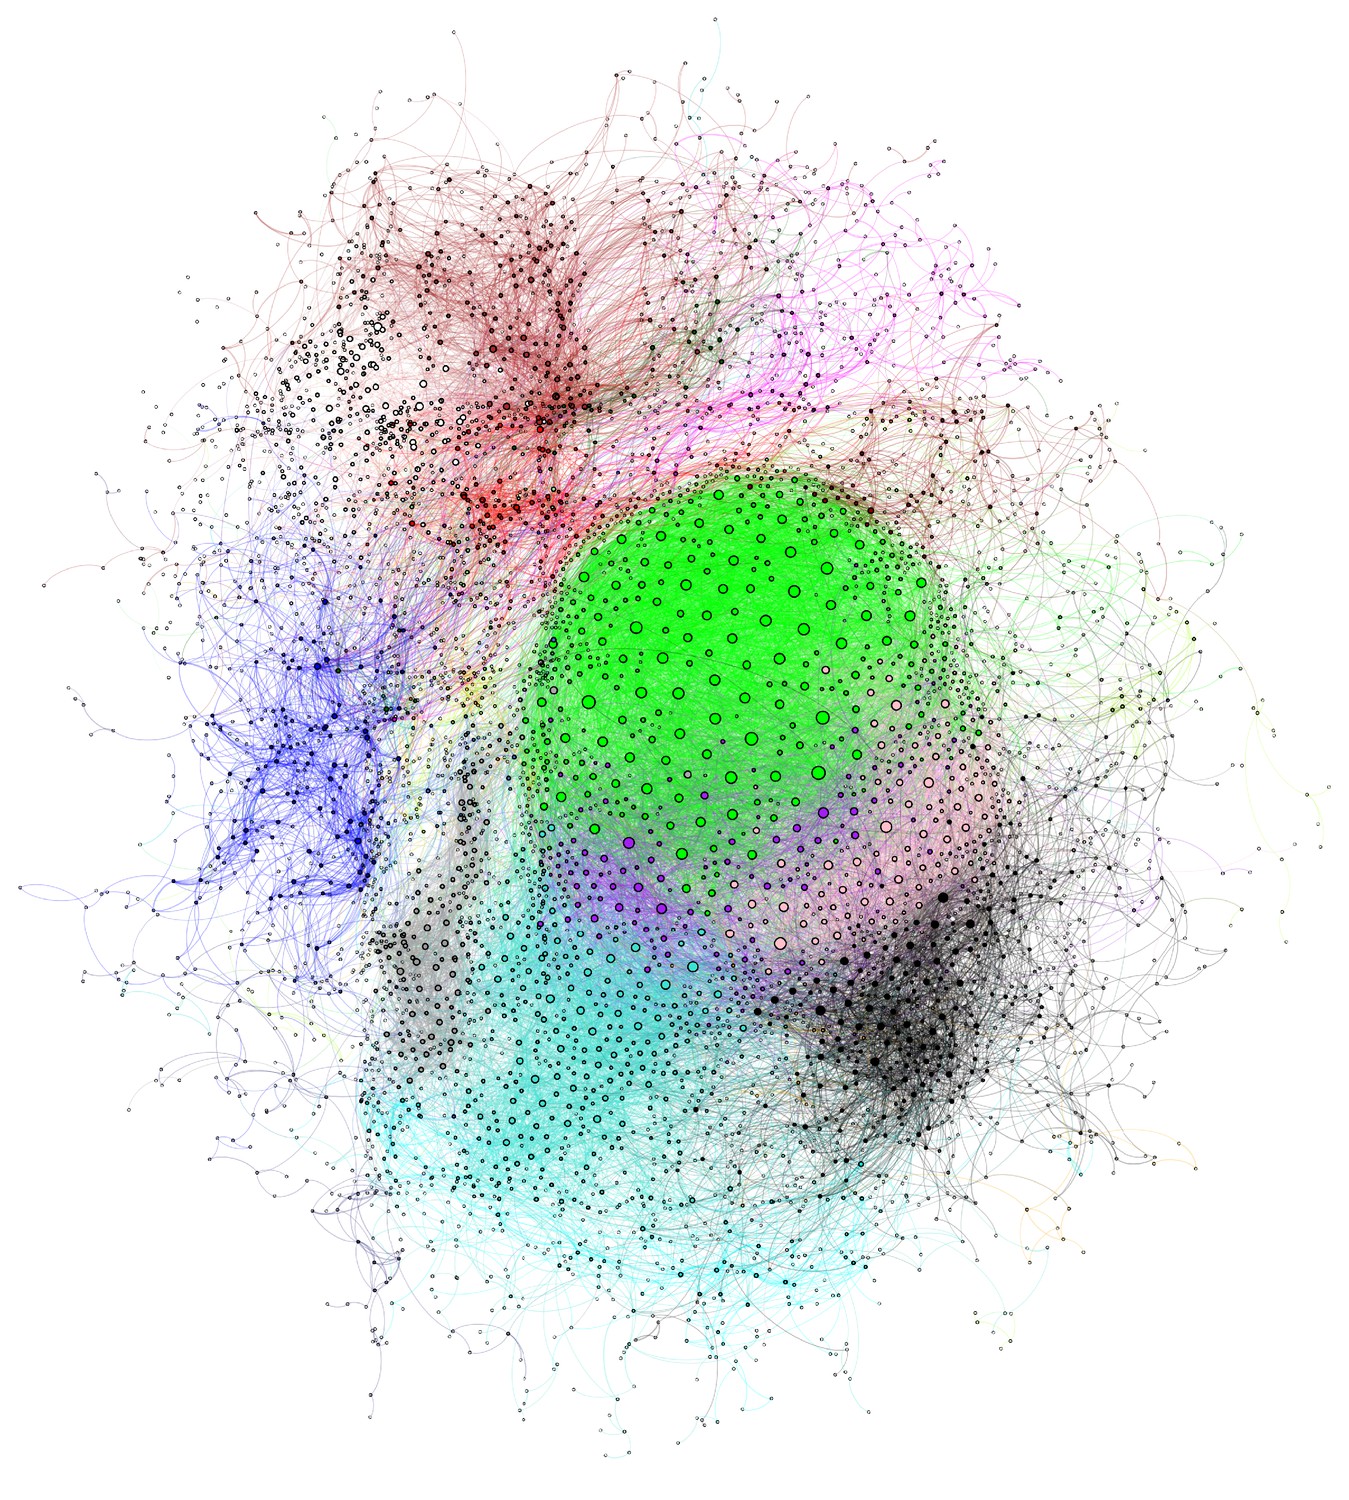
Juvenile Area X gene coexpression network.
The gene coexpression network is displayed with genes represented as nodes and colors indicating the module assignment of each gene. Nodes are scaled by their degree and edge color is the combination of the module colors of nodes connected by the edge. Poorly connected nodes are excluded (see Methods).
Figure 3—figure supplement 6
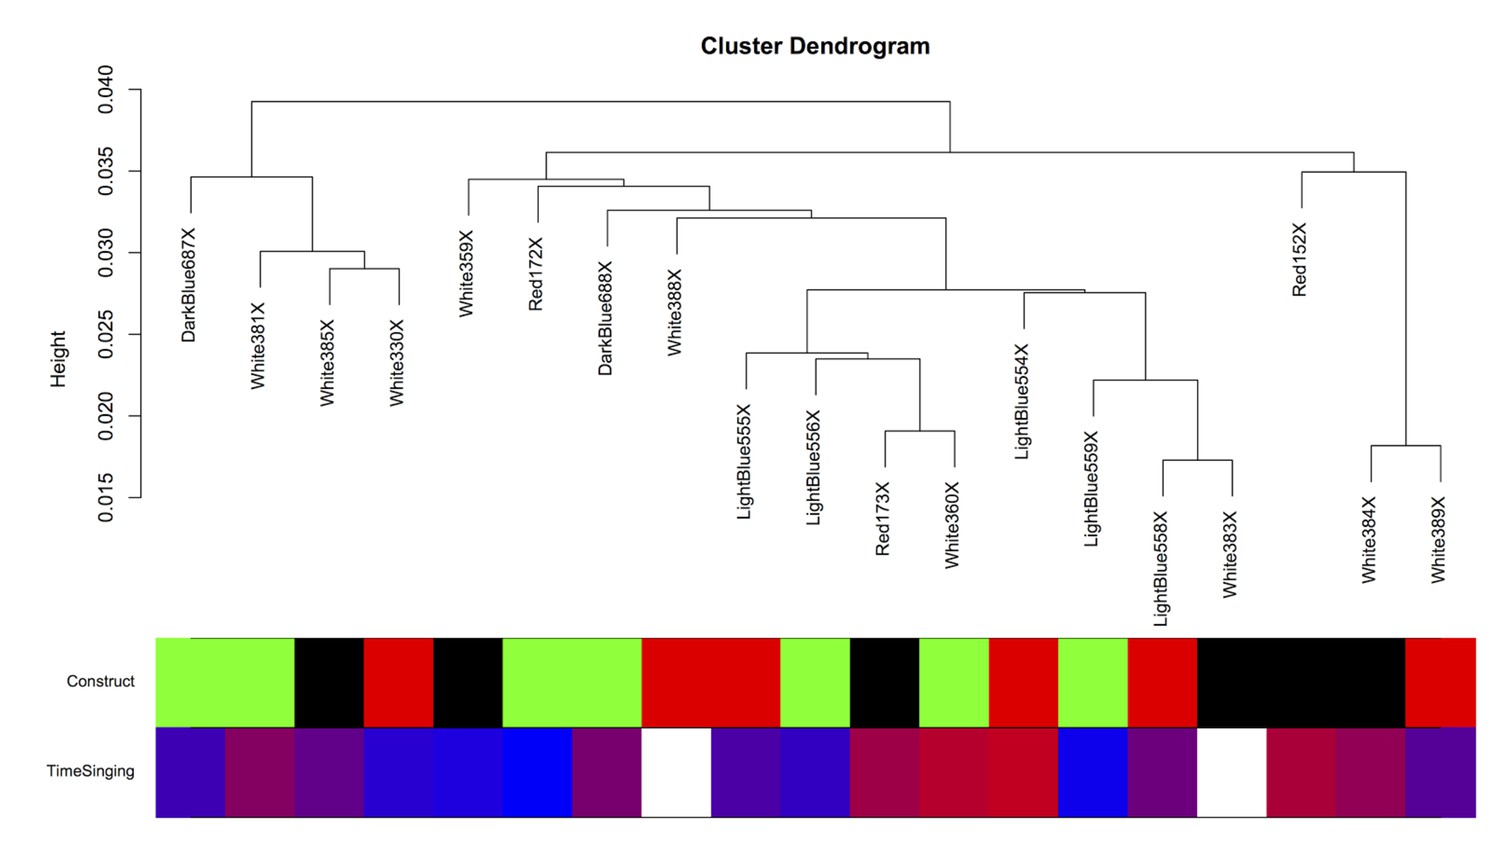
Intersample correlation for Area X samples.
The intersample correlation for the Area X samples does not clearly delineate clusters by virus construct. Virus construct is indicated in green (GFP), black (FoxP2.FL), and red (FoxP2.10+). Below, time singing is indicated on a blue-red color scale where the samples from birds that sang the most are colored the deepest red.
Figure 4
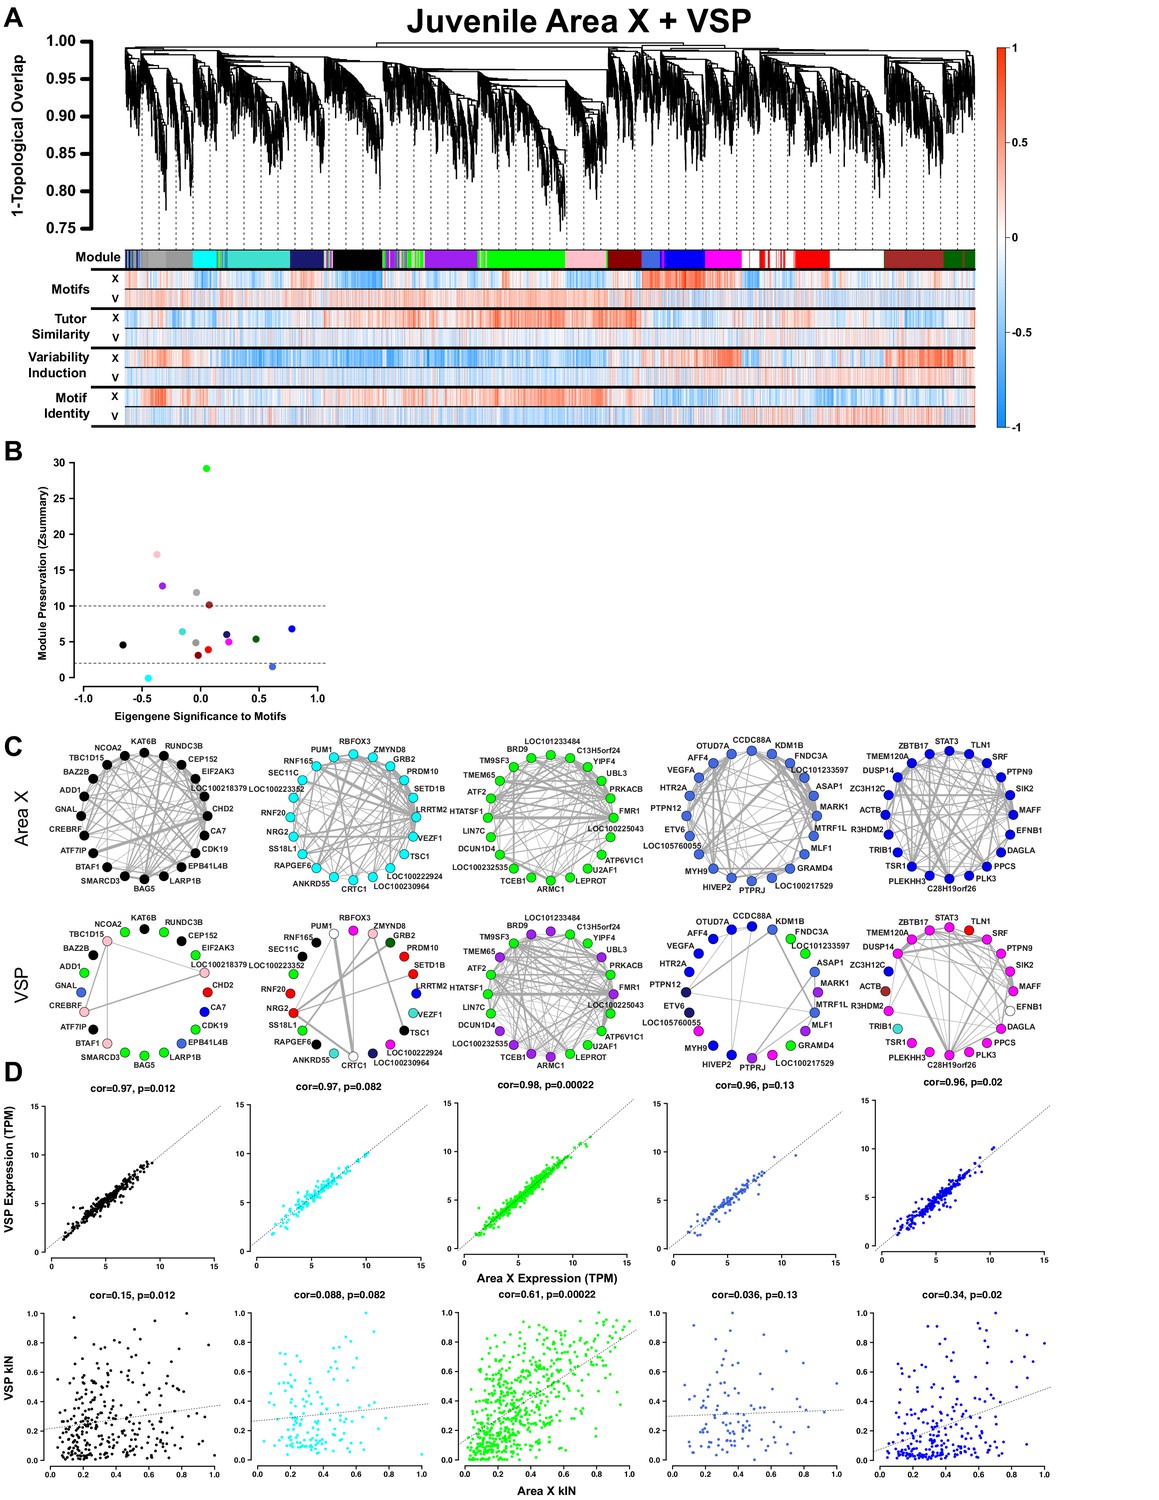
Juvenile Area X singing related gene coexpression patterns are not preserved in juvenile VSP.
(A) Dendrogram (top) displays the topological overlap in Area X between genes common to both juvenile Area X and VSP networks. Beneath, the module assignments and the gene significances for each gene as calculated using expression from VSP (‘V’) or Area X (‘X’) for all behaviors are quantified as in Figure 3A. Module colors are consistent with those presented in Figure 3. (B) Module preservation (Zsummary) for all modules that were present in both Area X and VSP displayed as a function of module eigengene correlation to motifs. Lower and upper dashed horizontal lines indicate thresholds for low and high preservation, respectively. (C) Circle plots display the adjacencies between the 20 most well-connected genes in the Area X black, cyan, green, royalblue, and blue modules. The adjacency between genes is indicated by edge thickness. Genes grouped together in the black, cyan, royalblue, and blue song modules in Area X have numerous and strong connections. Those connections are weakened or nonexistent in VSP such that genes sort into different modules in VSP. In contrast, the green learning-related module genes maintain their common grouping and connections in VSP. (D) Raw gene expression is tightly correlated between Area X and VSP for the genes in the black, cyan, green, royalblue, and blue modules (top). Only the intramodular connectivity of the genes in the green learning-related module is correlated between Area X and VSP (bottom). Dashed lines represent the linear regression.
-
Figure 4—source data 1
An R workspace containing the network presented in (A).
- https://doi.org/10.7554/eLife.30649.024
-
Figure 4—source data 2
An R workspace containing the processed expression data for the network presented in (A).
- https://doi.org/10.7554/eLife.30649.025
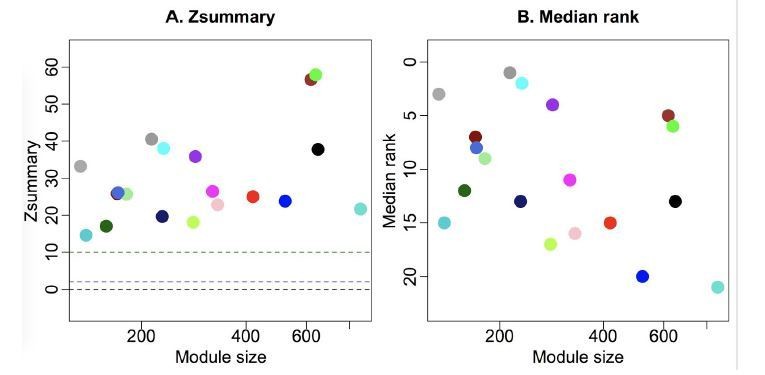
Figure 5 with 1 supplement
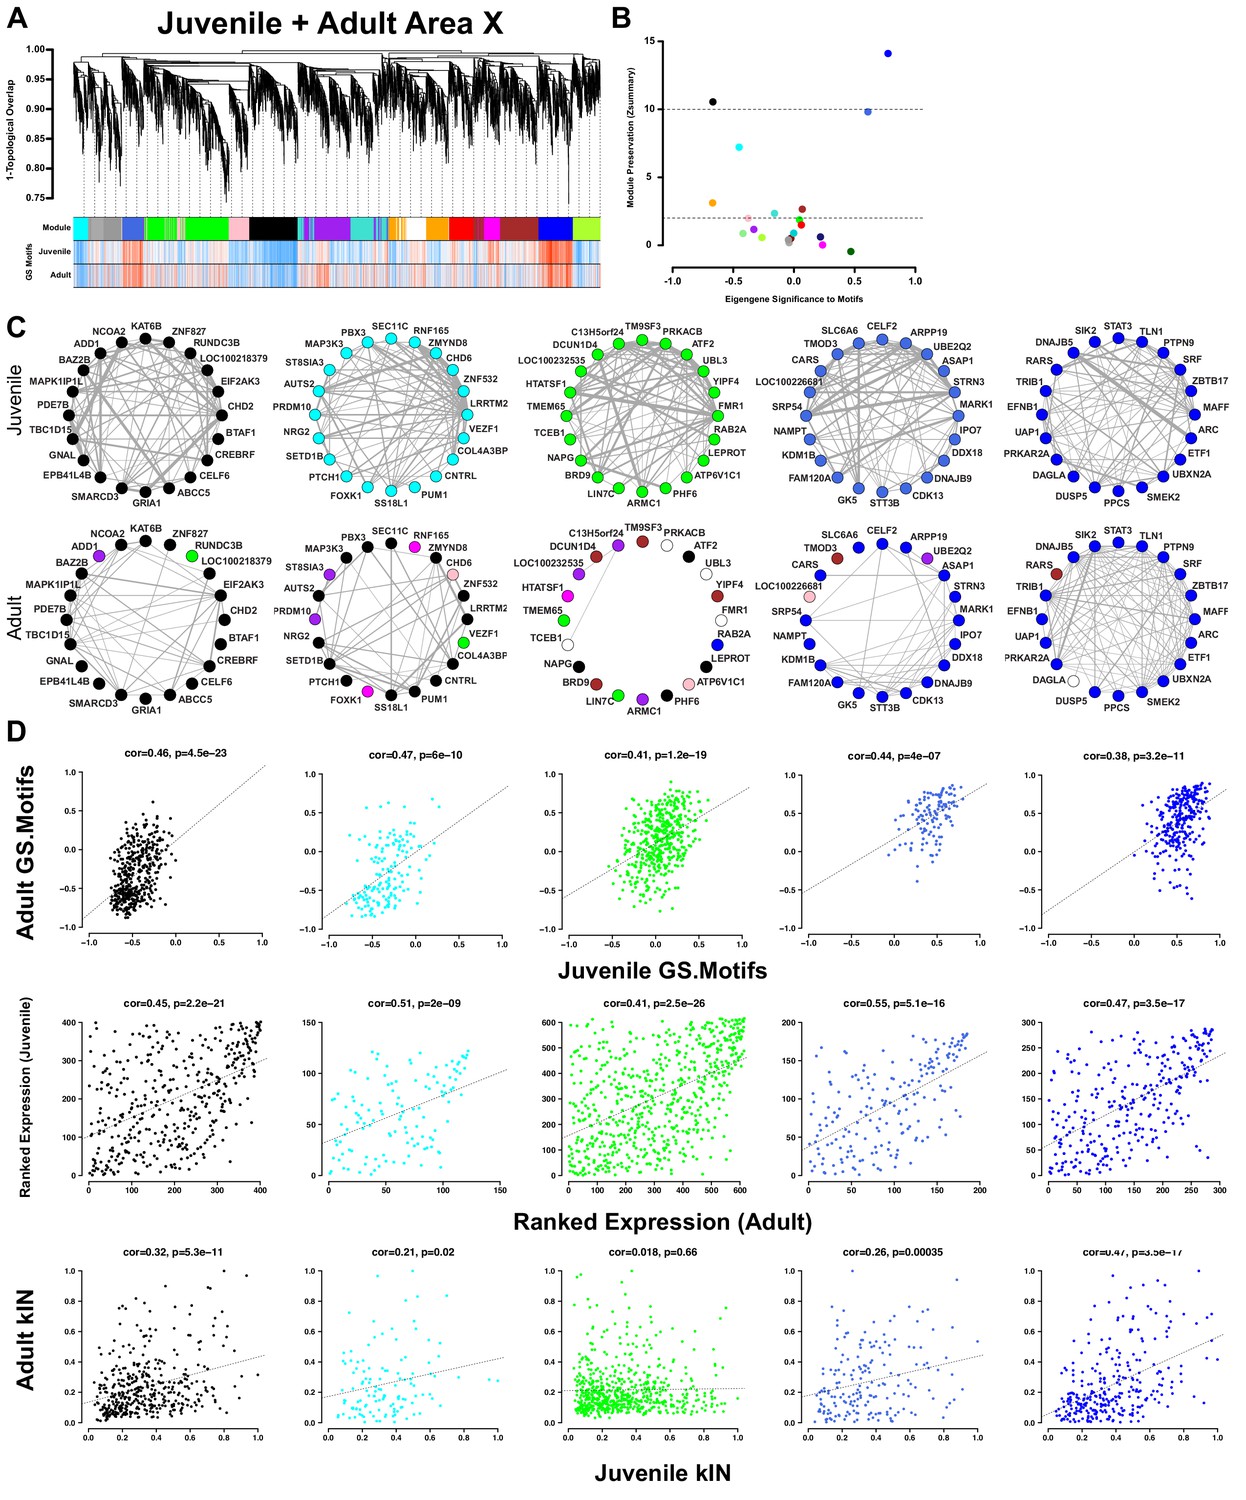
Area X song production but not learning-related modules are preserved into adulthood.
(A) Dendrogram (top) displays the topological overlap in juvenile Area X between genes common to both juvenile and adult Area X networks. The module assignments and the gene significances to motifs in juveniles and adults are presented below. Module colors are consistent with those presented in Figure 3. (B) Module preservation (Zsummary) for all modules that were present in both juvenile and adult Area X displayed as a function of ME correlation to motifs. Lower and upper dashed horizontal lines indicate thresholds for low and high preservation, respectively. (C) Circle plots display the adjacencies between the 20 most well-connected genes in the juvenile Area X black, cyan, green, royalblue, and blue modules. The adjacency between genes are indicated by edge thickness. Genes grouped together in the black, cyan, royalblue, and blue song modules in Area X have numerous and strong connections that are mostly maintained in adulthood. The densely interconnected green learning-related module genes found in juveniles do not maintain these relationships in adulthood. (D) Strong positive correlations between gene significance to motifs exist for all modules (top row). Ranked expression values for the genes in each module also show positive correlation (middle row). Intramodular connectivity is more positively correlated between ages for the black, cyan, royalblue, and blue song production modules than for the green learning-related module (bottom row).
-
Figure 5—source data 1
An R workspace containing the expression data and networks used to generate (A).
- https://doi.org/10.7554/eLife.30649.028
Figure 5—figure supplement 1
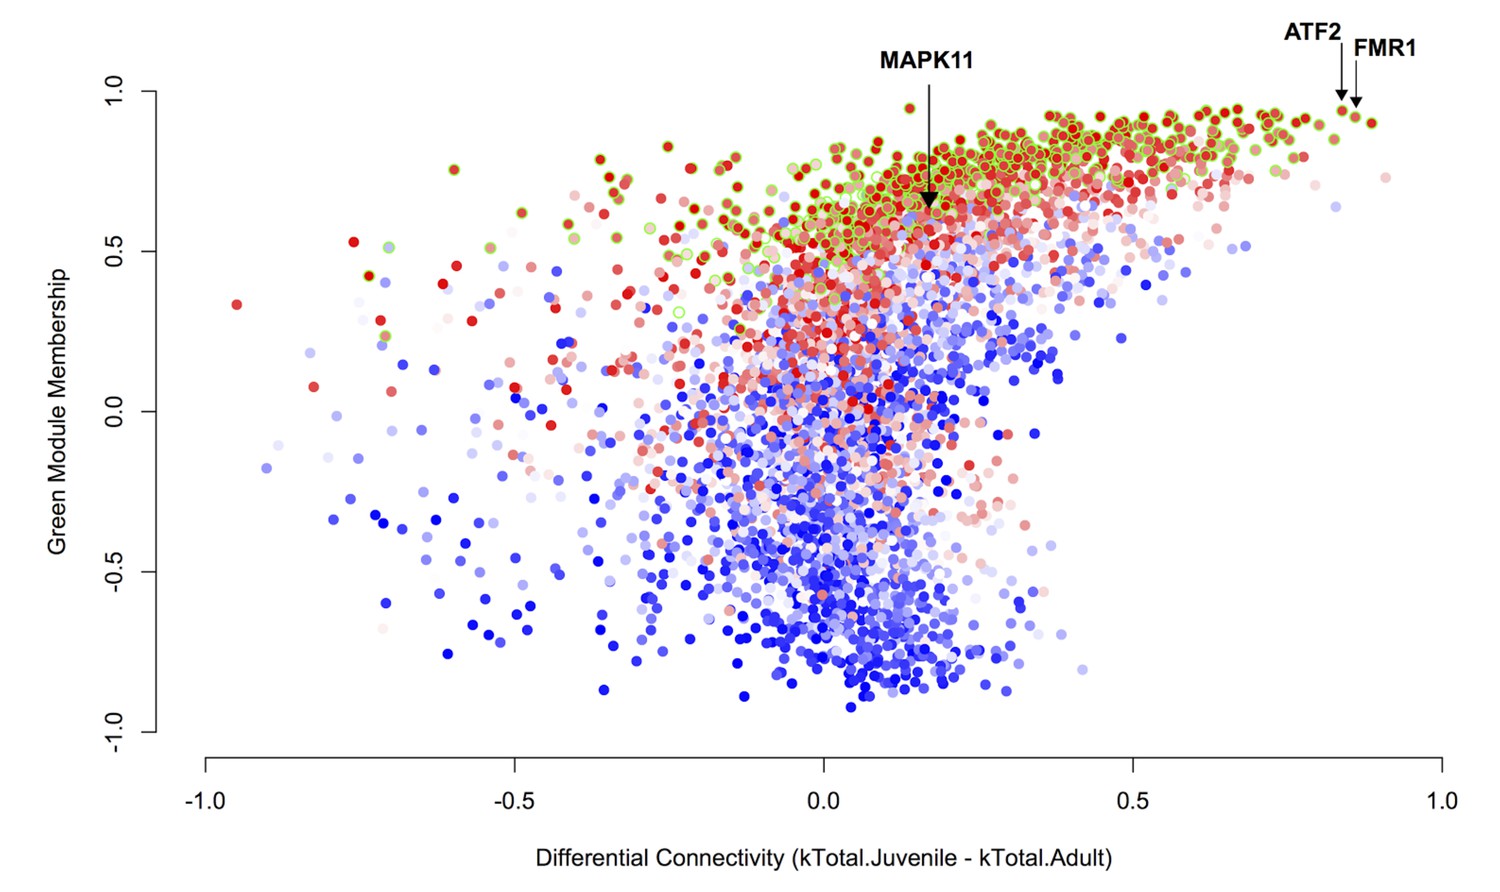
Differential connectivity as a function of green module membership.
Differential connectivity (kTotal.Juvenile - kTotal.Adult) is plotted against green module membership. Points are colored by correlation to tutor percent similarity from low to high on a blue-white-red scale. The genes most differentially connected are among the most strongly learning related and are well-correlated to the green module eigengene. Data points representing genes in the green module have a green stroke.
Figure 6 with 1 supplement

Gene significance and network position implicate MAPK11 as a molecular entry point to vocal learning mechanisms.
(A) The 20 genes with the highest to lowest gene significances to tutor similarity (sorted from top to bottom) are shown. Each column represents a bird and columns are sorted in order of increasing tutor similarity from left to right. Gene expression is scaled such the highest and lowest expression across samples have the brightest shade of red or blue, respectively. (B) Expression of MAPK11 is replotted, here separated by virus group and then sorted by increasing tutor percentage similarity. (C) The FoxP2 binding sequence as annotated by the JASPAR database (top) and a potential binding site found in the MAPK11 ‘promoter’. (D) Amplification of genomic DNA (‘Genomic’) with primers for a region of the MAPK11 ‘promoter’ that contains a putative FoxP2 binding site enrich a fragment of predicted size (red arrowhead) in the pull-down lane (FoxP2) but not the control (IgG) lane. (E) MAPK11 and its 10 closest network neighbors, including green learning-related module members and hub gene ATF2, as defined by topological overlap.
-
Figure 6—source data 1
The sorted gene expression data as presented in panel 6A.
Columns are ordered from left to right by increasing tutor percentage similarity attained by that bird. Rows are sorted by the gene’s significance to learning.
- https://doi.org/10.7554/eLife.30649.031
Figure 6—figure supplement 1

MAPK11 PCR Product Sequencing.
The MAPK11 NCBI RefSeq sequence (highlighted in grey) contains a potential FoxP2 binding motif (red). Genomic DNA was isolated and subjected to PCR with primers (highlighted in yellow) amplifying the region of interest. The product of each primer was sequenced showing our primers amplify a fragment containing the proposed FoxP2 binding motif.
Figure 7
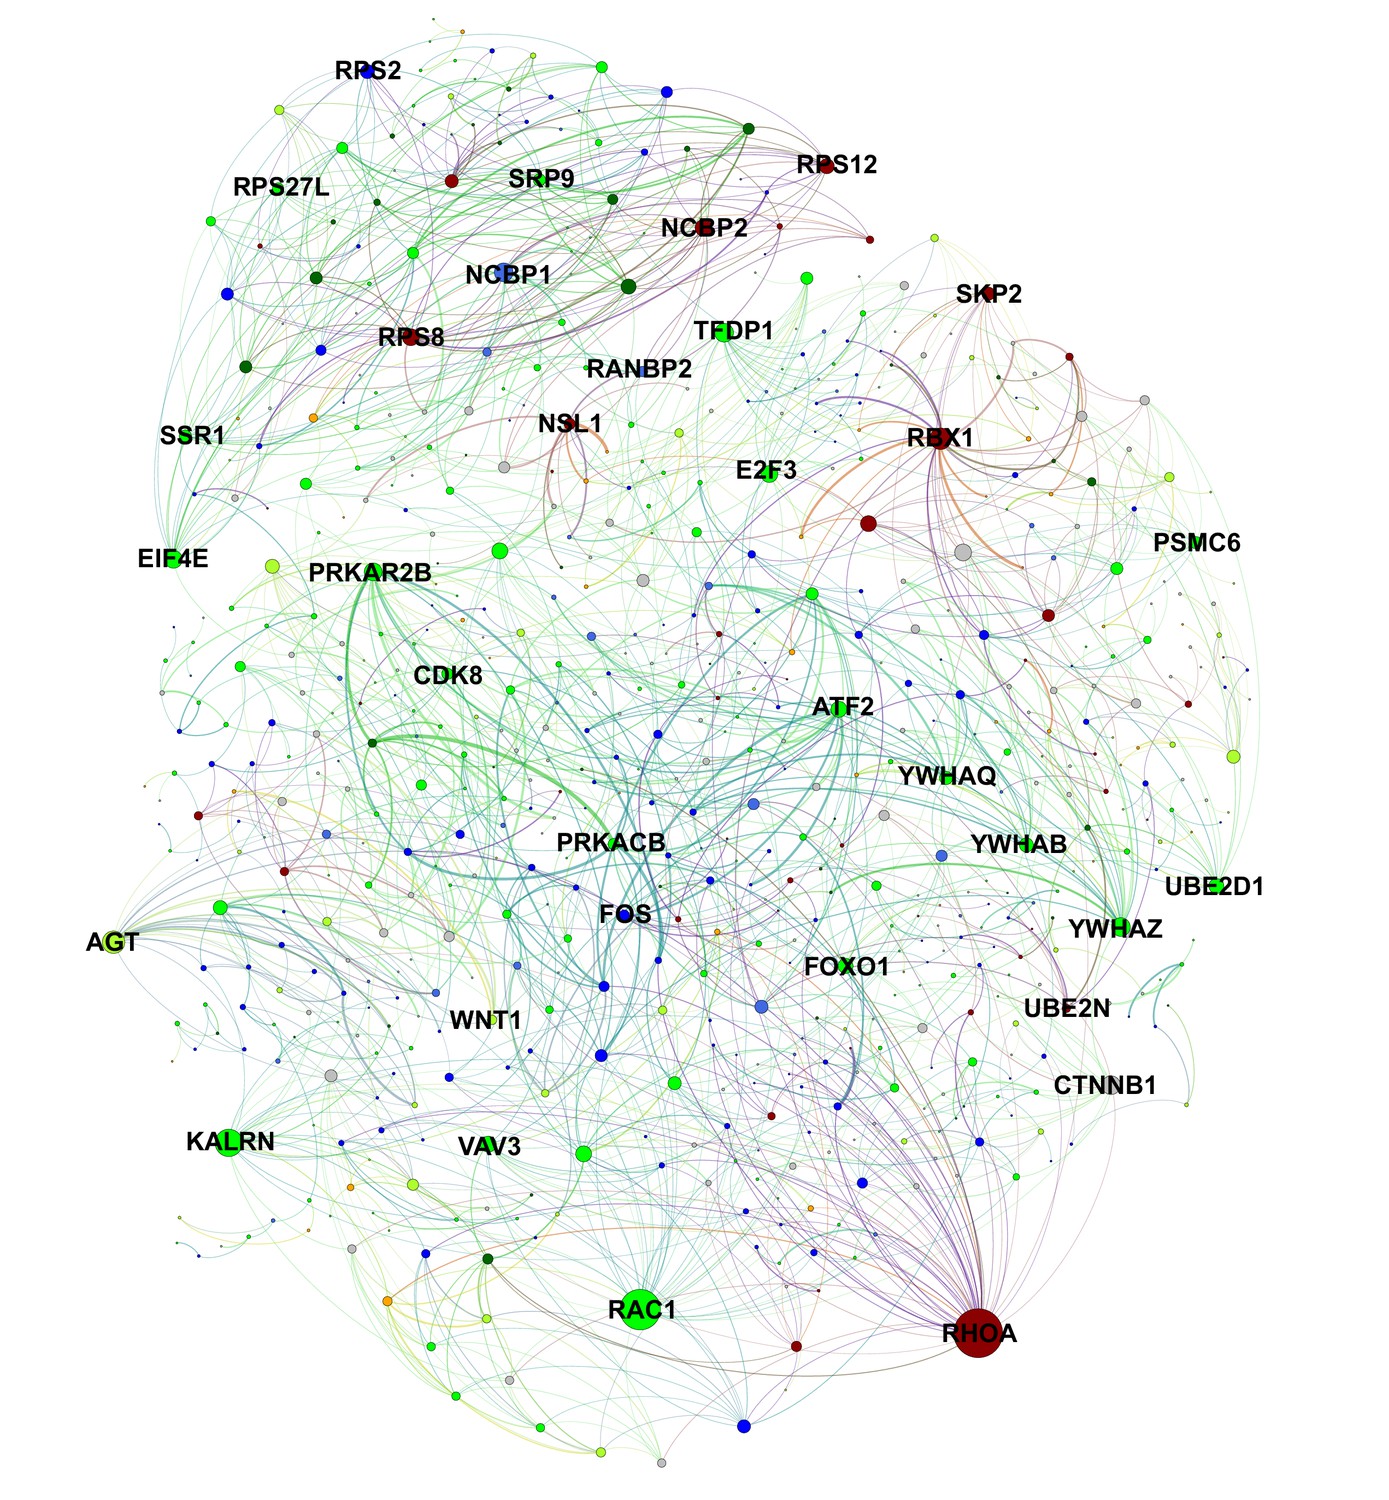
Protein-level interactions between song production and learning-related module genes in juvenile Area X.
A protein interaction network plot using the STRING database between genes in learning-related (darkred, green, greenyellow) and song production (black, blue, darkgreen, orange, royalblue) modules. Nodes are scaled by number of connections. Edge width is determined by scaling the STRING protein interaction confidence score for the two nodes by the product of each node’s intramodular connectivity. Interactions within learning or song production modules are omitted for clarity.
-
Figure 7—source data 1
An edgelist in. gexf format used to generate Figure 7.
- https://doi.org/10.7554/eLife.30649.033
Figure 8
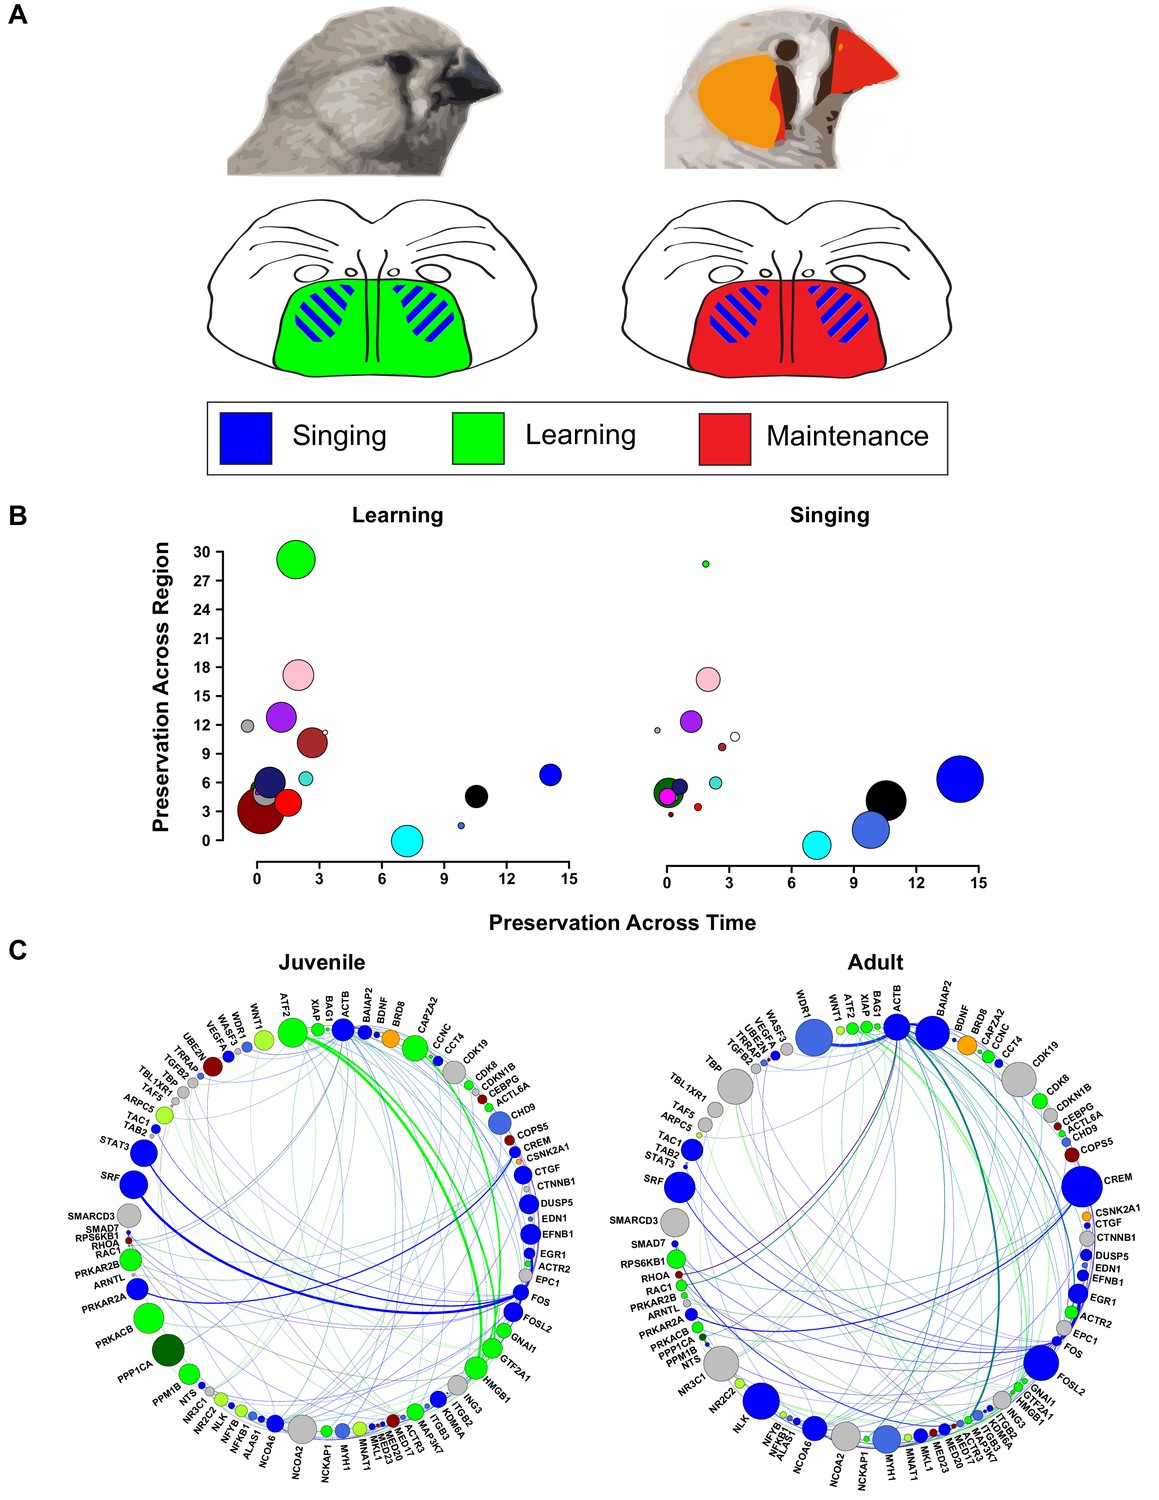
Changes in vocal plasticity state between juvenile and adult birds.
(A) Schematics depict the juvenile straitopallidum (left) in a ‘plastic’ state in which genes in learning-related modules (green) are densely interconnected and of high importance in the network. Simultaneously, singing driven gene coexpression patterns (blue) occur in Area X. In the adult striatopallidum (right), song production modules (blue) exist as they do in juveniles, but the learning-related modules do not and are replaced by coexpression patterns that presumably underlie the maintenance of song (red). (B) Area X modules in the juvenile brain are plotted to emphasize their preservation in adult Area X (x-axis) and juvenile VSP (y-axis). Points representing the module colors are scaled by the module’s absolute correlation to learning (left) or the absolute correlation to singing (right), emphasizing the preservation of singing coexpression patterns into adulthood and learning coexpression patterns in the juvenile striatopallidum. (C) Genes in song production or learning-related modules that are within two steps of ATF2 in the high-confidence protein interaction network are shown. Nodes are scaled by intramodular connectivity in juveniles (left) or adults (right) with edge width indicative of adjacency between genes in the coexpression network. The change in coexpression patterns across age groups causes decreased connectivity of many learning-related genes, driving an alteration in the network’s landscape which may underlie the transition from song learning to song maintenance.
Author response image 1
GFP-only network dendrogram, modules, and gene significances for investigated traits.
Module colors are preserved with the all-samples network modules (e.g. main text Figure 3A,B) if significant overlap between modules was observed between the two networks. Like the all-samples network, the green module here displays a strong positive correlation to learning even though gene significance is computed only from GFP-injected birds’ learning data.
Author response image 2
Module preservation statistics between all-samples network and GFP-only network.
The green module is extremely well preserved between the two networks, as indicated by Zsummary (left) and preservation rank (right).
Author response image 3
GFP-only network module eigengenes with Pearson correlations to analyzed behaviors and FDR-corrected p-values.
Module colors are consistent between the GFP-only and all-samples networks when significant overlap between the modules exists.
Author response image 4

Learning trajectories demonstrate that birds’ songs change over song development.
Learning trajectory is calculated by quantifying acoustic similarity between birds’ songs over the course of the experiment and their song on the day of sacrifice (~65d). Upward trajectory indicates the songs for all three virus groups change over time. In agreement with the work of Heston & White, (2015), the FoxP2.FL group’s (black) song changes over time but, as illustrated in main text Figure 3D, not to match the tutor’s song.
Author response image 5
FoxP2 overexpression is not evident in VSP samples.
Using the same primers and reaction conditions as the Area X samples (main text Figure 1C), FoxP2 overexpression is not observed in either virus group relative to GFP.
Author response image 6
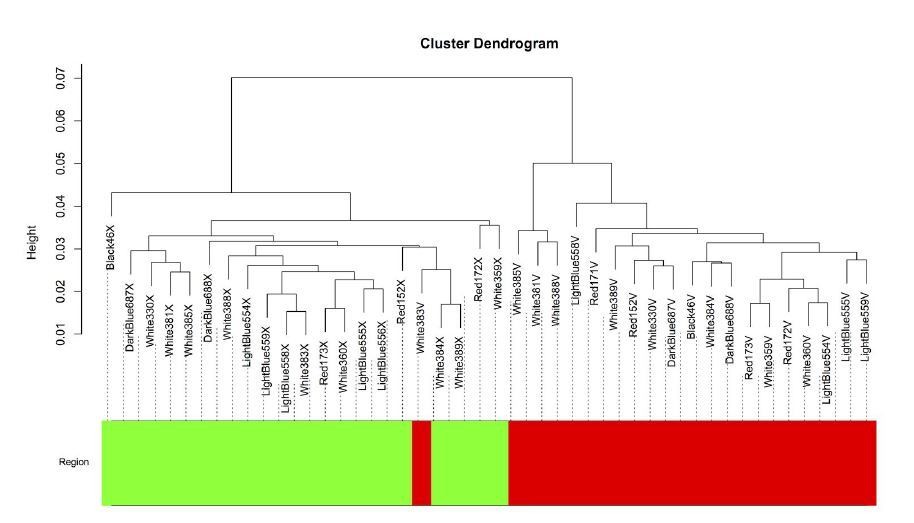
The intersample correlation (y-axis) delineates a clear split between Area X samples (green) and VSP samples (red).
One VSP sample (White383V) clustered with the Area X samples but was not included in the Area X network.
Author response image 7
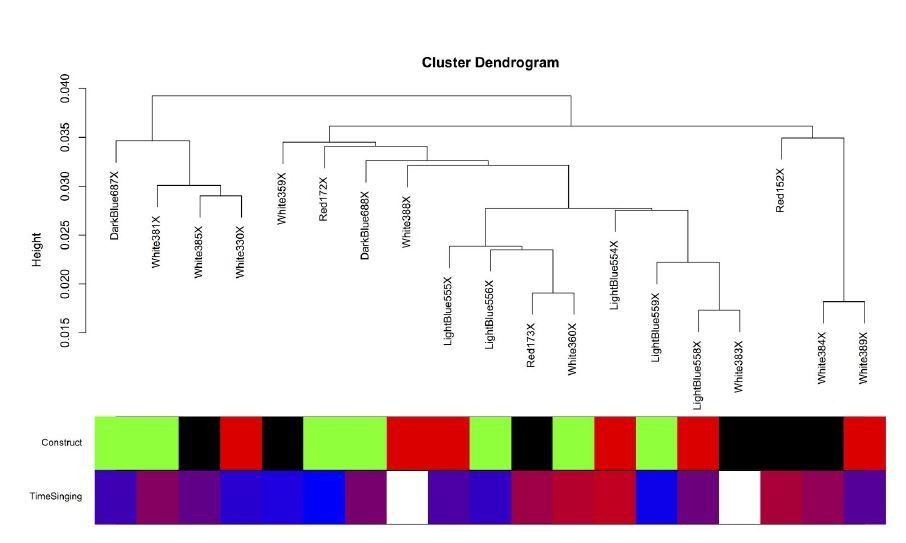
The intersample correlation for the Area X samples does not clearly delineate clusters by virus construct.
Virus construct is indicated in green (GFP), black (FoxP2.FL), and red (FoxP2.10+). Below, time singing is indicated on a blue-red color scale where the samples from birds that sang the most are colored the deepest red.
Author response image 8
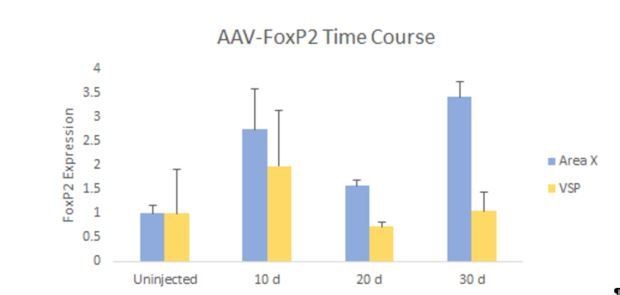
FoxP2 expression in Area X is elevated for up to 30 days following AAV-FoxP2 injection.
Juvenile birds (~30d) were injected with our FoxP2 overexpressing construct, bilaterally into Area X. FoxP2 levels were examined 10 days (n=3), 20 days (n=4), and 30 days (n=3) post-injection. Results were normalized to uninjected birds sacrificed at ~60 days of age (n=3). Area X FoxP2 levels (blue bars), were significantly elevated at 20 days post-injection and remained so at 30 days post-injection. No such increases were observed in outlying VSP (yellow bars).
Author response image 9
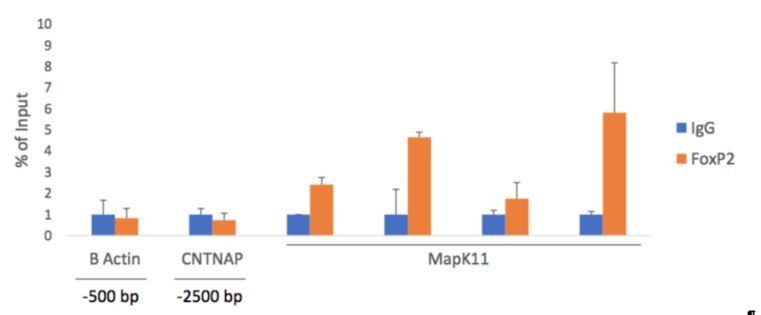
FoxP2 ChIP-qPCR shows an enrichment around the putative MapK11-FoxP2 binding motif.
To confirm our ChIP-PCR result, negative controls β actin (-500 bp upstream of TSS) and Cntnap2 (-2500 bp upstream of TSS of Cntnap2) show no enrichment of FoxP2 pulled down DNA by qPCR. Alternatively, primers amplifying the proposed FoxP2 binding motif and the adjacent regions, show increased signal, confirming our ChIP-PCR result.
Tables
Key resources table
| Reagent type (species) or resource | Designation | Source or reference | Identifiers | Additional information |
|---|---|---|---|---|
| Genetic reagent (Taeniopygia guttata) | AAV1-FoxP2.FL | Virovek (Hayward, CA, USA), DOI:10.1523/JNEUROSCI.3715-14.2015 | ||
| Genetic reagent (Taeniopygia guttata) | AAV1-FoxP2.10+ | Virovek (Hayward, CA, USA), this paper | ||
| Genetic reagent (Taeniopygia guttata) | AAV1-GFP | Virovek (Hayward, CA, USA), DOI:10.1523/JNEUROSCI.3715-14.2015 | ||
| Genetic reagent (Taeniopygia guttata) | HSV-FoxP2.10+ | McGovern Institute for Brain Research at the Massachusetts Institute of Technology, this paper | ||
| Antibody | FoxP2 (goat polyclonal) | Abcam (Cambridge, MA, USA) | Abcam Cat# ab1307; RRID: AB_1268914 | ChIP: 4 ug |
| Antibody | FoxP2 (rabbit polyclonal) | ThermoFisher (Rockford, IL, USA) | Thermo Fisher Scientific Cat# 720031; RRID: AB_2610345 | ChIP: 4 ug |
| Antibody | FoxP2 (mouse monoclonal) | Santa Cruz Biotechnology (Dallas, TX, USA) | Santa Cruz Biotechnology, Cat# sc-517261; RRID: AB_2721204 | ChIP: 4 ug |
| Antibody | IgG (rabbit polyclonal) | EMD Millipore (Burlington, MA, USA) | Millipore Cat# 12-370; RRID: AB_145841 | ChIP: 4 ug |
| Antibody | Xpress (mouse monoclonal) | ThermoFisher (Rockford, IL, USA) | ThermoFisher Scientific Cat# R910-25; RRID: AB_2556552 | |
| Sequence-based reagent | FoxP2.FL F | Sigma Aldrich | OligonucleotideCCTGGCTGTGAAAGCGTTTG | |
| Sequence-based reagent | FoxP2.FL R | Sigma Aldrich | OligonucleotideATTTGCACCCGACACTGAGC | |
| Sequence-based reagent | FoxP2.10+ F | Sigma Aldrich | OligonucleotideCGCGAACGTCTTCAAGCAAT | |
| Sequence-based reagent | FoxP2.10+ R | Sigma Aldrich | OligonucleotideAAAGCAATATGCACTTACAGGTT | |
| Sequence-based reagent | GAPDH F | Sigma Aldrich | OligonucleotideAACCAGCCAAGTACGATGACAT | |
| Sequence-based reagent | GAPDH R | Sigma Aldrich | OligonucleotideCCATCAGCAGCAGCCTTCA | |
| Sequence-based reagent | MapK11 F | Sigma Aldrich | OligonucleotideCCCTTTCCCCAAATGGCAGA | |
| Sequence-based reagent | MapK11 R | Sigma Aldrich | OligonucleotideTATGAGCCTTGCCTTGGAGC | |
| Sequence-based reagent | Mid probe | DOI:10.1523/jneurosci.1662-06.2006 | ||
| Sequence-based reagent | 3' probe | DOI:10.1523/jneurosci.1662-06.2006 | ||
| Commercial assay or kit | ChIP-IT High Sensitivity | Active Motif (Carlsbad, CA, USA) | Active Motif Cat# 53040 | |
| Commercial assay or kit | Qiagen RNeasy Micro | Qiagen (Germantown, MD, USA) | Qiagen Cat# 74004 | |
| Commercial assay or kit | Illumina TruSeq Stranded Poly-A Prep | Illumina (San Diego, CA, USA) | Illumina Cat# 20020594 | |
| Software, algorithm | VoICE | DOI:10.1038/srep10237 | RRID: SCR_016004 | |
| Software, algorithm | STAR | DOI:10.1093/bioinformatics/bts635 | RRID: SCR_015899 | |
| Software, algorithm | SAP | DOI:10.1006/anbe.1999.1416 | RRID: SCR_016003 | |
| Software, algorithm | WGCNA R Package | DOI:10.1186/1471-2105-9-559 | RRID: SCR_003302 |
Additional files
-
Supplementary file 1
Network data summary table.
(A) xlsx table summarizing all gene level Area X and VSP network data for the juvenile birds presented in this study. Area X connectivity data in the adult network are included (Hilliard et al., 2012a). Columns are sortable using Microsoft Excel and defined as follows: [A] Gene symbol as annotated by NCBI Taeniopygia guttata genome assembly 3.2.4 annotation release 103. [B] Human homolog of the zebra finch genes in column A, as dictated by NCBI. [C] Gene’s module assignment in the Area X overall network. NA implies the gene was in the VSP but not the Area X network. [D-E] Gene kIN and kTotal for juvenile Area X. [F-G] Gene kIN and kTotal for juvenile VSP. [H-I] Gene kIN and kTotal for adult Area X. [J-S] Gene significances (‘gs’) and q value for each gene-behavior trait relationship using Area X expression data. [T-BK] Module membership (‘MM’) as defined by correlation between the gene’s expression profile across all samples and a module’s eigengene and p-value for the correlation. [BL] Gene’s module assignment in the VSP network. [BM-BT] Same as columns J through S except using VSP expression data.
- https://doi.org/10.7554/eLife.30649.035
-
Supplementary file 2
GeneAnalytics gene ontology information
(A) xlsx workbook containing gene ontology information from the GeneCards GeneAnalytics module. For each module, there are four tabs sorted by default by descending module significance. Columns within each module are defined as follows: (1) Diseases: [A] Enrichment score. [B] Enrichment term. [C] Disease category. [D] Total genes annotated with this term. [E] Genes in this module annotated with this term. [F] Human gene symbols for genes in column E. [G] Link to disease page in GeneCards database. [H] Genetic associations (if applicable). [I] Matched genes for genetic associations (if applicable). [J] Differentially expressed in diseased tissues. [K] Matched genes for differential expression in diseased tissues. [L-P] Module and term significances for all behavior metrics (see Materials and methods). (2) GO – Biological Process, GO – Molecular Function, Pathways: [A] Enrichment score. [B] Enrichment term or pathway name. [C] Total genes annotated with this term or pathway. [D-E] Number and symbol of genes in this module annotated with this term. [F] Link to AMIGO or PathCards site for ontology term or pathway. [G-K] Module and term significances for all behavior metrics (see Materials and methods).
- https://doi.org/10.7554/eLife.30649.036
-
Supplementary file 3
Area X to VSP module preservation statistics
Module preservation statistics with Z scores and Bonferroni-corrected log10 p-values are presented in columns C-AL. Column C is the basis for the scatter plot presented as Figure 4B.
- https://doi.org/10.7554/eLife.30649.037
-
Supplementary file 4
Juvenile Area X to adult Area X module preservation statistics
Module preservation statistics with Z scores and Bonferroni-corrected log10 p-values are presented in columns C-AL. Column C is the basis for the scatter plot presented as Figure 5B.
- https://doi.org/10.7554/eLife.30649.038
-
Supplementary file 5
STRING database protein interaction data
Pairwise protein level interactions between genes in singing and learning modules. These nodes were linked with edges and presented as Figure 7. Columns are defined as follows: [A-B] Nodes 1 and 2, one of which is in a song production module and the other in a learning module. [C-F] Methods for weighting the protein interaction scores as described in Methods: Protein Interaction Networks and Scaling of Interaction Confidence Scores. Figure 7 uses weighted kIN (column C) as the metric for dictating edge width.
- https://doi.org/10.7554/eLife.30649.039
-
Transparent reporting form
- https://doi.org/10.7554/eLife.30649.040
Download links
A two-part list of links to download the article, or parts of the article, in various formats.
Downloads (link to download the article as PDF)
Open citations (links to open the citations from this article in various online reference manager services)
Cite this article (links to download the citations from this article in formats compatible with various reference manager tools)
FoxP2 isoforms delineate spatiotemporal transcriptional networks for vocal learning in the zebra finch
eLife 7:e30649.
https://doi.org/10.7554/eLife.30649


