Endothelial cells express NKG2D ligands and desensitize antitumor NK responses
- University of California, United States
Figures
Figure 1 with 2 supplements
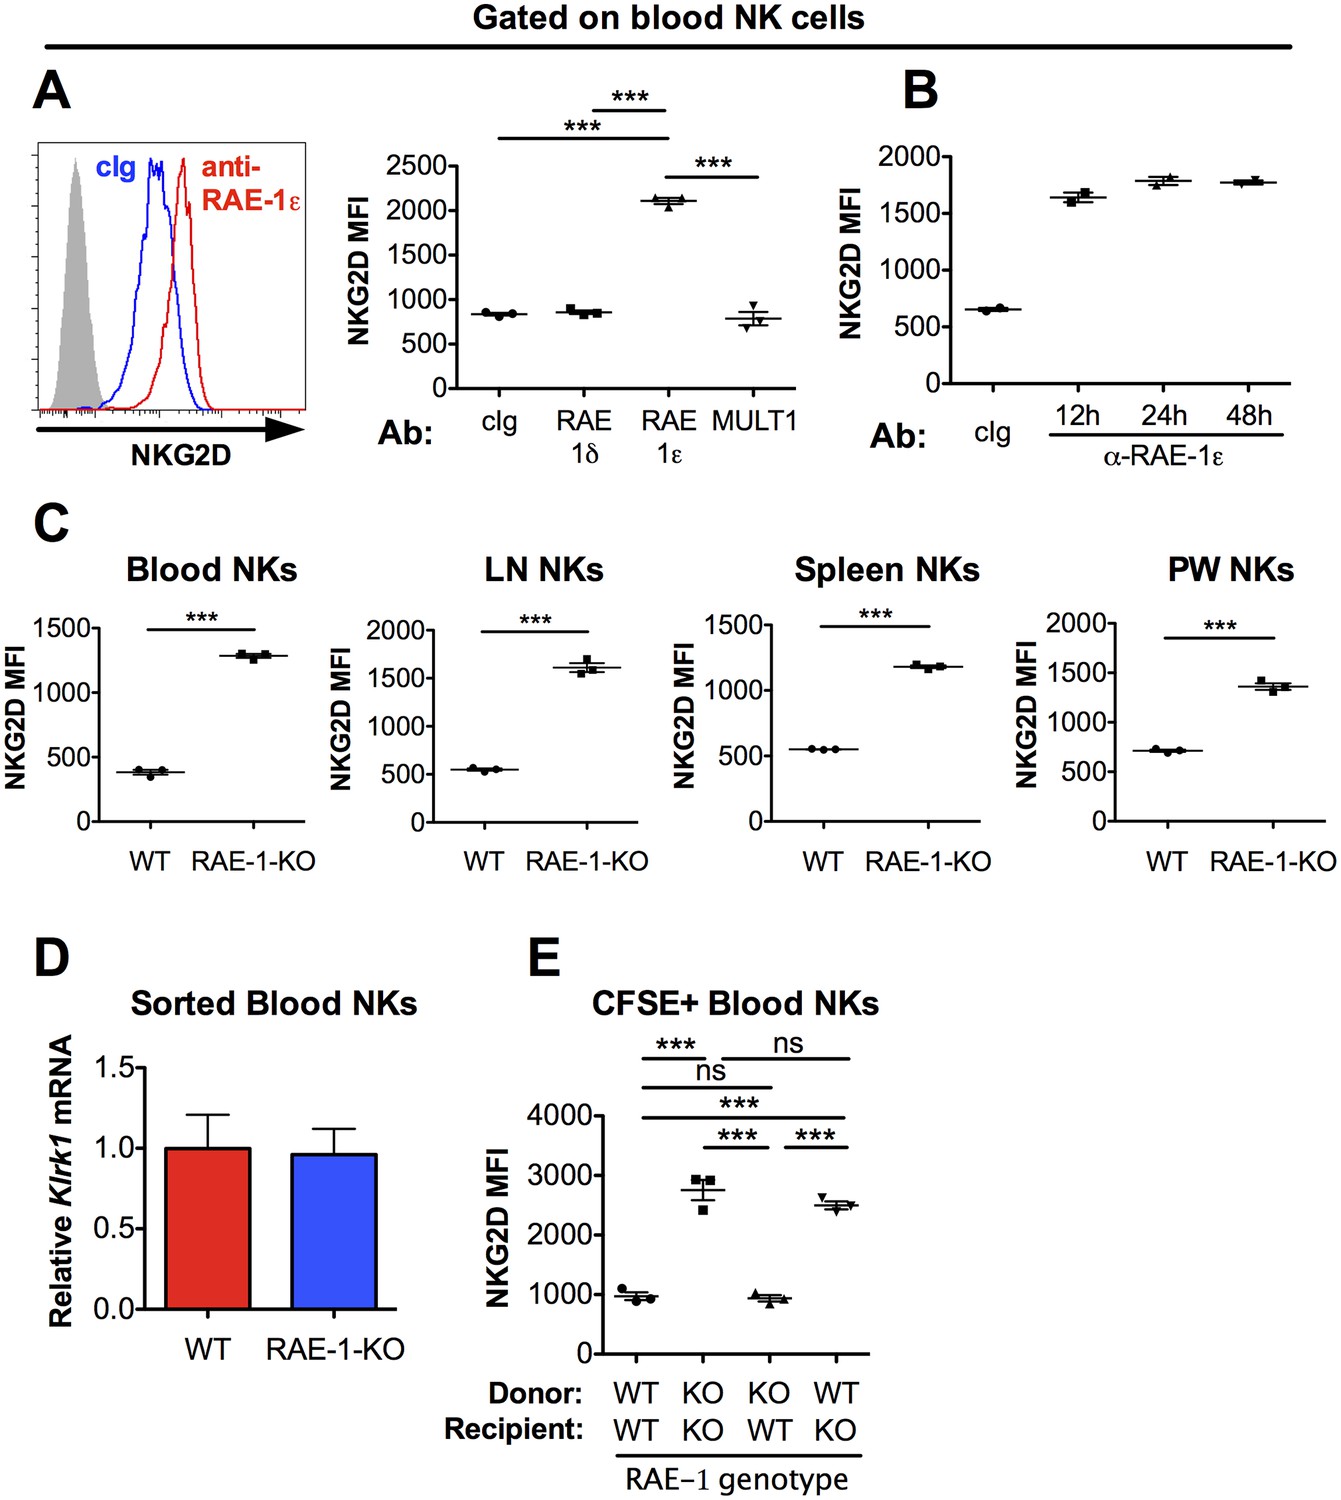
NKG2D is engaged and internalized by constitutive interactions with endogenous RAE-1ε in vivo.
(A) NKG2D surface levels measured by flow cytometry of blood NK cells 48 hr after injection of blocking antibody specific for the indicated NKG2D ligand. Data are representative of >4 independent experiments. (B) NKG2D surface levels on blood NK cells analyzed at the indicated time point after injection of anti-RAE-1ε. Data are representative of two independent experiments. (C) NKG2D surface levels on blood, lymph node, spleen, and peritoneal wash NK cells in RAE-1-KO mice or WT controls at steady state. Data are representative of >4 independent experiments. (D) Relative Klrk1 mRNA levels in blood NK cells sorted from WT or RAE-1-KO mice (n = 3) as measured by qRT-PCR. Data are representative of two independent experiments. (E) NKG2D surface levels on CFSE-labeled blood NK cells 48 hr after splenocyte transfer between WT and RAE-1-KO mice. Data are representative of two independent experiments. Statistical significance was determined using one-way ANOVA with Bonferroni post-tests (A, E) or a two-tailed unpaired Student’s t tests (C). Data represent means ± SEM.
Figure 1—figure supplement 1
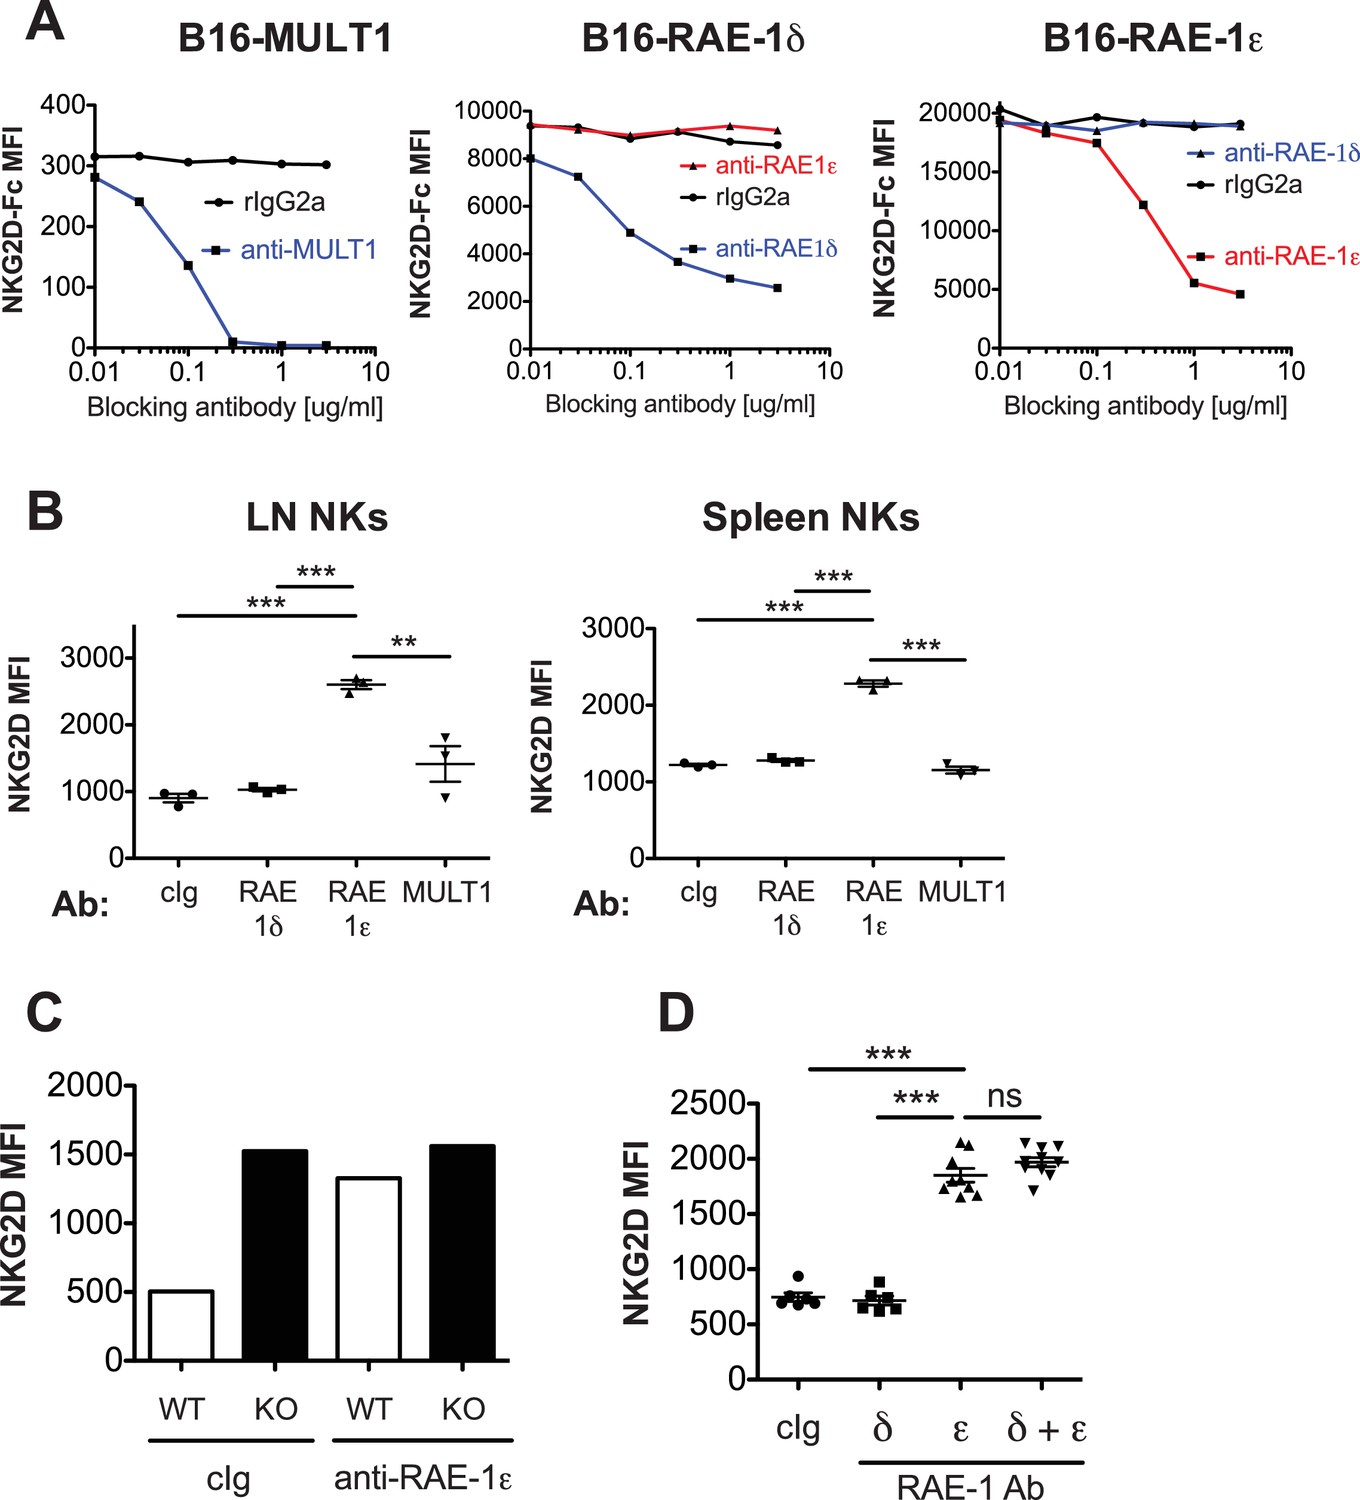
Blockade of RAE-1ε results in NKG2D upregulation.
(A) Specific blockade of NKG2D binding by anti-RAE-1 mAbs. The indicated cells lines were incubated for 20 min at 4°C with blocking antibody. Subsequently and without washing, biotinylated NKG2D-Fc fusion protein was added to a concentration of 2 μg/ml for 20 min at 4°C. Cells were washed and incubated for 20 min with fluorophore-labeled strepatvadin and analyzed by flow cytometry. Data are representative of three independent experiments. (B) NKG2D surface levels on lymph node and spleen NK cells 48 hr after injection of the indicated blocking antibodies. Data are representative of >4 independent experiments. (C) NKG2D surface levels on blood NK cells in WT or RAE-1-KO mice 48 hr after antibody injection. Data are representative of two independent experiments. (D) NKG2D surface levels on blood NK cells 48 hr after injection of the indicated antibody. Data are representative of two independent experiments. Statistical significance was determined using one-way ANOVA with Bonferroni post-tests. Data represent means ± SEM.
Figure 1—figure supplement 2

RAE-1-deficiency results in NKG2D upregulation in NK cells in bone marrow and liver.
(A) NKG2D surface levels on NK cells from bone marrow and liver. Data are representative of two independent experiments. Statistical significance was determined using two-tailed unpaired Student’s t tests. Data represent means ± SEM.
Figure 2 with 1 supplement
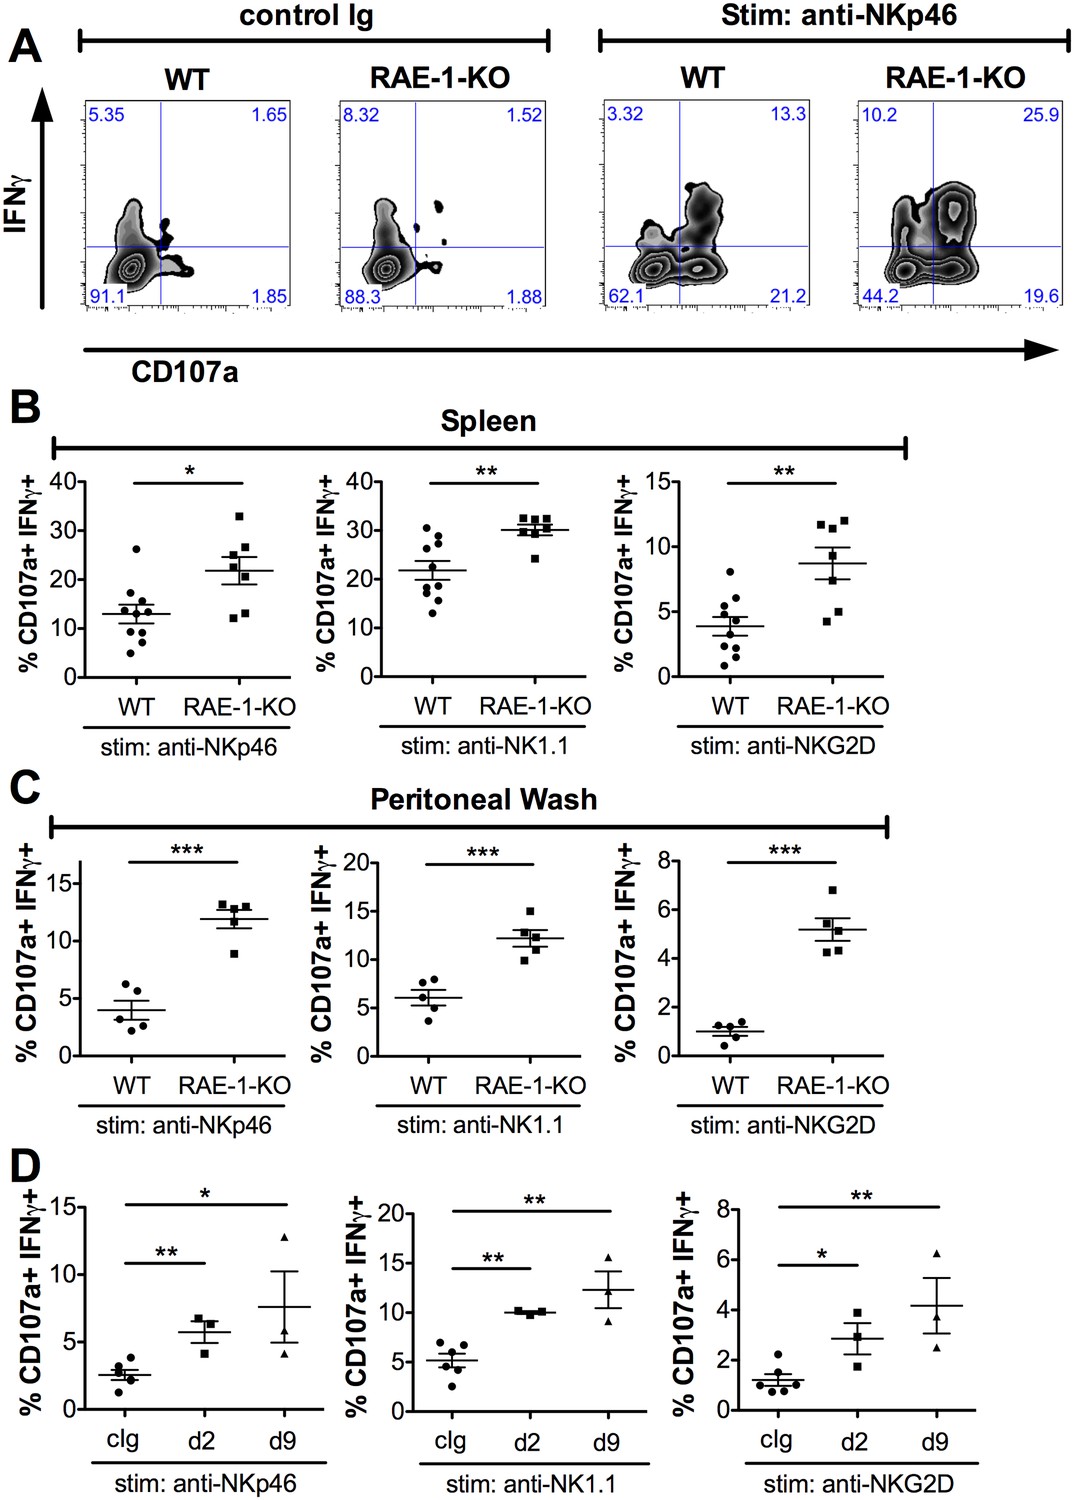
Endogenous RAE-1ε negatively regulates NK responsiveness.
(A) WT or RAE-1-KO splenic NK cell IFNγ production and degranulation (CD107a) after 5 hr ex vivo stimulation with platebound control Ig or anti-NKp46. (B and C) Percentage of activated (IFNγ- and CD107a-double-positive) splenic or peritoneal NK cells from WT or RAE-1-KO mice after ex vivo stimulation with the indicated plate-bound antibody. Data are representative of >4 independent experiments. (D) Percentage of activated peritoneal NK cells after ex vivo stimulation from mice given control Ig or anti-RAE-1ε for the indicated time. Data are representative of two independent experiments. Statistical significance was determined using two-tailed unpaired Student’s t tests. Data represent means ± SEM.
Figure 2—figure supplement 1
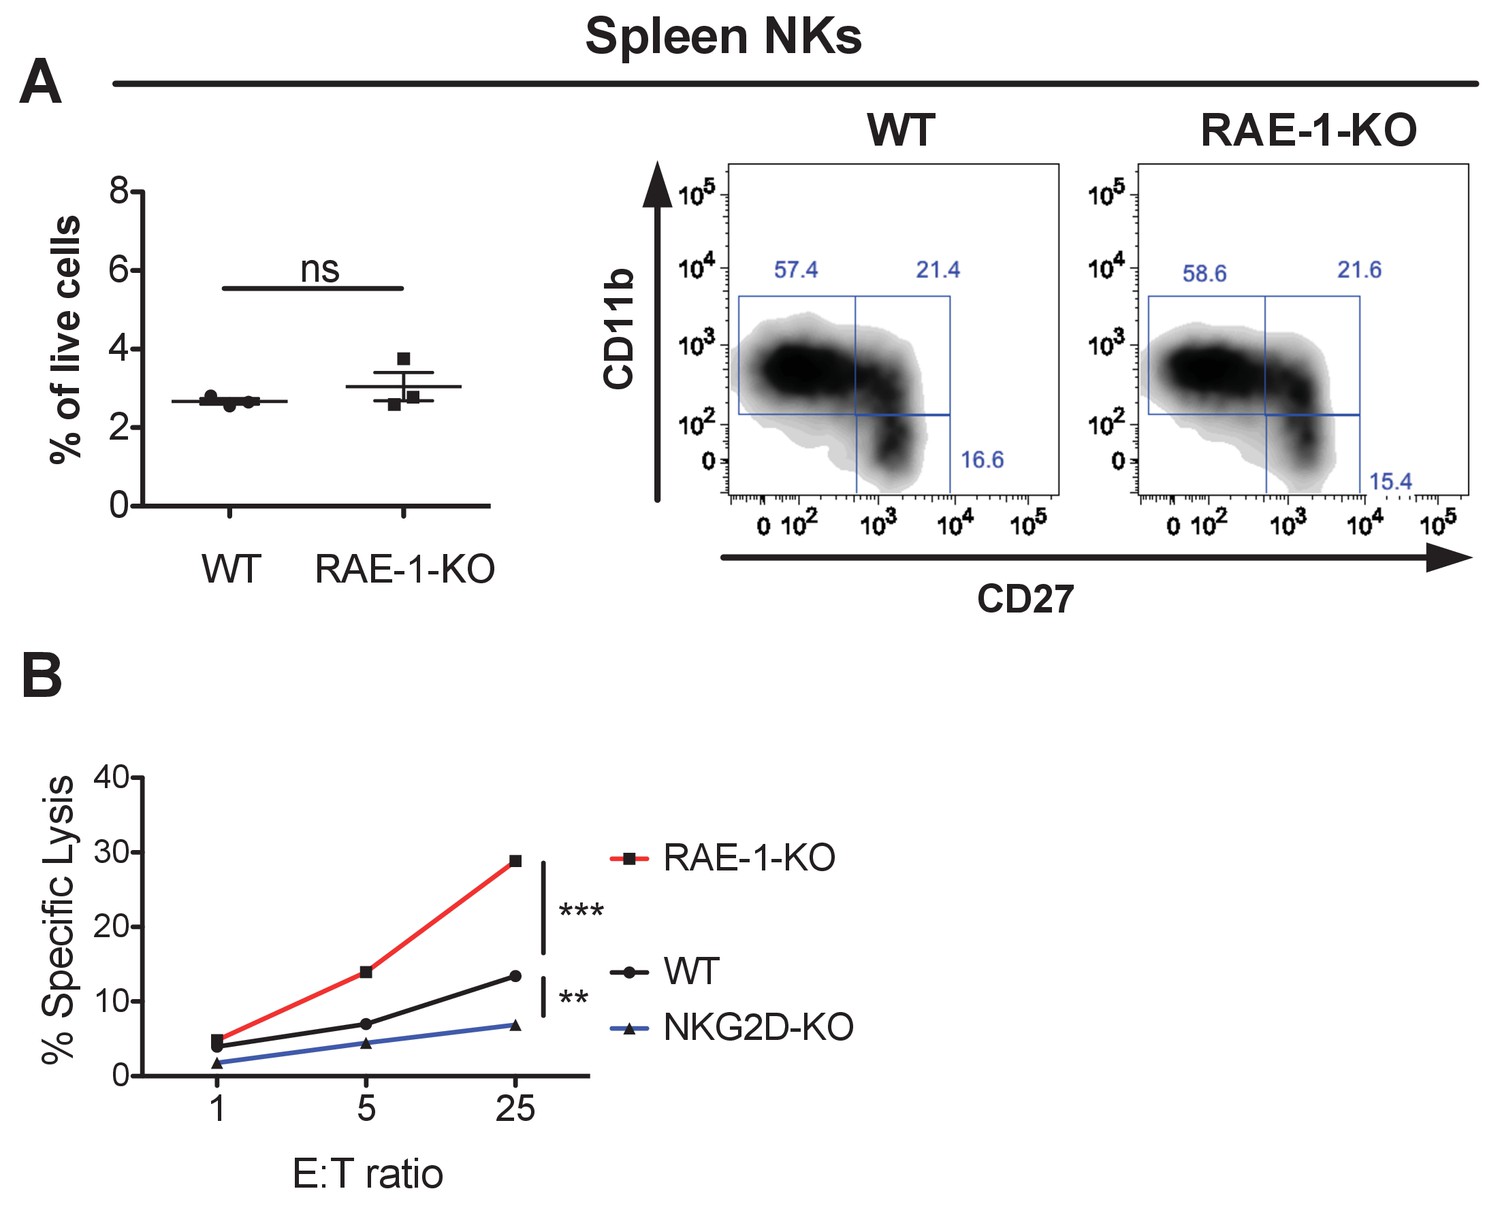
Normal NK cell cellularity and differentiation but enhanced NK-mediated tumor cell killing in RAE-1-knockout mice.
(A, left panel) NK cells from WT and RAE-1-KO mice as percentage of live splenocytes. Data are representative of >4 independent experiments. (A, right panel) CD27 and CD11b
expression on splenic NK cells from WT and RAE-1-KO mice. Data are representative of three independent experiments. (B) NK cells from WT, RAE-1-KO, or NKG2D-KO mice (n = 3) were pre-activated with a single injection of 200 g Poly I:C. Two days later, peritoneal wash cells were harvested, pooled, and used as effector cells to kill YAC-1 cells in a standard 51Cr in vitro cytotoxicity assay, at the indicated effector: target ratios. Data are representative of two independent experiments. Statistical significance was determined using unpaired two-tailed Student’s t tests (A) or two-way ANOVA (B). Data represent means ± SEM (error bars are not visible because they are small).
Figure 3 with 1 supplement
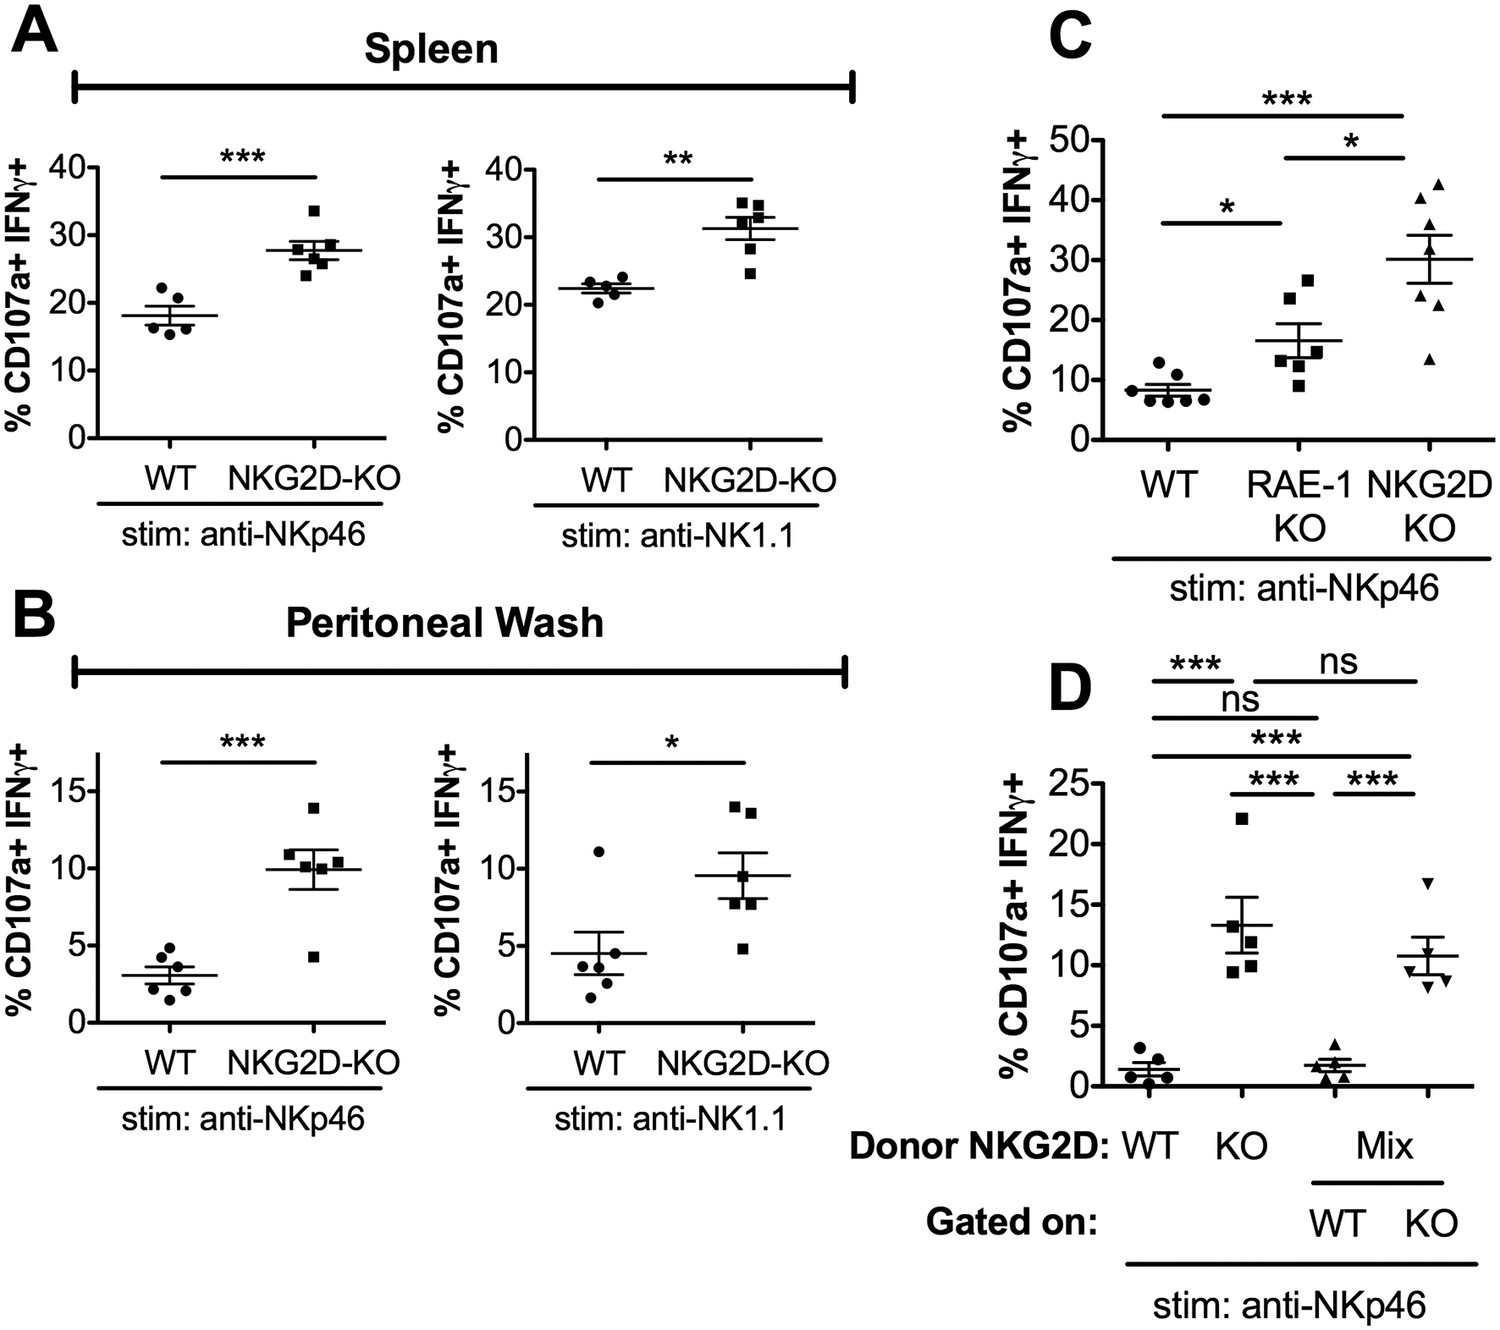
RAE-1ε contributes to cell-intrinsic NKG2D-mediated regulation of NK responsiveness.
(A and B) Percentage of activated splenic or peritoneal NK cells from WT or NKG2D-KO mice after ex vivo stimulation. Data are representative of >4 independent experiments. (C) NK activation in WT, RAE-1-KO, and NKG2D-KO peritoneal cells after ex vivo stimulation. Data are representative of three independent experiments. (D) NK activation after ex vivo stimulation of peritoneal cells from WT mice 8 weeks after lethal irradiation (11 Gy rad split dose) and reconstitution with bone marrow cells from WT (CD45.1) or NKG2D-KO (CD45.2) mice or a 1:1 mix. Data are representative of two independent experiments. Statistical significance was determined using one-way ANOVA with Bonferroni post-tests (C, D) or two-tailed unpaired Student’s t tests (A, B). Data represent means ± SEM.
Figure 3—figure supplement 1
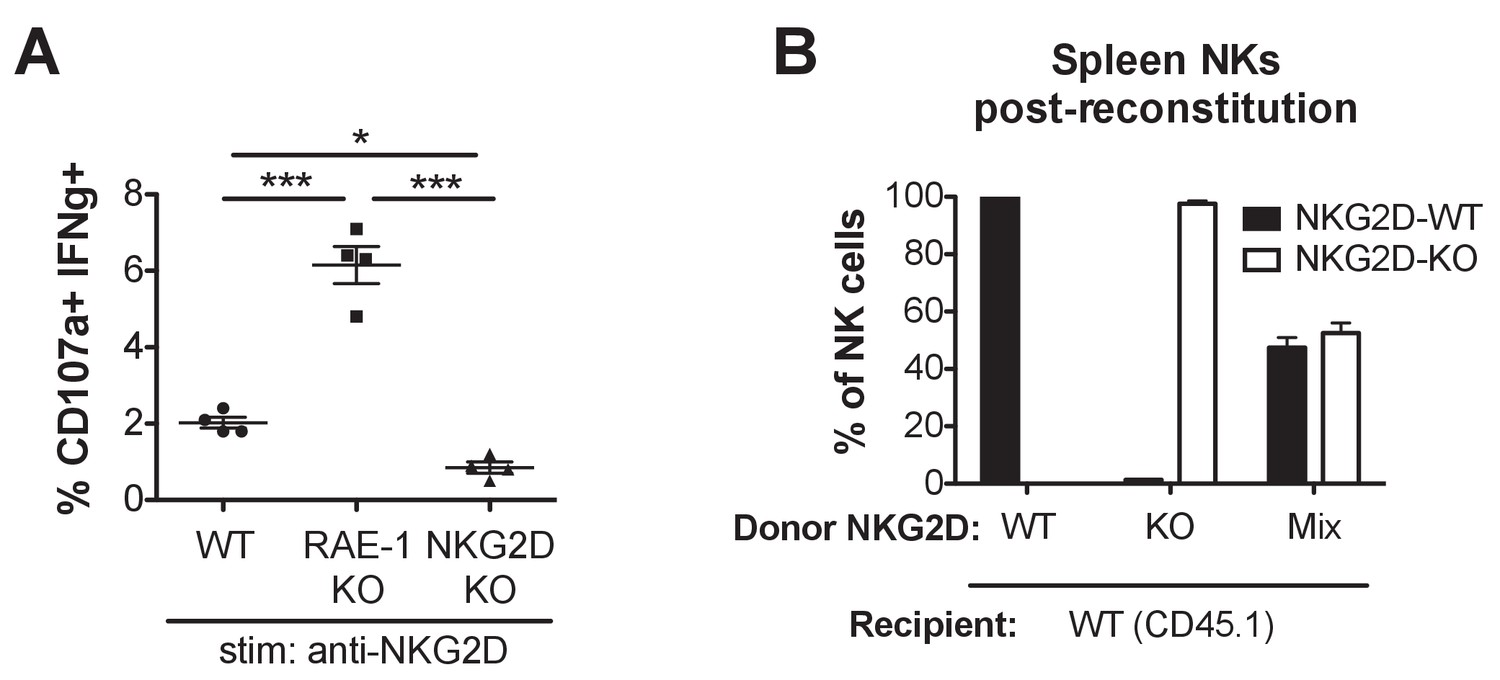
NK cell activation with NKG2D stimulation, and composition of NK cell population in mixed NKG2D bone marrow chimeras.
(A) NK activation in WT, RAE-1-KO, and NKG2D-KO peritoneal cells after ex vivo stimulation with platebound anti-NKG2D antibody. Data are representative of three independent experiments. (B) Composition of splenic NK cells 8 weeks after CD45.1 + mice were lethally irradiated and reconstituted with bone marrow cells from CD45.1 + NKG2 D-WT or CD45.2 + NKG2 D-KO mice or a 1:1 mixture. N = 5–6. Statistical significance was determined using one-way ANOVA with Bonferroni post-test. Data are representative of two independent experiments.
Figure 4 with 2 supplements
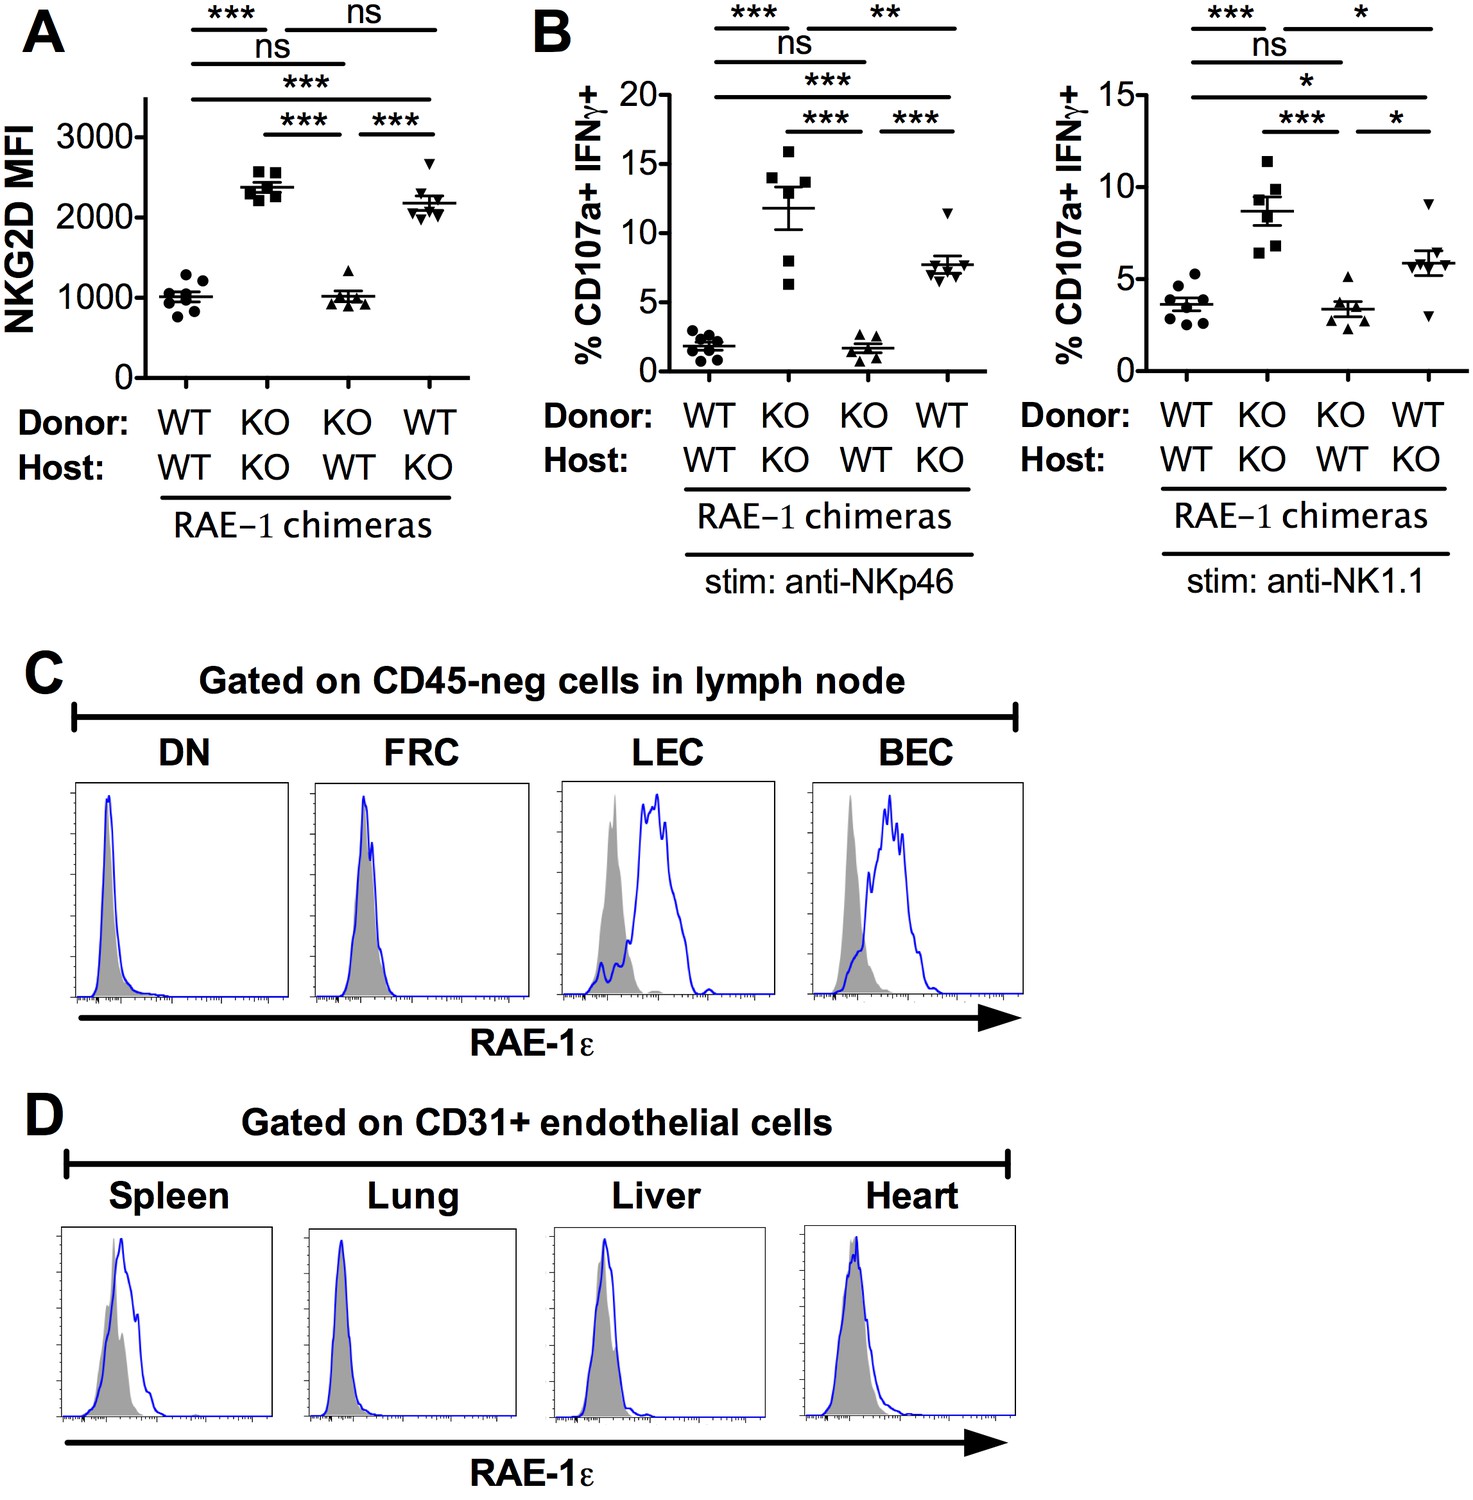
Lymph node endothelial cells as the endogenous source of RAE-1ε.
(A) NKG2D cell surface levels on blood NK cells 8 weeks after WT or RAE-1-KO mice were lethally irradiated and reconstituted with WT or RAE-1-KO bone marrow. Data are representative of three independent experiments. (B) Percentage of activated NK cells from peritoneal cells from WT and RAE-1-KO bone marrow chimeras after plate-bound antibody stimulation. Data are representative of two independent experiments. (C) RAE-1ε expression on the indicated CD45-neg stromal cell populations in inguinal lymph nodes from WT mice. Data are representative of >4 independent experiments. (D) RAE-1ε expression gated on CD45-neg; Ter119-neg; CD31+ endothelial cells in the indicated organs. Data are representative of three independent experiments. Statistical significance was determined using one-way ANOVA and Bonferroni post-tests. Data represent means ± SEM.
Figure 4—figure supplement 1
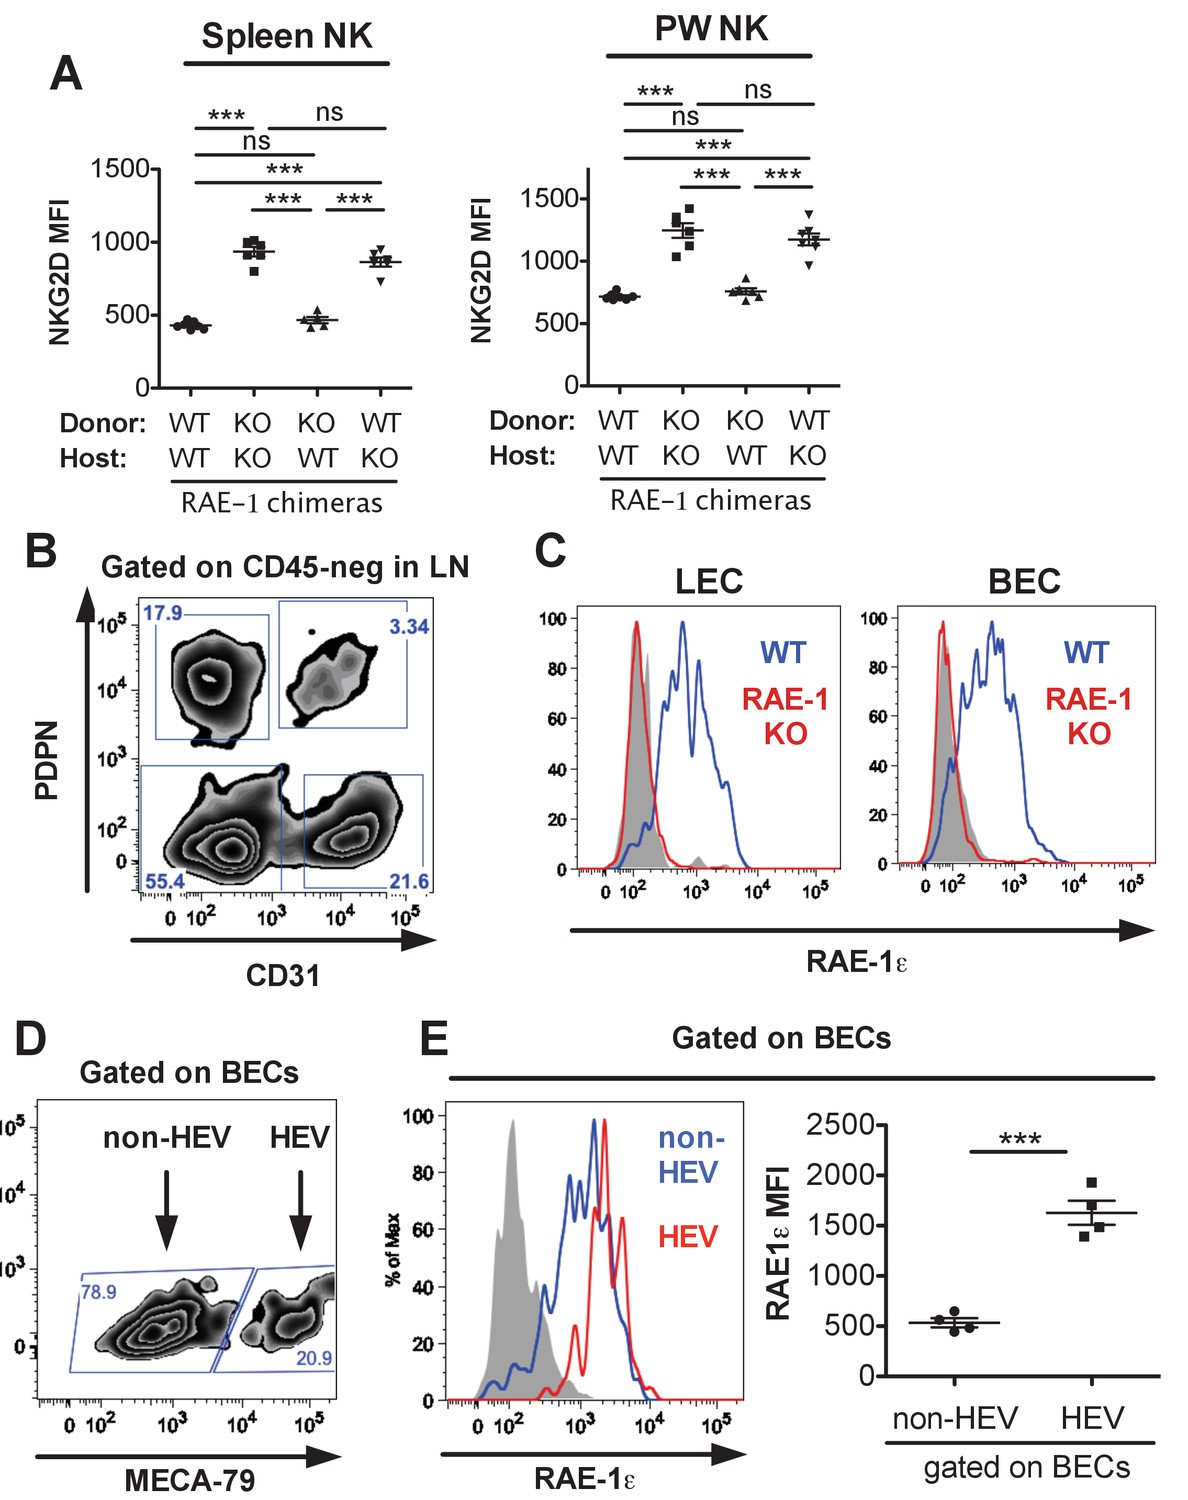
Spleen and peritoneal wash NKG2D expression in RAE-1 bone marrow chimeras, and expression of RAE-1 on endothelial cells and high endothelial venules.
(A) NKG2D surface levels on NK cells from spleens or lymph nodes of RAE-1-KO chimeric mice. Data are representative of three independent experiments. (B) Gating strategy for the four populations of lymph node CD45-negative stromal cells identified by expression of CD31 and Podoplanin. (C) RAE-1ε on inguinal lymph node blood endothelial cells (BECs) and lymphatic endothelial cells (LECs) in WT and RAE-1-KO mice. Data are representative of three independent experiments. (D) Gating strategy to identify HEV BECs in inguinal lymph nodes using the MECA-79 antibody (E) RAE-1ε levels on HEV and non-HEV BECs in inguinal lymph nodes from WT mice. Data are representative of three independent experiments. Statistical significance was determined using one-way ANOVA with Bonferroni post-tests (A) or two-tailed unpaired Student’s t tests (E). Data represent means ± SEM.
Figure 4—figure supplement 2

Comparison of RAE-1 expression by endothelial cells in different organs and sites.
RAE-1ε MFI levels on endothelial cells (CD45-neg; Ter119-neg; CD31+) in the indicated tissues.
Figure 5 with 1 supplement
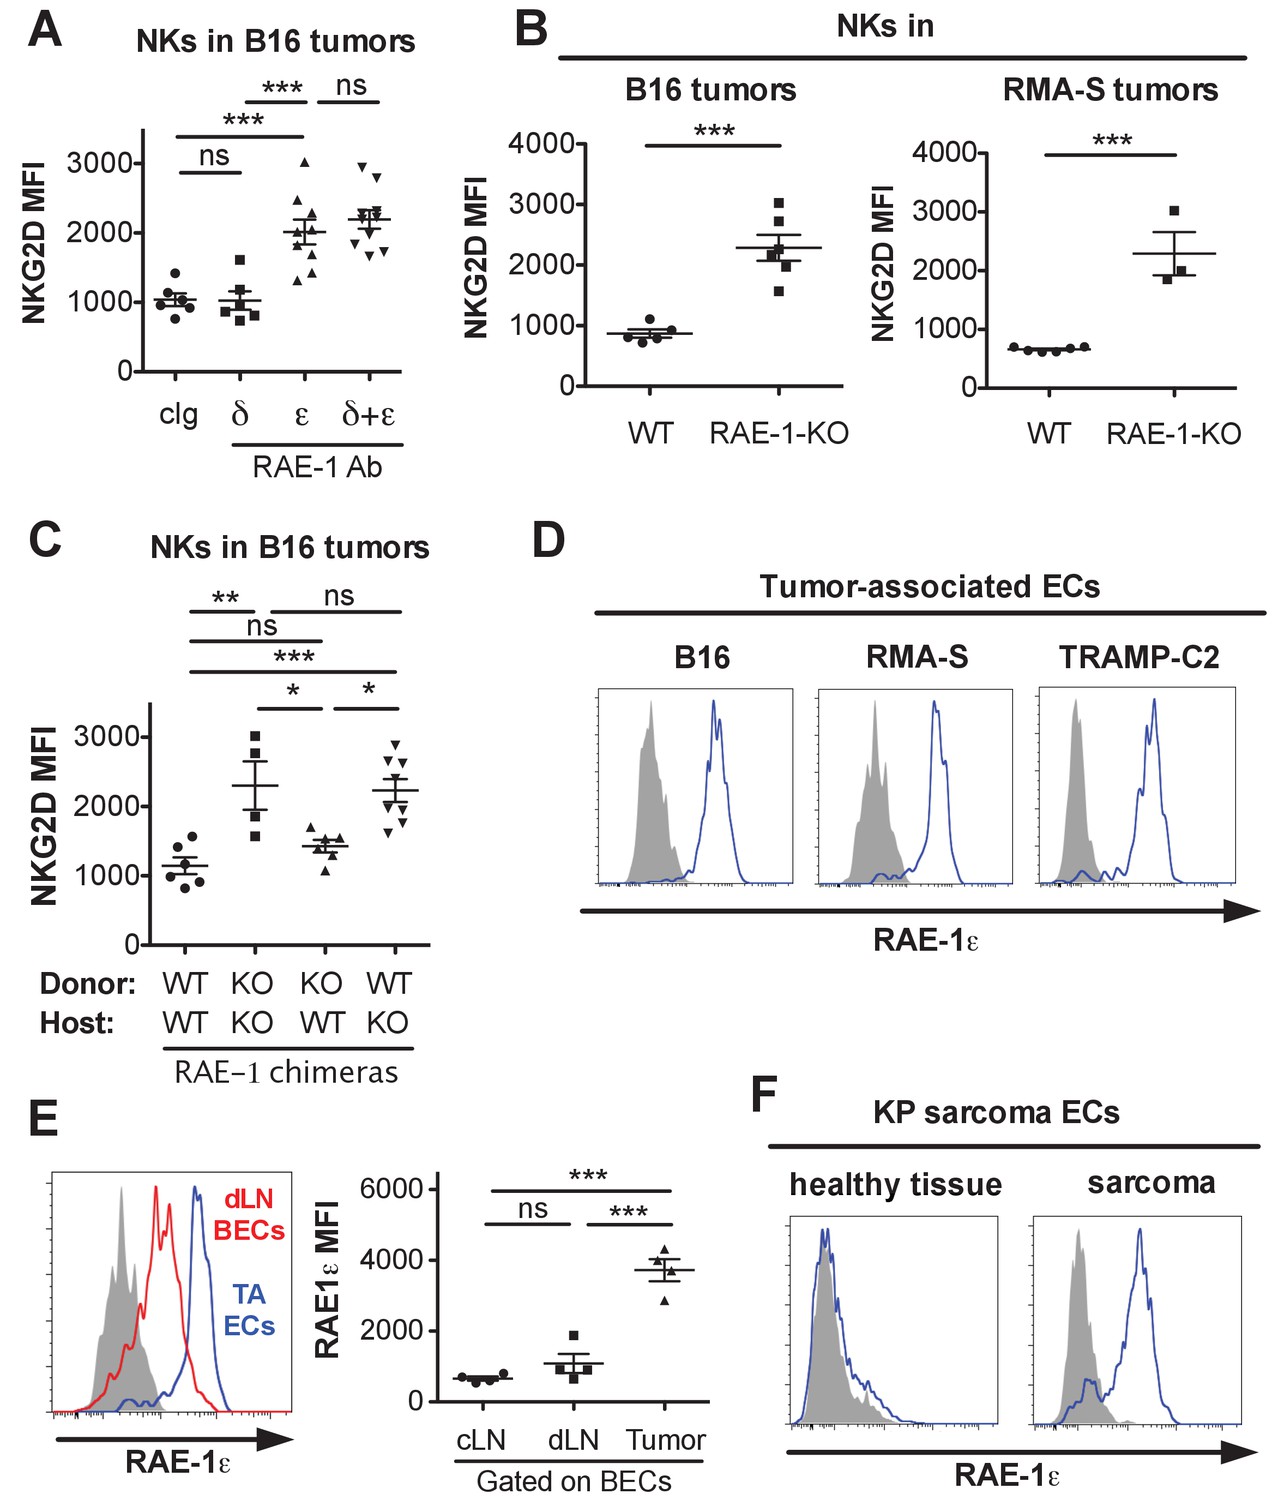
Endothelial RAE-1ε and NKG2D engagement in the tumor microenvironment.
(A) NKG2D surface levels on NK cells infiltrating subcutaneous B16 tumors in mice 48 hr after injection of the indicated antibody. Data are representative of three independent experiments. (B) NKG2D surface levels on NK cells from dissociated B16 or RMA-S subcutaneous tumors in WT or RAE-1-KO mice. Data are representative of >4 independent experiments. (C) NKG2D surface levels on NK cells infiltrating established B16 tumors in WT or RAE-1-KO chimeric mice. Data are representative of three independent experiments. (D) RAE-1ε expression gated on tumor-associated endothelial cells in WT mice with established B16, RMA-S, or TRAMP-C2 tumors. Data are representative of >4 independent experiments. (E) RAE-1ε expression on tumor-associated endothelial cells (TA ECs) or blood endothelial cells in draining inguinal lymph nodes (dLN BECs) or contralateral control lymph nodes (cLN BECs) from WT mice with established B16 tumors. Data are representative of >4 independent experiments. (F) RAE-1ε expression on endothelial cells in hind leg sarcomas from KP mice or matched healthy tissue from the other hind leg. Data are representative of three independent experiments. Statistical significance was determined using one-way ANOVA and Bonferroni post-tests (A, C, E) or a two-tailed unpaired Student’s t test (B). Data represent means ± SEM.
Figure 5—figure supplement 1
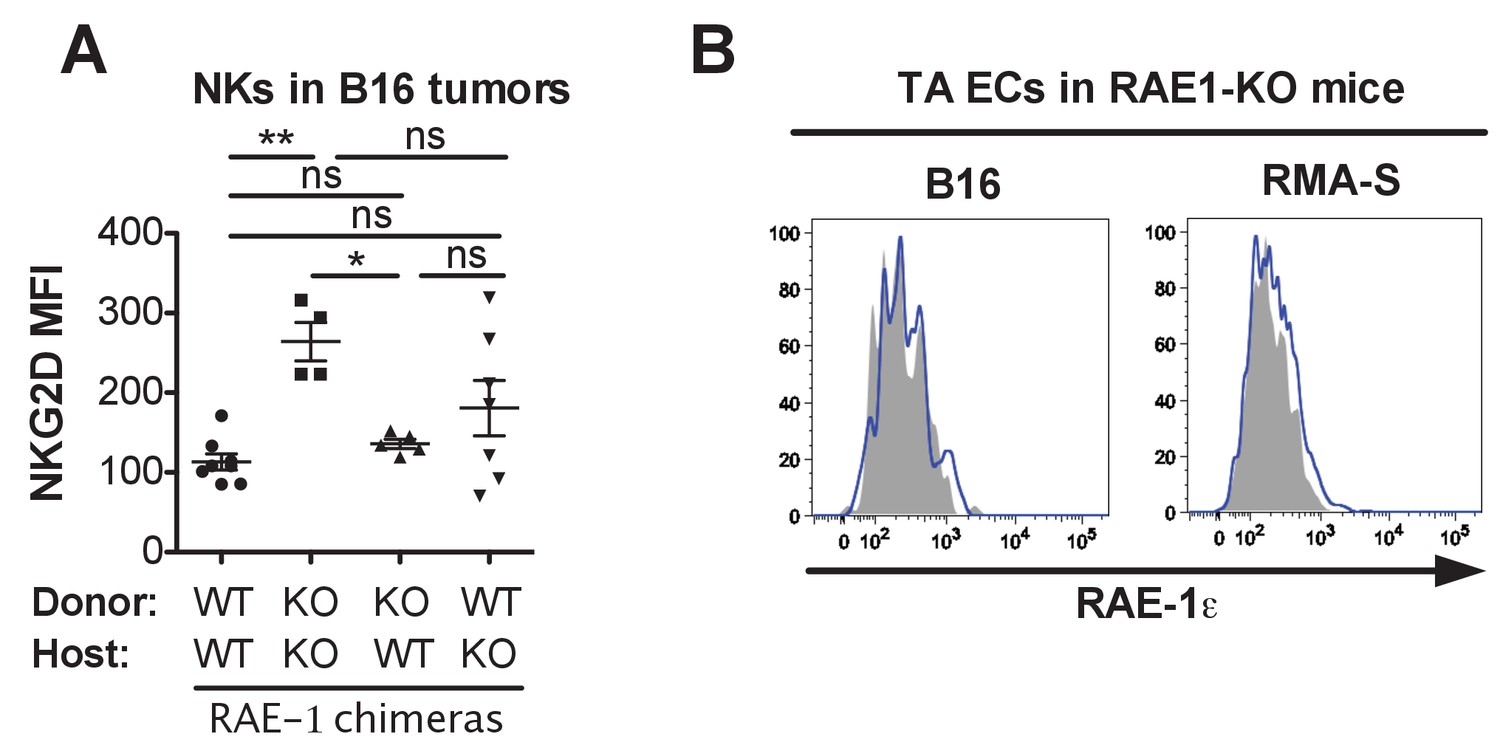
Analysis of tumor-associated NKG2D levels in RAE-1 chimeras and endothelial RAE-1ε staining in RAE-1-KO mice.
(A) Repetition of the experiment in Figure 5C. Statistical significance was determined using one-way ANOVA with Bonferroni post-tests. (B) RAE-1ε staining on endothelial cells in established B16 or RMA-S tumors in RAE-1-KO mice. Data represent means ± SEM.
Figure 6 with 1 supplement
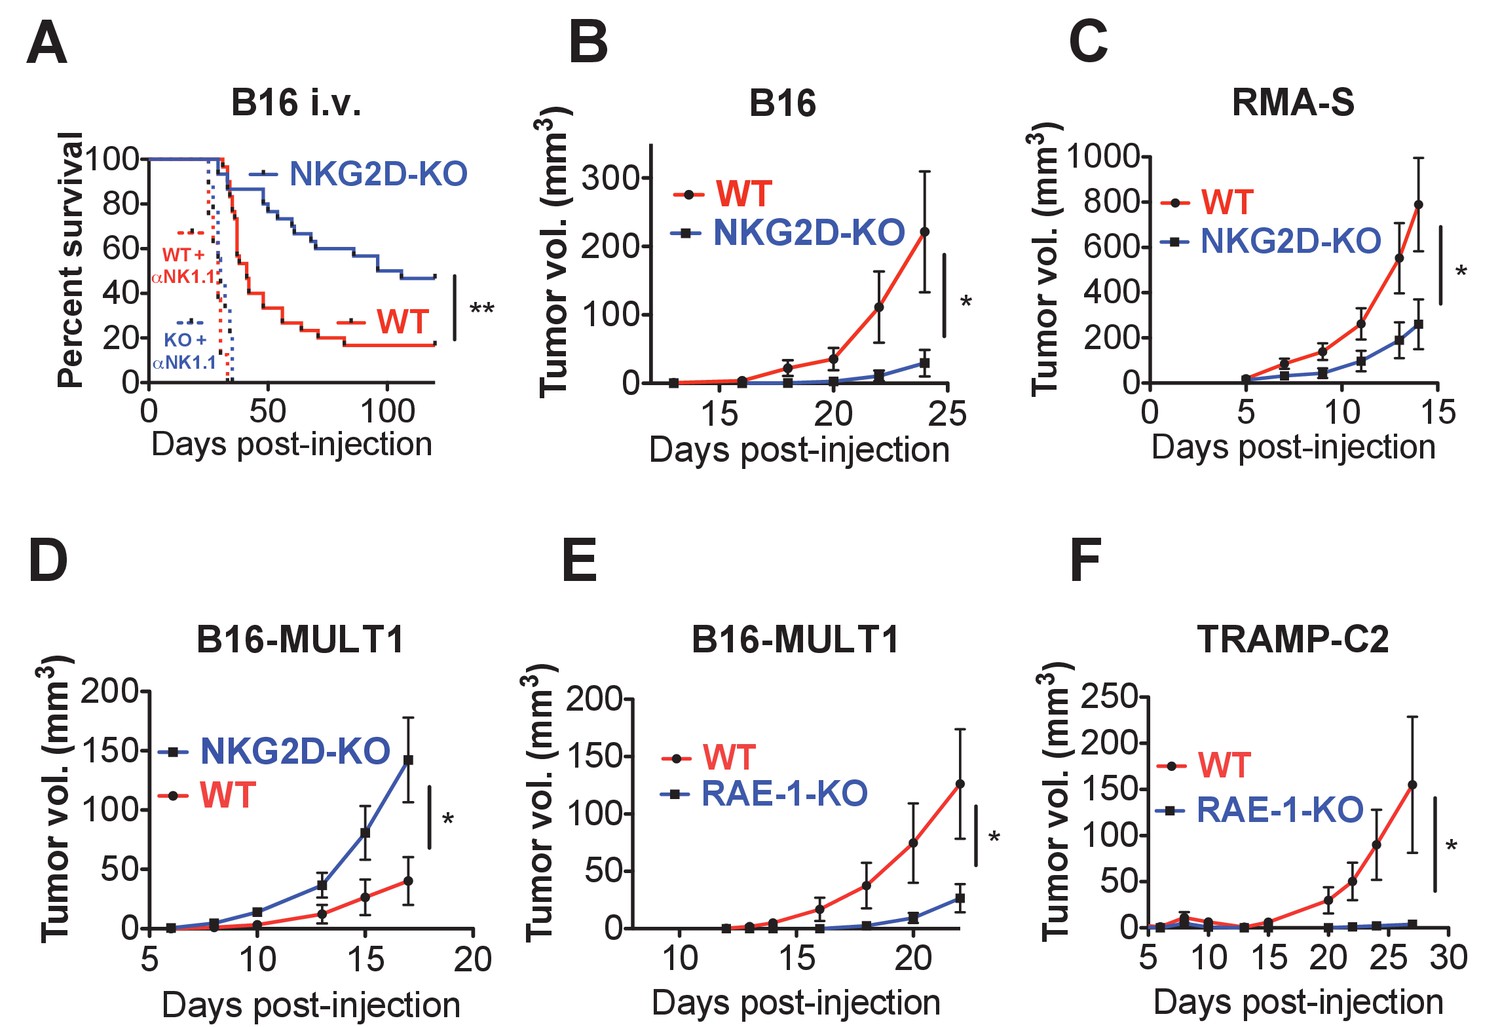
Endogenous RAE-1ε - NKG2D interactions limit NK responses to tumors.
(A) WT or NKG2D-KO mice (n = 29–30) were challenged with 2 × 10⁴ B16 cells i.v. and monitored for morbidity. Matched groups of each strain (n = 9–10) were depleted of NK cells before implanting the tumor cells. Data are combined results of three independent experiments. (B) WT or NKG2D-KO mice (n = 9) were challenged with 5 × 10³ B16 cells s.c. and monitored for tumor growth. Data are representative of three independent experiments. (C) WT or NKG2D-KO mice (n = 9) were challenged with 5 × 10⁵ RMA-S cells s.c. and monitored for tumor growth. Data are representative of three independent experiments. (D) WT or NKG2D-KO mice (n = 9) were challenged with 5 × 10⁴ B16-MULT1 cells s.c. and monitored for tumor growth. Data are representative of two independent experiments. (E) WT or RAE-1-KO mice were challenged with 5 × 10⁴ B16-MULT1 cells s.c. and monitored for tumor growth. (n = 12) Data are representative of three independent experiments. (F) WT or RAE-1-KO mice (n = 7–8) were challenged with 2 × 10⁶ TRAMP-C2 cells s.c. and monitored for tumor growth. Data are representative of three independent experiments. Statistical significance was determined using two-way ANOVA. Data represent means ± SEM.
Figure 6—figure supplement 1
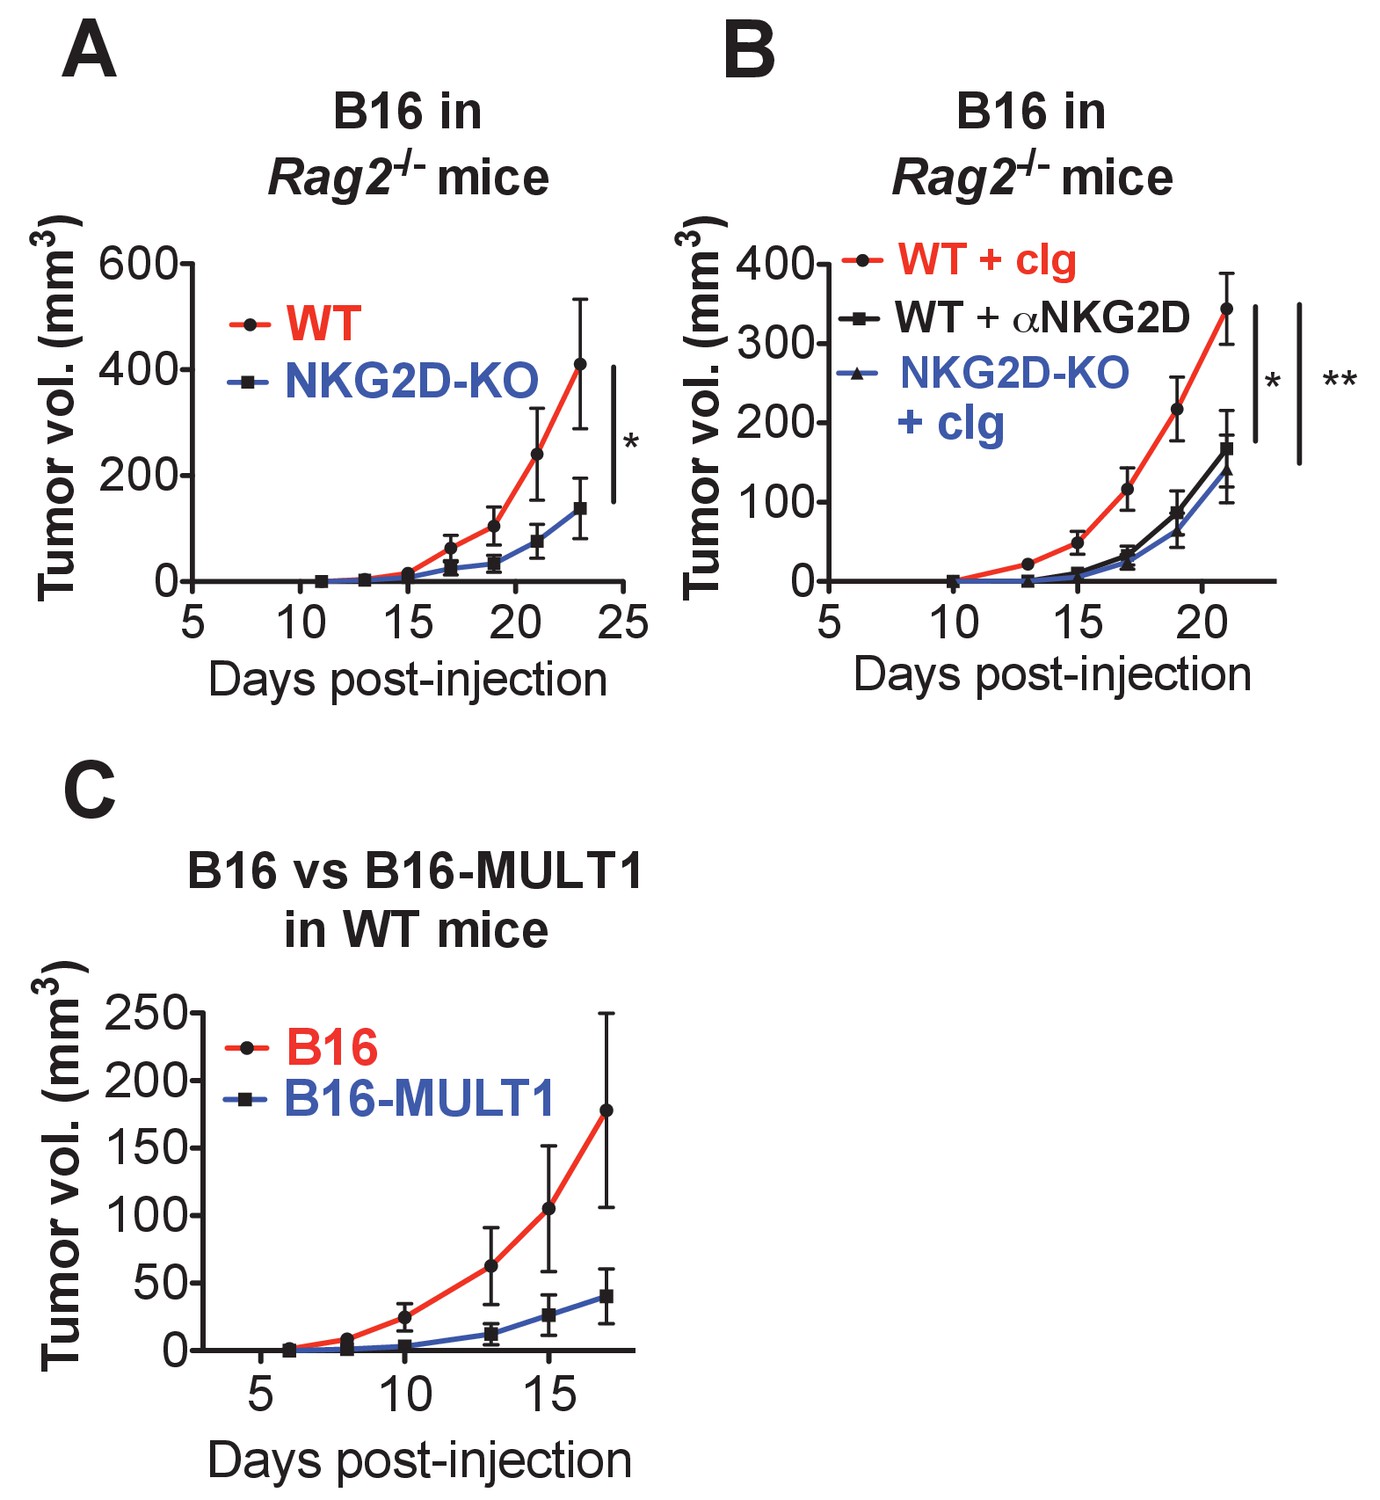
Endogenous RAE-1-NKG2D interactions limit anti-tumor responses in mice lacking T and B cells.
(A) Rag2-KO NKG2D-WT or Rag2-KO NKG2D-KO mice were challenged with 1 × 10⁴ B16 cells s.c. and monitored for tumor growth. Data are representative of three independent experiments. (B) Rag2-KO NKG2D-WT or Rag2-KO NKG2D-KO were given control Ig or anti-NKG2D twice weekly starting at day −1, and on day 0 were challenged with 1 × 10⁴ B16 cells s.c. and monitored for tumor growth. Data are representative of two independent experiments. (C) Tumor growth in WT mice given 5 × 10⁴ B16 or B16-MULT1 cells s.c. Data are representative of two independent experiments. Statistical significance was determined using two-way ANOVA. Data represent means ± SEM.
Author response image 1
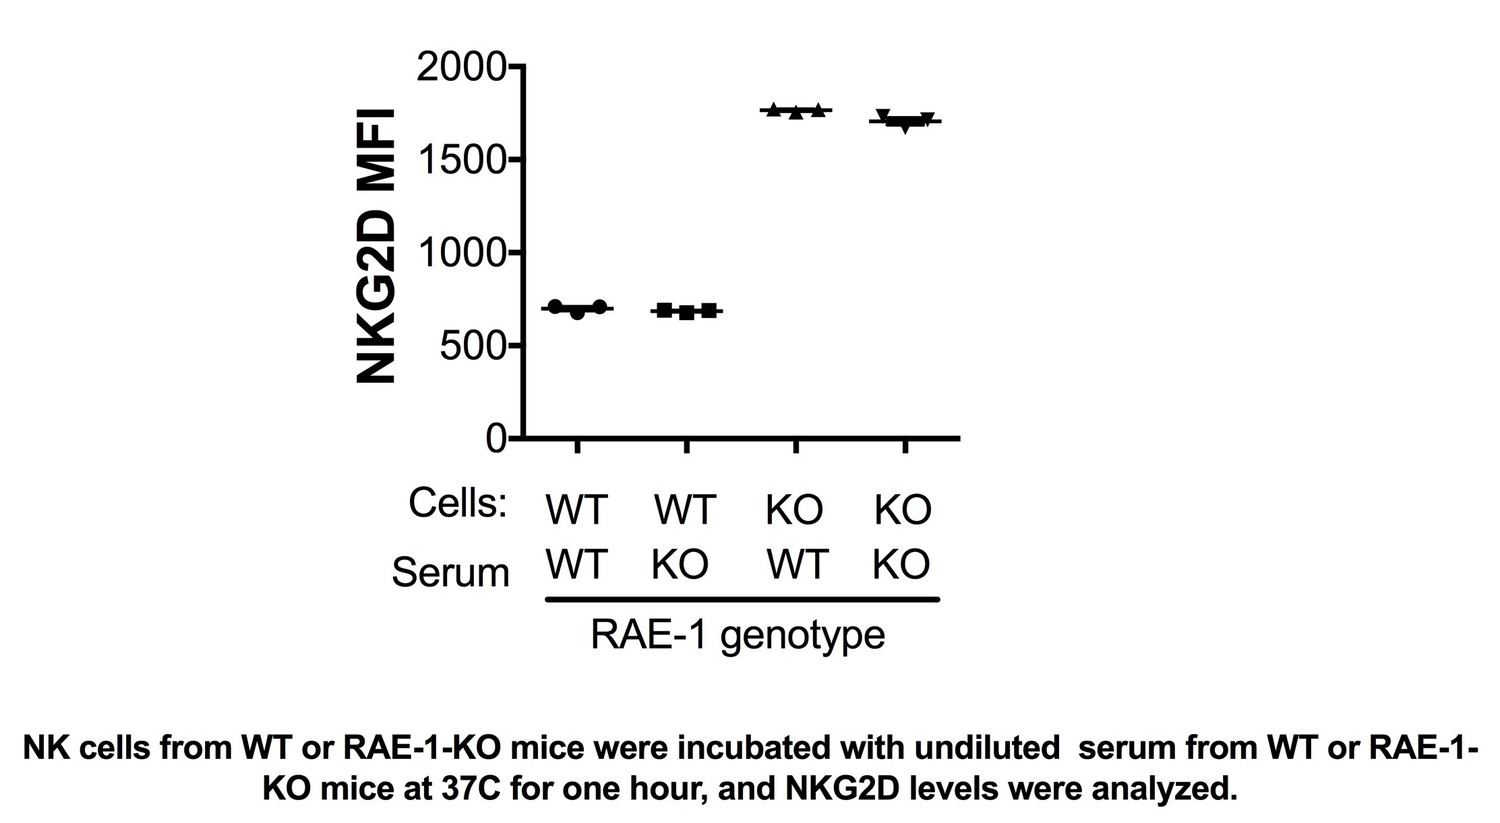
NK cells from WT or RAE-1-KO mice were incubated with undiluted serum from WT or RAE-1- KO mice at 37°C for one hour, and NKG2D levels were analyzed.
https://doi.org/10.7554/eLife.30881.019Additional files
-
Transparent reporting form
- https://doi.org/10.7554/eLife.30881.017
Download links
A two-part list of links to download the article, or parts of the article, in various formats.
Downloads (link to download the article as PDF)
Open citations (links to open the citations from this article in various online reference manager services)
Cite this article (links to download the citations from this article in formats compatible with various reference manager tools)
Endothelial cells express NKG2D ligands and desensitize antitumor NK responses
eLife 6:e30881.
https://doi.org/10.7554/eLife.30881


