Computer-guided design of optimal microbial consortia for immune system modulation
- Dana-Farber Cancer Institute, United States
- Harvard T.H. Chan School of Public Health, United States
- Harvard Medical School, United States
- Broad Institute of MIT and Harvard, United States
- RIKEN Center for Integrative Medical Sciences, Japan
- Keio University School of Medicine, Japan
- Vedanta Biosciences, United States
- University of Massachusetts Dartmouth, United States
- The University of Tokyo, Japan
- Brigham and Women’s Hospital, Harvard Medical School, United States
Figures
Figure 1
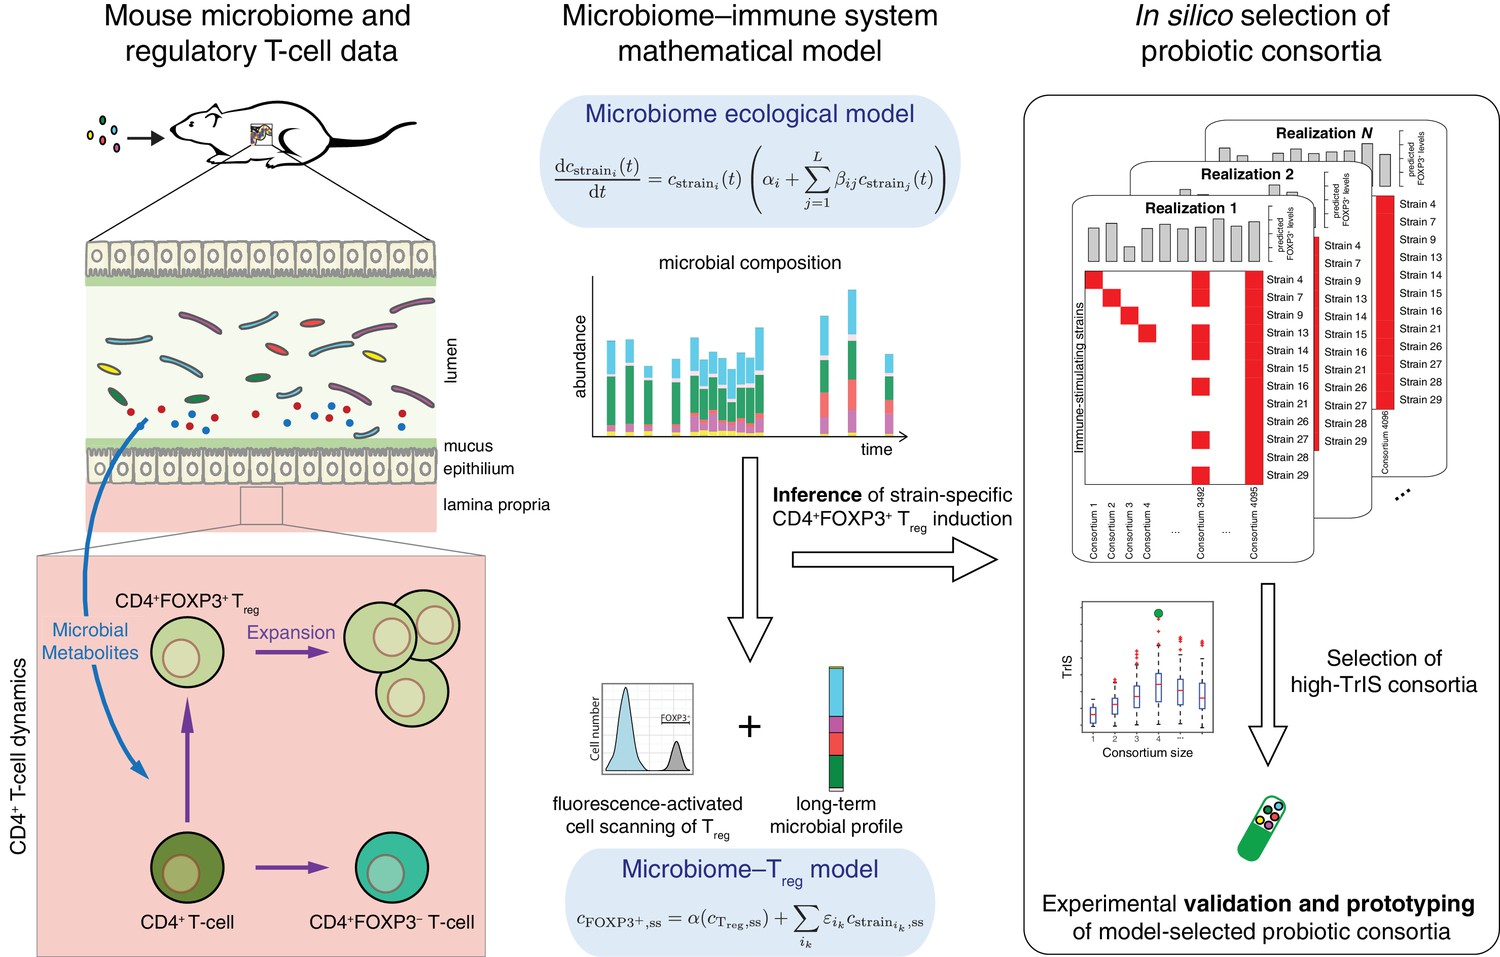
Conceptual figure.
A microbiome–immune system mathematical model describing the activation of regulatory T-cells (Treg) in response to colonization profiles of Treg-stimulating Clostridia strains is the central element of this work. It consists of a previously derived microbiome ecological model that describes the short and long-term temporal dynamics of Clostridia strains in germ-free mice (Bucci et al., 2016) and is supplemented by a microbiome–Treg model of CD4+FOXP3+ Treg activation in response to long-term compositions in the microbiome. The individual contribution of each strain to the measured Treg activation is inferred using long-term colonization data from mouse experiments with subsets of these strains and corresponding measurements of Treg induction. The Treg-induction score, TrIS, which accounts for ecological stability and immune activation, assigns a score to every possible strain combination and thereby identifies candidate probiotic consortia for experimental validation.
Figure 2
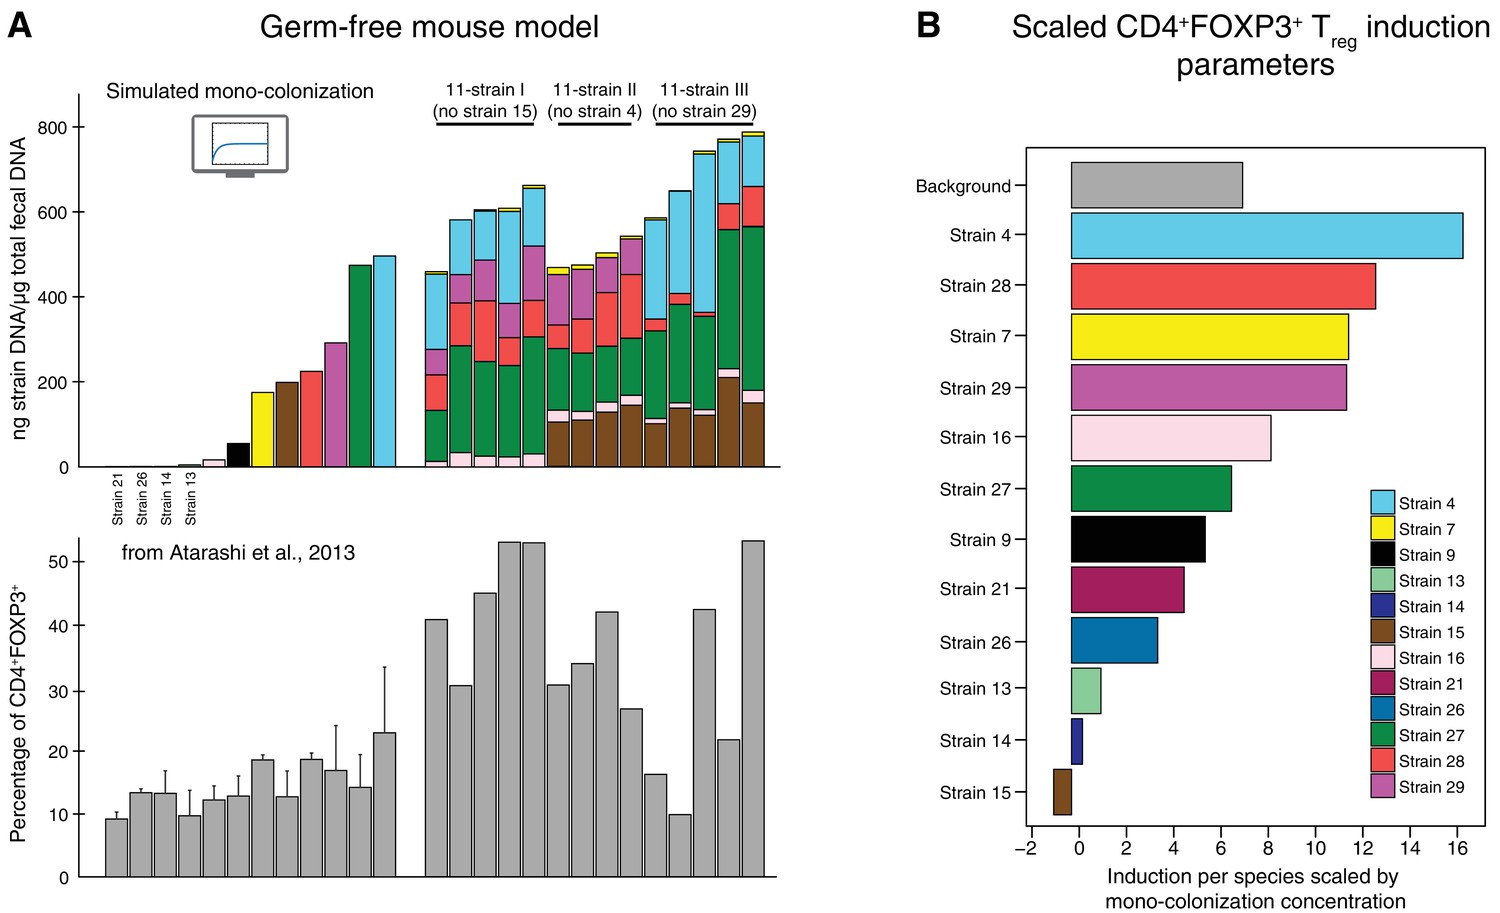
Data used for inference of the CD4+FOXP3+Treg induction parameters.
(A) To infer the strain-resolved CD4+FOXP3+ Treg induction parameters CD4+FOXP3+ Treg abundance measurements and corresponding microbiome colonization data are used. CD4+FOXP3+ Treg data of single strains originates from previously published measurements from Atarashi et al. (2013). Because in Atarashi et al. (2013) microbial mono-colonization levels were not measured, a previously published predictive model (Bucci et al., 2016) was used to simulate these experiments. In addition, newly generated CD4+FOXP3+ Treg and colonization mouse stool data from three 11-strain combinations was included into the analysis (see also Figure 3). The 11-strain combinations were chosen according to results of the ‘keystoneness’ analysis previously described in Bucci et al. (2016). The microbiome compositions of these three 11-strain combinations were estimated by strain-specific qPCR. (B) The resulting CD4+FOXP3+ Treg induction parameters quantify the contribution of each individual strain to Treg induction. (Coefficients are scaled by the microbial mono-colonization concentrations for display reasons.)
-
Figure 2—source data 1
Data containing the microbiome compositions, the corresponding measured CD4+FOXP3+ proportions and the derived induction parameters.
- https://doi.org/10.7554/eLife.30916.005
Figure 3
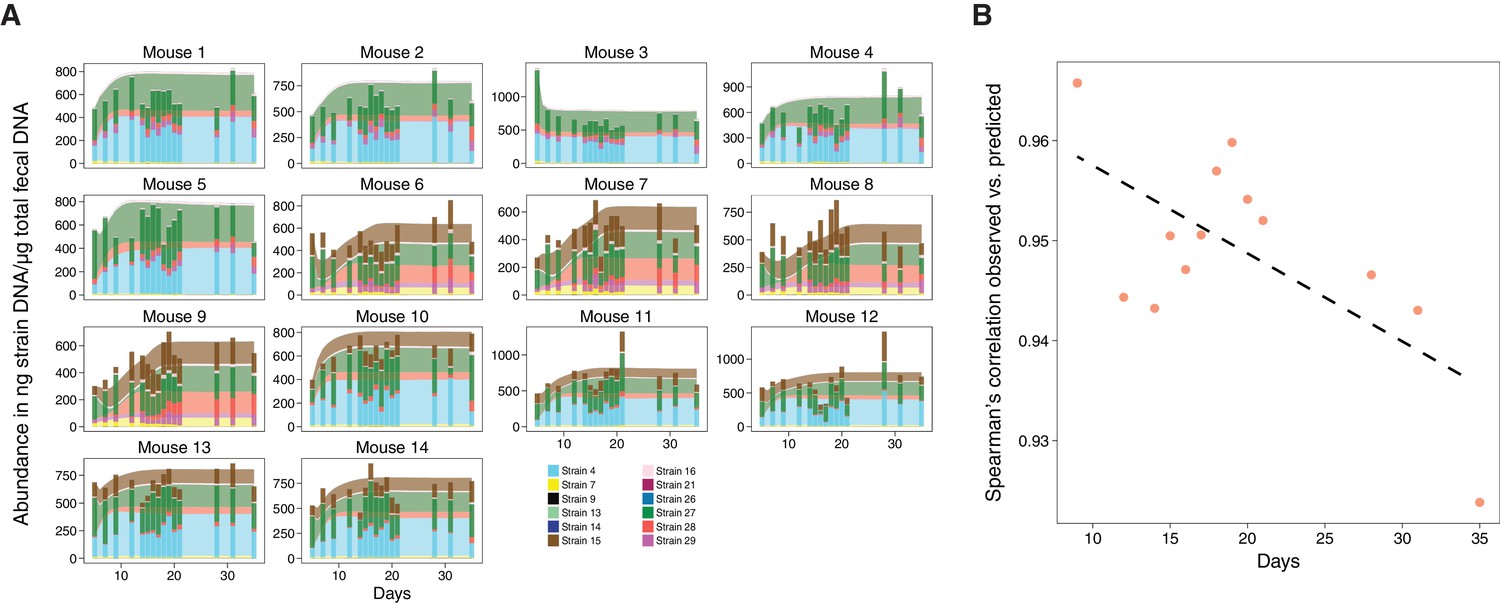
Validation of microbiome model describing the dynamics of Clostridia strains in germ-free mice.
(A) The model-predicted dynamics of three 11-strain combinations from the 13 Clostridia strains described in Bucci et al. (2016) (areas) are compared to measured data from germ-free mice (stacked bars) and each panel corresponds to an individual mouse (Figure 2A). Predictions were obtained by numerically integrating the corresponding generalized Lotka–Volterra equations with parameters from Bucci et al. (2016) using only each mouse’s initial microbial composition. In timelines/mouse 1–5, Strain 15 is absent referring to 11-strain set I (five biological replicates); in timelines 6–9, Strain 4 is absent (11-strain set II; four biological replicates), and in timelines 10–14, Strain 29 is absent (11-strain set III; five biological replicates). Data were obtained by qPCR of genes specific to each strain. Densities are computed as averages of three technical replicates. The number of mice used in each condition was chosen consistently with previous experimental work (Atarashi et al., 2013; Bucci et al., 2016) and combined with extensive in silico testing of the inference error as a function of sampling frequency and noise levels (Bucci et al., 2016). (B) Spearman’s rank correlation coefficient between observed and predicted data was computed at different time points. All displayed coefficients have a p-value of less than 10−16.
Figure 4 with 2 supplements
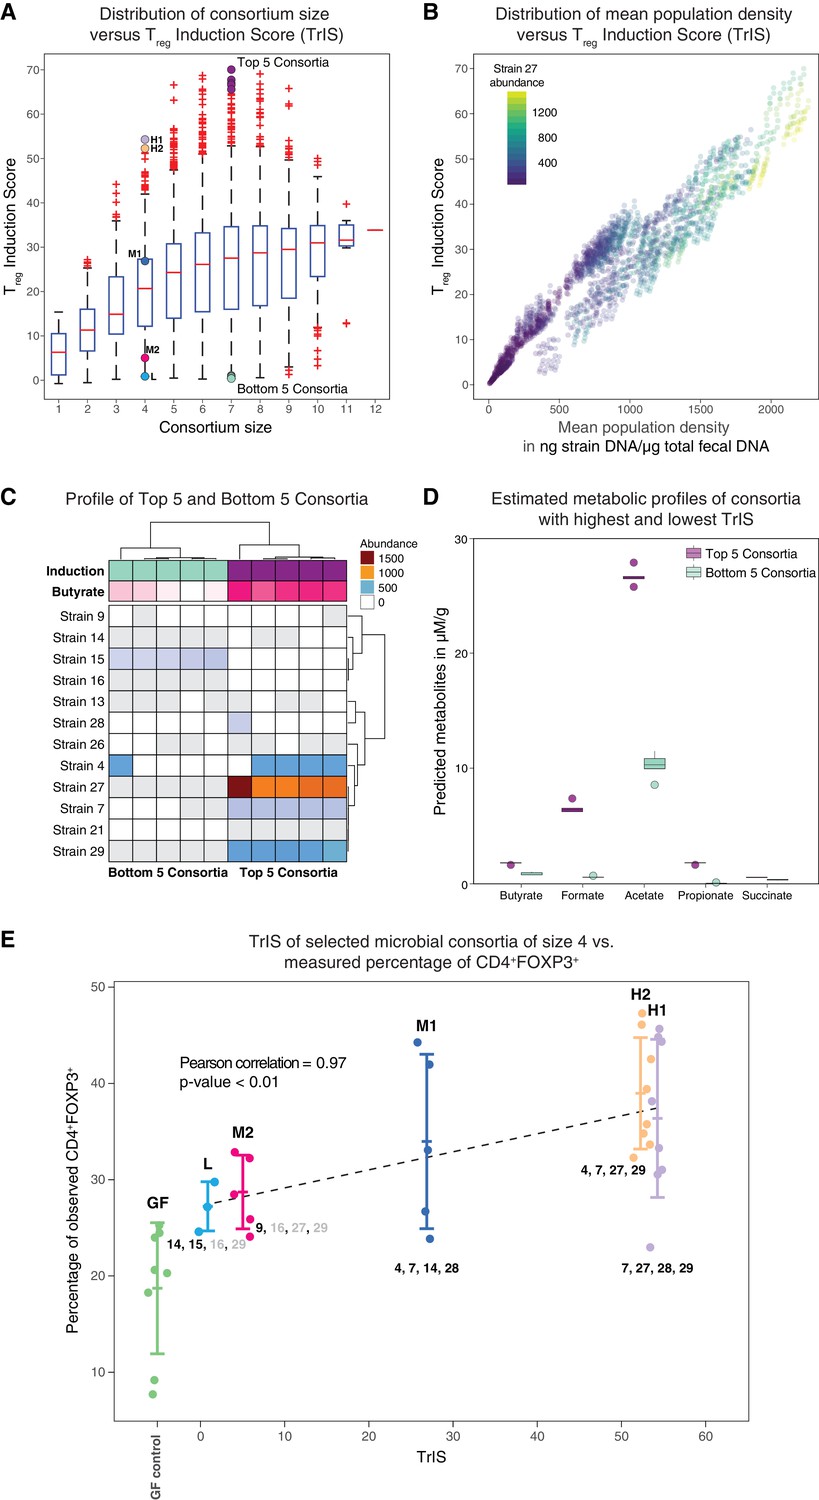
Identification and experimental validation of model-predicted Treg-stimulating consortia.
(A) Predicted Treg Induction Score (TrIS) in germ-free mice as a function of probiotic consortium size. Each data point represents one of the 2N−1 possible non-trivial consortia of size N. The five highest and lowest TrIS consortia of size seven are highlighted by violet and cyan filled dots, respectively, as well as, the 4-strain consortia used for experimental validation in subpanel E. (B) Distribution of the TrIS plotted against the total population density of each model-predicted consortium. This analysis shows a strong correlation (Spearman’s Rank Correlation with coefficient 0.88 and p<0.05) between TrIS and total microbial density. The color of each dot represents the abundance of Strain 27, which is predicted to strongly colonize in high-TrIS subsets. (C) Heatmap of consortium membership of the five highest and lowest TrIS-consortia of size seven and their predicted Treg induction and estimated butyrate production using data from Atarashi et al. (2013). (D) Estimation of potential SCFA output based on single-strain in vivo metabolic profiling from Atarashi et al. (2013). The five highest TrIS consortia of size seven (from 4C) are predicted to have a significantly higher SCFA output relative to the five lowest ones. (E) Five 4-strain consortia were used for experimental validation: the two highest-ranked consortia (H1 and H2, respectively), the lowest-ranked consortium (L) and two intermediates (M1, M2). M1 and M2 were included because of interest in other disease areas. The experimentally introduced strains are listed next to each bar/consortium. Strains with numbers in black were detected by 16S rRNA sequencing in mouse stool samples, strains with numbers in gray were introduced but failed to colonize. A Pearson’s correlation of 0.97 between the predicted TrIS and the average of each consortium’s measured CD4+FOXP3+ Treg percentage proves the ability of the TrIS-based selection to correctly recover the experimentally observed Treg induction. (Pearson’s correlation of all points has a value of 0.54.) Importantly, the H2 consortium displays an average increase in immune activity of 107% relative to the average germ-free mouse control. Eight biological replicates were used for GF, H1 and H2, five biological replicates were used for M1, M2 and three biological replicates were used for L. Replication and design of the validation experiment for Treg induction assessment is consistent with work from us and others (Atarashi et al., 2013; Narushima et al., 2014).
-
Figure 4—source data 1
TrIS, TrIS rank and predicted median steady-state concentrations of the selected microbial consortia from Figure 4E.
- https://doi.org/10.7554/eLife.30916.010
Figure 4—figure supplement 1

TrIS versus estimated mean population density.
In contrast to Figure 4B, which highlights only the abundance of Strain 27 in each consortium, the predicted total population density of the microbial consortia is compared to the TrIS while the color in each subpanel represents the corresponding strain’s abundance.
Figure 4—figure supplement 2
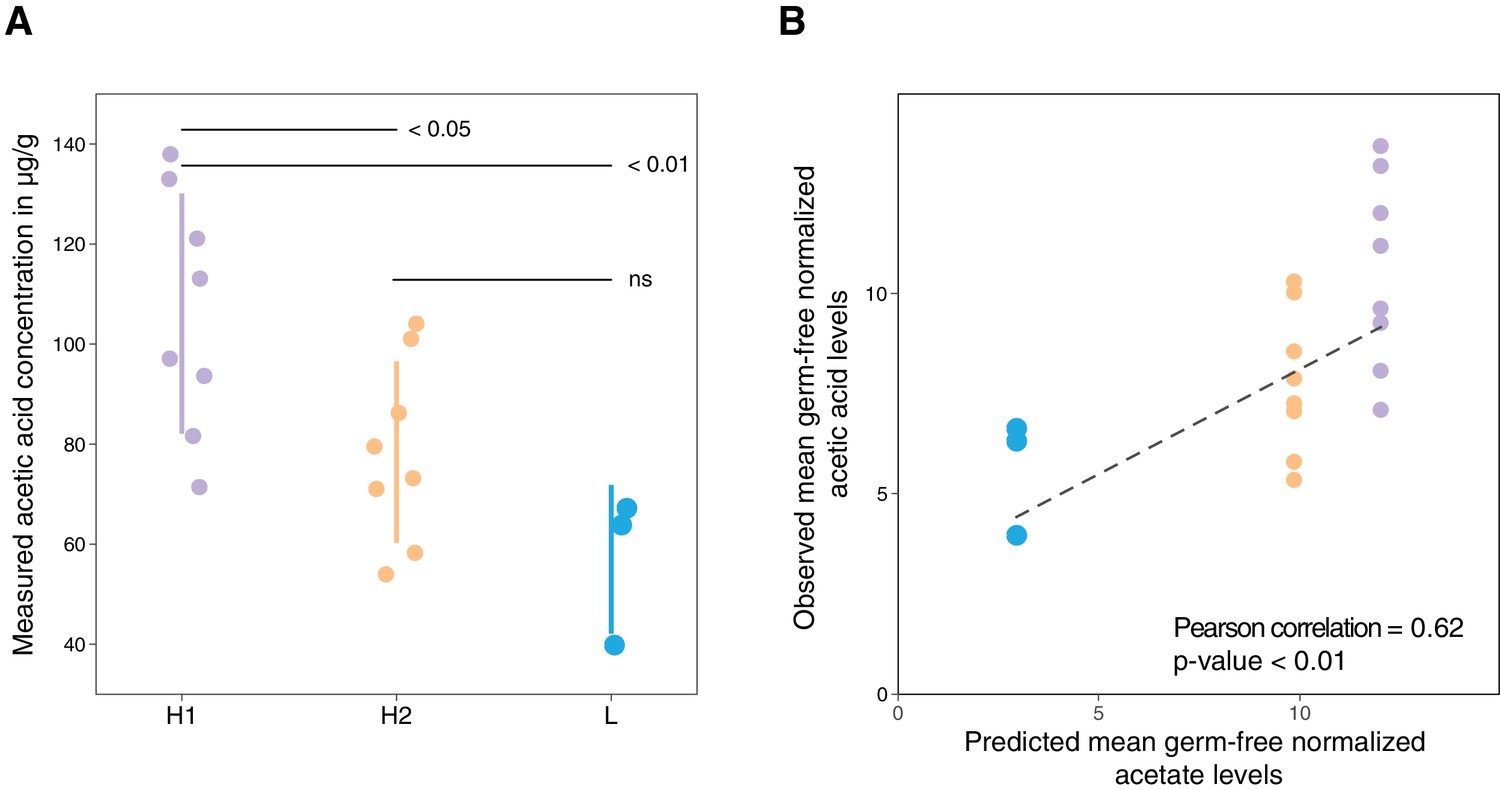
Metabolic profiling of three selected microbial consortia and comparison of predicted and measured metabolic profiles of three selected microbial consortia.
(A) Metabolic profiling results of fecal content of selected consortia with respect to acetic acid. (B) Comparison of predicted mean germ-free normalized acetate concentrations based on single-strain measurements in caecal content from (Atarashi et al., 2013) with the observed germ-free mean normalized acetic acid levels in mouse stool from (A).
Tables
Table 1
List of strains used with respect to our previous published work.
The original publication (Atarashi et al., 2013) reported on 17 immune-modulating bacteria. In Bucci et al. (2016), a dynamical ecological model for 13 of the original 17 strains was presented. These 13 strains were selected because they do not harbor antibiotic resistance genes. For our study, we used a 12-strain subset of these 13 strains based on ecological stability considerations. Colonization and CD4+FOXP3+Treg data for the three 11-strain sets, measured by qPCR and FACS, were used along with the simulated mono-colonization concentrations (Figure 2) and included into the microbiome–immune system model (Figure 1). The resulting parameters were employed to predict ecologically stable subsets with different Treg induction potentials. 4-strain subsets were selected to validate the predictions of the mathematical model (see main text and Figure 3). Strain 1: Clostridium saccharogumia/Clostridium ramosum JCM1298, Strain 3: Flavonibacter plautii/Pseudoflavonifractor capillosus, Strain 4: Clostridium hathewayi/Clostridium saccharolyticum WM1, Strain 6: Blautia coccoides/Lachnospiraceae bacterium, Strain 7: Clostridium bolteae, Strain 8: Clostridium sp. MLG055/Erysipelotrichaceae bacterium 2 44A, Strain 9: Clostridium indolis/Anaerostipes caccae DSM 14662, Strain 13: Anaerotruncus colihominis, Strain 14: Ruminococcus sp. ID8/Lachnospiraceae bacterium 2 1 46FAA, Strain 15: Clostridium asparagiforme/Clostridium lavalense, Strain 16: Clostridium symbiosum, Strain 18: Clostridium ramosum, Strain 21: Eubacterium fissicatena/Eubacterium contortum/Clostridium sp. D5, Strain 26: Clostridium scindens/Lachnospiraceae bacterium 5 1 57FAA, Strain 27: Lacnospiraceae bacterium A4/Lachno bacterium 3 1 57FAA CT1, Strain 28: Clostridium sp. 316002/08, Strain 29: Lacnospiraceae bacterium A4/Lachno bacterium 3 1 57FAA CT1.
| Atarashi et al., 2013 | Bucci et al., 2016 | 11-str. I | 11-str. II | 11-str. III | H1 | H2 | M1 | M2 | L | |
|---|---|---|---|---|---|---|---|---|---|---|
| Strain 1 | x | |||||||||
| Strain 3 | x | |||||||||
| Strain 4 | x | x | x | x | x | x | ||||
| Strain 6 | x | x | ||||||||
| Strain 7 | x | x | x | x | x | x | x | x | ||
| Strain 8 | x | |||||||||
| Strain 9 | x | x | x | x | x | x | ||||
| Strain 13 | x | x | x | x | x | |||||
| Strain 14 | x | x | x | x | x | x | x | |||
| Strain 15 | x | x | x | x | x | |||||
| Strain 16 | x | x | x | x | x | x | x | |||
| Strain 18 | x | |||||||||
| Strain 21 | x | x | x | x | x | |||||
| Strain 26 | x | x | x | x | x | |||||
| Strain 27 | x | x | x | x | x | x | x | x | ||
| Strain 28 | x | x | x | x | x | x | x | |||
| Strain 29 | x | x | x | x | x | x | x | x |
Additional files
-
Transparent reporting form
- https://doi.org/10.7554/eLife.30916.012
Download links
A two-part list of links to download the article, or parts of the article, in various formats.
Downloads (link to download the article as PDF)
Open citations (links to open the citations from this article in various online reference manager services)
Cite this article (links to download the citations from this article in formats compatible with various reference manager tools)
Computer-guided design of optimal microbial consortia for immune system modulation
eLife 7:e30916.
https://doi.org/10.7554/eLife.30916


