KIF2A regulates the development of dentate granule cells and postnatal hippocampal wiring
- The University of Tokyo, Japan
- King Abdulaziz University, Saudi Arabia
Figures
Figure 1
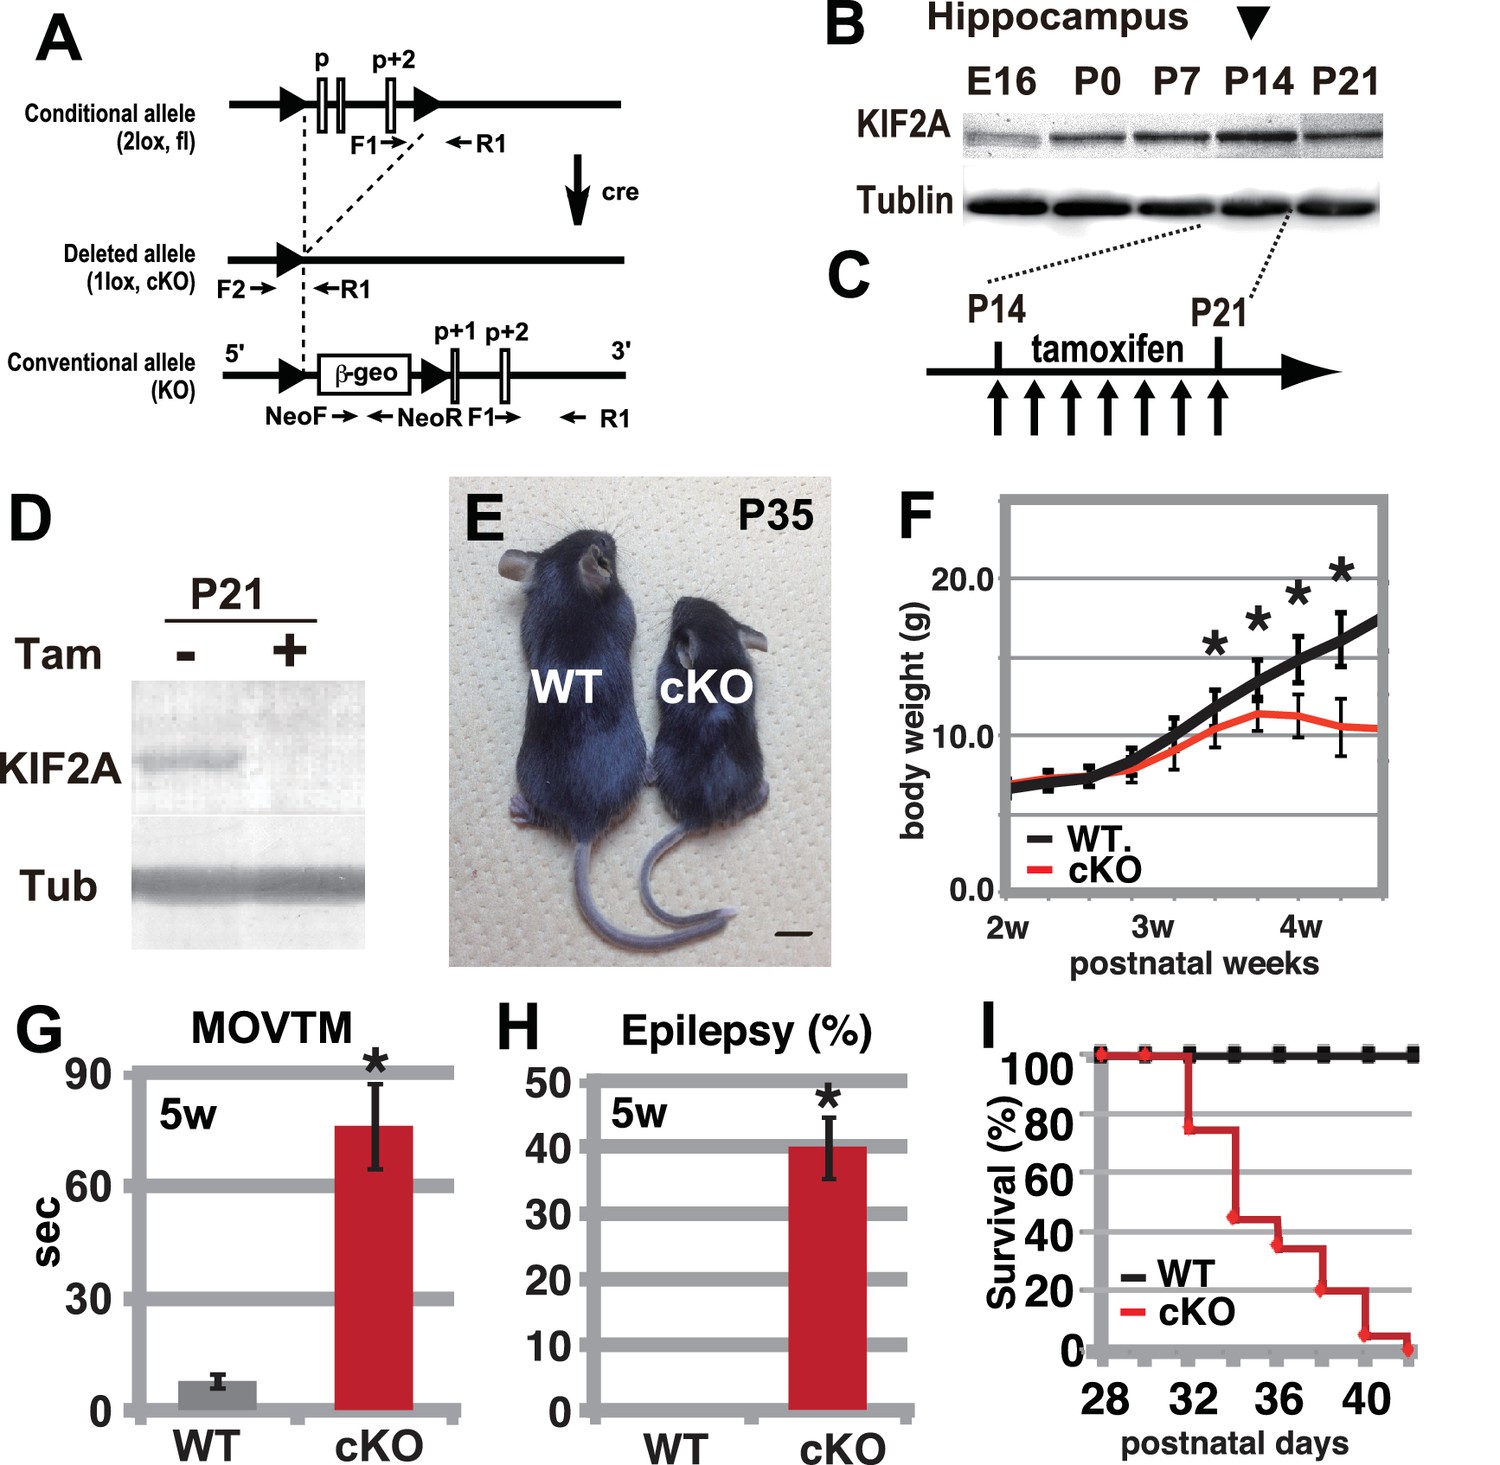
Hyperactivity, severe epilepsy, and eventual fatality in 3w-Kif2a-cKO mice.
(A–D) The generation of Kif2a-cKO mice. (A) Schematic diagram of the conditional Kif2a targeting strategy. The conventional targeting allele is also shown at the bottom. Tamoxifen-induced Cre recombinase deletes the floxed p, p+1, and p+2 exons. (B). Developmental expression of KIF2A in the hippocampus. The expression peaked at P14. (C) The timeline for tamoxifen injection. (D). The loss of KIF2A. KIF2A expression was lost within 1 week after the start of the tamoxifen injection. (E) 3w-Kif2a-cKO mice at P35. The 3w-Kif2a-cKO mice developed smaller bodies than the WT mice. (F) The weight curves of WT and 3w-Kif2a-cKO mice. The cKO mice showed weight loss after the loss of KIF2A (n = 20, results indicate ± SD, *p<0.01; Welch’s t-test). (G) Behavioral test. 3w-Kif2a-cKO mice showed hyperactivity at postnatal week 5 (n = 10, error bar indicates ± SD, *p<0.01; Welch’s t-test). (H) The frequency of epilepsy. The 3w-Kif2a-cKO mice showed epileptic convulsions during a 30-min observation during postnatal week 5 (five mice each from five independent experiments, error bar indicates ± SEM, *p<0.01; Welch’s t-test). (I) Survival rate of 3w-Kif2a-cKO mice (n = 20). These mice began to die starting in postnatal week 5, and all mice died by the end of week 6. Bars: 1 cm in E.
-
Figure 1—source data 1
The raw data of body weight, activity, and survival rate of WT and 3w-Kif2a-cKO mice.
- https://doi.org/10.7554/eLife.30935.004
Figure 2 with 2 supplements
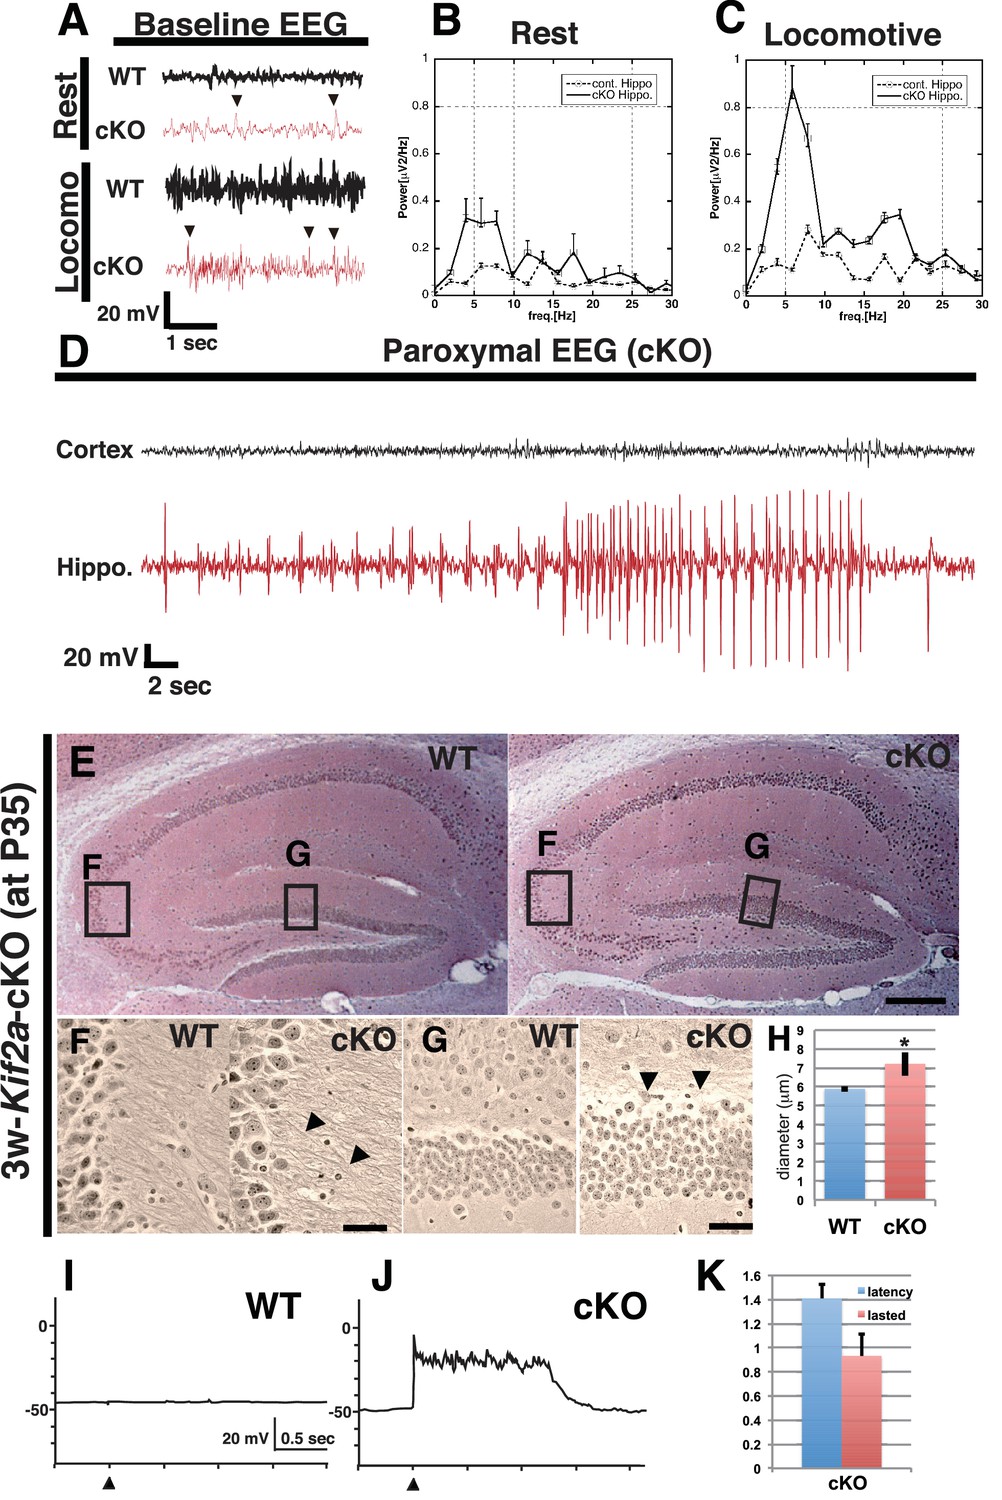
3w-Kif2a-cKO mice develop epileptic hippocampi.
(A–D) Electroencephalography (EEG) recordings. (A) Representative baseline EEG recordings of WT and 3w-Kif2a-cKO hippocampi in postnatal week 6. Some spikes were observed in the cKO brain, even in mice at rest (arrowheads). (B–C) Power spectra obtained from a fast Fourier analysis of baseline EEG recordings. Intervals of 4.5 s (for the cKO, the intervals were separated from a paroxysmal EEG recordings by at least 10 s) were selected for analysis. Three independent experiments involving two mice were performed for each frequency: *p<0.01 (repeated-measures ANOVA). Error bars indicate ± SEMs. (D) Representative paroxysmal EEG recordings of the cKO brain at postnatal week 4. The seizure occurred in the hippocampus. The mouse during the ictal phase of the seizure is shown in Figure 2—video 1. (E–H) Development of hippocampal sclerosis in a cKO brain. (E) Bodian-stained coronal hippocampus sections at postnatal week 6. (F-G) Magnified images within rectangles ‘F’ (CA3) and ‘G’ (dentate gyrus) in (E) Defasciculating fibers (arrowheads in F) and hypertrophic scattered granular cells (arrowheads in G) were observed in the cKO hippocampus. (H) Statistical analysis of the cell size. cKO DGCs are larger than the WT cells. The results are shown as the mean ± SD (7 slices each, n = 259 for WT, n = 233 for cKO). *p<0.01 (Welch’s t-test). (I–K) An electrophysiological study was used to detect recurrent circuits in hippocampal primary cultures. (I–J) Representative electrographs showing data from the WT and cKO hippocampi. The black arrowhead indicates the stimulation time point. The WT slice (I) did not yield a response, and long paroxysmal depolarization shifts (PDSs) were detected in the cKO slice (J). (K) Statistical analysis of PDSs. The results are shown as the mean ± SD, n = 45, for five independent experiments involving 3 PDSs from 3 slices each. Abbreviations: ML, molecular layer; GCL, granule cell layer. Bars: 100 μm in E and 10 μm in F, G.
-
Figure 2—source data 1
EEG recordings of WT and 3w-Kif2a-cKO mice.
- https://doi.org/10.7554/eLife.30935.008
-
Figure 2—source data 2
The latency and lasted time of PDS occurred in the 3w-Kif2a-cKO hippocampal slices.
- https://doi.org/10.7554/eLife.30935.009
Figure 2—figure supplement 1

The epileptic hippocampus in tamoxifen-injected Kif2a-cKO mice.
(A–D) The typical features of hippocampal sclerosis in 4w-Kif2a-cKO mice at postnatal week 12. The 4w-Kif2a-cKO mice clearly showed hippocampal atrophy (A), including CA1 loss (B), sprouting MFs in CA3 (C), and hypertrophic granule cells (D). (E–G) Gliosis in 3w-Kif2a-cKO mice. (E–F) Representative images of astroglia stained with an anti-GFAP antibody. More astroglia were distributed in the 3w-Kif2a-cKO mice. (G) Statistical analysis of the GFAP-positive area. The GFAP-positive area of the cKO mice was substantially wider than that of WT mice. The results are shown as the mean ± SD (n = 15, three independent experiments. *p<0.01 (Welch’s t-test)). (H) Schematic of the patch-clamp recordings of DCGs. A stimulating electrode (Stim) and a recording electrode (Rec) were inserted into the hilus and granule cell layer (GCL). Bars: 100 μm in A and 20 μm in B-F.
-
Figure 2—figure supplement 1—source data 1
GFAP-positive area in WT and 3w-Kif2a-cKO dentate gyrus at P35.
- https://doi.org/10.7554/eLife.30935.007
Figure 2—Video 1
EEG recordings of 3w-Kif2a-cKO mice with hippocampal epilepsy.
This recording was obtained at postnatal week 5 in a mouse after an EEG operation at postnatal week 4. The epileptic convulsion continued throughout the video. The EEG wave for this convulsion is shown in Figure 2D.
Figure 3
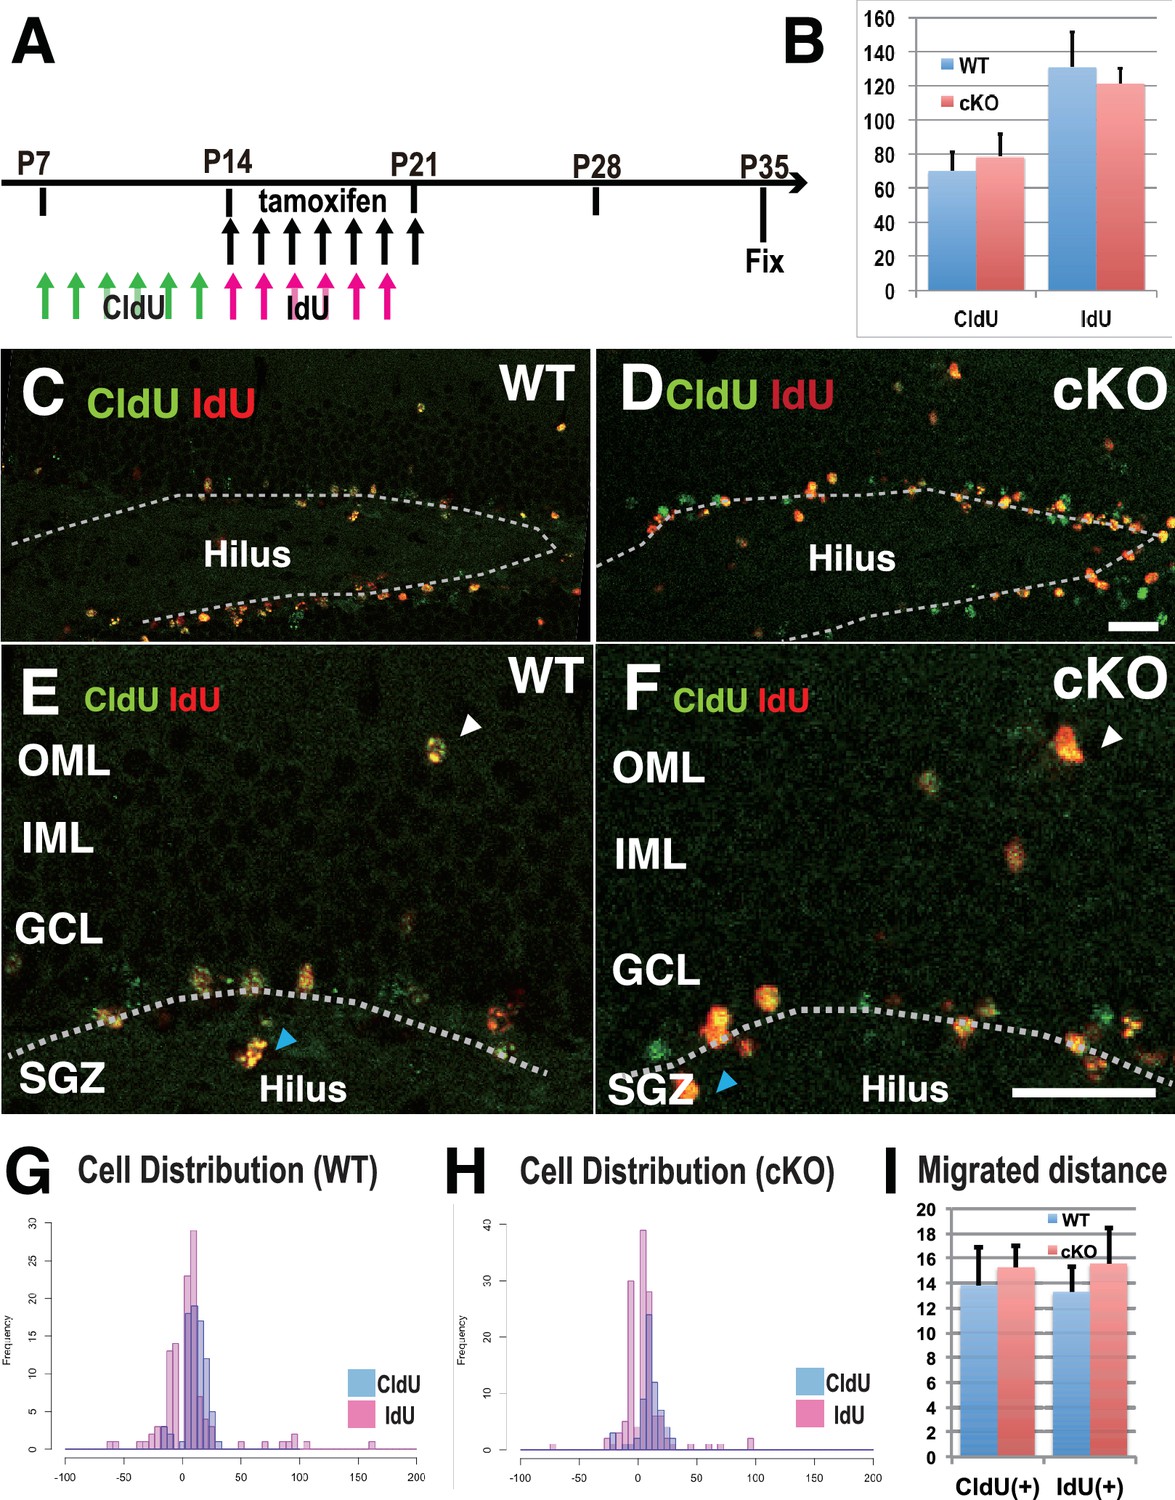
Defects in cell proliferation and cell migration were not significant in the 3w-Kif2a-cKO hippocampus.
(A) The injection scheme of thymidine analogs and tamoxifen. CldU and IdU were injected during postnatal weeks 2 and 3, respectively. The mice were fixed and double-stained with anti-CldU and anti-IdU antibodies. (B) The number of proliferated cells before and after KIF2A loss. The results are the means ± SD. (n = 15, three independent experiments. Student’ t-test, CldU p=0.61, IdU p=0.52). (C–F) Representative images of the immunostained dentate gyrus. E and F are magnified images of C and D. The broken white line indicates the bottom line of the GCL. Note that, in both WT (C and E) and cKO (D and F) mice, CldU-positive cells migrated slightly more than IdU-positive cells, and some aberrant cells migrated backward (blue arrowheads in the hilus) or ectopically (white arrowheads in the OML) from the bottom lines. (G–H) Representative graphs of the cell migration ratio. Zero represents the starting line for migrating cells at the bottom of the GCL. The distribution of CldU-positive cells and IdU-positive cells are shown in blue bars and red bars, respectively. (I) Statistical analysis of the cell migration ratio. The results are the means ± SEM. The average migration distance of CldU-positive cells (CldU(+)) and IdU-positive cells (IdU(+)) is not significantly different between WT (G) and cKO (H) cells. CldU (WT; n = 210, cKO; n = 235), and IdU (WT; n = 394, cKO; n = 364), three independent experiments. Welch’ t-test, (CldU;p=0.82, IdU;p=0.89). Abbreviations: IML, inner molecular layer; OML, outer molecular layer; GCL, granule cell layer; SGZ, sub granular zone. Bars: 20 μm in D and F.
-
Figure 3—source data 1
The migrating distance, direction, and expression of birth-dating marker of WT and 3w-Kif2a-cKO DGCs at P35.
- https://doi.org/10.7554/eLife.30935.012
Figure 4 with 2 supplements
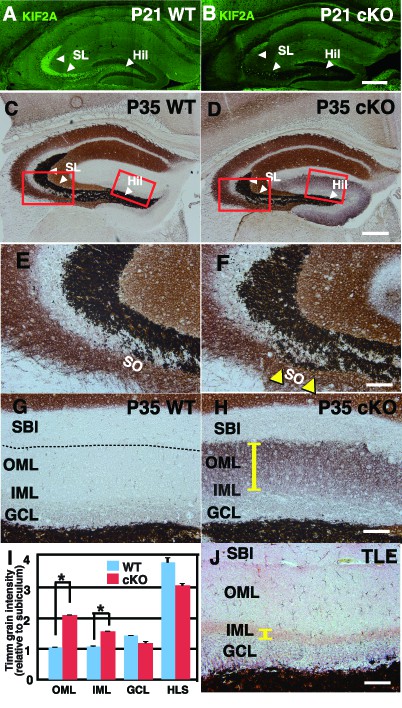
Zn-positive axon terminals of DGCs are aberrant and widespread throughout the whole ML in the 3w-Kif2a-cKO mice.
(A–B) The expression of postnatal KIF2A in the hippocampus at P21. Note that KIF2A is highly expressed in the dentate hilus (Hil) and stratum lucidum (SL) (A) where DGCs extend their axons, termed MFs. The loss of KIF2A was observed in the cKO hippocampus (B). (C–H) Representative images showing Timm staining of the hippocampus at P35. (E–H) are magnified images indicated by the red rectangles in (C–D). Coronal cryosections in the hippocampus were processed for Timm histochemistry. An abnormally high dark brown density of the reaction product was observed in the SO (yellow arrowheads in F) and the entire dentate ML (a yellow bar in H) in the cKO mice compared to that in the WT mice. (I) Statistical analysis of Timm grain intensities. Intensities in OML and IML were significantly higher in the cKO mice than in the WT mice. The results are shown as the mean ± SEMs (5 slices each, n = 6). *p<0.01; Welch’s t-test. (J) Positive control for the pilocarpine-induced TLE mouse model. Note that Timm reaction products are observed only in the IML (a yellow bar). Broken lines indicate the hippocampal sulcus (G), which forms a boundary between the ML and the SBI. Abbreviations; SL, stratum lucidum; SO, stratum oriens; SBI, subiculum; DGC, dentate granule cells; MF, mossy fiber; IML/OML, inner/outer molecular layer; GCL, granule cell layer. Bars: 400 μm in D and 100 μm in F, H, and J. See the figure supplement as well.
-
Figure 4—source data 1
Timm grain intensity in WT and 3w-Kif2a-cKO dentate gyrus at P35.
- https://doi.org/10.7554/eLife.30935.019
Figure 4—figure supplement 1
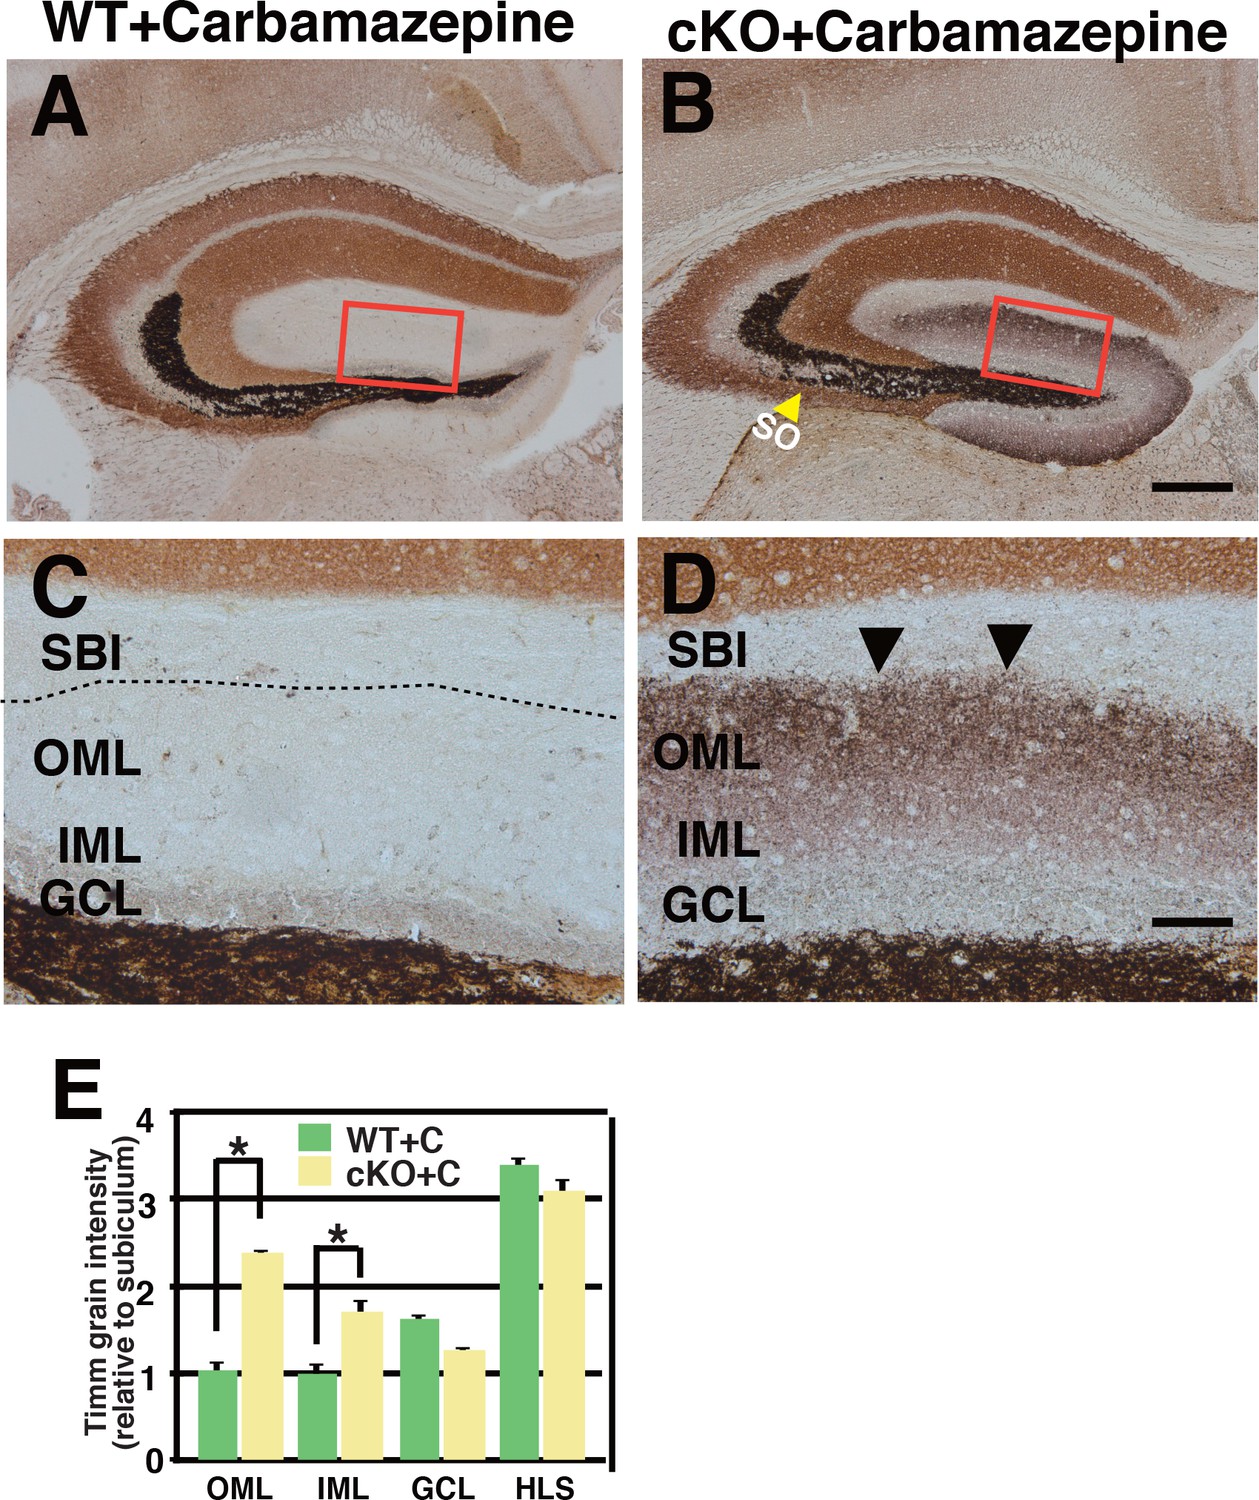
The Zn-positive axons of DGCs abnormally extended into the SO and the entire ML in the CBZ-injected 3w-Kif2a-cKO mice.
(A–D) Representative images showing Timm staining of the hippocampus at P35. C and D are magnified images of the areas indicated by the red rectangles in A and B. Coronal cryosections in the hippocampus were processed for Timm histochemistry. Similar to the results for the untreated cKO hippocampus, a large amount of dark brown reaction product was present in the SO (yellow arrowheads in B) and the entire ML (arrowheads in D) in CBZ-injected cKO mice. Broken lines indicate the hippocampal sulcus (C). (E) Statistical analysis of Timm grain intensities. The OML and IML intensities were significantly higher in the CBZ-injected cKO mice than in the WT mice. The results are shown as the mean ± SEMs (5 slices each, n = 8). *p<0.01; Welch’s t-test. Abbreviations; SO, stratum oriens; SBI, subiculum; IML/OML, inner/outer molecular layer; GCL, granule cell layer. Bars: 400 μm in B, 100 μm in D.
-
Figure 4—figure supplement 1—source data 1
Timm grain intensity in CBZ-injected-WT and CBZ-injected-3w-Kif2a-cKO dentate gyrus at P35.
- https://doi.org/10.7554/eLife.30935.015
Figure 4—figure supplement 2
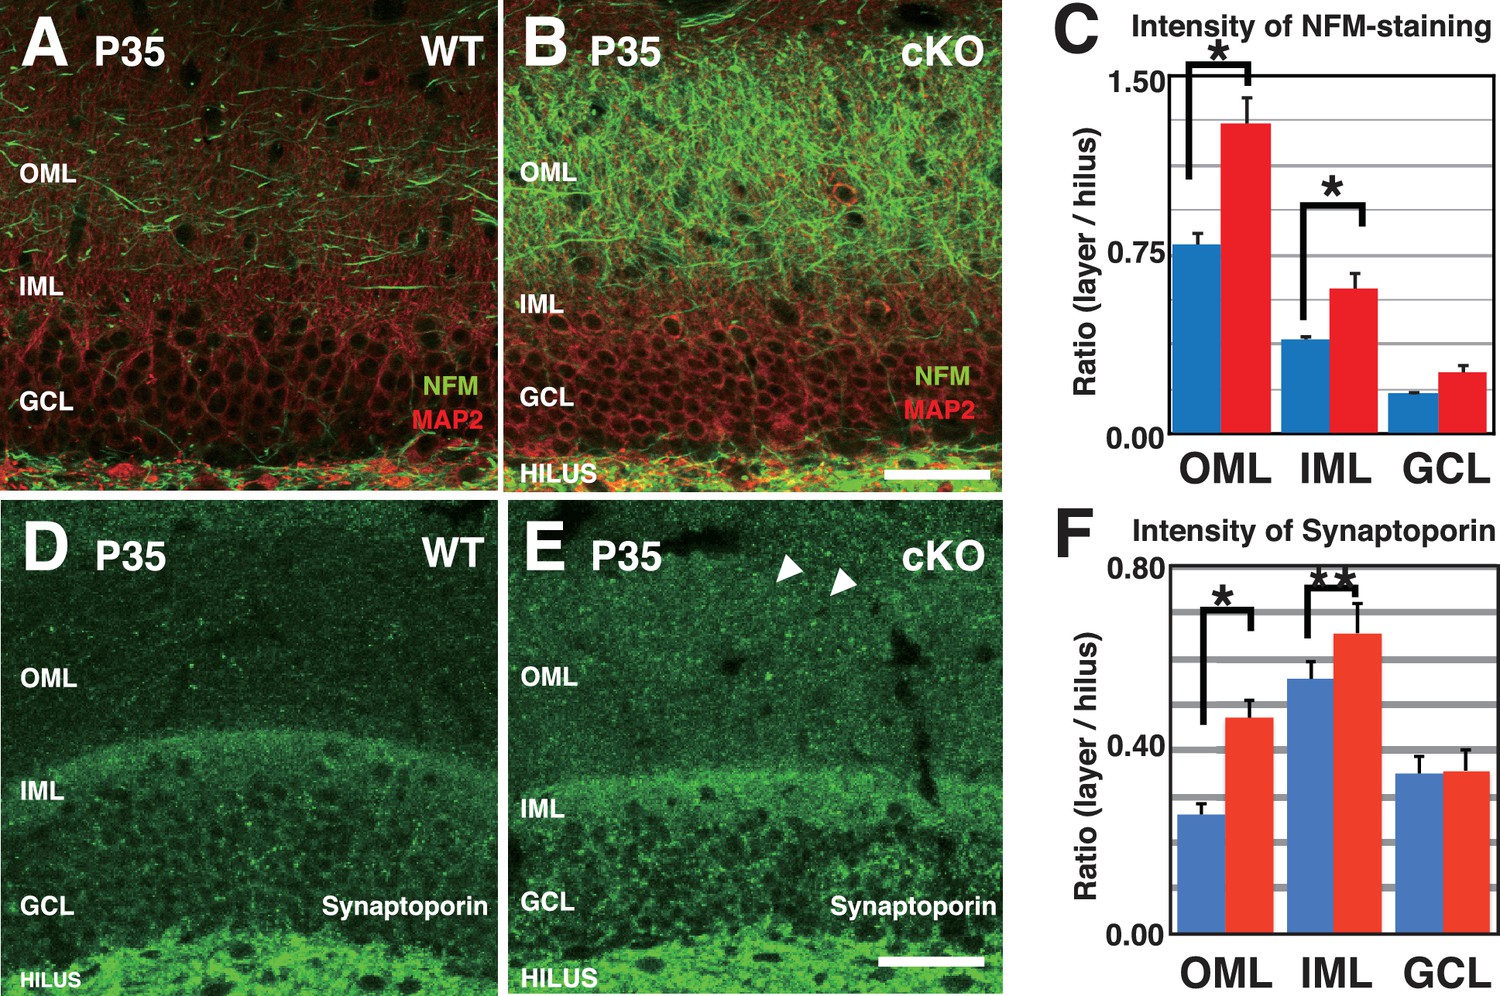
More DGC axons were present throughout the ML of the 3w-Kif2a-cKO mice than in that of WT mice.
(A–B) Representative images of cryosections immunostained with anti-NFM and anti-MAP2 at P35. Images are 1-μm-thick confocal optical sections (OS). Compared with WT (A), 3w-Kif2a-cKO mice had more NFM-positive axons in the ML (B). (C) Statistical analysis of the NFM staining intensity. The results are shown as the mean ± SEMs (5 slices each, n = 5). *p<0.01; Welch’s t-test. (D–E). Representative images of the ML immunostained with a marker of DGC axons, anti-synaptoporin, at P35. The images are 1-μm-thick confocal OSs. Note the lack of obvious synaptoporin staining in the WT OML (D) but the presence of aberrant synaptoporin staining in the cKO OML (E). (F) Statistical analysis of intensity, as quantified in 2-μm-thick OSs in the ML. The procedures were similar to the procedures used for the Timm grain intensity analysis. All statistical results are shown as the mean ± SEMs for 5 slices each; n = 6, *p<0.01, **p<0.05; Welch t-test. Abbreviations; IML/OML, inner/outer molecular layer; GCL, granule cell layer. Bars: 100 μm in B and E.
-
Figure 4—figure supplement 2—source data 1
Intensity of NFM-staining in WT and 3w-Kif2a-cKO dentate gyrus at P35.
- https://doi.org/10.7554/eLife.30935.017
-
Figure 4—figure supplement 2—source data 2
Intensity of synaptoporin-staining in WT and 3w-Kif2a-cKO dentate gyrus at P35.
- https://doi.org/10.7554/eLife.30935.018
Figure 5

DGCs developed aberrant morphological changes in axons, cell bodies, and dendritic spines in 3w-Kif2a-cKO mice.
(A) Schematics of unsolved questions in developing DGCs in the Kif2a-cKO dentate granule layer (DGL). In the postnatal hippocampus (left panel), DGCs continuously proliferated in the SGZ, migrated through the GCL, and then incorporated newly developed neurites into the existing hippocampal wiring. In 3w-Kif2a-cKO mice (right panel), the origin of overextended axons (Q1) and the difference in the immature and mature DGC phenotypes (Q2) and dendritic morphology (Q3) needs to be investigated. (B–C) Representative images of GFP-expressing DGCs. Z-stacked images of 300-μm-thick slices were acquired and reconstructed in 3D. In the outer area of the DGL, some mature cKO DGCs (a red asterisk in C) were aberrantly located in the IML, and developed an aberrant apical axon (red arrowheads in C), whereas WT DGCs (a red asterisk in B) extended single axons (white arrows in B) and thick dendrites (white arrowheads in B). In the middle area, some cKO DGCs (a white asterisk in C) developed recurrent axons (white arrowheads in C), whereas WT DGCs (white asterisks in B) did not. In the inner area, some cKO immature DGCs (an orange asterisk in C) developed multiple aberrant protrusions (orange arrowheads in C), whereas WT DGCs only showed a slight development of protrusions. (D–E) Representative images of the dendrites of matured DGCs. Z-stack images of dendrites in the IML and OML were acquired and reconstructed in 3D. Note that the spines of cKO mice appeared thinner (E) than those of the WT mice (D). (F–H) Statistical analysis of inner immature DGCs with apical axons (F) and cells with protrusions (G) and the number of ectopic DGCs (H). Cell bodies were counted in 50-μm-thick OSs (five slices each from five mice; results indicate the mean ± SDs *p<0.01, Welch’s t-test). (I) Statistical analysis of spine density. The total spine densities were higher in both the OML and IML of cKO mice than in those of WT mice. Morphologically, the density of thin spines was especially increased in cKO mice compared to that in WT mice. The results indicate the mean ± SDs, n = 5, *p<0.05, Welch’s t-test. Bars: 20 μm in C, and 1 μm in D and E.
-
Figure 5—source data 1
The population of the cells with apical axons in the outer ML, the cells with protrusion in the inner ML, and the ectopic cells in inner ML in WT and 3w-Kif2a-cKO dentate gyrus at P35.
- https://doi.org/10.7554/eLife.30935.021
-
Figure 5—source data 2
The spine morphology of dendrites in IML and OML of WT and 3w-Kif2a-cKO dentate gyrus at P35.
- https://doi.org/10.7554/eLife.30935.022
Figure 6 with 4 supplements
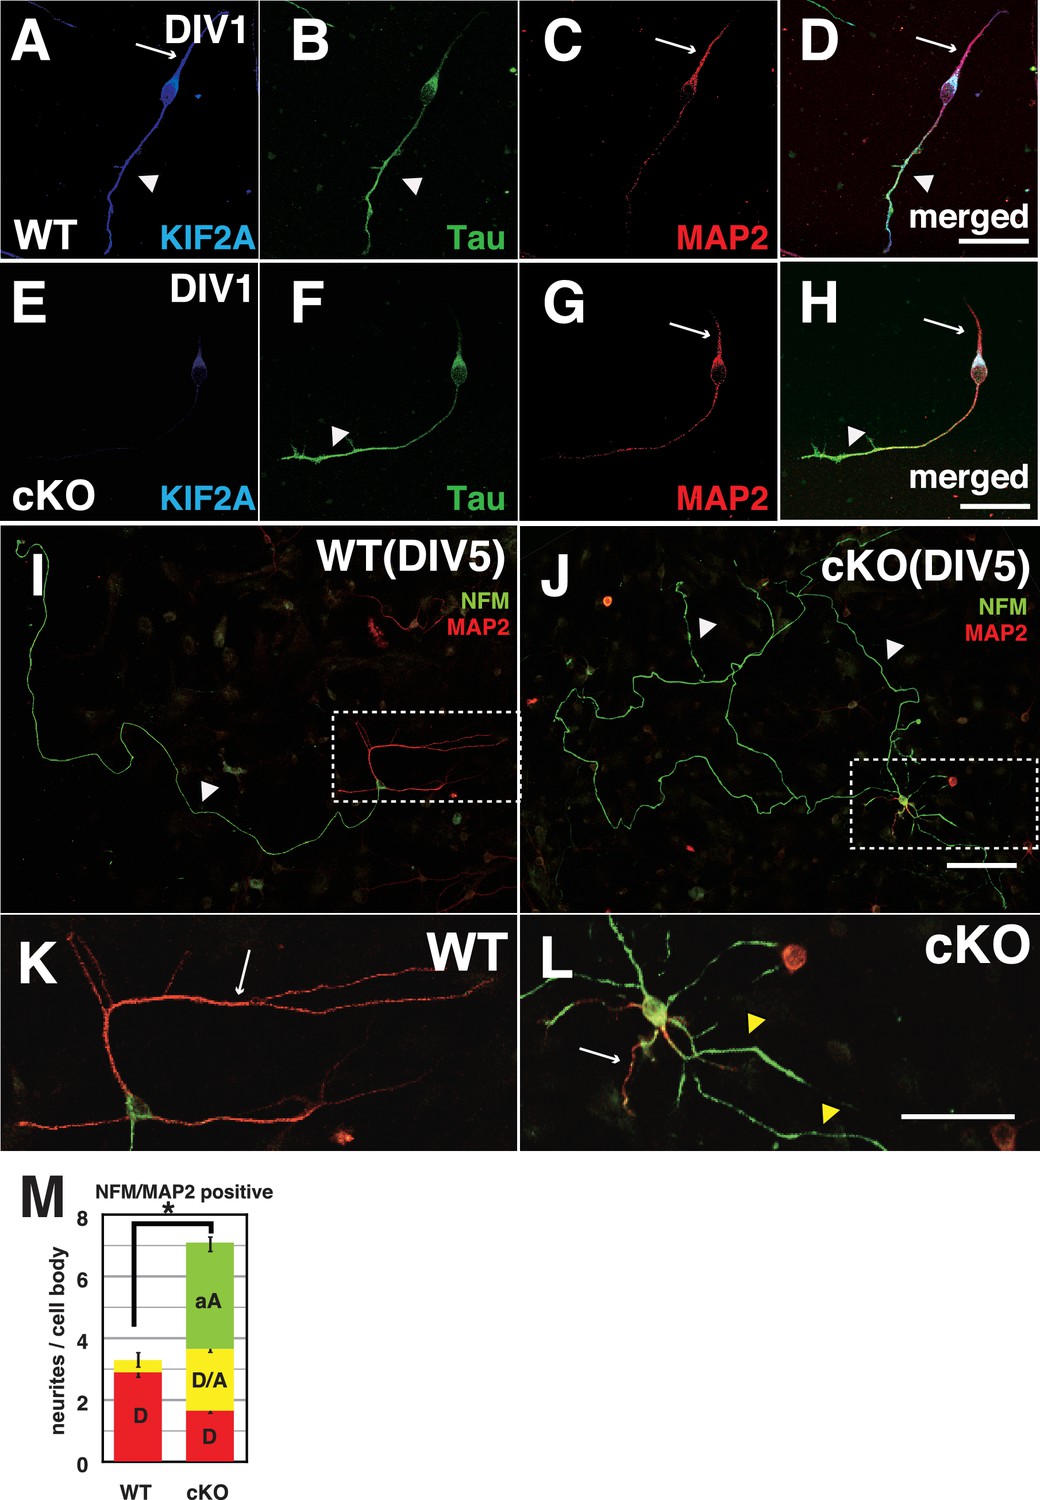
Both axons and dendrites were aberrantly developed in cultured P3-Kif2a-cKO DGCs.
(A–L) Representative images of dissociated cultured DGCs immunostained with an axon marker (NFM or Tau1) and a dendrite marker (MAP2) at DIV1 (A–H) and DIV5 (I–L). At DIV1, both WT DGCs (A–D) and cKO DGCs (E–H) extended an axonal process (a arrowhead) and a dendritic process (an arrow). KIF2A was expressed in both processes (A compared with E). At DIV5, WT DGCs developed a single primary axon (an arrowhead in I) and several dendrites (an arrow in K), whereas cKO DGCs developed aberrant collateral branches from a primary axon (arrowheads in J) and multiple aberrant axons originating from their cell bodies (a white arrow and yellow arrowheads in L) in addition to some dendrites. (K and L) are magnified images of the regions indicated by the dashed squares in (I–J) M, DGC neuronal processes at DIV5. The numbers of processes, not including primary axons, were counted. A MAP2-positive dendrite (D), MAP2A- and NFM- or Tau1-positive processes (D/A) and NFM- or Tau1- positive aberrant axons (A) are shown. The results are shown as the mean ± SEMs for 20 cells each; n = 120. Error bars pointing downward indicate the SEMs for each type of neurite. The error bars pointing up indicate the SEMs for the total number of processes (*p<0.01, Welch’s t-test). Bars: 100 μm in J, 50 μm in D, H, and L.
-
Figure 6—source data 1
The character of neuronal processes from a cell body of WT and P3-Kif2a-cKO DGCs.
- https://doi.org/10.7554/eLife.30935.027
Figure 6—figure supplement 1
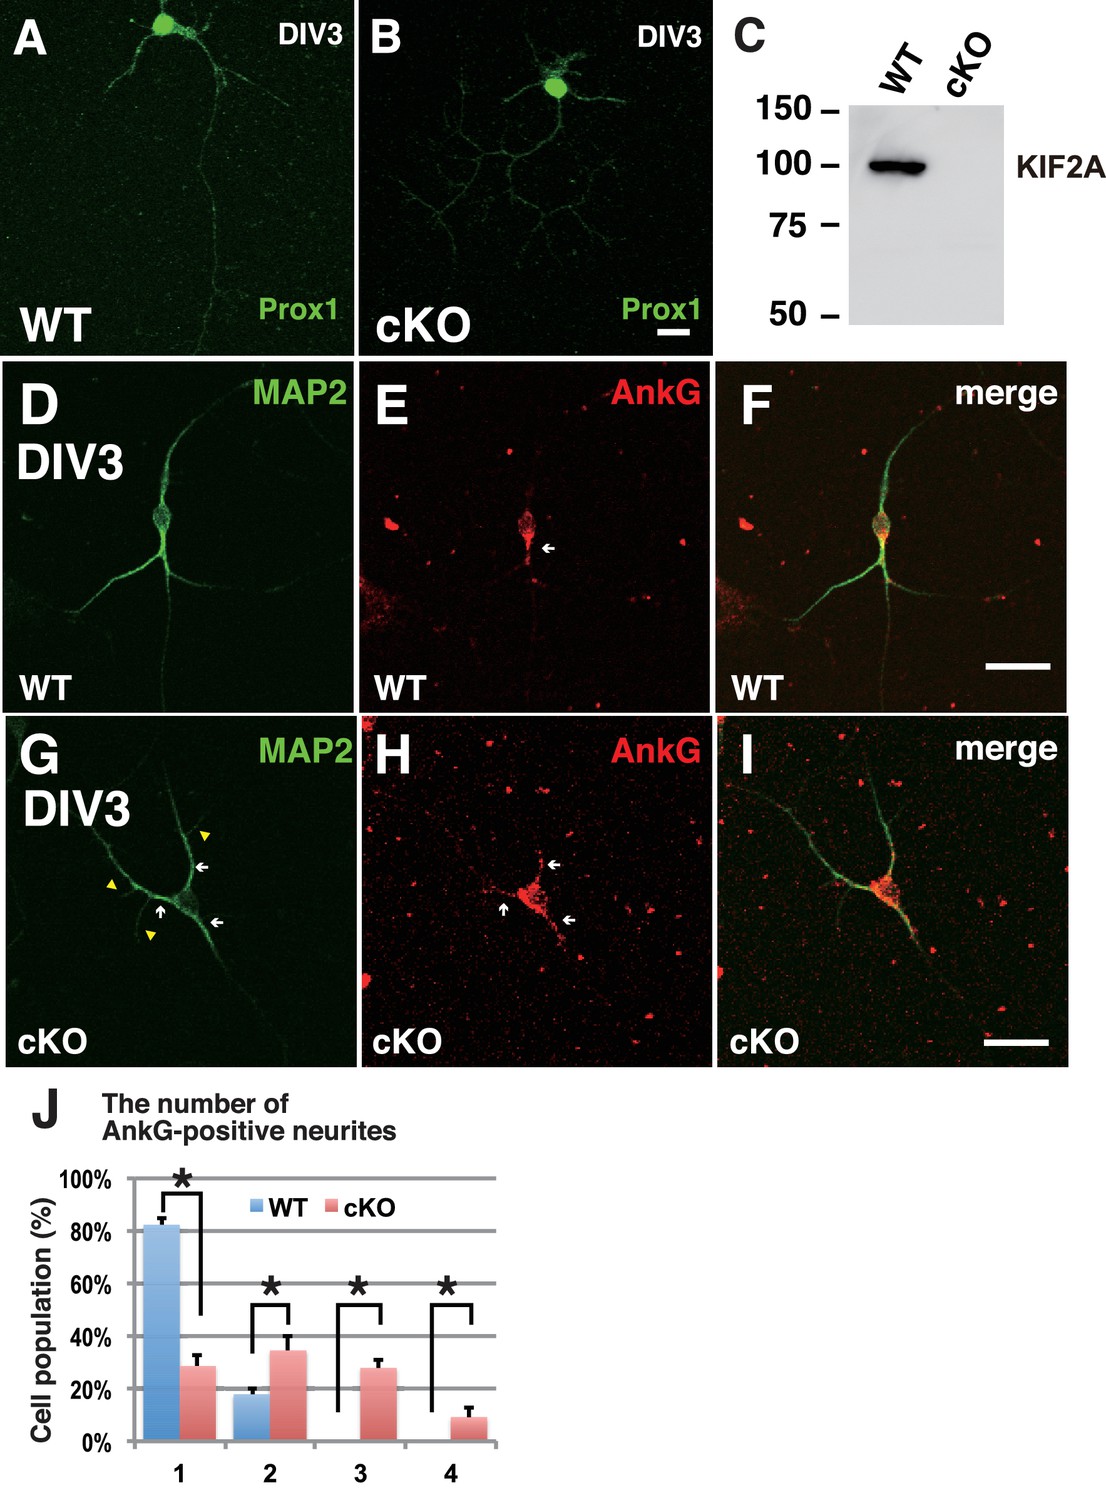
The loss of KIF2A induced MF sprouting in dissociated cultured DGCs.
(A–C) Characterization of dissociated cultured granule cells and confirmation of their loss of KIF2A. A-B. Representative images of cultured DGCs. Granule cells from the hippocampal dentate gyri of the WT (A) and Kif2a-cKO (B) mice were cultured for 4 days (DIV4) and then the cells were fixed and stained with an anti-Prox1 antibody. C. KIF2A deletion in cultured DGCs. KIF2A expression was analyzed using western blot analysis in extracts from the WT and Kif2a-cKO cultured cells obtained on DIV4. (D-I) Representative images of ankyrin G-positive neurites in WT (D–F) and P3-Kif2a-cKO (G–I) cultured DGCs. At an early stage of DGC development, all neurites are MAP2-positive around the cell body (D and G, see also Figure 6A). Among those developing neurites, there were more neurites with ankyrin G at the neck in cKO DGCs (arrowheads in H) than in WT DGCs (arrowheads in E). Statistical analysis of the population of DGCs with the number of ankyrin G-positive neurites/cell is shown in (J). The results are shown as the mean ± SDs for approximately 60 cells each; n = 4. (*p<0.001, Welch’s t-test). Bars: 50 μm in B, F and I.
-
Figure 6—figure supplement 1—source data 1
The number of Ankyrin G-positive processes from a cell body of of WT and P3-Kif2a-cKO DGCs at DIV3.
- https://doi.org/10.7554/eLife.30935.025
Figure 6—figure supplement 2
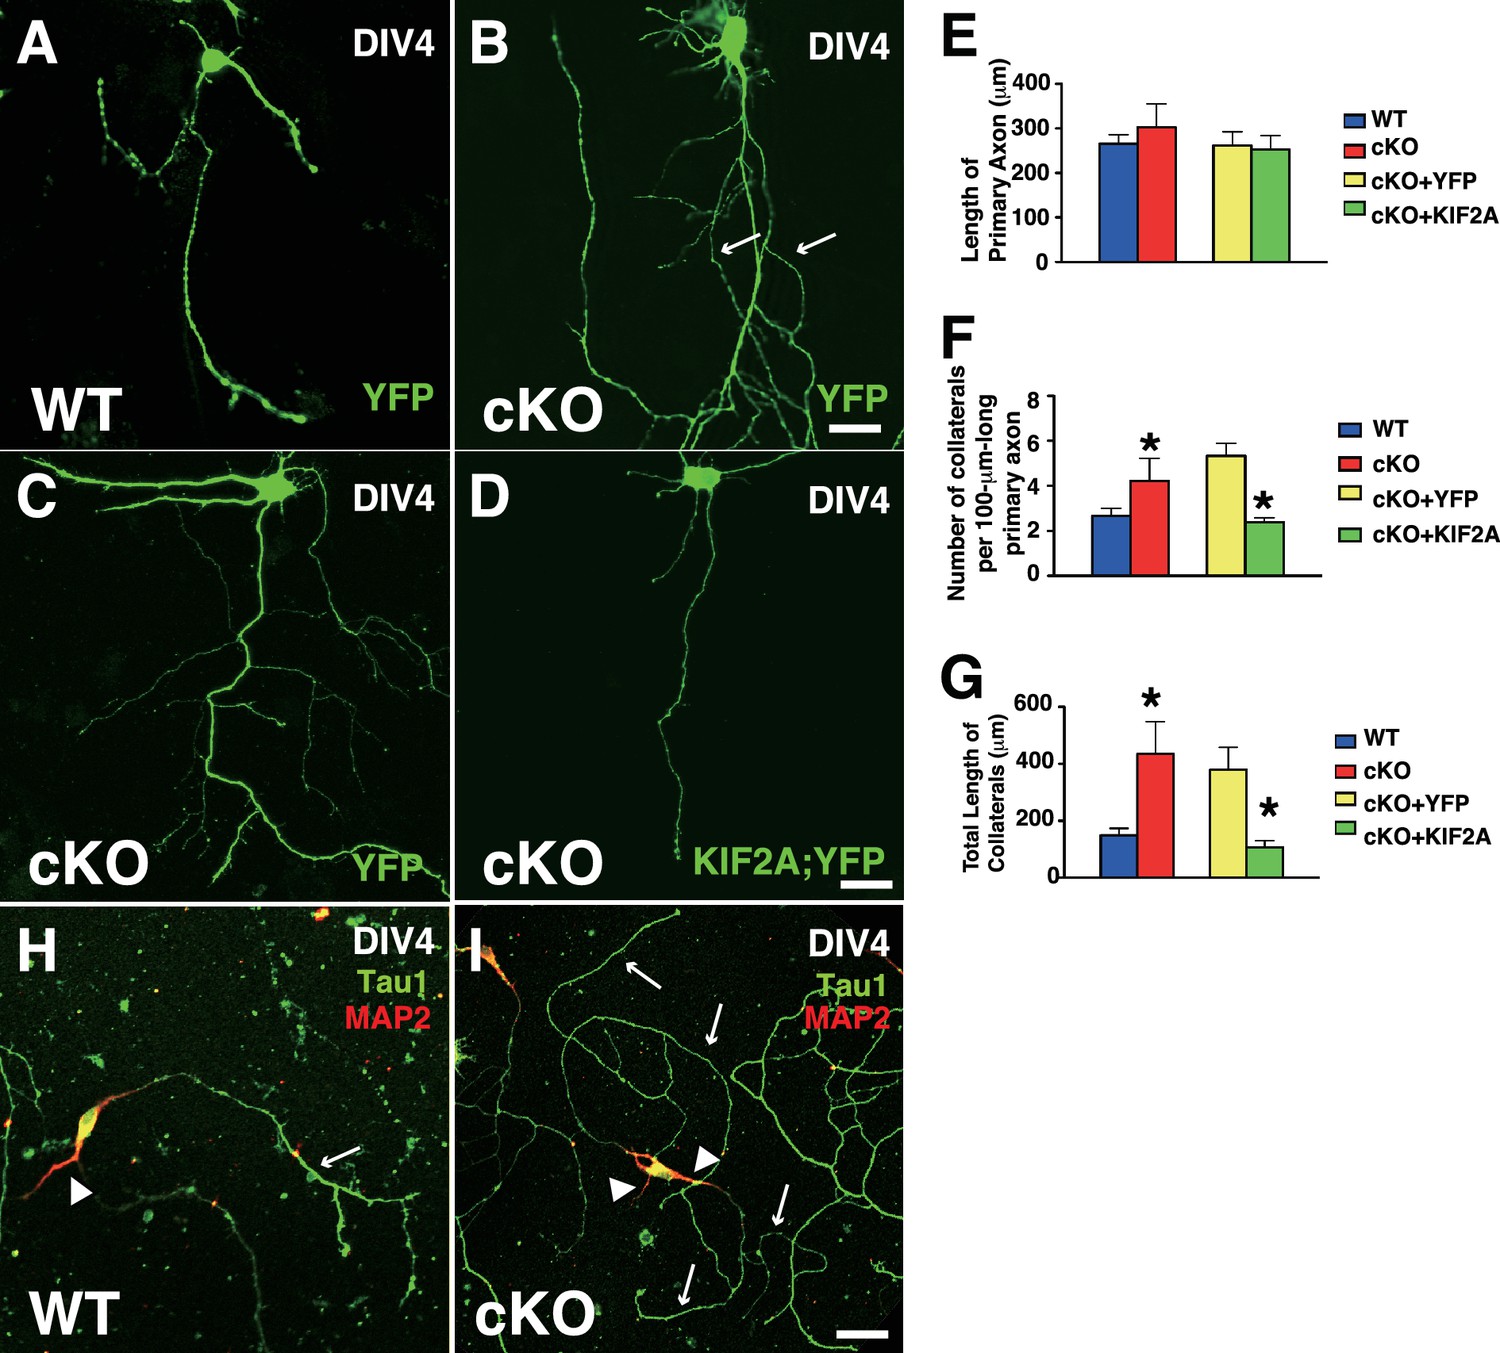
Transfection of KIF2A rescued MF sprouting in dissociated cultured DGCs.
(A–G) The rescue experiment. (A–D) Representative images of single cultured DGCs. DGCs were transfected with YFP or YFP-KIF2A at DIV3 and then observed at DIV4. Compared with the WT DGCs (A), cKO DGCs developed many collaterals (B, C). The phenotype was rescued by expressing YFP-KIF2A (D). (E–G) Statistical analysis of the length of primary axons (E), the number of collaterals per 100-μm-long primary axon (F) and the total lengths of the collaterals (G). Note that the cKO DGCs developed significantly more and longer collaterals than did the WT DGCs. The results are shown as the mean ± SEM from three independent experiments including n = 30 cells each. *p=0.01, one-way ANOVA. (H–I) Characterization of recorded neuronal processes. After recording, the DGCs were fixed and immunostained with anti-Tau1 and anti-MAP2 antibodies. Dendritic processes that were actively overextended in the cKO DGC video are Tau1-positive (arrows in I), whereas the WT DGC had a single Tau1-positive axon and MAP2-positive dendrites (an arrow and an arrowhead in H).
Figure 6—Video 1
Time lapse recordings of cultured WT DGC.
This recording was obtained at the end of DIV2 for 8 hr. The DGC controls the length of an axon and a dendrite. No protrusions from the cell body. An immunostained image of the recorded cell is shown in Figure 6—figure supplement 1H.
Figure 6—Video 2
Time lapse recordings of cultured P3-Kif2a-cKO DGC.
This recording was obtained at the end of DIV2 for 8 hr. The DGC is rapidly elongating and branching an axon and dendrites, in addition to some aberrant protrusions from the cell body. An immunostained image of the recorded cell is shown in Figure 6—figure supplement 1I.
Figure 7
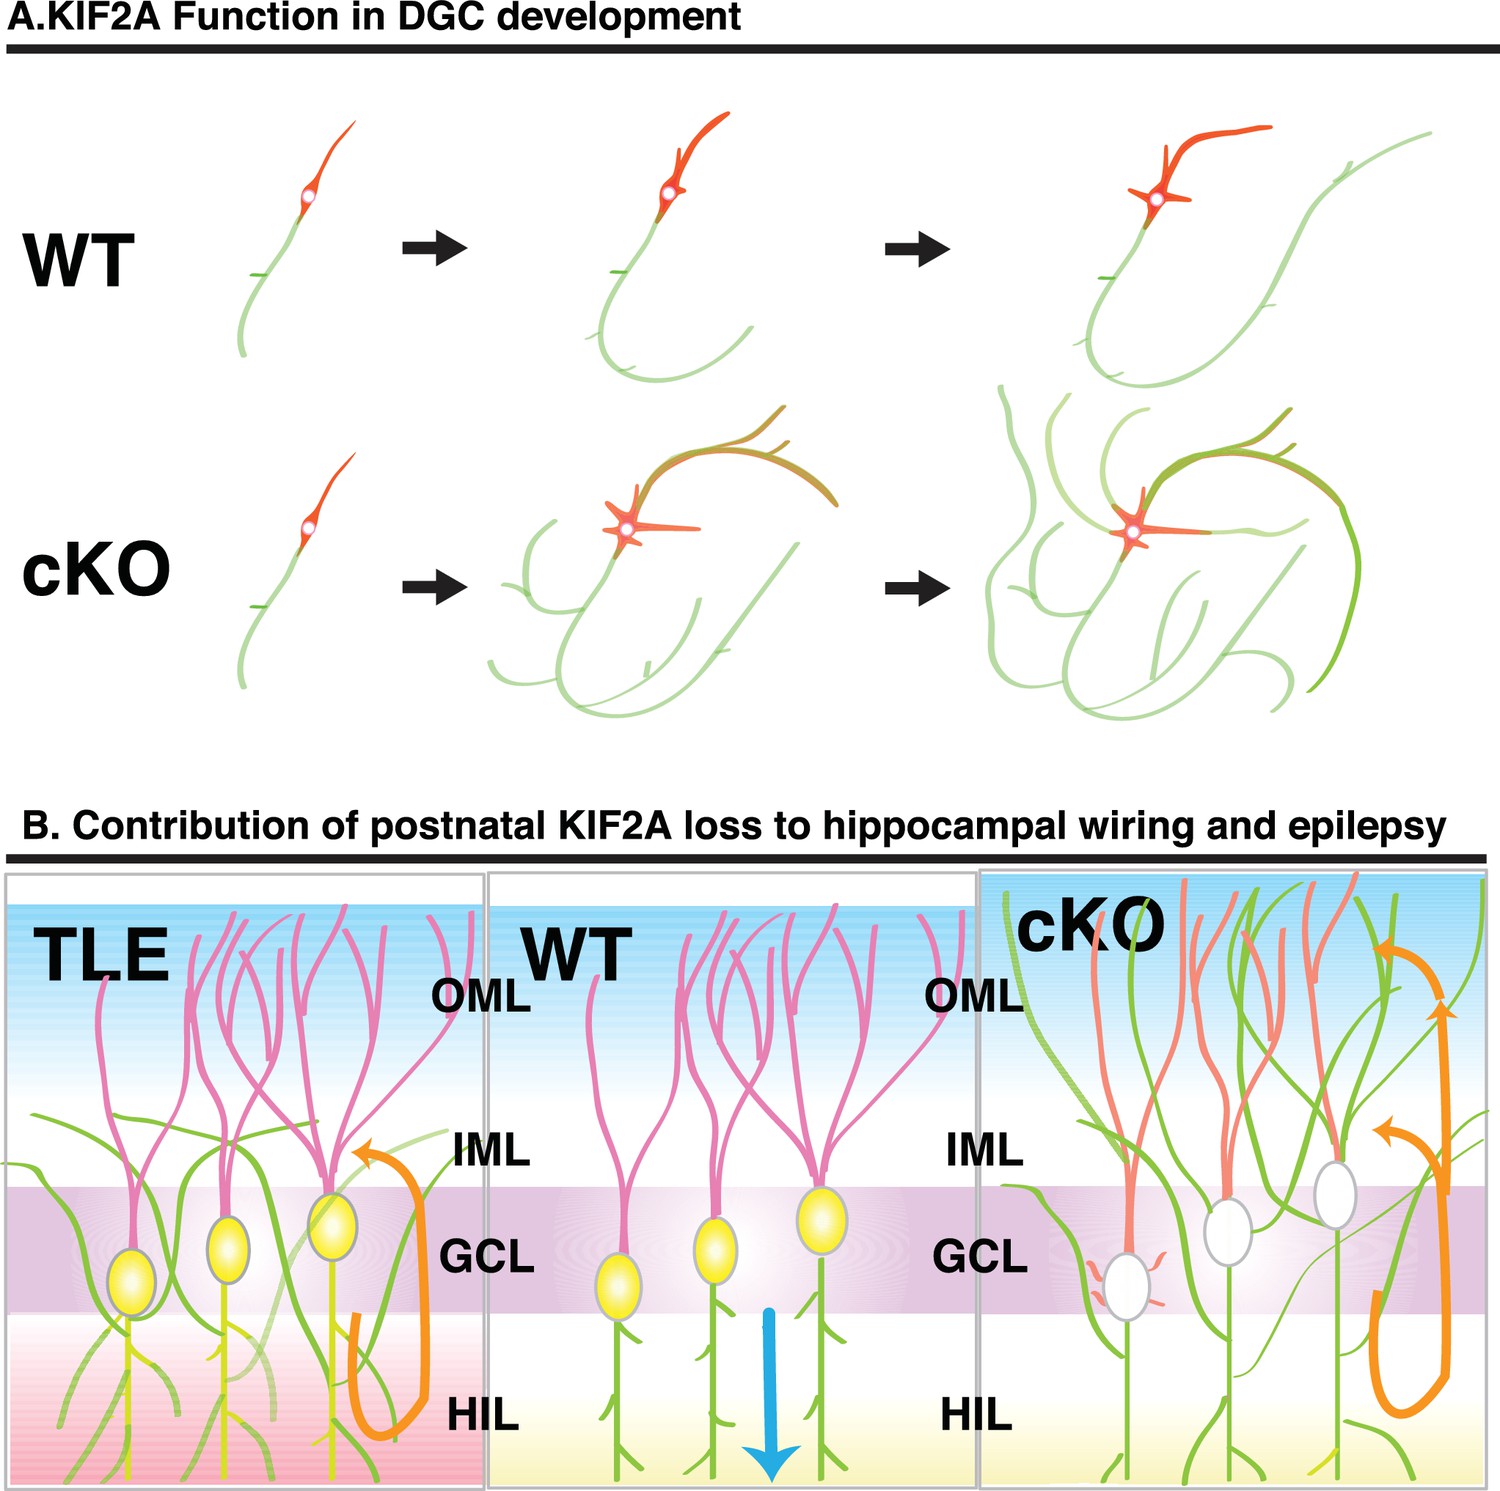
Schematic of the function of KIF2A in the postnatal hippocampus.
(A) KIF2A function in DGC development. At the early stages of development, both WT and cKO DGCs normally make axonal and dendritic processes. However, whereas WT DGCs regulate the length of dendritic processes and extend a primary axon, Kif2a-cKO DGCs overextend and sprout both axon and dendrites, eventually developing many sprouted axonal processes. (B) KIF2A function in postnatal hippocampal wiring. In WT mice (center panel), KIF2A is highly expressed in MFs (yellow area) and actively suppresses both aberrant MFS and the elaboration of aberrant processes. The excitation of DGCs is unidirectionally transmitted along a MF (blue arrow). When the suppression is released by the loss of KIF2A (right panel), DGCs might start sprouting MFs, thus generating aberrant apical axons, and altering the dendritic features. The aberrant processes are extended into the entire ML and make reflective excitatory circuits. The excitation of DGCs is multidirectionally transmitted, and DGCs are recurrently excited (orange arrows). The repetitive excitation enhances MFS and then eventually causes TLE. In TLE mice (left panel), repetitive excitation induces MFS, but the distribution of aberrant axon terminals is limited to the IML.
Tables
Key resources table
| Reagent type (species) or resource | Designation | Source or reference | Identifiers | Additional information |
|---|---|---|---|---|
| Gene (Mus muscu/us) | Kif2a | PMID:1447303 | MGl:108390 | |
| Strain, strain background (Mus muscu/us) | C57BU6NJcl, C57BU6JJcl | Clea Japan | ||
| Strain, strain background(Mus muscu/us) | CreERt(CAG-cre/Esr1) | The Jackson Laboratory | Tg(CAG-cre/Esr1 *)5Amc/J (Stock No: 004453) | |
| Strain, strain background(Mus muscu/us) | R26R (lacZ expression with the ROSA26 Cre reporter strain) | PMID:9916792 | ||
| Strain, strain background(Mus muscu/us) | Thy1-EGFP line M | The Jackson Laboratory | Tg(Thy1-EGFP)MJrs/J (Stock No: 007788) | |
| Cell line (Mus musculus) | CMTl-1 | Merck Millipore | 129/Sv-derived ES cell (ESC) line | |
| Antibody | anti-KIF2A (mouse monoclonal) | PMID: 7535303 | (1:200) | |
| Antibody | anti-KIF2A (rabbit polyclonal) | Thermo Fisher | Thermo Fisher: PA3-16833 | (1:1500) |
| Antibody | anti-GFAP(mouse monoclonal) | BO Transduction Laboratory | BO Bioscience: 610565 (Clone 52/GFAP) | (1:200) |
| Antibody | anti-BrdU (mouse monoclonal) for ldU | BO Pharmingen | BO Bioscience: 555627 (Clone 304) | (1:1000) |
| Antibody | anti-BrdU (rat monoclonal) for CldU | Accurate Chemicals | Accurate Chemicals (Clone: BU1/75) | (1:500) |
| Antibody | anti-Tau1 (mouse monoclonal) | Merck Millipore | Merck Millipore: MAB3410 (Clone PC1C6) | (1:1000) |
| Antibody | anti-Neurofilament M (mouse monoclonal) | Sigma | Sigma: N5264 (Clone NN18) | (1:600) |
| Antibody | anti-MAP2 (chicken monoclonal) | Abeam | Abeam: AB5392 (Clone 304) | (1:200) |
| Antibody | anti-Synaptoporin (rabbit polyclonal) | Synapitic Systems | SYSY:102002 | (1:300) |
| Antibody | anti-Prox1 (rabbit polyclonal) | Merck Millipore | Merck Millipore: AB5475 | (1:10000) |
| Antibody | anti-Ankyrin G (mouse monoclonal) | Thermo Fisher | Thermo Fisher: 338800 (Clone 4G318) | (1:600) |
| Antibody | Alexa 488-, 546-, 555-, 647, (Goat polyclonal) | Molecular Probes | (1: 200–1: 500) | |
| Recombinant DNA reagent | pEYFP-C1 (vector) | Clontech | ||
| Recombinant DNA reagent | YFP-Kif2a (full length) | PMID: 14980225 | Progenitors: pEYFP-C1 vector | |
| Commercial assay or kit | LA PCR Kit | Takara | TaKaRa:RR013A | |
| Chemical compound, drug | Tamoxifen | Sigma | Sigma:T5648 | (30 mg/kg body weight/day) |
| Chemical compound, drug | Pilocarpine | Sigma | Sigma: P6503 | (290 mg/kg body weight/day}, |
| Chemical compound, drug | Scopolamine methyl bromide | Sigma | sigma: 8502 | (1 mg/kg body weight/day) |
| Chemical compound, drug | ScaleView | Olympus | ||
| Chemical compound, drug | 5-iodo-2'-deoxyuridine | Sigma | Sigma: 17125 | 50 mg/kg |
| Chemical compound, drug | 5-chloro-2 '-deoxyuridene | Sigma | Sigma: C6891 | 50 mg/kg |
| Chemical compound, drug | poly-L-lysine | Sigma | Sigma: P-2636 | 100 mg/ml |
| Chemical compound, drug | Laminin | lnvitrogen | lnvitrogen: 23017–015 | 25 µg/ml |
| Software, algorithm | MicroMax 1. 3 | AccuScan Instrument | ||
| Software, algorithm | Clampex 9.2 software | Axon Instruments | ||
| Software, algorithm | IMARIS 7.2 | Bitplane:Zeiss | ||
| Software, algorithm | lmageJ 1.51 hr | NIH | ||
| Software, algorithm | SPSS V22 | IBM | ||
| Machine | MicroMax Monitor | AccuScan Instruments | ||
| Machine | Axopatch 1D amplifier | Axon Instruments |
Additional files
-
Transparent reporting form
- https://doi.org/10.7554/eLife.30935.031
Download links
A two-part list of links to download the article, or parts of the article, in various formats.
Downloads (link to download the article as PDF)
Open citations (links to open the citations from this article in various online reference manager services)
Cite this article (links to download the citations from this article in formats compatible with various reference manager tools)
KIF2A regulates the development of dentate granule cells and postnatal hippocampal wiring
eLife 7:e30935.
https://doi.org/10.7554/eLife.30935


