YAP and TAZ regulate adherens junction dynamics and endothelial cell distribution during vascular development
- Max-Delbrück-Center for Molecular Medicine, Germany
- London Research Institute – Cancer Research UK, United Kingdom
- DZHK (German Center for Cardiovascular Research), Germany
- Max Planck Institute for Heart and Lung Research, Germany
- Faculdade de Medicina da Universidade de Lisboa, Portugal
- International Institute of Molecular and Cell Biology, Poland
- Vesalius Research Center, Belgium
- KU Leuven, Belgium
- Berlin Institute of Health, Germany
Figures
Figure 1 with 1 supplement
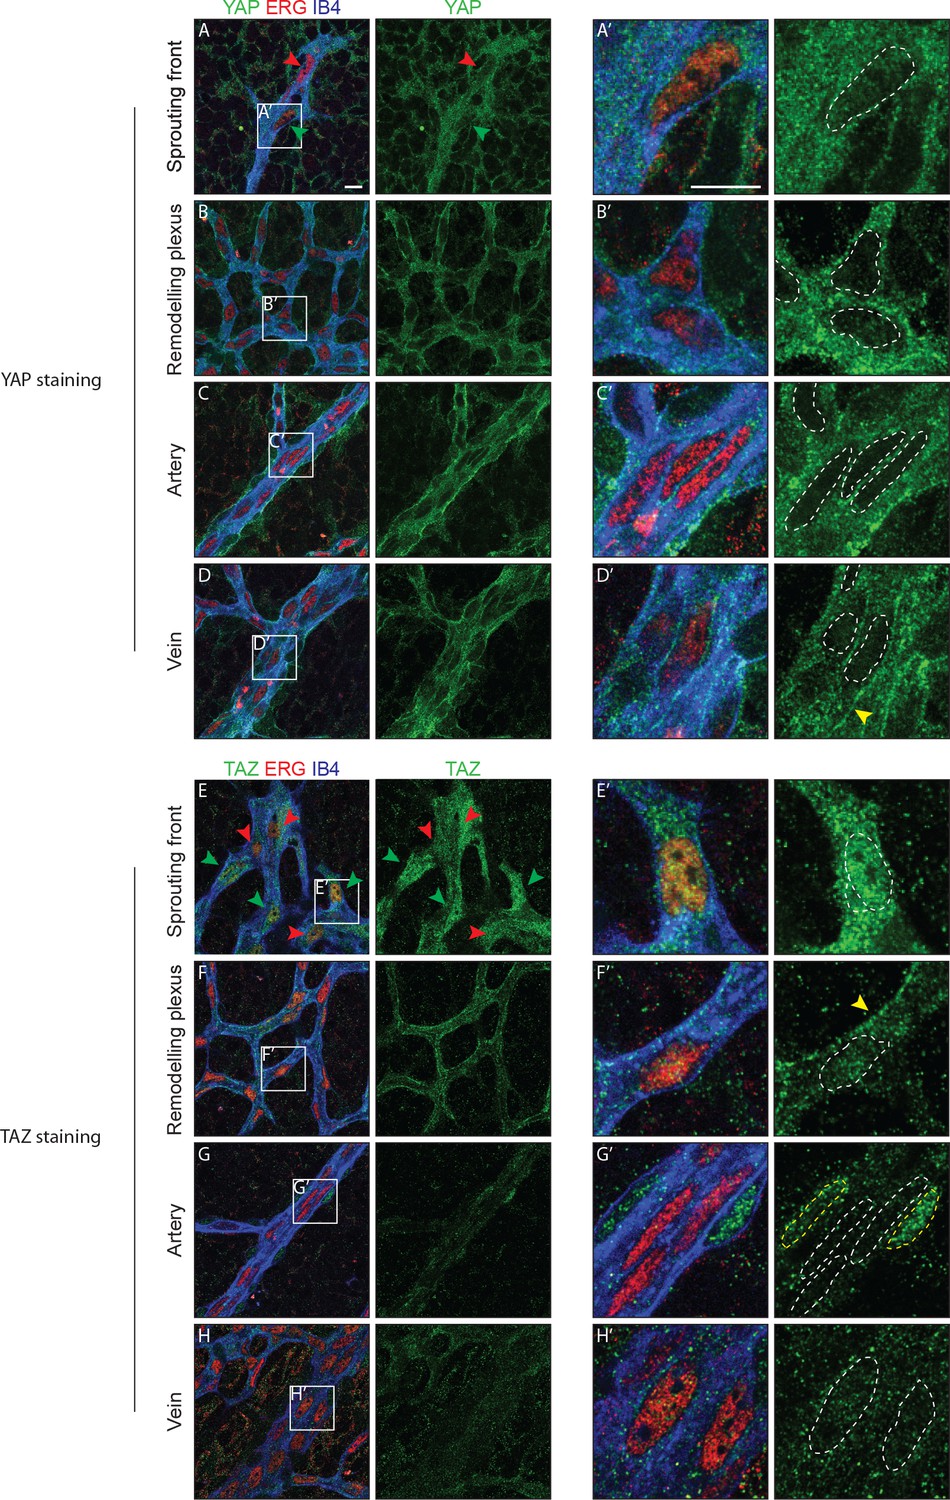
YAP and TAZ are expressed throughout the vasculature of developing mouse retinas, and localise to the nucleus of sprouting endothelial cells.
Immunofluorescence staining of YAP (green, A–D and A’–D’) and TAZ (green, E–H and E’–H’) was performed in wild-type mouse retinas at post-natal day 6 (P6). Retinas were co-stained with the endothelial membrane marker Isolectin-B4 (IB4; blue) and with antibodies against the endothelial nuclei marker ERG (red). White dotted lines, outline of endothelial nuclei. Yellow dotted lines, outline of perivascular cells’ nuclei. Green arrowheads, nuclear localisation of YAP and TAZ. Red arrowheads, cytoplasmic localisation of YAP and TAZ. Yellow arrowheads, junctional localisation of YAP and TAZ. Images correspond to single confocal planes. n > 3 animals for each staining. Scale bar: 10 μm.
Figure 1—figure supplement 1

YAP and TAZ localise at endothelial adherens junctions in the mouse retina.
Immunofluorescence stainings of YAP (green, A–C,A’–C’), TAZ (green, D–F, D’–F’) and VE-Cadherin (red, B,E,B’,E’) were performed in wild-type mouse retinas at P6. Arrows, co-localisation of YAP or TAZ with VE-Cadherin. Images correspond to single confocal planes. n > 3 pups per staining. Scale bar A-C and D-F 10 μm, A’-C’ and D’-F’ 3 μm.
Figure 2 with 2 supplements
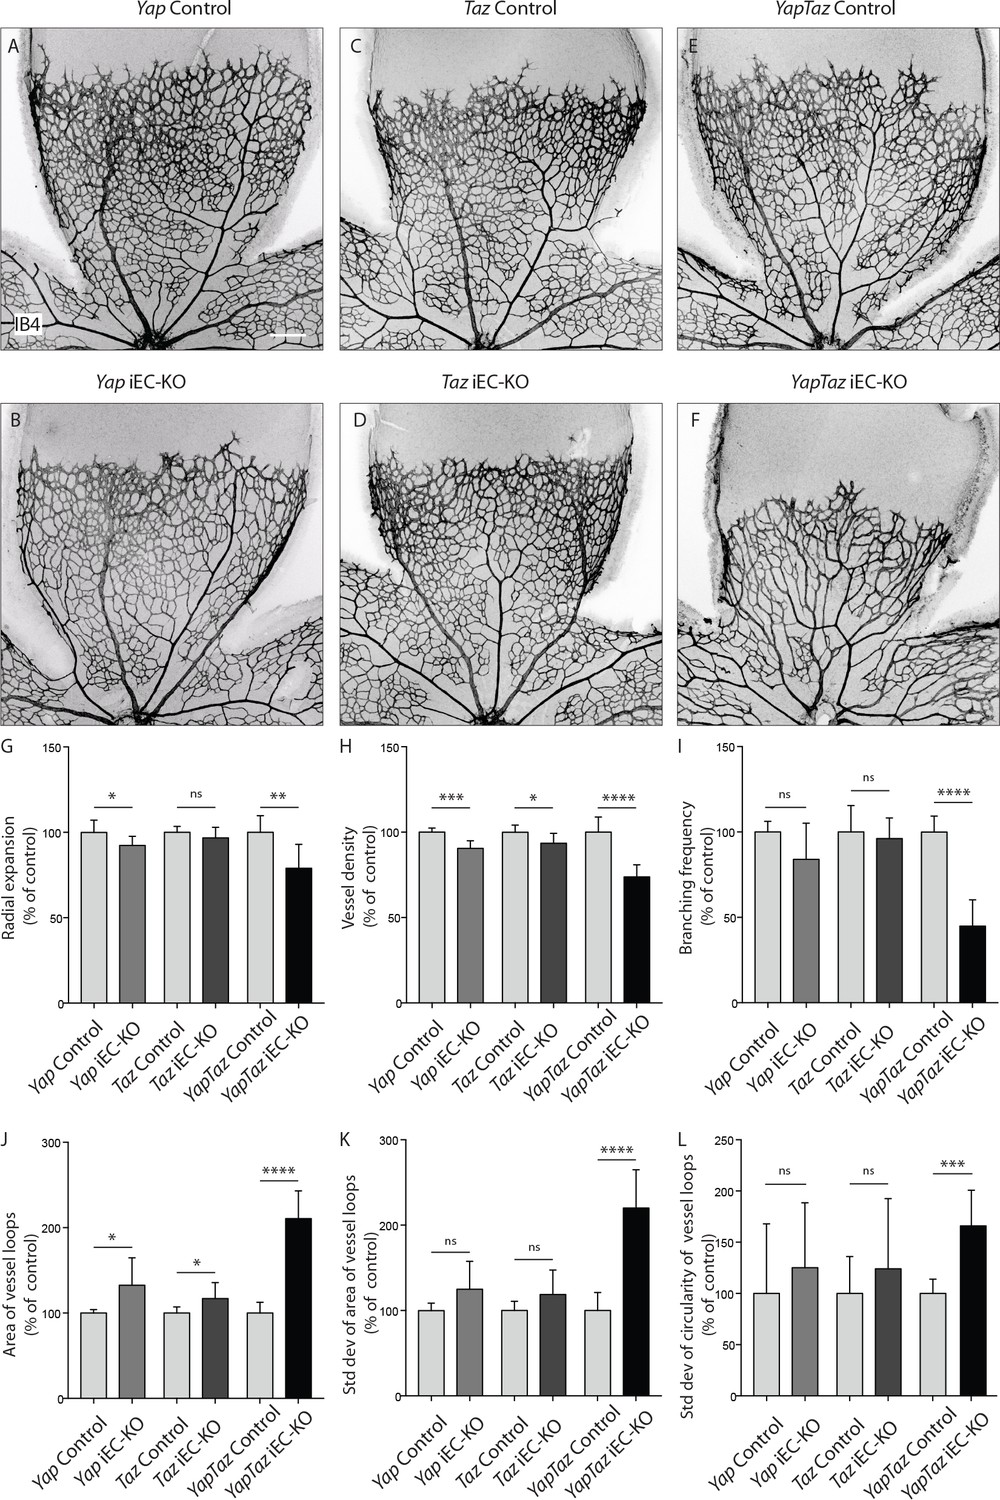
Endothelial YAP and TAZ are required for vessel growth, branching and homogeneity of the plexus.
(A–F,) Retinas from P6 Yap iEC-KO (B), Taz iEC-KO (D) and YapTaz iEC-KO (F), and respective control pups (A,C,E) were stained with Isolectin B4 (IB4). Scale bar: 200 μm. (G–J), Quantification of radial expansion (G), vessel density (H), branching frequency (I) and area of vessel loops (J) in Yap iEC-KO, Taz iEC-KO and YapTaz iEC-KO. Results are shown as percentage of the respective controls. Data are mean ±SD. n ≥ 5 pups. p values were calculated using unpaired t-test. *p<0.05; **p<0.01; ****p<0.0001. (K, L), Quantification of the standard deviation of the area (K) and circularity (L) of the vessels loops in Yap iEC-KO, Taz iEC-KO and YapTaz iEC-KO retinas. Results are shown as percentage of the respective controls. Data are mean ±SD. n ≥ 5 pups. p values were calculated using unpaired t-test. *p<0.05; **p<0.01; ***p<0.001****p<0.0001.
-
Figure 2—source data 1
Values for quantification of radial expansion (Figure 2G), vessel density (Figure 2H), branching frequency (Figure 2I), area of gaps (Figure 2J) and standard deviation of area (Figure 2K) and circularity (Figure 2L) of gaps in P6 Yap iEC-KO, Taz iEC-KO and YapTaz iEC-KO and respective control pups.
Each value corresponds to the average of several measurements for one animal (see Material and methods for details).
- https://doi.org/10.7554/eLife.31037.007
Figure 2—figure supplement 1
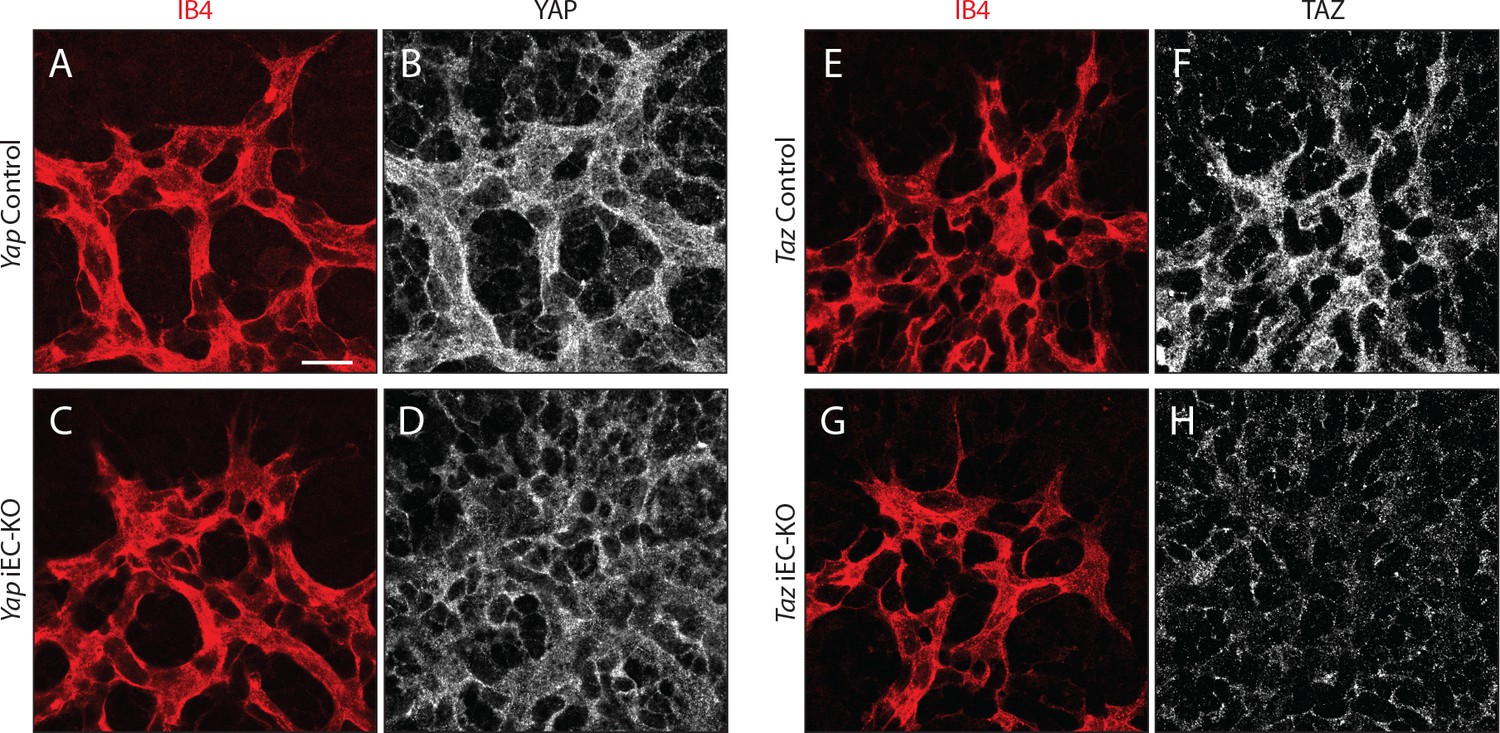
YAP and TAZ proteins are lost upon Cre-mediated genetic deletion in P6 mouse retinas.
Yap iEC-KO (Yapfl/fl Pdgfb-iCreERT2+/wt), Taz iEC-KO (Tazfl/fl Pdgfb-iCreERT2+/wt) and respective littermate control mice (YapControl, Yapfl/fl and TazControl, Tazfl/fl) were injected with tamoxifen at P1 and P3. At P6, mouse retinas were stained for YAP (grey, B,D), TAZ (grey, F,H), and with Isolectin B4 (IB4; red, A,C,E,G). n > 3 pups. Scale bar: 20 μm.
Figure 2—figure supplement 2
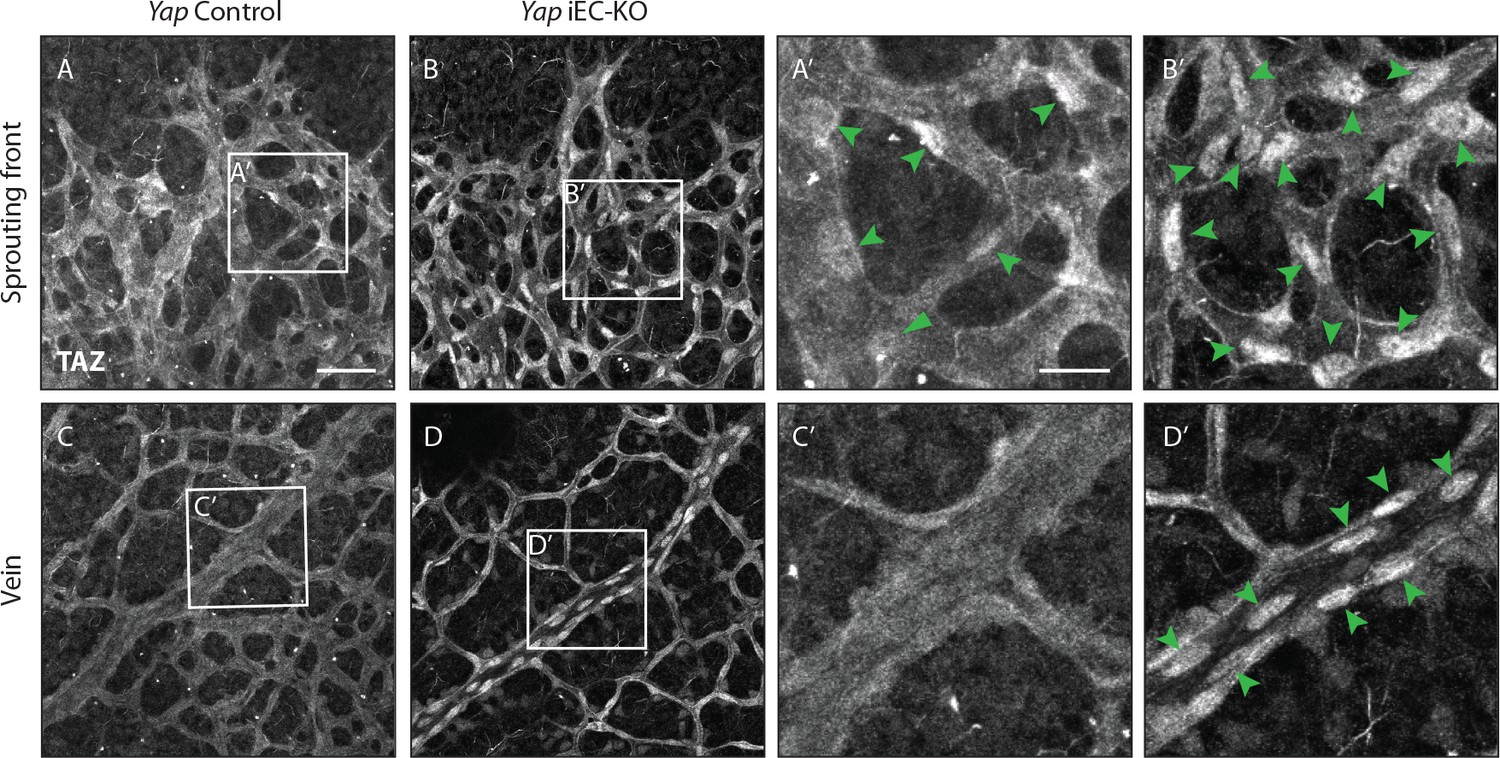
TAZ compensates for the loss of YAP in endothelial cells in vivo.
Retinas from P6 Yap iEC-KO (B,D and B’,D’) and littermate controls (A,C and A’, C’) were immunostained for TAZ. Green arrowheads, nuclear Taz. A,B, A’,B’ images correspond to maximum projection of z stack. C,D,C‘,D’ correspond to single confocal planes. n > 3 pups. Scale bar: A-D 50 μm, A’-D’ 20 μm.
Figure 3 with 2 supplements
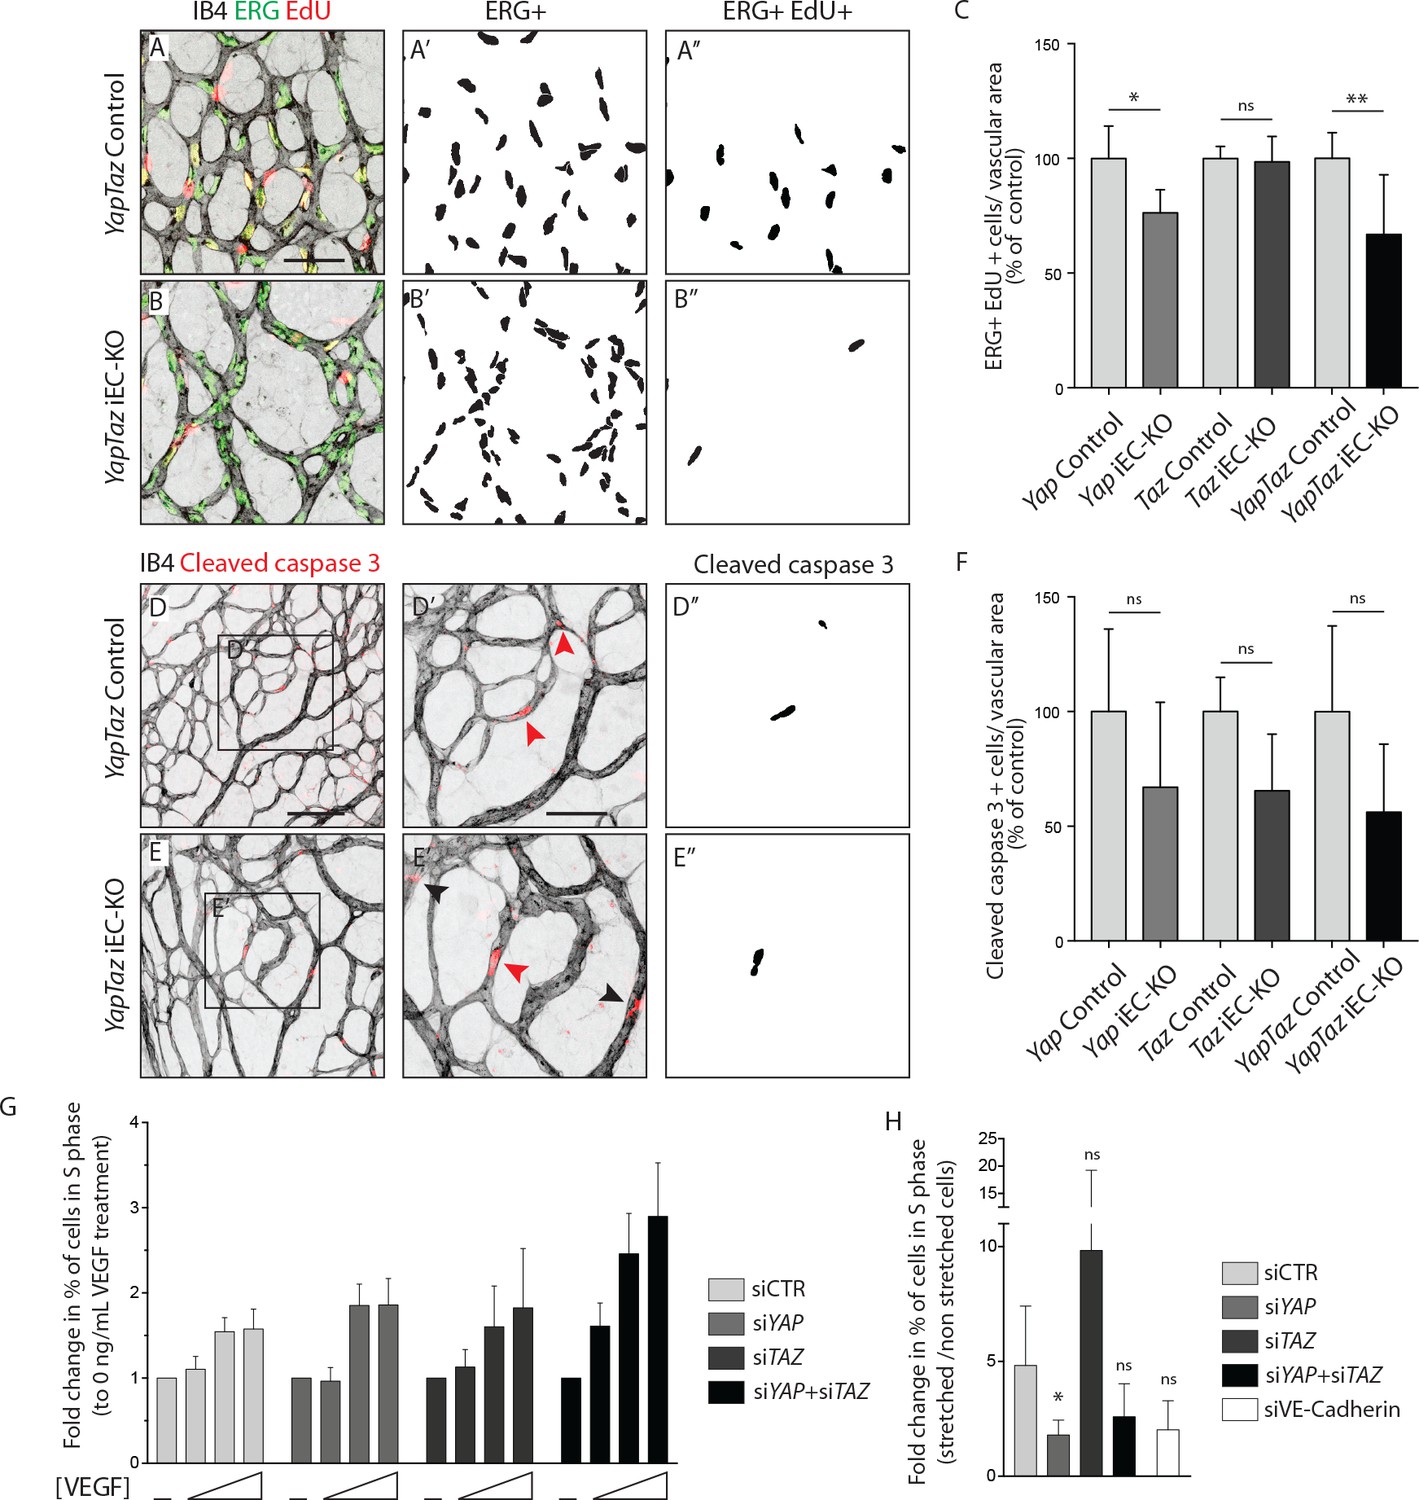
YAP and TAZ are required for endothelial cell proliferation in vivo and endothelial cell proliferation in response to mechanical stretch in vitro.
(A, B) P6 retinal vessels labelled with IB4 (grey) and stained for EdU (red, marking S phase positive cells) and Erg (green, marking endothelial nuclei) in YapTaz iEC-KO (B) and littermate control mice (A). A’,B’, mask of Erg +cells indicating endothelial nuclei. (A’’, B’’) mask of Erg + and EdU + cells indicating proliferating endothelial cells. (C) Quantification of endothelial proliferation in Yap iEC-KO (n = 3 control/4 KO pups), Taz iEC-KO (n = 5 control/5 KO pups) and YapTaz iEC-KO (n = 8 control/7 KO pups). Number of EdU-positive and ERG-positive cells per IB4 labelled vascular area was calculated for each genotype and results are shown in percentage of the respective controls. Data are mean ±SD. p values were calculated using unpaired t-test. ns, p>0.05; *p<0.05; **p<0.01. Scale bar: 50 μm. (D, E) P6 retinal vessels labelled with IB4 (grey) and stained for cleaved caspase 3 (red) in YapTaz iEC-KO (E) and littermate control mice (D).D’, E’, magnification of boxed area in D,E. Red arrowheads, cleaved caspase 3 positive endothelial cell. Black arrowheads, cleaved caspase 3 outside vessels. D’’,E’’, mask of cleaved caspase 3 positive endothelial cells. (F) quantification of endothelial apoptosis in Yap iEC-KO (n = 7 control/7 KO pups), Taz iEC-KO (n = 4 control/4KO pups) and YapTaz iEC-KO (n = 5 control/4 KO pups). Data are mean ±SD. p values were calculated using unpaired t-test. ns, p>0.05. Scale bar: D-E 100 μm, D’-E’ 50 μm. (G) Quantification of endothelial proliferation with increasing concentrations of VEGF treatment in YAP, TAZ and YAP/TAZ knockdown cells and control. HUVECs were treated with 0, 40, 200 or 1000 ng/mL VEGF for 24 hr and the percentage of cells in S phase was determined by flow cytometry. Graph shows the mean +SD fold change in percentage of S phase positive cells relative to 0 ng/mL of VEGF treatment. n = 3 independent experiments;>50.000 cells analysed per experiment per condition. (H) Quantification of endothelial proliferation after stretch in in YAP, TAZ, YAP/TAZ and VE-Cadherin knockdown cells and control. HUVECs were subjected to cyclic stretch for 24 hr and percentage of cells in S phase was determined by EdU pulsing and immunofluorescence staining. Graph shows the mean +SD fold change in percentage of S phase positive cells of stretched to non stretched cells for each knockdown condition. n = 5 independent experiments, >100 cells counted per experiment per condition. p values were calculated using unpaired t-test. ns, p>0.05; *p<0.05.
-
Figure 3—source data 1
Values for quantification of endothelial proliferation (Figure 3C) and apoptosis (Figure 3F) in P6 Yap iEC-KO, Taz iEC-KO and YapTaz iEC-KO and respective control pups.
- https://doi.org/10.7554/eLife.31037.011
Figure 3—figure supplement 1
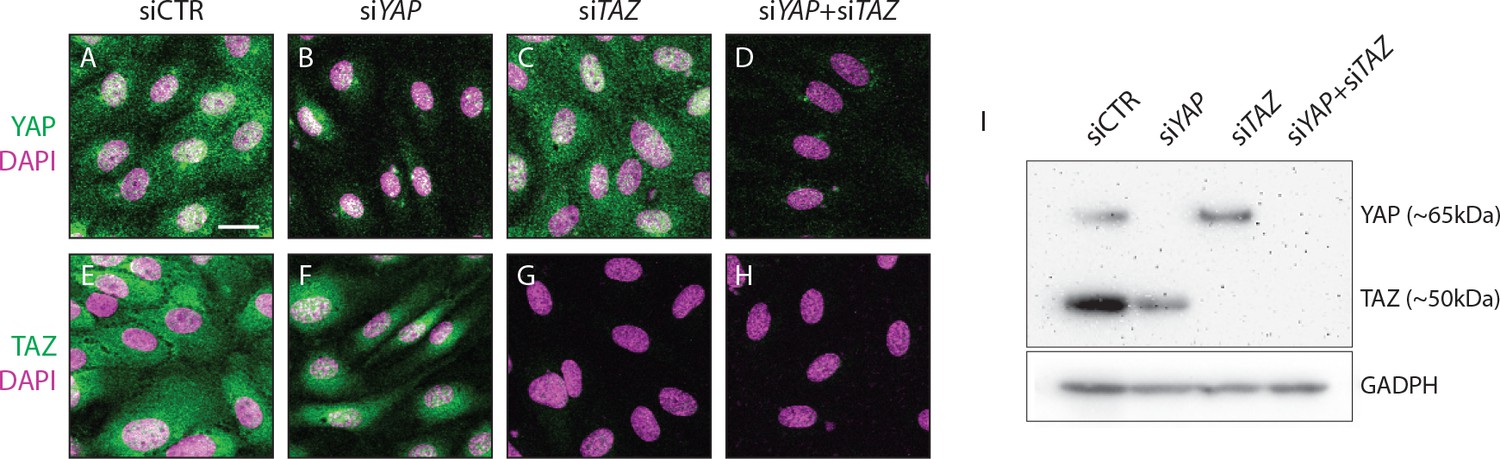
YAP and TAZ proteins are lost after gene knockdown by siRNA in HUVECs.
HUVECs were treated with non targeting siRNA (siCTR) or siRNA targeting YAP, TAZ and YAP +TAZ for 24 hr. A-H, Immunofluorescence staining for YAP (green, A–D) or TAZ (green, E–H) and labelling of nuclei with DAPI (magenta) 72 hr after siRNA transfection. Scale bar: 10 μm. I, Western blot for YAP/TAZ and GAPDH 72 hr after siRNA transfection.
Figure 3—figure supplement 2

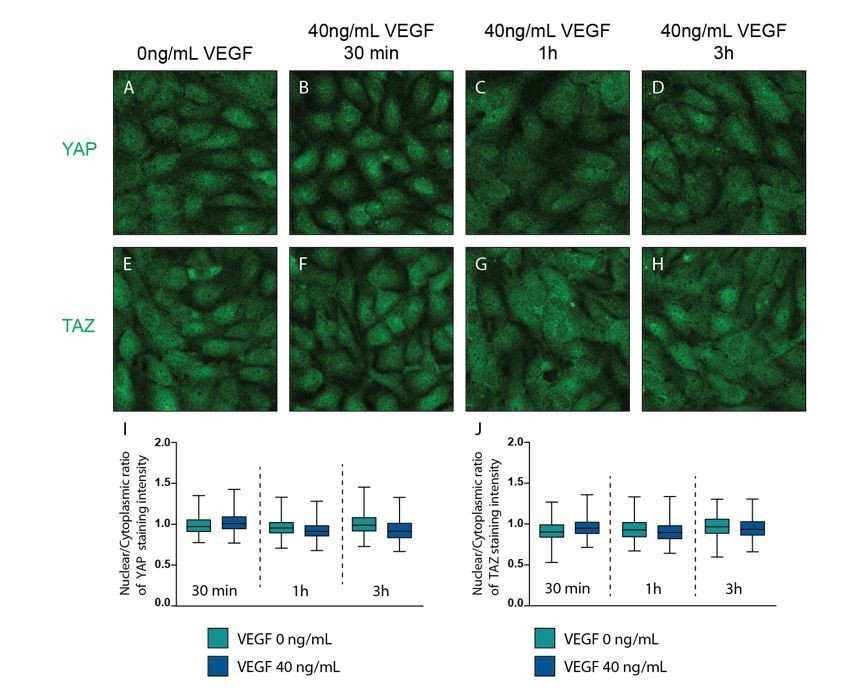
VEGF treatment does not affect YAP and TAZ subcellular localisation.
(A–H), Confluent HUVECs were treated with 40 ng/mL of VEGF for 30 min (B, F), 1 hr (C,G) and 3 hr (D,H) or control (A,E) and stained for YAP (A–D) or TAZ (E–H) and DAPI (not shown). (I,J) Quantification of nuclear to cytoplasmic ratio of YAP (I) or TAZ (J) with VEGF treatment of one representative experiment. Nuclear/cytoplasmic ratio >1, YAP/TAZ nuclear; nuclear/cytoplasmic ratio <1, YAP/TAZ cytoplasmic. At least 200 cells quantified per condition per experiment. n = 2 independent experiments.
Figure 4 with 1 supplement
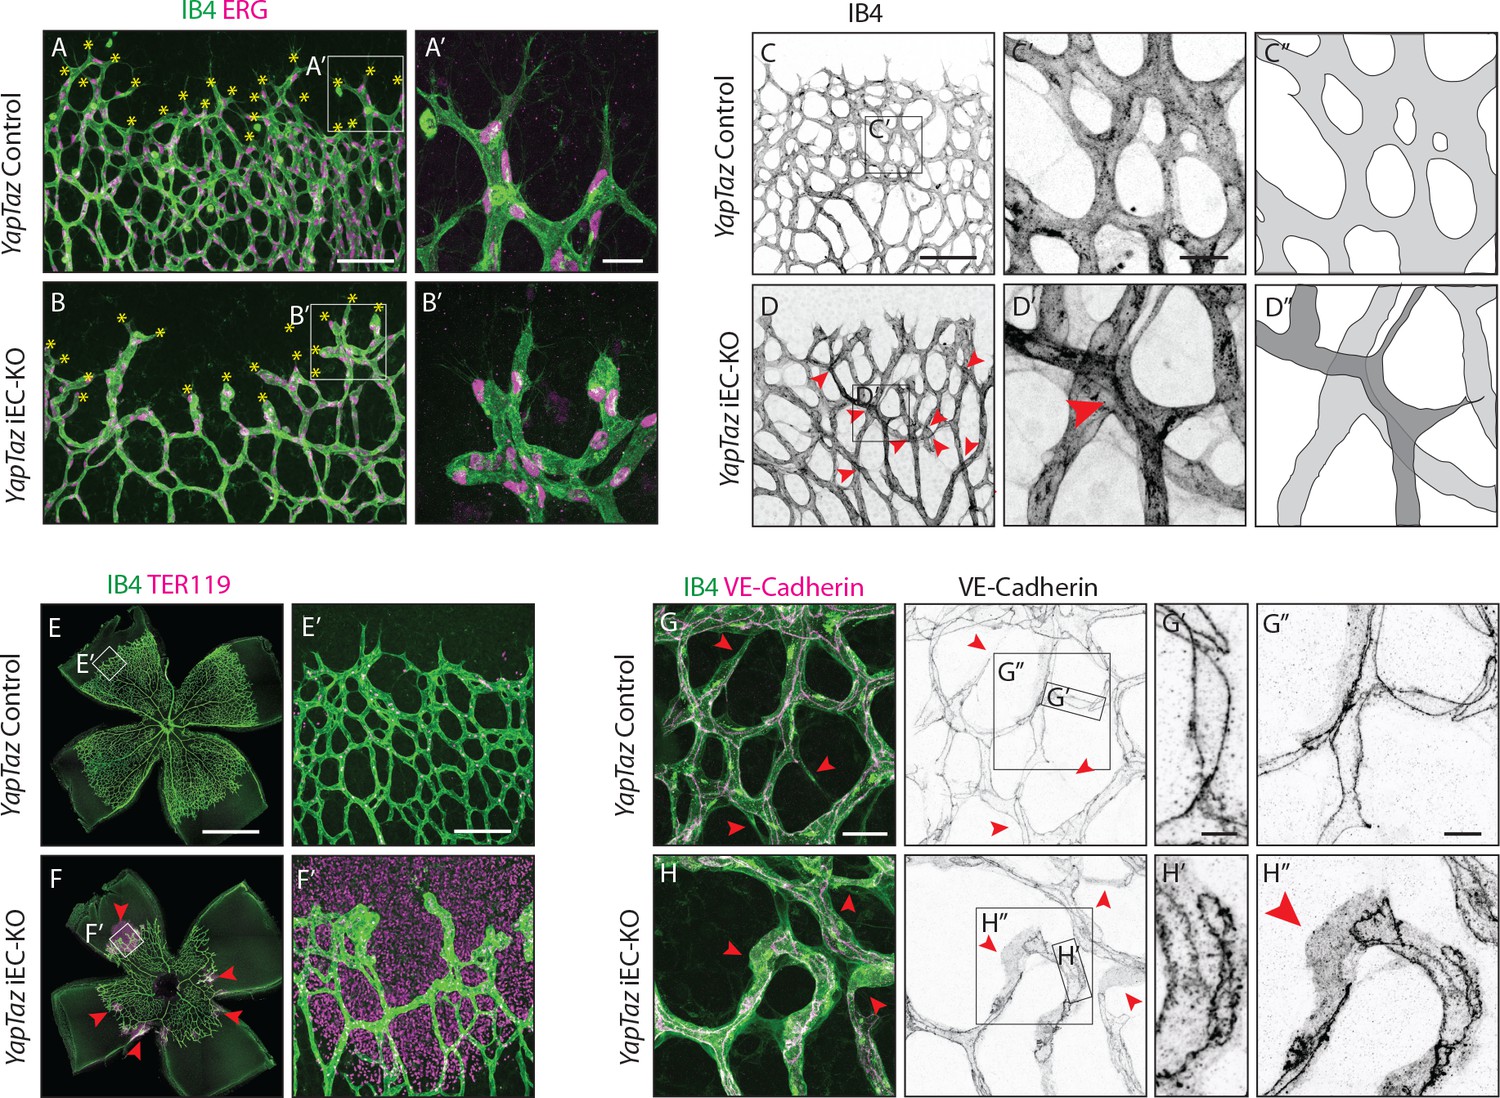
Combined loss of YAP and TAZ leads to decreased sprouting numbers and shape defects, vessel crosses, haemorrhages at the sprouting front and adherens junctions’ defects in vivo.
(A, B) P6 retinal vessels labelled with IB4 (green) and stained for ERG (magenta, marking endothelial nuclei) in YapTaz iEC-KO (B) and littermate control mice (A). Yellow asterisks mark sprouts. A’,B’, magnification of boxed areas in A and B. n = 9 control/9 KO pups. Scale bar: A,B 100 μm, A’, B’ 25 μm. (C, D) P6 retinal vessels labelled with IB4 in YapTaz iEC-KO (D) and littermate control mice (E). Red arrowheads, vessel crosses. (C’, D’) magnification of boxed areas in C,D. C’’,D’’, depiction of vessels in C’ and D‘; different colours represent vessels in different 3D planes. n = 4 control/4 KO pups. Scale bar: C,D 100 μm, C’-D’ 20 μm. (E, F) P6 retinal vessels labelled with IB4 (green) and stained for TER119 (magenta, marking red blood cells) in YapTaz iEC-KO (F) and littermate control mice (E). Red arrowheads, haemorrhages. E’,F’, magnification of boxed areas in E and F. n = 4 control/5 KO pups. Scale bar: E,F 1000 μm, E’, F’ 100 μm. (G, H), P6 retinal vessels labelled with IB4 (green) and stained for VE-Cadherin (magenta) in YapTaz iEC-KO (H) and littermate control mice (G). Red arrowheads, no longitudinal VE-Cadherin labelled junction along vessel axis denoting unicellular vessel segments. (G’,H’, G’’,H’’) magnification of boxed areas in G and H. n = 4 control/4 KO pups. Scale bar: G,H 25 μm, G’,H’ 5 μm, G”,H” 10 μm.
Figure 4—figure supplement 1
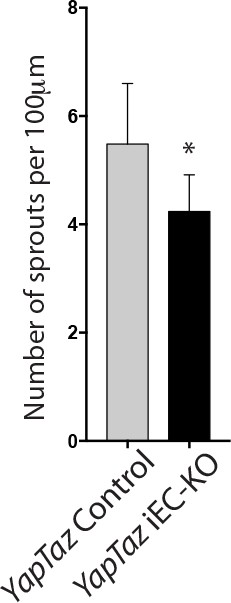
Combined loss of YAP and TAZ leads to decreased number of sprouts in the developing mouse retina.
Quantification of number of sprouts per 100 μm of sprouting front extension at P6 in YapTaz iEC-KO (n = 9 pups) and littermate control mice (n = 9 pups). Data are mean ±SD. p values were calculated using unpaired t-test. *p<0.05.
Figure 5 with 1 supplement
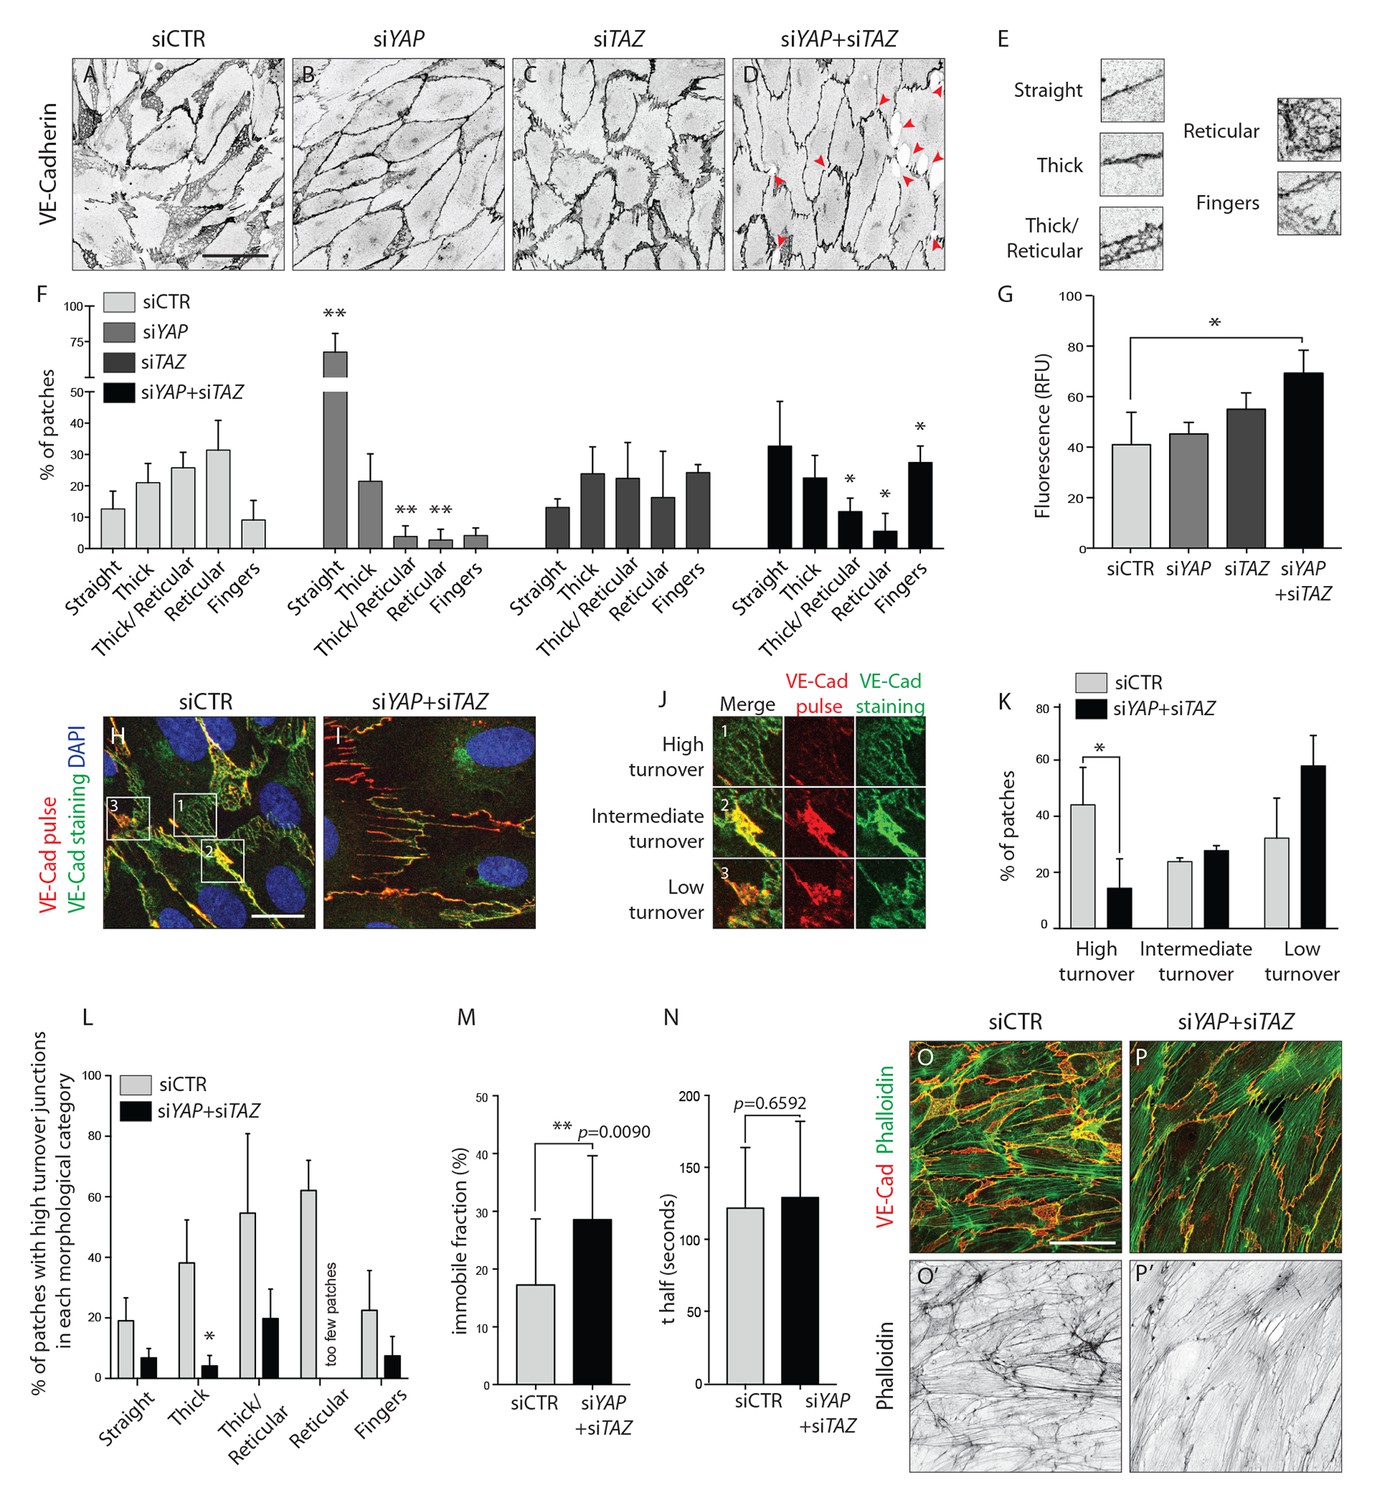
YAP and TAZ regulate adherens junctions’ morphology, monolayer permeability and VE-Cadherin turnover in vitro.
(A–D) HUVECs knocked down for YAP (B), TAZ (C) and YAP/TAZ (D) and control (A) stained for VE-Cadherin. Red arrowheads, discontinuous VE-Cadherin. Scale bar: 50 μm. (E) Representative patches used for manual morphological classification of adherens junctions in five categories: straight junctions, thick junctions, thick to reticular junctions, reticular junctions and fingers. (F) Morphological analysis of VE-Cadherin labelled cell junctions in HUVECs knocked down for YAP, TAZ and YAP/TAZ. Data are mean percentage ±SD of 3 independent experiments (two for siTAZ). n > 140 patches of VE-Cadherin stained HUVECs per knockdown condition per experiment. p values were calculated using unpaired t-test between knocked down cells for YAP, TAZ and YAP/TAZ and control. *p<0.05; **p<0.01. (G) Permeability of YAP, TAZ and YAP/TAZ knockdown monolayers of HUVECs to 250 kDa fluorescent dextran molecules. Data are mean +SD of 3 independent experiments. p values were calculated using unpaired t-test between knocked down cells for YAP, TAZ and YAP/TAZ and control. RFU, relative fluorescence units. *p<0.05. (H, I) HUVECs knocked down for YAP/TAZ (I) and control (H) triple labelled with DAPI (blue), pulsed VE-Cadherin 55-7HI (red, VE-Cadherin pulse), and surface VE-Cadherin (green, VE-Cadherin staining). VE-Cadherin 55-7HI pulse was done for 30 min and cells were fixed 2 hr after end of pulse. Scale bar: 20 μm. (J) Representative patches used for manual classification of junctions into high, intermediate and low turnover. (K) Quantification of junctional turnover in YAP/TAZ knockdown cells and control. (L) Quantification of the percentage of high turnover junctions in each morphological category in YAP/TAZ knockdown cells and control. (K, L) Data are mean ±SD of 3 independent experiments. n > 70 patches per knockdown condition per experiment. Fewer then five patches were reticular in YAP/TAZ knockdown, not allowing for reliable assessment of percentages between high, intermediate and low turnover. p values were calculated using unpaired t-test. *p<0.05. (M, N) Fluorescence loss after photoconversion of VE-Cadherin mEos in straight junctions of YAP/TAZ knockdown HUVECs and control HUVECs. M, VE-Cadherin mEos immobile fraction. N, VE-Cadherin mEos half-life of fluorescence loss. Data are mean ±SD of 3 independent experiments. n = 15 control cells and 16 cells YAP/TAZ knockdown cells. p values were calculated using unpaired t-test between knocked down cells for YAP/TAZ and control. **p<0.01. (O, P) HUVECs knocked down for YAP/TAZ (P) and control (O) double stained for VE-Cadherin (red) and f-actin (green, phalloidin). (O’, P’) f-actin (black, phalloidin). Scale bar: 50 μm.
-
Figure 5—source data 1
Values for quantification of morphological (Figure 5F) and junctional turnover (Figure 5K) analysis of VE-Cadherin in HUVECs knocked down for YAP, TAZ and YAP/TAZ.
- https://doi.org/10.7554/eLife.31037.015
Figure 5—video 1
Reticular junctions correspond to junction associated intermediate lamellipodia.
Live imaging of VE-Cadherin-EGFP expressing HUVECs. Reticular junctions were identified as junction associated intermediate lamellipodia from their common outline shape. Thick to reticular junctions correspond to small junction associated intermediate lamellipodia. Scale bar 20 μm.
Figure 6

YAP and TAZ are required for uncoupled, individual cell migration.
(A–H), Phase contrast images of YAP (C,D), TAZ (E,F) and YAP/TAZ (G,H) knockdown HUVECs and control (A,B) immediately after removing barrier to create a cell free space (A,C,E,G) and 16 hr later (B,D,F,H). (I), Quantification of wound closure at 16 hr. Data are mean ±SD of 3 independent experiments (8–9 biological replicates). p values were calculated using unpaired t-test between knocked down cells for YAP, TAZ or YAP/TAZ and control. ****p<0.0001. (J, K), Phase contrast images of YAP/TAZ knockdown monolayer of HUVECs (K) and control (J). (L, M), Fluorescence labelling of nuclei with DAPI of YAP/TAZ knockdown monolayer of HUVECs (M) and control (L). Scale bar: 100 mm. (L’,M’) Longest axis of nuclei. (N) Alignment score between nuclei pairs used for quantification of cell coordination in O. Angles made by the nuclei longest axis of a pair of nuclei were calculated; angles of 0, 45 and 90 degrees scored 1,0 and −1 in alignment. (O) Coordination plot of monolayers of HUVECs knocked down for YAP, TAZ and YAP and TAZ and control. Graph shows mean alignment score of all pairs of cells in the monolayer plotted against distance between them. Randomly aligned cells score 0 in mean alignment. n = 3 independent experiments,>10.000 pairs of nuclei analysed per knockdown condition per experiment.
-
Figure 6—source data 1
Values for quantification of wound closure at 16 hr in YAP, TAZ and YAP/TAZ knockdown HUVECs and control (Figure 6I).
- https://doi.org/10.7554/eLife.31037.018
Figure 7 with 4 supplements
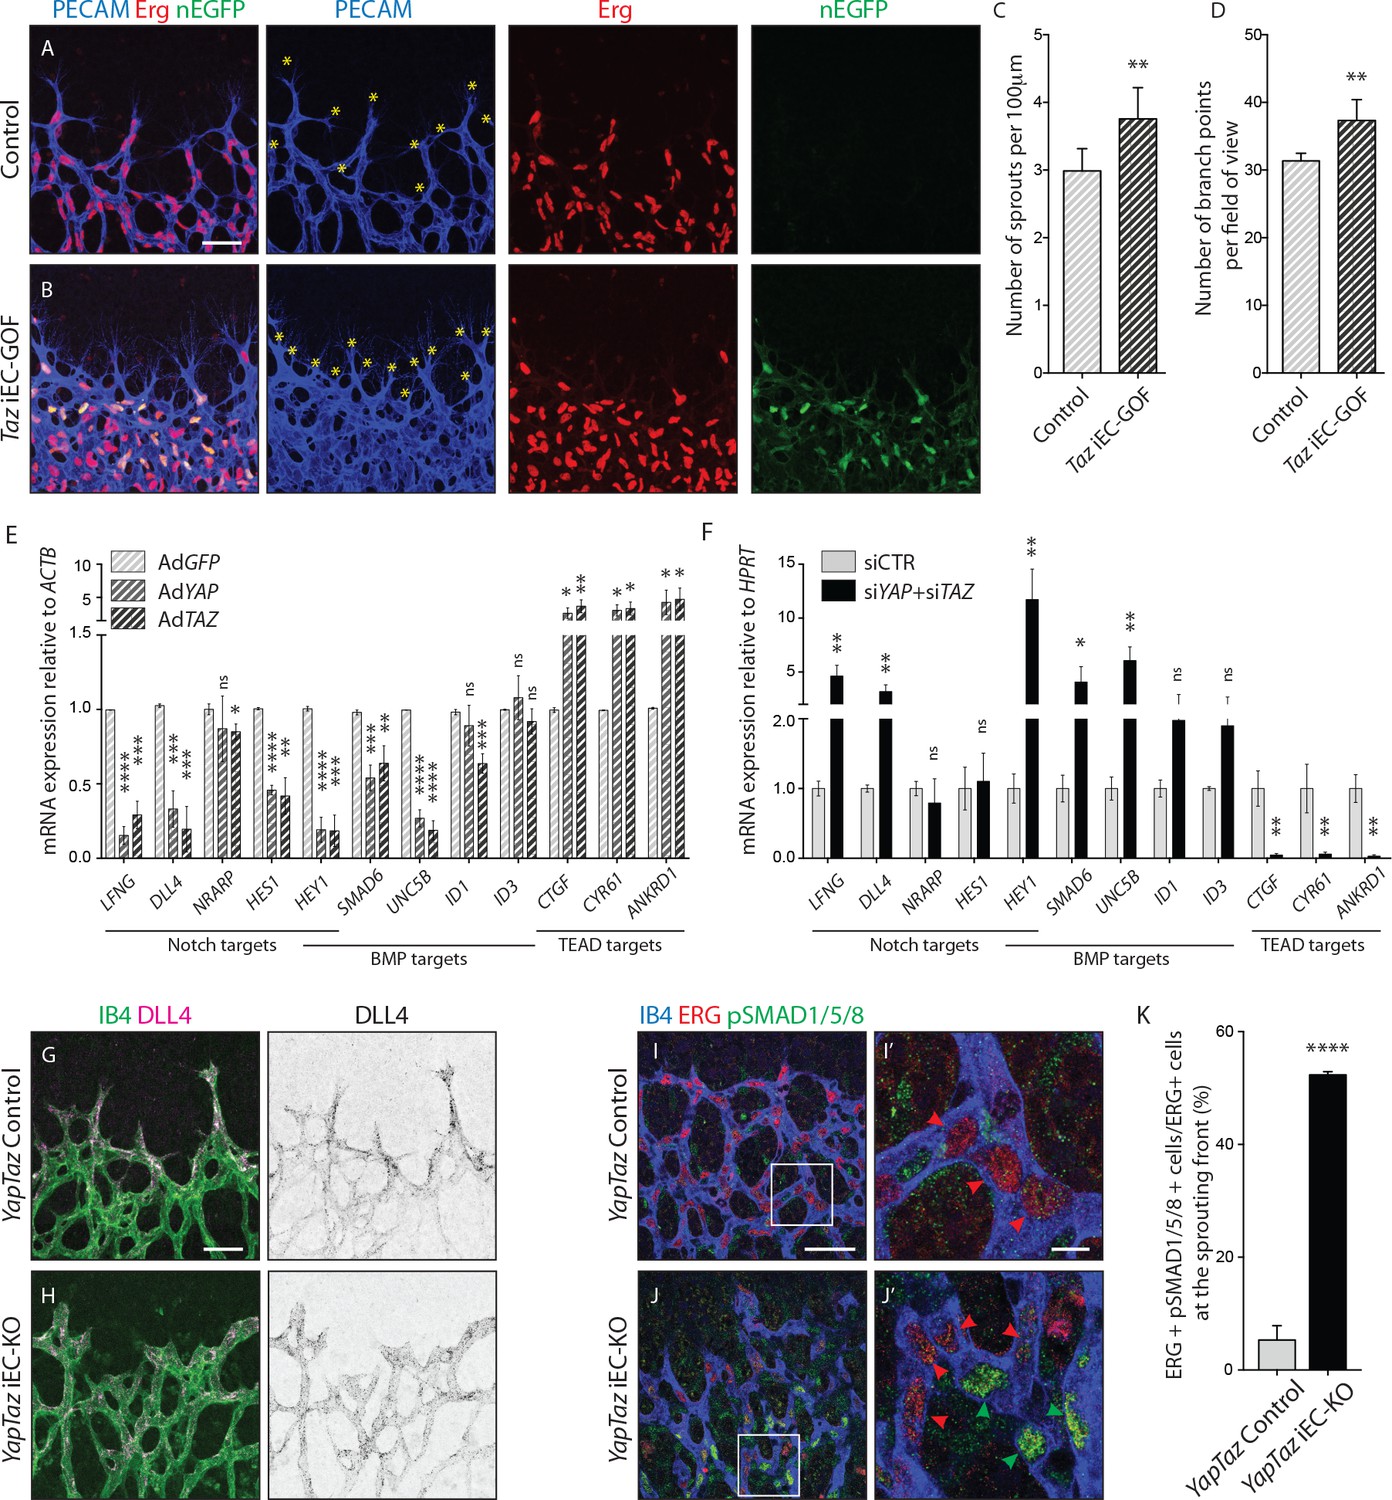
Nuclear YAP and TAZ inhibit Notch and BMP signalling in endothelial cells.
(A–B) Retinas from P6 Taz iEC-GOF (B) and control pups (A) were stained for the endothelial marker PECAM (blue) and the endothelial nuclei marker ERG (red). Taz iEC-GOF mice express mosaically nuclear EGFP (nEGFP, green) marking cells expressing the TAZ gain of function mutation TAZS89A. Yellow asterisks mark sprouts. Images correspond to maximum projection of z stack. Scale bar: 50 μm. (C) Quantification of number of sprouts per 100 μm of sprouting front extension at P6 in Taz iEC-GOF mice (n = 6 pups) and littermate control mice (n = 6 pups). Data are mean ±SD. p values were calculated using unpaired t-test. **p<0.01. (D) Quantification of branching frequency (i.e. number of branching points per field of view) in Taz iEC-GOF mice (n = 6 pups) and littermate control mice (n = 6 pups). Data are mean ±SD. p values were calculated using unpaired t-test. **p<0.01. (E), Reverse transcriptase PCR of HUVECs transduced with adenoviruses carrying YAP (AdYAP) and TAZ (AdTAZ) constitutively active forms and control (AdGFP). Data are mean ±SD of 3 independent experiments. p values were calculated using unpaired t-test between AdGFP and AdYAP or AdTAZ. *p<0.05; **p<0.01; ***p<0.001; ****p<0.0001. (F) Reverse transcriptase PCR of YAP/TAZ knockdown HUVECs and control. Data are mean ±SD of 3 independent experiments. p values were calculated using unpaired t-test. *p<0.05; **p<0.01; ***p<0.001; ****p<0.0001. (G,H), P6 retinal vessels labelled with IB4 (green) and stained for DLL4 (magenta) in YapTaz iEC-KO mice (H) and littermate control mice (G). Images correspond to maximum projection of z stack. Scale bar: 50 μm. (I,J), P6 retinal vessels labelled with IB4 (blue) and stained for ERG (red, marking endothelial nuclei) and pSMAD1/5/8 (green) in YapTaz iEC-KO (J) and littermate control mice (I). Images correspond to single confocal planes. (I’,J’) magnification of boxed areas in I and J. Red arrowheads, endothelial nuclei negative for pSMAD1/5/8. Green arrowheads, endothelial nuclei positive for pSMAD1/5/8. Scale bar: I,J 50 μm, I’, J’ 10 μm. (K) Quantification of endothelial cells positive for pSMAD1/5/8 at the sprouting front of the P6 retina in YapTaz iEC-KO (n = 3 pups) and littermate control mice (n = 3 pups). Data are mean percentage ±SD. p values were calculated using unpaired t-test. ****p<0.0001.
-
Figure 7—source data 1
Values for quantification of number of sprouts (Figure 7C) and branching frequency (Figure 7D) in Taz iEC-GOF mice and controls.
- https://doi.org/10.7554/eLife.31037.024
Figure 7—figure supplement 1

Targeting strategy used for the generation of the conditional TAZ gain-of-function mouse model.
cDNA coding for a 3xFLAG-tagged human TAZ S89A was inserted into a Rosa26 targeting vector downstream of the ubiquitous CAG promoter. The cDNA also included an internal ribosome entry sequence (IRES) and a nuclear-localized enhanced green fluorescence protein (nEGFP) for monitoring transgene expression. To allow Cre-dependent expression of 3xFLAG-TAZS89A and of the EGFP reporter, a floxed transcriptional STOP cassette was incorporated between the 3xFLAG-TAZS89A-IRES-nEGFP sequence and the CAG promoter.
Figure 7—figure supplement 2
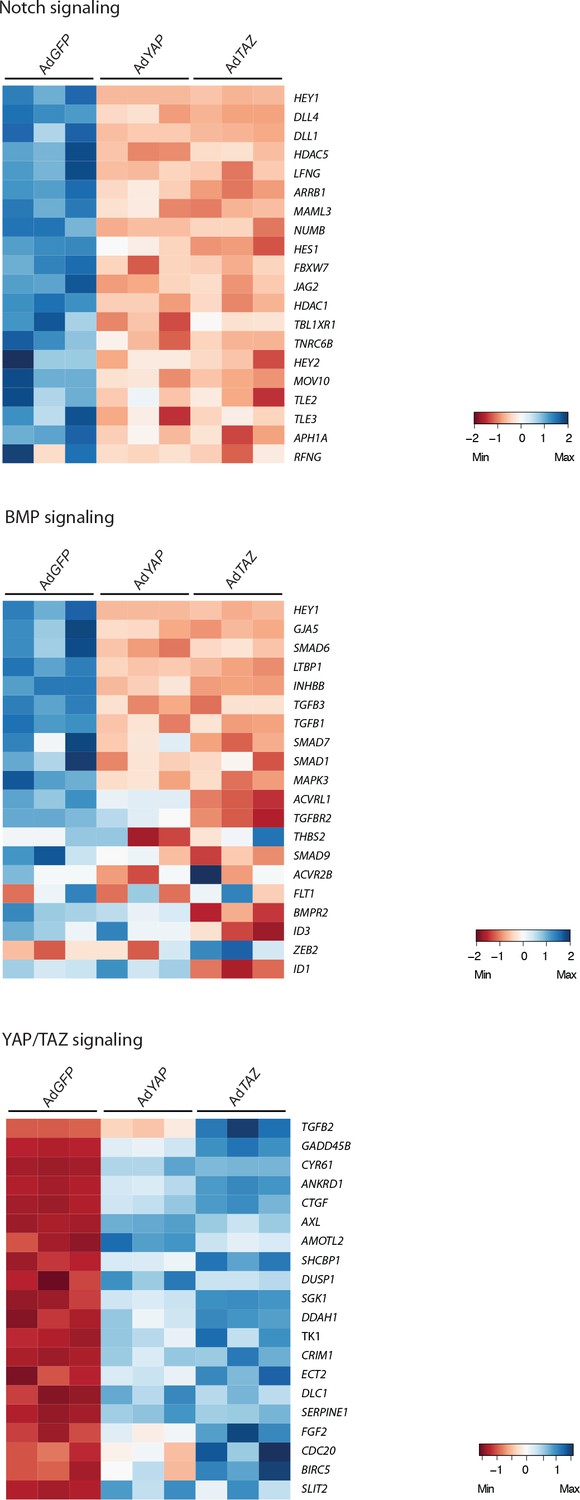
Microarray of YAP and TAZ gain of function mutant cells.
Heatmaps of Notch, BMP and Hippo pathway genes in control (AdGFP), AdYAP and AdTAZ HUVECs.
Figure 7—figure supplement 3
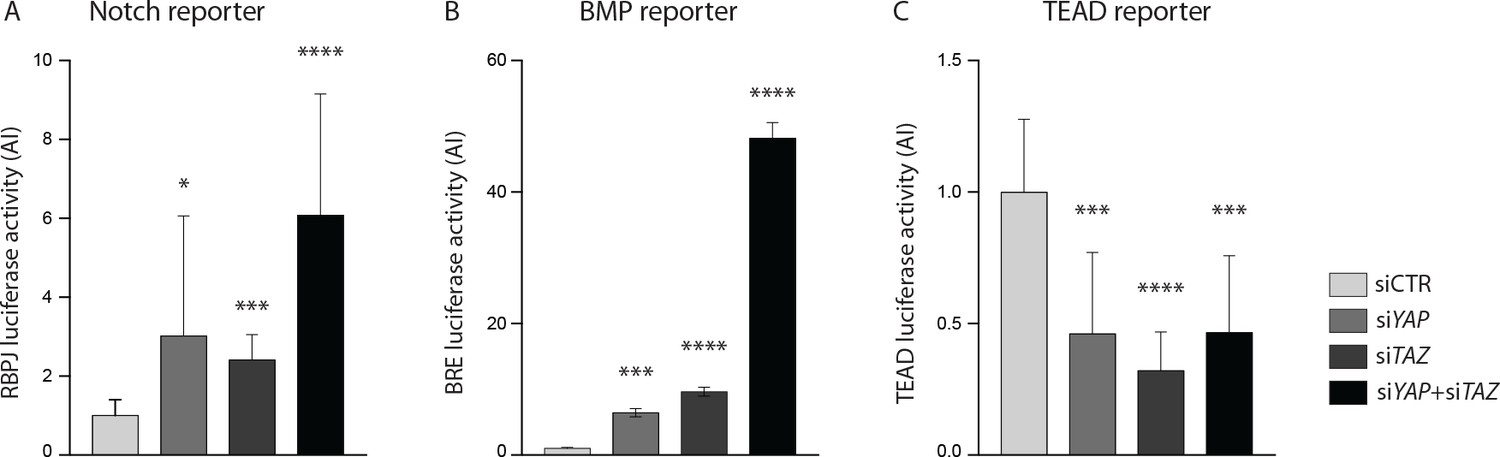
YAP and TAZ knockdown increases Notch and BMP reporter activities in vitro.
(A–C) Luciferase reporter assays in YAP, TAZ and YAP/TAZ knockdown HUVECs and controls for Notch reporter (A), BMP reporter (B) and TEAD reporter (C). Data are mean ±SD. p values were calculated using unpaired t-test. n ≥ 3 experiments for Notch reporter, three experiments for BMP reporter,≥6 experiments for TEAD reporter. *p<0.05; **p<0.01; ***p<0.001; ****p<0.0001.
Figure 7—figure supplement 4

DLL4 intensity in YapTaz iEC-KO.
Graph shows mean DLL4 staining intensity in the vascular retina of control (green) and YapTaz iEC-KO (red) P6 pups normalised to the background intensity. Data are mean ±SEM. n = 3 control and 3 YapTaz iEC-KO.
Figure 8 with 1 supplement
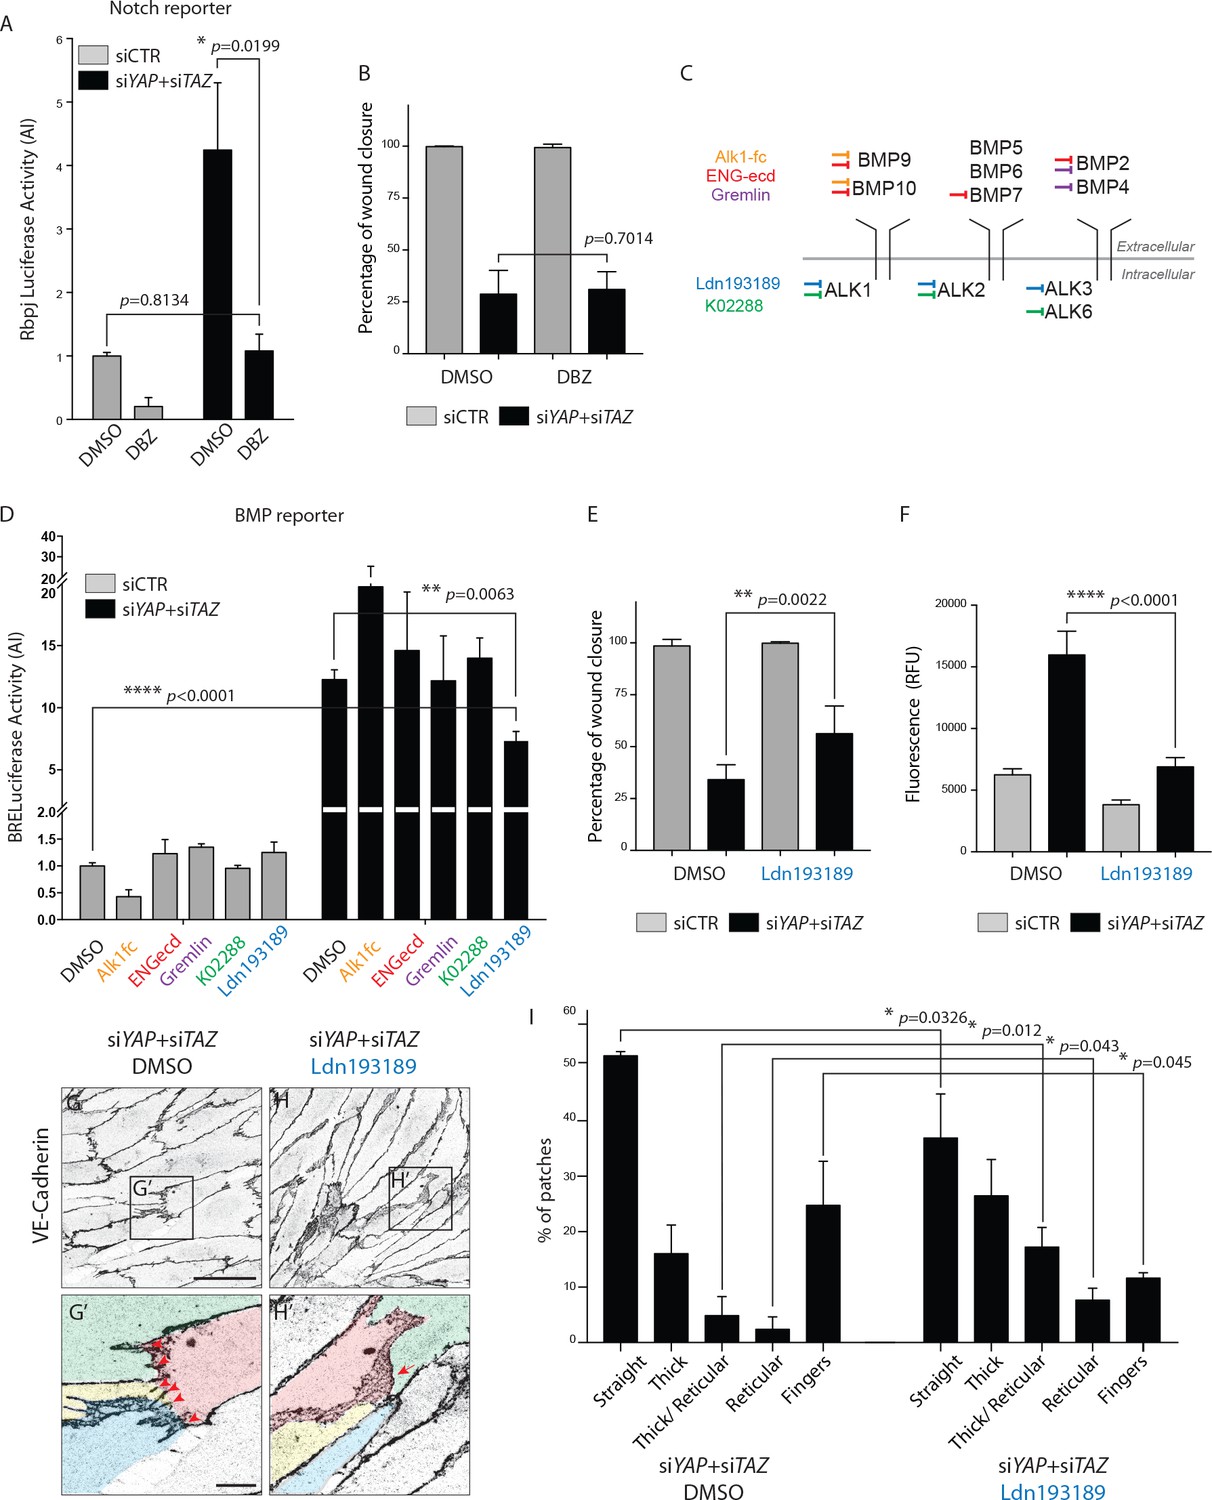
BMP inhibition partially rescues the cellular defects of YAPTAZ knockdown HUVECs.
(A) Luciferase reporter assay for Notch activity in YAP/TAZ knockdown HUVECs and controls treated with 0.1 μM DBZ or DMSO. Data are mean ±SEM. p values were calculated using unpaired t-test. n ≥ 3 biological replicates. (B) Quantification of wound closure at 16 hr for HUVECs knocked down for YAP/TAZ and treated with 0.1 μM DBZ or DMSO. Data are mean ±SD. p values were calculated using unpaired t-test. n = 6 biological replicates. (C) Schematic of the BMP inhibitors used depicting preferential sites of inhibition. Alk1fc, ENGecd and Gremlin preferentially bind extracellular BMPs. K02288 and Ldn193189 are kinase inhibitors. (D) Luciferase reporter assay for BMP activity in YAP/TAZ knockdown HUVECs and controls treated with 25 ng/mL Alk1fc, 0.25 μg/mL ENGecd, 0.1 μg/mL Gremlin, 1 μM K02288, 1 μM Ldn193189 and DMSO. Data are mean ±SEM. p values were calculated using unpaired t-test. n ≥ 3 biological replicates. (E) Quantification of wound closure at 16 hr for HUVECs knocked down for YAP/TAZ and treated with 1 μM Ldn193189 or DMSO. Data are mean ±SD. p values were calculated using unpaired t-test. n = 6–7 biological replicates. (F) Permeability of HUVECs knocked down for YAP/TAZ and treated with 1 μM Ldn193189 or DMSO to 250 kDa fluorescent dextran molecules. Data are mean ±SD. RFU, relative fluorescence units. p values were calculated using unpaired t-test. n = 6 biological replicates. (G, H) HUVECs knocked down for YAP/TAZ and treated with 1 μM Ldn193189 (H) or DMSO (G) stained for VE-Cadherin. (G’, H’) different colours mark different cells. Red arrowheads, fingers. Red arrow, reticular junction. Scale bar G, H, 50 μm. Scale bar G’, H’, 10 μm. (I) Morphological analysis of VE-Cadherin labelled cell junctions in HUVECs knocked down for YAP/TAZ and treated with 1 μM Ldn193189 or DMSO control. Data are mean ±SD. p values were calculated using unpaired t-test. n = 3 biological replicates; n ≥ 45 patches of VE-Cadherin stained HUVECs per condition per replicate.
-
Figure 8—source data 1
Values of luciferase reporter assays for Notch (Figure 8A) and BMP (Figure 8D) activity in YAP/TAZ knockdown HUVECs and controls treated with Notch or BMP inhibitors.
Values for quantification of wound closure at 16 hr in YAP/TAZ knockdown HUVECs treated with Notch (Figure 8B) and BMP (Figure 8E) inhibitors. Values for quantification of permeability of YAP/TAZ knockdown HUVECs treated with 1 μM Ldn193189 (Figure 8F). Values for quantification of morphological analysis of VE-Cadherin in YAP/TAZ knockdown HUVECs treated with 1 μM Ldn193189 (Figure 8I).
- https://doi.org/10.7554/eLife.31037.027
Figure 8—figure supplement 1
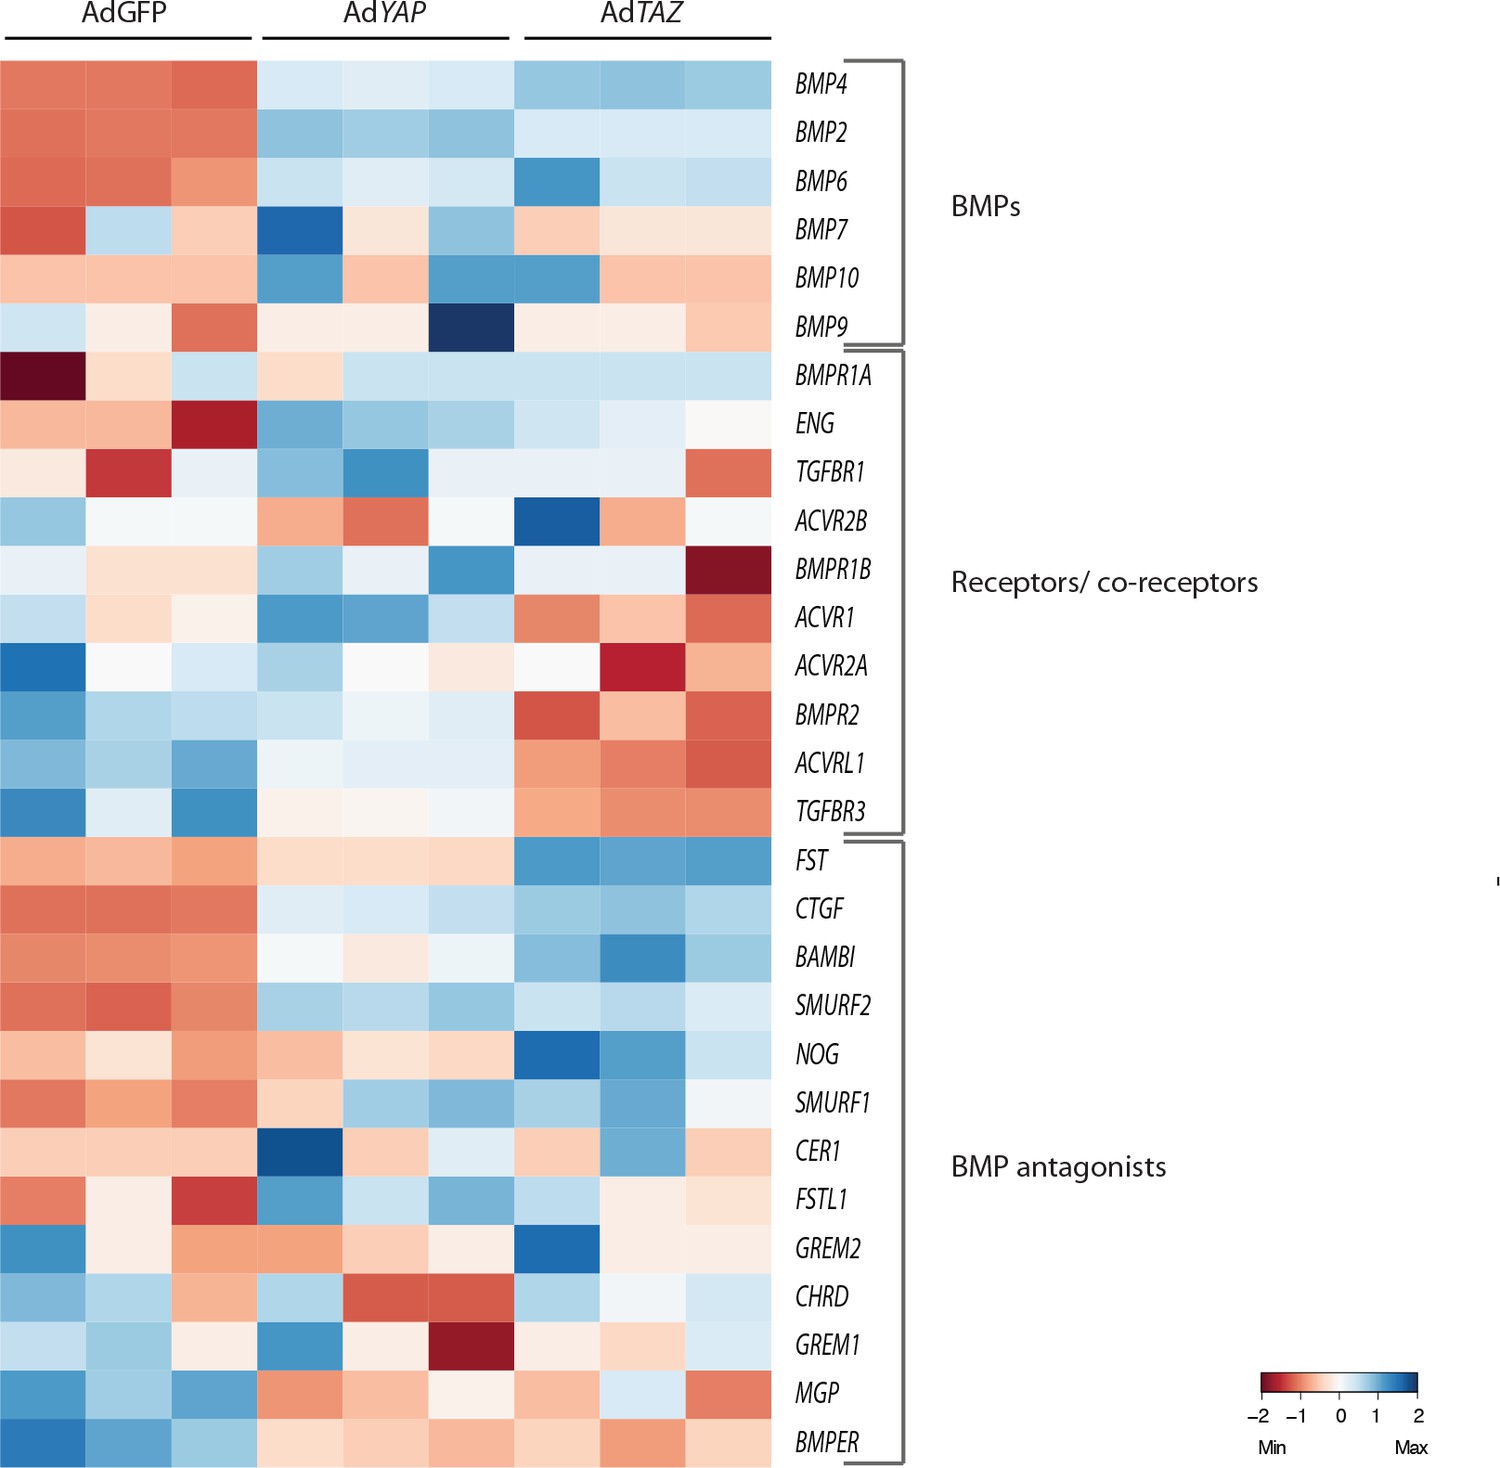
Nuclear YAP and TAZ increase the expression of BMP inhibitors.
Heatmap of BMPs, BMP receptors and co-receptors and BMP inhibitors genes in control (AdGFP), AdYAP and AdTAZ gain of function mutant cells.
Author response image 1
VEGF treatment does not affect YAP and TAZ subcellular localisation.
Confluent HUVECs were starved in FBS free media (EBM2 0.1% BSA) and treated with 40ng/mL of VEGF for 30 min (B, F), 1h (C,G) and 3h (D, H) or control (A, E) and stained for YAP (A-D) or TAZ (E-H) and DAPI (not shown). I,J, Quantification of nuclear to cytoplasmic ratio of YAP (I) or TAZ (J) with VEGF treatment. Nuclear/cytoplasmic ratio > 1, YAP/TAZ nuclear; nuclear/cytoplasmic < 1, YAP/TAZ cytoplasmic. At least 200 cells quantified.
Author response image 2
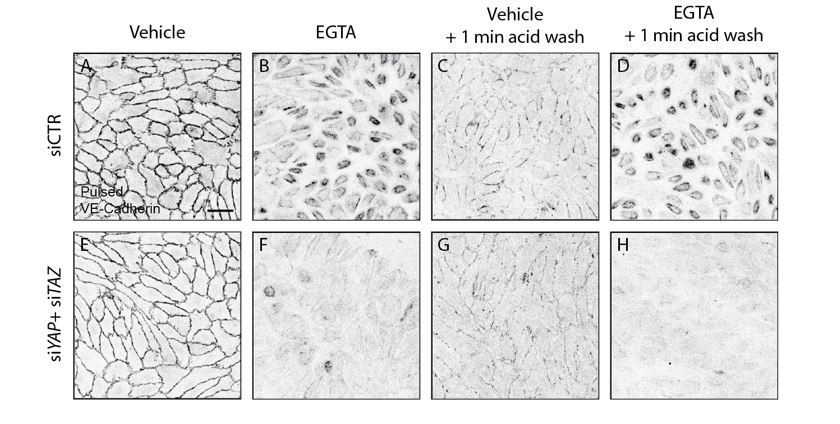
Acid wash treatment removes cell surface bound antibody.
HUVECs knocked down for YAP/TAZ (E-H) and control (A-D) were pulse labelled with VE-cadherin 55/7H1 for 30 mins at 4C and internalisation was allowed for 30 min at 37C in the presence of 5mM EGTA (B, D, F, H) or vehicle (A, C, E, G). Acid wash treatment (C, D, G, H) removes cell surface antibody revealing internalised VE-cadherin 55/7H1. Scale bar 50μm.
Author response image 3
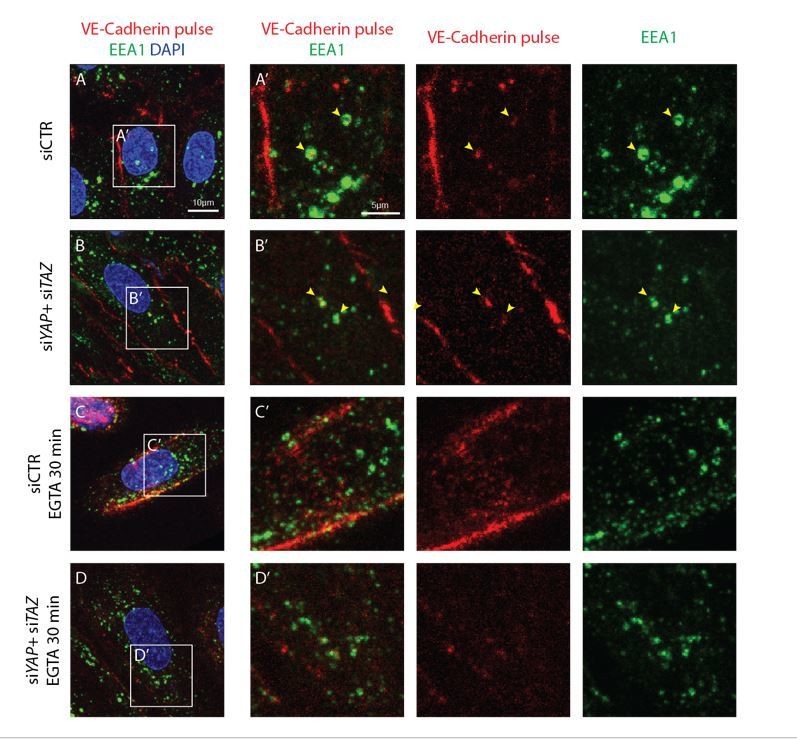
Internalised VE-cadherin 55/7H1 co-localises with EEA1 in normal conditions, but not after disruption of cell junctions by calcium depletion.
HUVECs knocked down for YAP/TAZ (B, D) and control (A, C) were pulse labelled with VE-cadherin 55/7H1-A647 (red) for 30 min at 4C and internalisation was allowed for 30 min at 37C in the presence of 5mM EGTA (C, D) or vehicle (A, B). Acid wash treatment was performed prior to fixing cells. Cells were co-stained with the early endosome marker EEA1 (green) and nuclei marker DAPI (blue). Yellow arrowheads, co-localisation of VE-cadherin 55/7H1-A647 with EEA1. Scale bar A-D, 10μm, A’-D’, 5μm.
Author response image 4
Tables
Key resources table
| Reagent type (species) or resource | Designation | Source or reference | Identifiers | Additional information |
|---|---|---|---|---|
| strain, strain background (Mus musculus, C57BL/6J) | WT | The Jackson laboratories | ||
| genetic reagent (Mus musculus) | Yap iEC-KO, Yapfl/fl Pdgfb-iCreERT2 | PMID: 27215660, PMID: 18257043 | ||
| genetic reagent (Mus musculus) | Taz iEC-KO, Tazfl/fl Pdgfb-iCreERT2 | PMID: 27215660, PMID: 18257043 | ||
| genetic reagent (Mus musculus) | YapTaz iEC-KO, Yapfl/fl Tazfl/fl Pdgfb-iCreERT2 | PMID: 27215660, PMID: 18257043 | ||
| genetic reagent (Mus musculus) | Taz iEC-GOF, TAZ S89A EGFP Pdgfb-iCreERT2 | This paper | Cloning information in Material and methods and Figure 7—figure supplement 1 | |
| cell line (human) | HUVEC | PromoCell and Lonza | ||
| transfected construct (human) | VE-Cadherin EGFP | PMID: 24658686 | ||
| transfected construct (human) | VE-Cadherin mEos3.2 | This paper | Cloning information in Material and methods | |
| transfected construct (human) | pCMV-flag S127A YAP | Addgene, plasmid 27370 | ||
| transfected construct (human) | 3xFLAG-pCMV5-TOPO TAZ(S89A) | Addgene, plasmid 24815 | ||
| transfected construct (human) | TEF-1 Luciferase reporter (GTIIC) | PMID: 15628970 | ||
| transfected construct (murine) | RBPj Luciferase reporter | PMID: 7566092 | ||
| transfected construct (murine) | BRE Luciferase reporter | PMID: 11729207 | ||
| transfected construct (human) | FOPflash Luciferase reporter | PMID: 9065401 | ||
| transfected construct (Renilla) | Renilla Luciferase control reporter | Promega, E2241 | ||
| antibody | Yap (rabbit polyclonal) | ThermoFisher Scientific, PA1-461894 | Dilution 1:100 | |
| antibody | Taz (rabbit polyclonal) | Sigma, HPA007415 | Dilution 1:100 | |
| antibody | Erg (goat polyclonal) | Santa Cruz Biotechnology, sc-18136 | Dilution 1:100 | |
| antibody | Erg (rabbit monoclonal) | Abcam, Ab92513 | Dilution 1:1000 | |
| antibody | VE-Cadherin (rat monoclonal) | BD Biosciences, 555289 | Dilution 1:100 | |
| antibody | VE-Cadherin (goat polyclonal) | Santa Cruz Biotechnology, sc-6458 | Dilution 1:100 | |
| antibody | VE-Cadherin 55–7 H1 - Alexa-Fluor 647 Conjugate | BD Biosciences, 561567 | Dilution 1:200 | |
| antibody | TER-119 (rat monoclonal) | R and D Systems, MAB1125 | Dilution 1:100 | |
| antibody | PECAM-1 (goat polyclonal) | R and D Systems, AF3628 | Dilution 1:200 | |
| antibody | Cleaved caspase 3 (rabbit polyclonal) | R and D Systems, AF835 | Dilution 1:200 | |
| antibody | Dll4 (goat polyclonal) | R and D Systems, AF1389 | Dilution 1:100 | |
| antibody | pSMAD1/5/8 (rabbit monoclonal) | Cell Signalling, 13820S | Dilution 1:1000 | |
| antibody | Phalloidin- Alexa-Fluor 488 | ThermoFisher Scientific, A12379 | Dilution 1:100 | |
| antibody | Ib4-Alexa-Fluor 647 Conjugate | ThermoFisher Scientific, I32450 | Dilution 1:1000 | |
| antibody | Ib4-Alexa-Fluor 488 Conjugate | ThermoFisher Scientific, I21411 | Dilution 1:1000 | |
| antibody | Ib4-Alexa-Fluor 568 Conjugate | ThermoFisher Scientific, I21412 | Dilution 1:1000 | |
| antibody | YAP 63.7 (mouse monoclonal) | Santa Cruz Biotechnology, sc-101199 | Dilution 1:1000 | |
| antibody | GAPDH (mouse monoclonal) | Millipore, MAB374 | Dilution 1:4000 | |
| sequence-based reagent | SMART pool: siGENOME siRNA YAP | Dharmacon, M-012200-00-0005 | ||
| sequence-based reagent | SMART pool: siGENOME siRNA TAZ | Dharmacon, M-016083-00-0005 | ||
| sequence-based reagent | SMART pool: siGENOME siRNA VE-Cadherin | Dharmacon, M-003641-01-0005 | ||
| sequence-based reagent | SMART pool: siGENOME siRNA Non targeting 1 | Dharmacon, D001206-13-05 | ||
| sequence-based reagent | Taqman probes for RT-qPCR | Taqman | Supplementary file 3 | |
| commercial assay or kit | Permeability assay - Transwell membranes | Costar, 3460 | ||
| commercial assay or kit | Scratch wound assay - Culture-Insert 2 Well in µ-Dish 35 mm | Ibidi, 81176 | ||
| commercial assay or kit | Click-iT EdU Alexa Fluor 647 Imaging Kit | ThermoFisher Scientific, C10340 | ||
| commercial assay or kit | Propidium Iodide (PI)/ RNase Staining Solution | Cell Signalling, 4087 | ||
| commercial assay or kit | Rneasy Mini Kit | Quiagen, 74104 | ||
| commercial assay or kit | M-MLV reverse transcriptase | ThermoFisher Scientific, 28025013 | ||
| commercial assay or kit | RevertAid First Strand cDNA Synthesis Kit | ThermoFisher Scientific, K1621 | ||
| commercial assay or kit | Agilent RNA 6000 Nano Kit | Agilent, 5067–1511 | ||
| commercial assay or kit | GeneChip Human Gene 2.0 ST Array | ThermoFisher Scientific, 902113 | ||
| chemical compound, drug | 250 kDa FITC Dextran | Sigma, FD250 | ||
| chemical compound, drug | Lipofectamine 2000 | ThermoFisher Scientific, 11668019 | ||
| chemical compound, drug | Dharmafect 1 transfection reagent | Dharmacon, T-2001 | ||
| chemical compound, drug | Polybrene | Santa Cruz, sc-134220 | ||
| chemical compound, drug | Hydroxytamoxifen | Sigma, 7904 | ||
| chemical compound, drug | DBZ | Cayman chemicals 14627 | ||
| chemical compound, drug | Recombinant-hGremlin | R and D Systems, 5190-GR | ||
| chemical compound, drug | Recombinant-hEndoglin | R and D Systems, 1097-EN | ||
| chemical compound, drug | LDN-193189 | Cayman chemicals, 19396 | ||
| chemical compound, drug | K02288 | Cayman chemicals, 16678 | ||
| chemical compound, drug | Recombinant hAlk1fc | R and D Systems, 370-AL-100 | ||
| chemical compound, drug | VEGF-165 (murine) | Prepotech, 450–32 | ||
| software, algorithm | FIJI | FIJI | ||
| software, algorithm | Cytoplasm to nucleus translocation assay | Cell Profiler, adapted from PMID: 17076895 | ||
| software, algorithm | Mouse retina regularity script | This paper | Source code 1 | |
| software, algorithm | VE-Cadherin turnover analysis script | This paper | Source code 2 | |
| software, algorithm | Patching script | This paper | Source code 3 | |
| software, algorithm | Cell coordination analysis script | This paper | Source code 4 | |
| software, algorithm | Dll4 gradient analysis script | This paper | Source code 5 |
Additional files
-
Source code 1
Mouse retina regularity script.
Determines the regularity of the gaps in the mouse retina vasculature Used in Figure 2r,K,L. Written in Python.
- https://doi.org/10.7554/eLife.31037.028
-
Source code 2
VE-Cadherin turnover analysis script.
Used in Figure 5K,L. Written in Python.
- https://doi.org/10.7554/eLife.31037.029
-
Source code 3
Patching script.
Used in Figure 5F,K,L and Figure 8I. Written in Python.
- https://doi.org/10.7554/eLife.31037.030
-
Source code 4
Cell coordination analysis script.
Segments images of DAPI stained cell nuclei in a confluent monolayer and assesses the alignment between cells as a function of their distance. Used in Figure 6N,O. Written in Python.
- https://doi.org/10.7554/eLife.31037.031
-
Source code 5
Dll4 gradient analysis script.
Analyses Dll4 intensity in the mouse retina as a function of the distance to the sprouting front. Used in Figure 7—figure supplement 4. Written in Python.
- https://doi.org/10.7554/eLife.31037.032
-
Supplementary file 1
List of reagents used to manipulate Notch and BMP signaling in cell culture.
- https://doi.org/10.7554/eLife.31037.033
-
Supplementary file 2
List of primary antibodies and dyes used.
- https://doi.org/10.7554/eLife.31037.034
-
Supplementary file 3
List of the TaqMan primers (Applied Biosystems) used.
- https://doi.org/10.7554/eLife.31037.035
-
Transparent reporting form
- https://doi.org/10.7554/eLife.31037.036
Download links
A two-part list of links to download the article, or parts of the article, in various formats.
Downloads (link to download the article as PDF)
Open citations (links to open the citations from this article in various online reference manager services)
Cite this article (links to download the citations from this article in formats compatible with various reference manager tools)
YAP and TAZ regulate adherens junction dynamics and endothelial cell distribution during vascular development
eLife 7:e31037.
https://doi.org/10.7554/eLife.31037


