Anti-diabetic drug binding site in a mammalian KATP channel revealed by Cryo-EM
- Oregon Health and Science University, United States
- University of Washington, United States
Figures
Figure 1 with 2 supplements
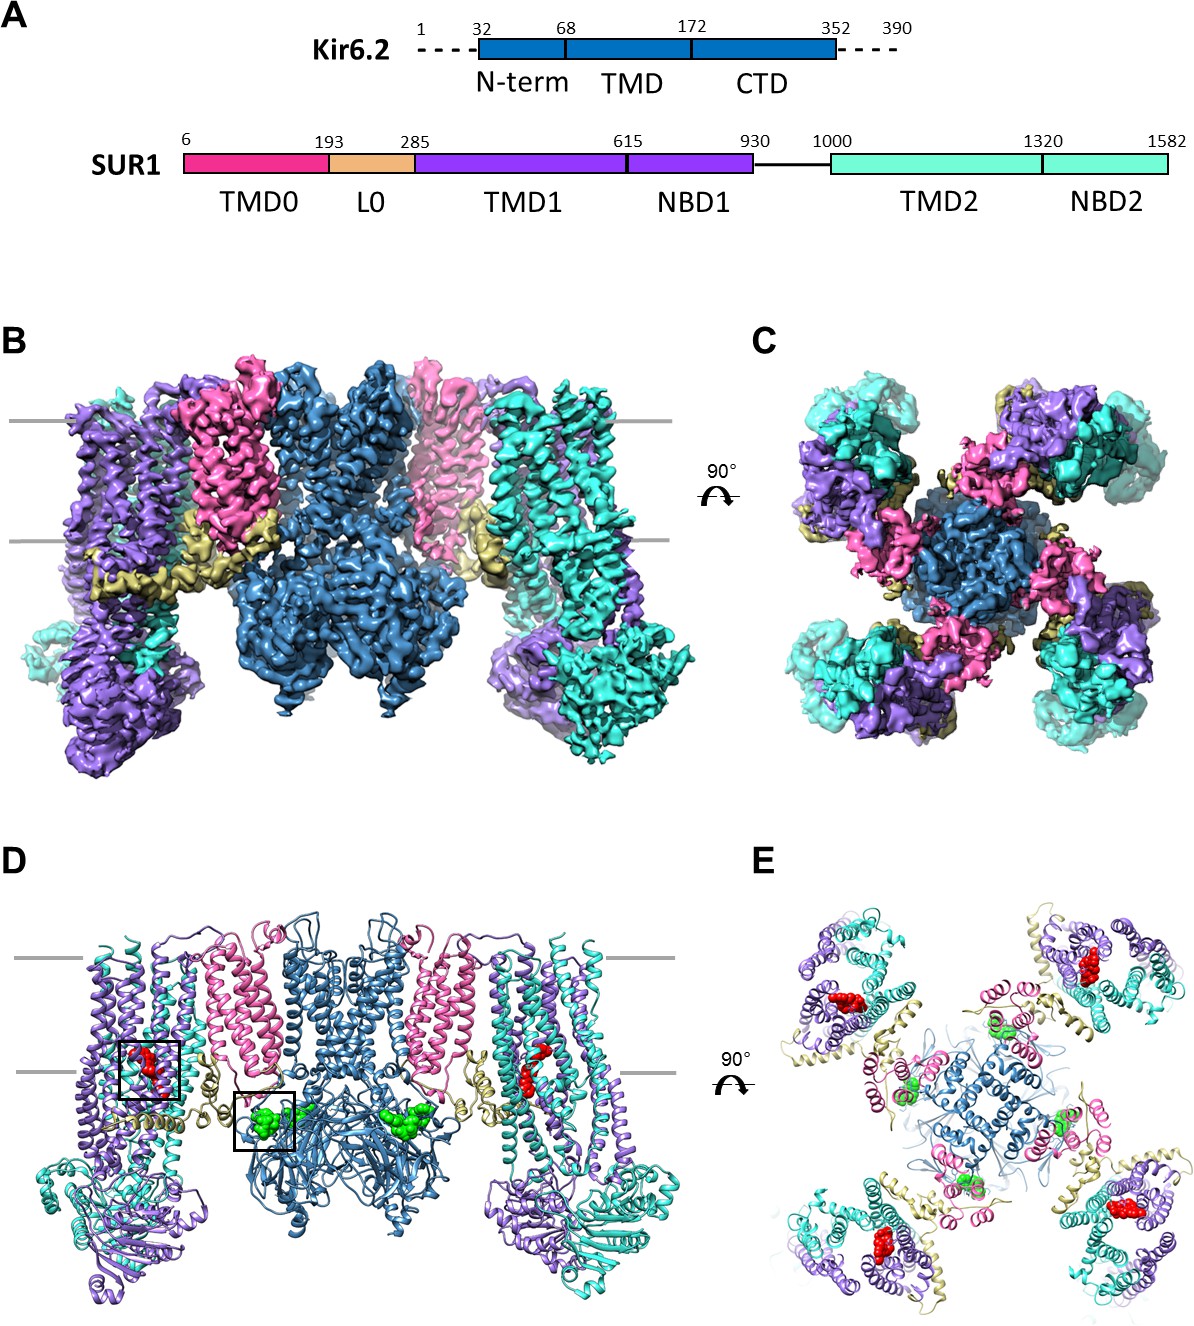
Overall structure of the KATP channel bound to ATP and GBC.
(A) Linear sequence diagram for the Kir6.2 and SUR1 polypeptides, with primary domains colored to match the panels below. Numbers indicate residue number at the beginning and end of each domain. (B) Cryo-EM density map of the KATP channel complex at 3.63 Å resolution, viewed from the side. Gray bars indicate approximate position of the bilayer. (C) View of map from extracellular side. (D). Structural model of the complex, with ligands ATP (green) and GBC (red) in boxes. (E) View of the model from the extracellular side.
Figure 1—figure supplement 1
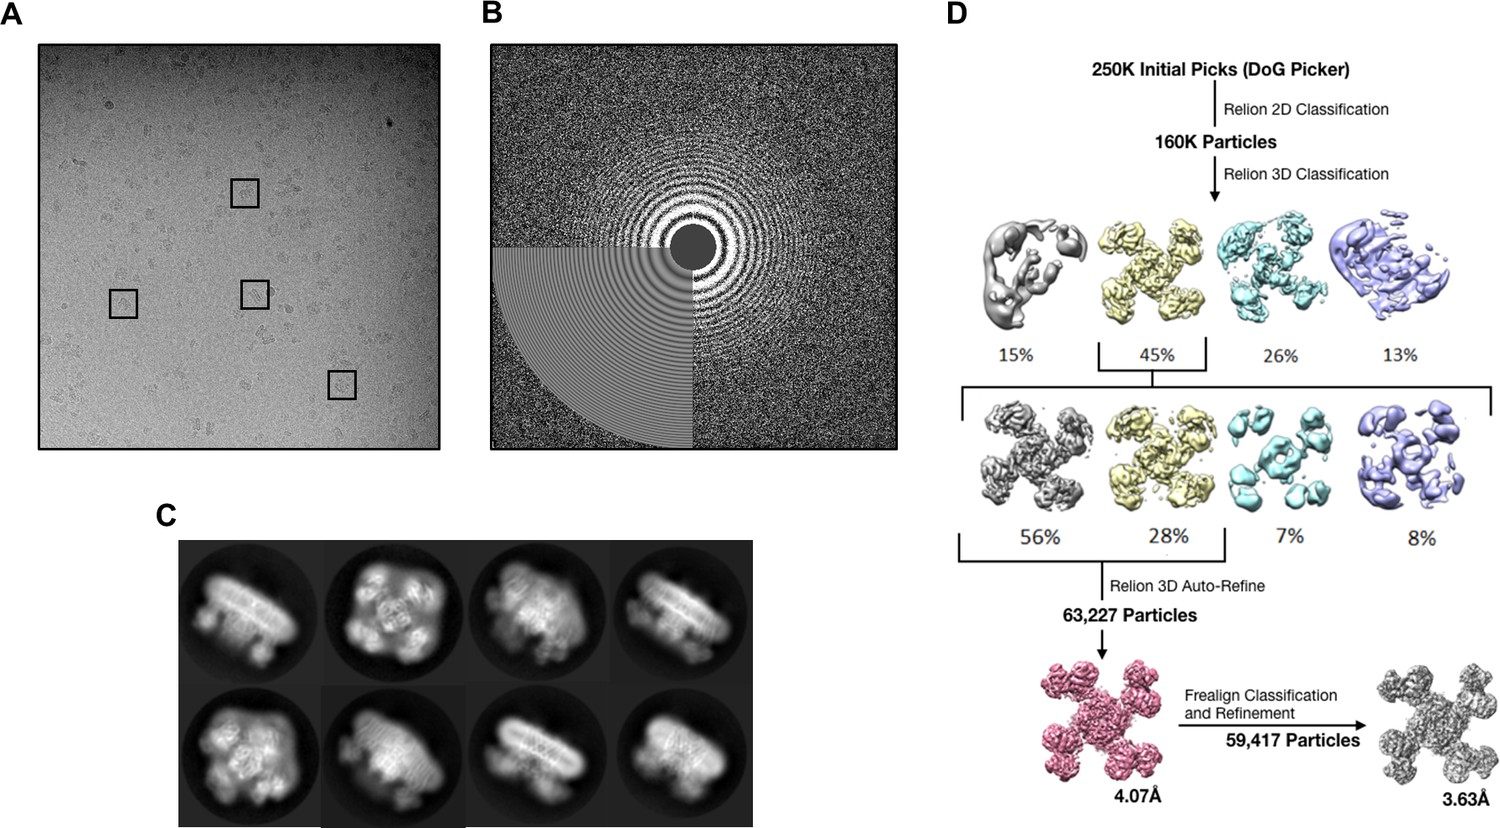
Data collection and image processing workflow.
(A) Representative micrograph at 81,000x (1.72 Å/pixel; 0.86 Å/pixel super-resolution) after alignment with Motioncor2. A few KATP channel complexes of various orientation have been outlined. (B) Power spectrum calculated with Ctffind4, with information extending out to 3.6 Å. (C) Select 2D classes from the final round of classification. (D) Overview of the data processing workflow. Particle picking was performed automatically with DoGPicker as well as with manual inspection. All other image processing steps were performed in Relion-2 and Frealign.
Figure 1—figure supplement 2
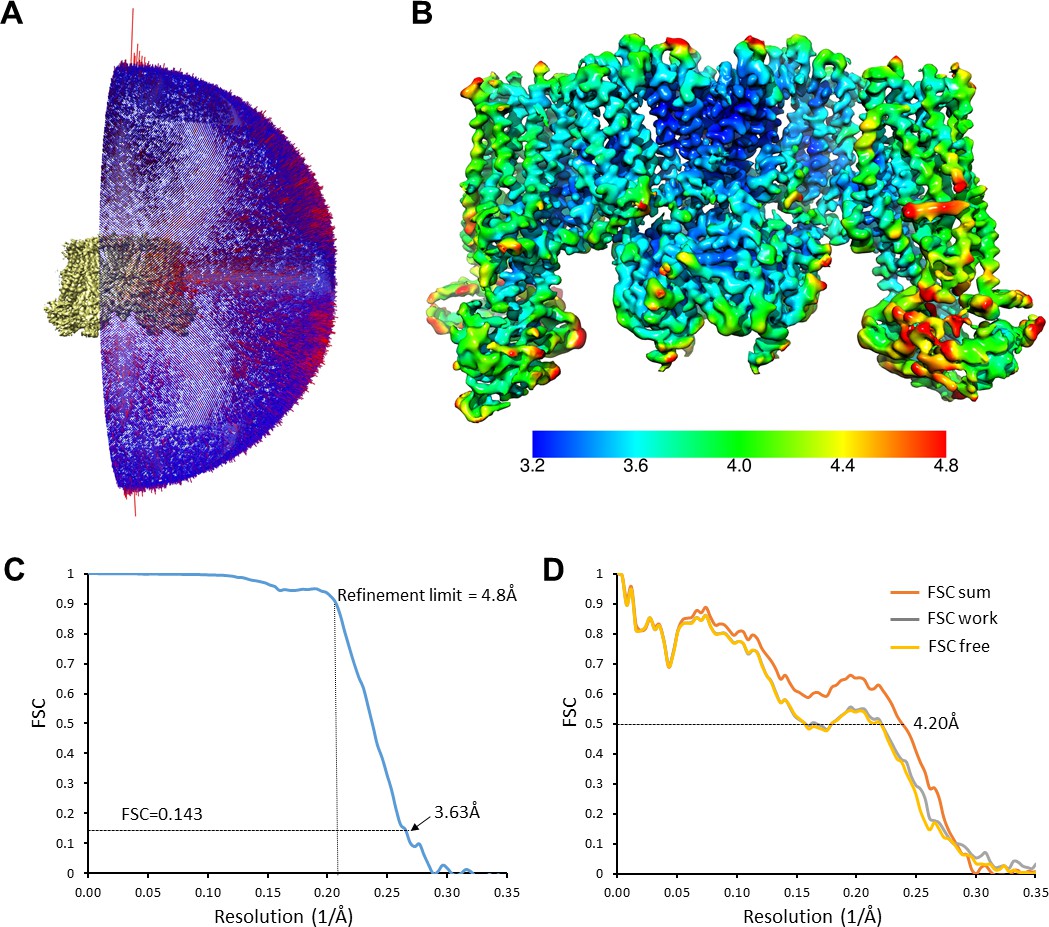
Cryo-EM density map analysis.
(A) Euler angle distribution plot of all particles included in the calculation of the final map. (B) The EM density map with colored local resolution estimation using Bsoft. (C) Fourier shell coefficient (FSC) curves between two half-datasets calculated by Frealign. The refinement limit of 4.8 Å used in Frealign is indicated by the vertical dotted line. (D) FSC curves between the refined structure and the map calculated from the full dataset (FSC sum, orange), the half-map used in refinement (FSC work, grey), and the other half-map (FSC free, gold).
Figure 2 with 2 supplements
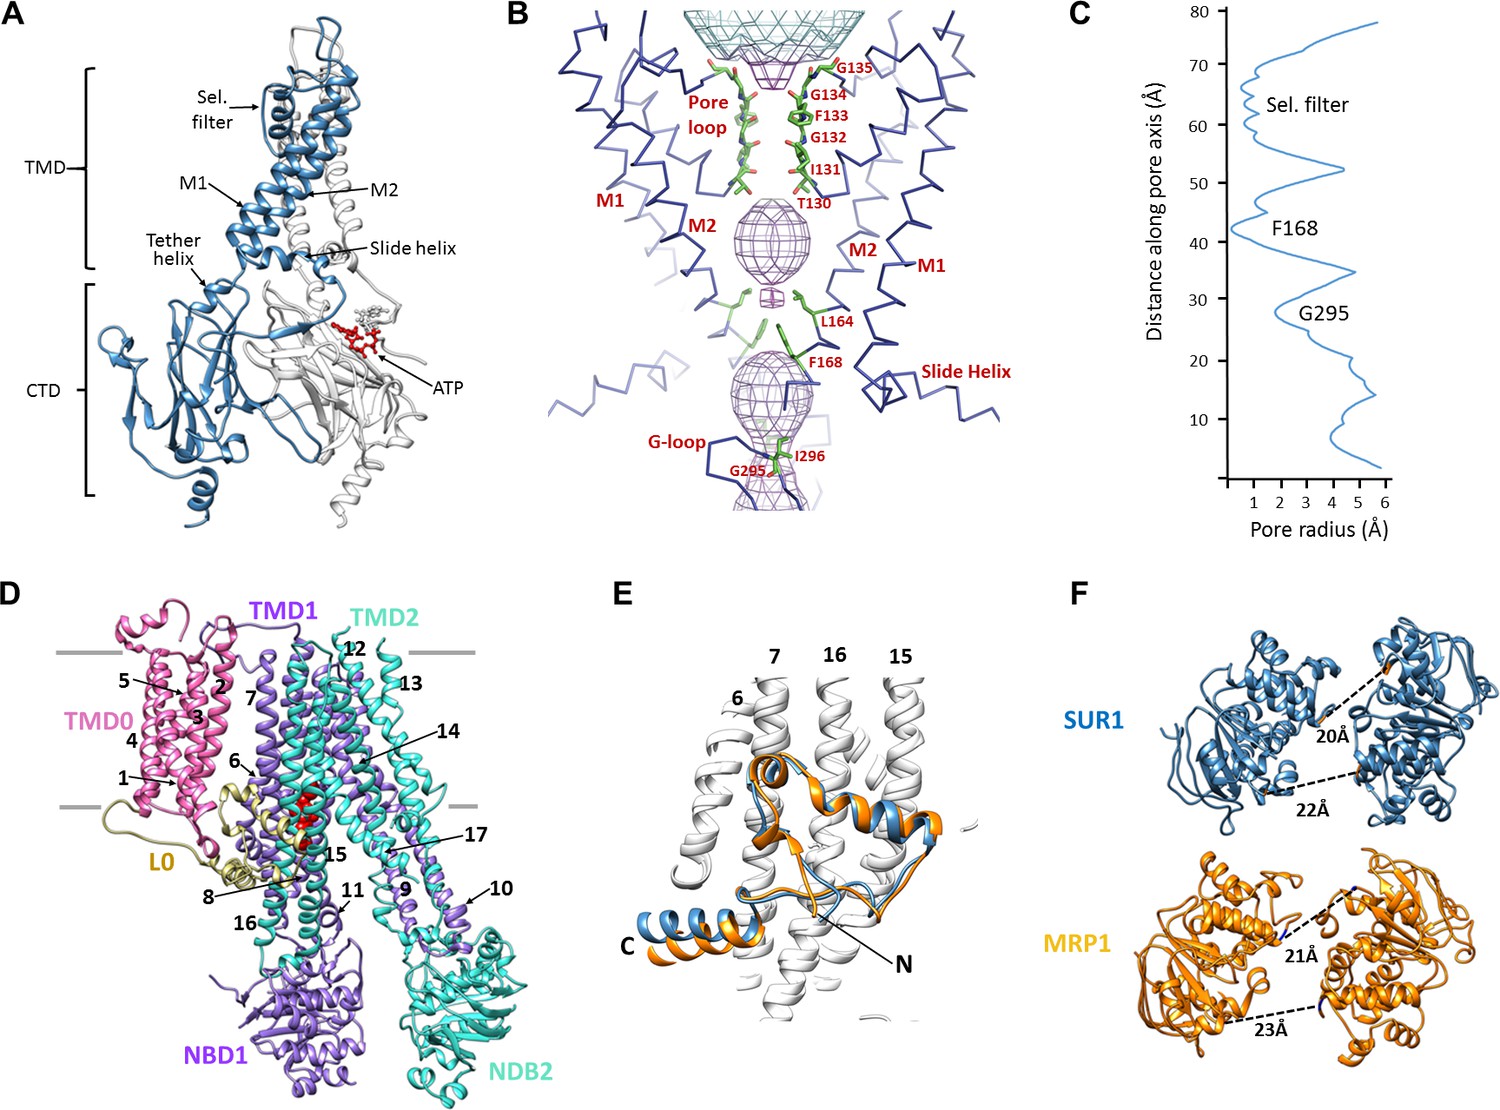
Structural highlights of Kir6.2 and SUR1.
(A) Two subunits of the Kir6.2 tetramer, one colored in blue and one in white, highlighting the conserved Kir channel structural features. Note the ATP-binding site is at the interface of the cytoplasmic N- and C-terminal domains of adjacent subunits. (B) Close-up of the Kir6.2 pore, showing solvent-accessible volume as a mesh. The two primary gates are 1) the helix bundle-crossing (HBC), formed by the confluence of the M2 helices at F168; 2) the G-loop, formed at the apex of the CTD by G295 and I296. (C) Plot of pore radius as a function of length along pore axis. (D) Structure of SUR1 in inward-facing conformation, indicating overall domain organization. Note clear separation of NBDs. Transmembrane helices 1–17 are numbered. (E) Structural conservation of L0 with the lasso domain observed in MRP1. Full structures of SUR1 (blue) and leukotriene C4-bound MRP1 (orange) minus TMD0 were used for structural alignment. (F) Separation (Cα to Cα, indicated by the dashed line) between Walker A and signature motif in NBD1 (left) and NBD2 (right) (G716::S1483 and S831::G1382 in SUR1, G681::S1430 and S769::G1329 in MRP1).
Figure 2—figure supplement 1
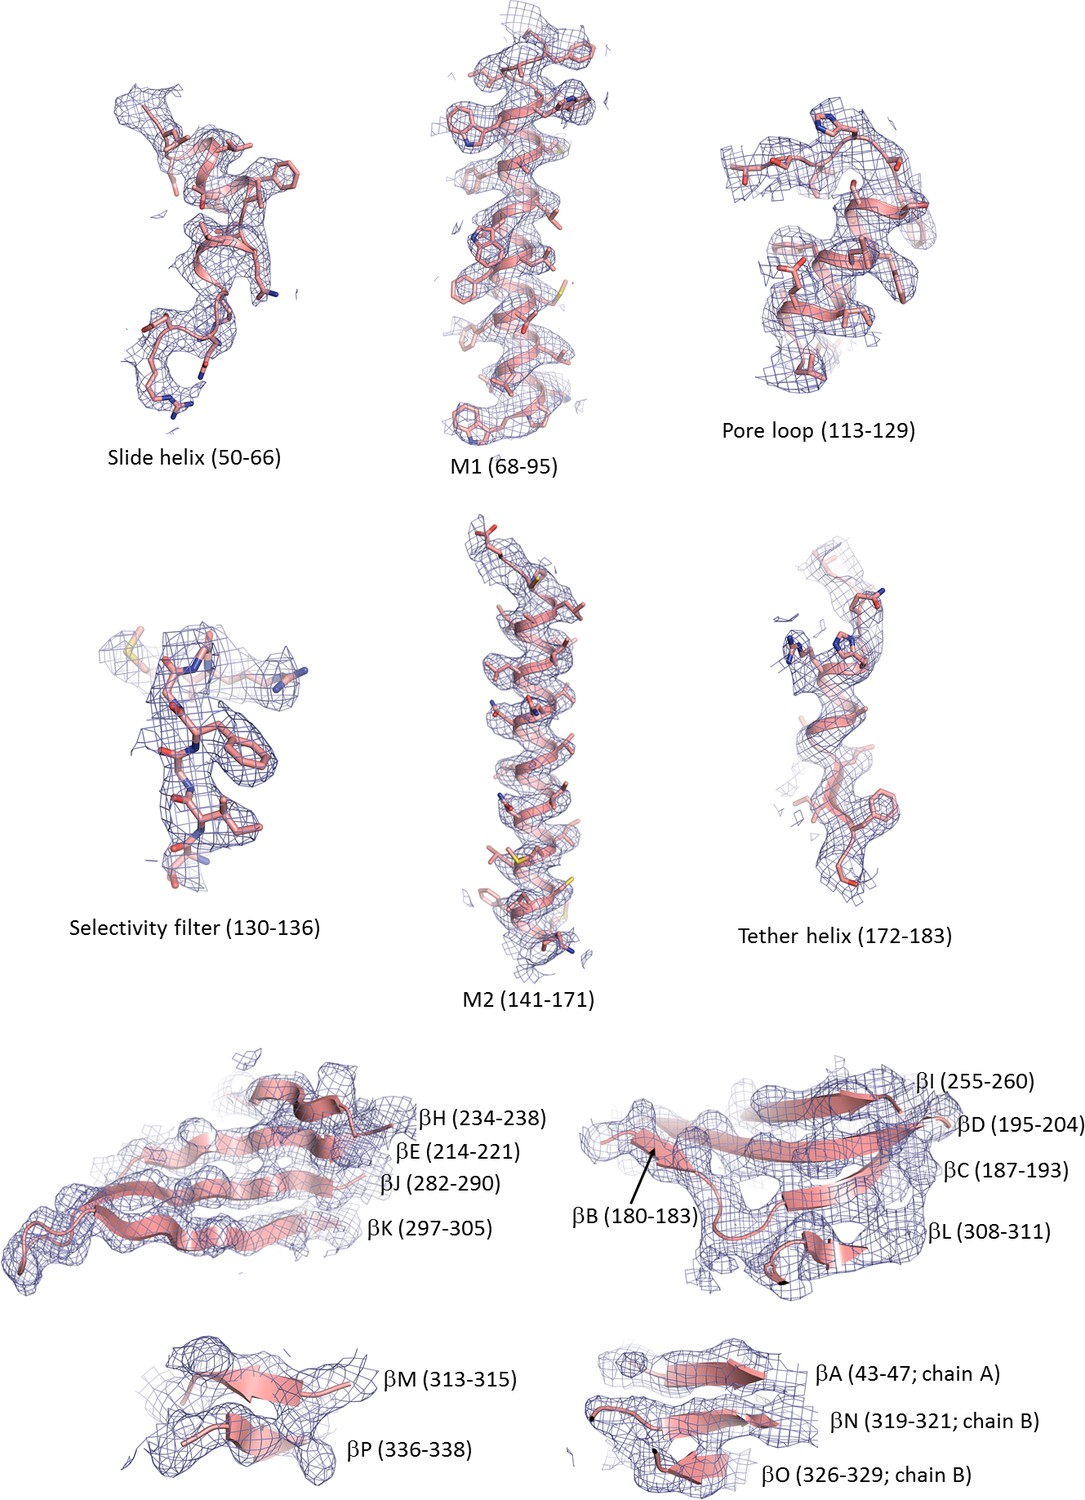
Cryo-EM density map of key structural features in Kir6.2.
For the β-sheets only backbone is shown.
Figure 2—figure supplement 2
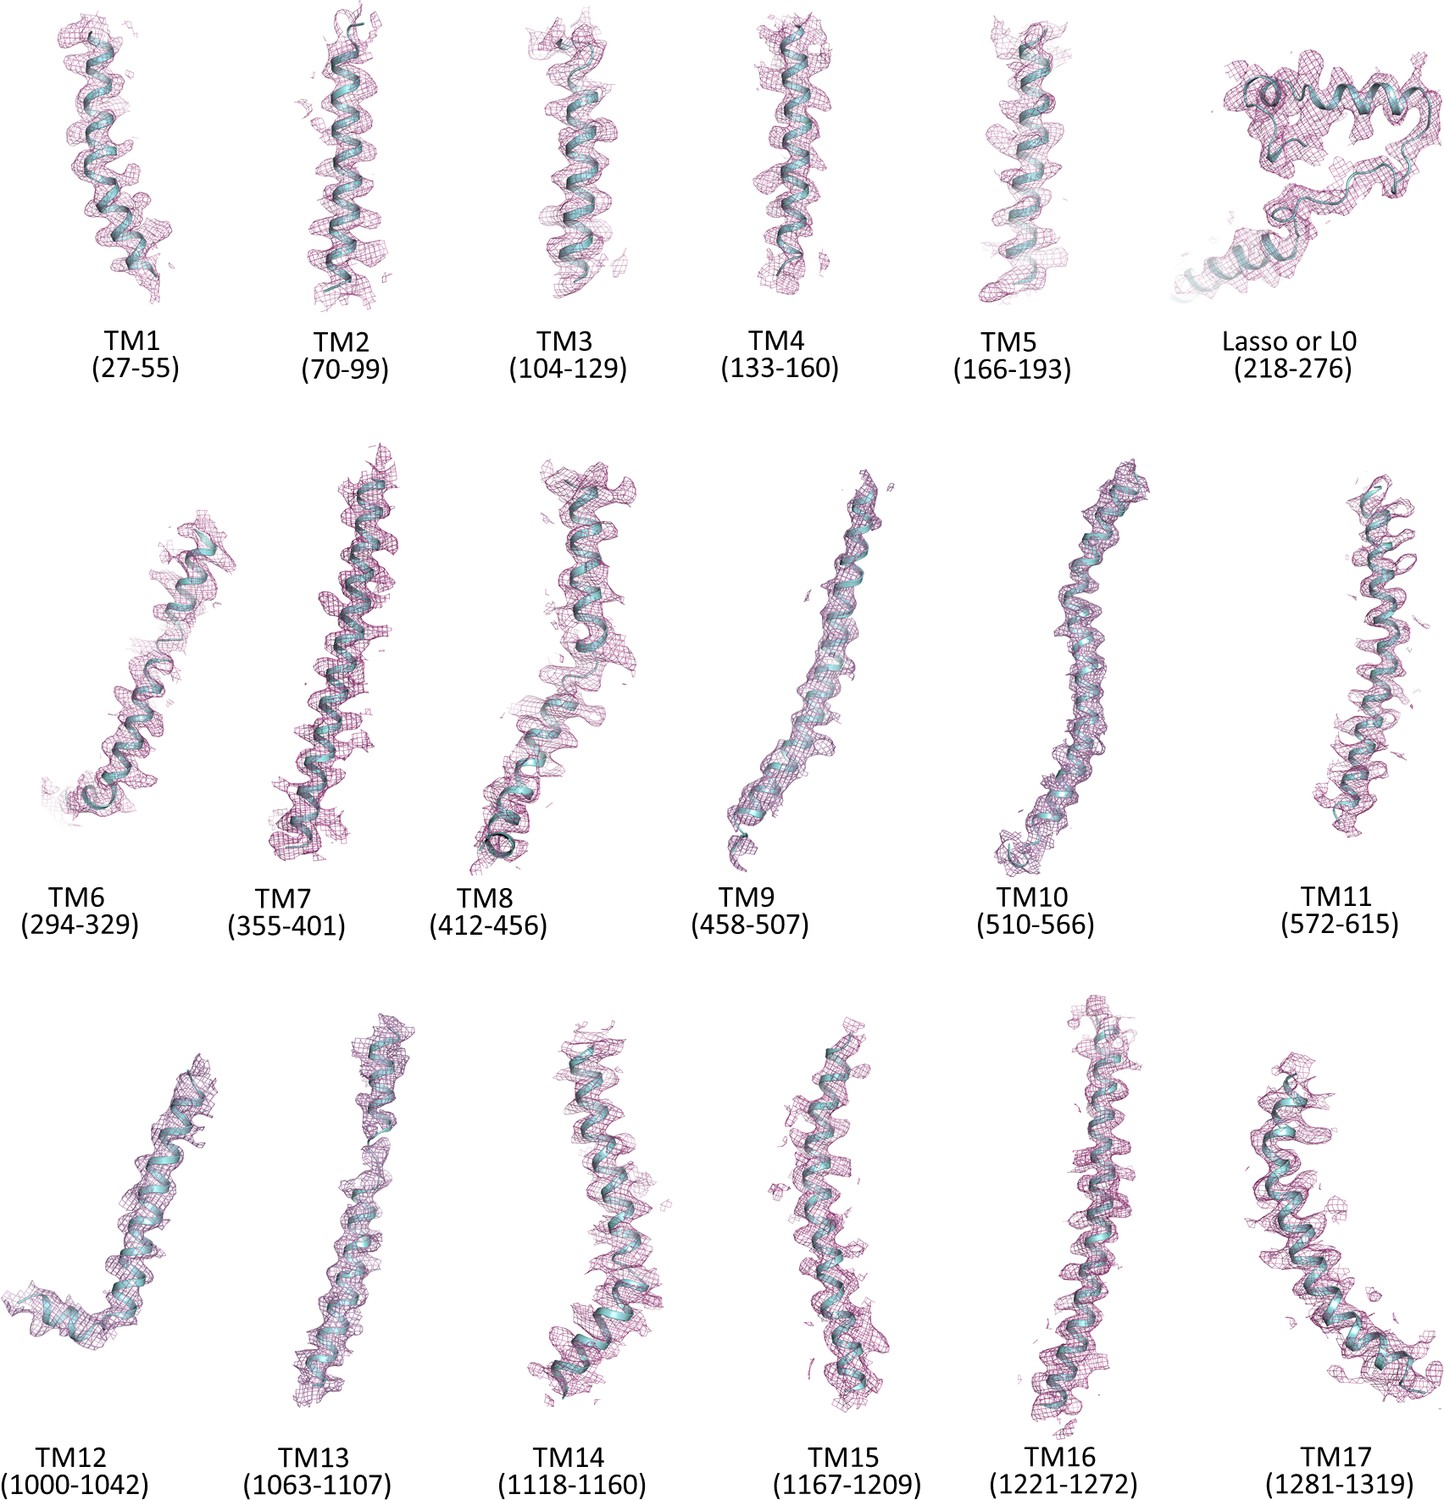
Cryo-EM density map of transmembrane helices and the lasso (L0) motif of SUR1.
Only backbone is shown.
Figure 3
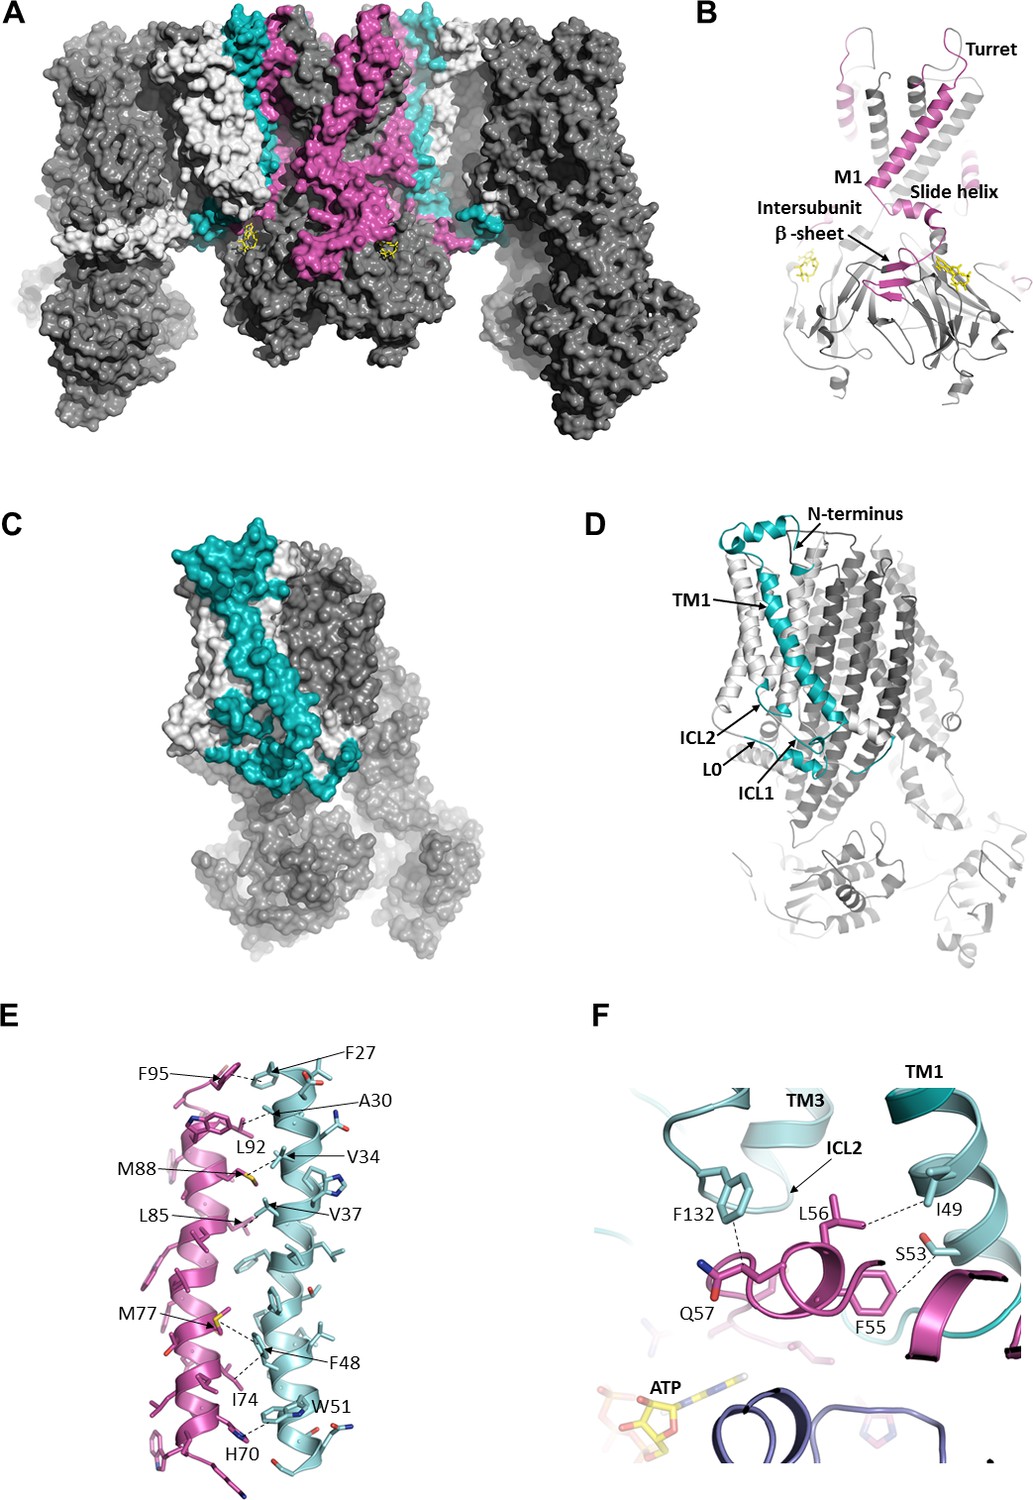
The interface between SUR1 and Kir6.2.
(A) Surface representation of the complex. SUR1-binding surface on Kir6.2 colored in magenta, and Kir6.2-binding surface on SUR1 is in cyan. TMD0/L0 is colored in light gray, and Kir6.2 and the ABC core of SUR1 are in dark gray. (B) Cartoon model of Kir6.2, with interface residues colored in magenta. The intersubunit β-sheet is formed by β strands A, N, and O shown in Figure 2—figure supplement 2. (C and D) Surface and cartoon models of SUR1, with interface residues in cyan. (E) Interface between M1 (Kir6.2; magenta) and TM1 (SUR1; cyan), highlighting key interactions. (F) Intersection of ICL2 (cyan) and N-terminus/slide helix (magenta), showing interaction between Q57 (Kir6.2) and F132 (SUR1). The dashed lines indicate selected van der Waals or electrostatic (H-bonding or charge-charge) interactions between two residues to aid visualization.
Figure 4 with 1 supplement
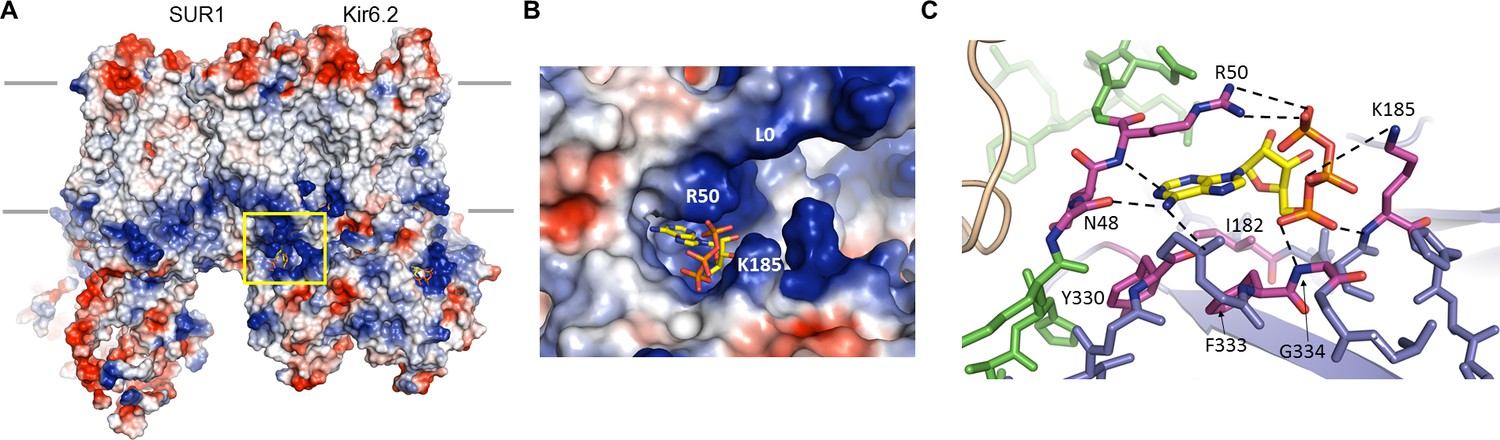
The ATP binding pocket.
(A) Surface representation of a Kir6.2 tetramer in complex with one SUR1, colored by Coulombic surface potential. ATP pocket is boxed in yellow. (B) Close-up of ATP binding pocket boxed in (A). Note close proximity of L0 to the pocket on Kir6.2. (C) Interactions within ATP-binding pocket, with residues directly interacting with ATP colored in magenta. The Kir6.2 subunit containing R50 is colored green, with the adjacent subunit colored blue. The dashed lines indicate possible van der Waals or electrostatic interactions to aid visualization.
Figure 4—figure supplement 1
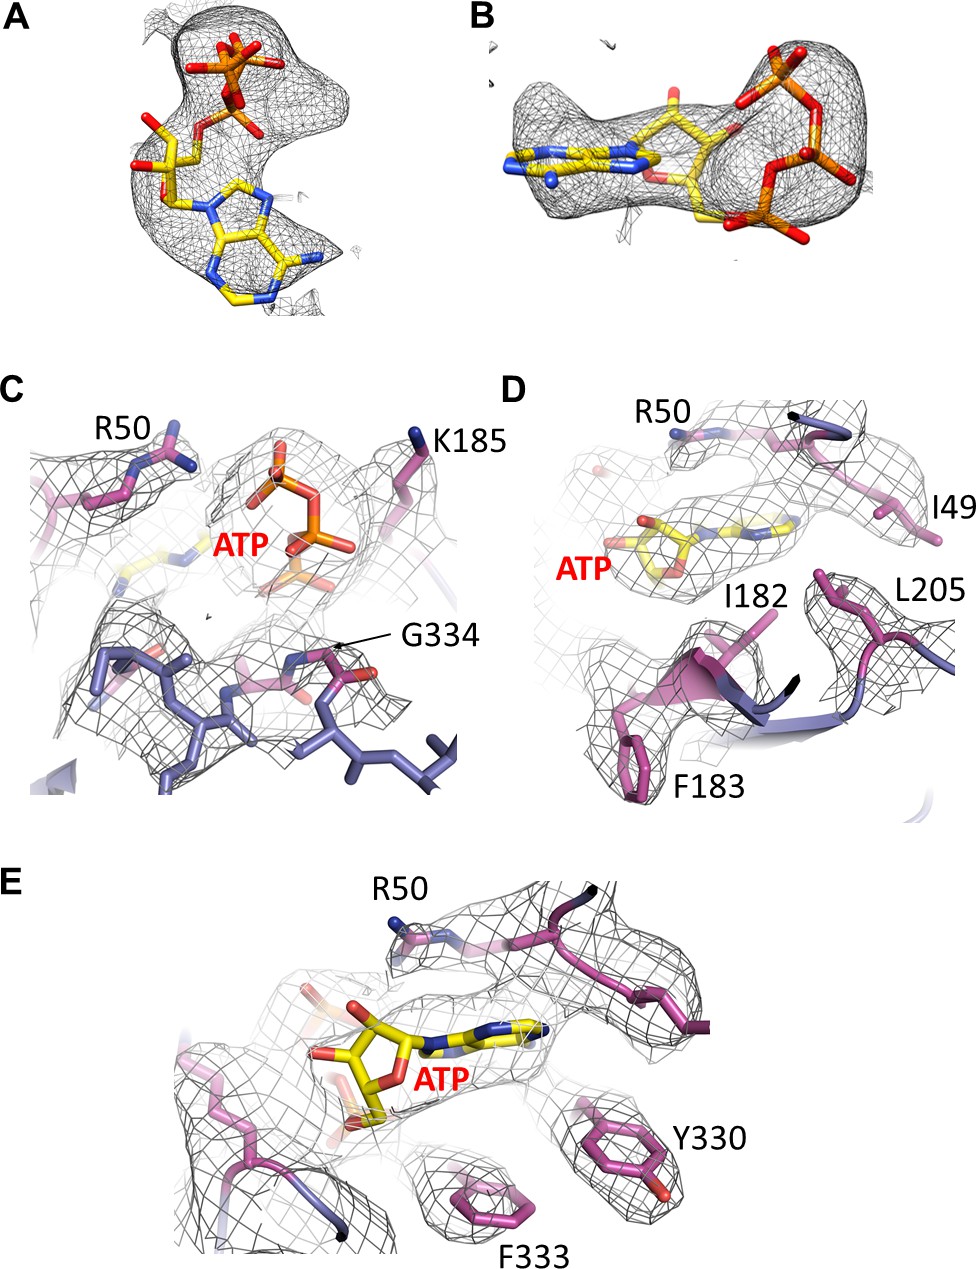
Cryo-EM density of ATP and surrounding residues.
(A and B) Cryo-EM density for ATP, contoured to 3.5σ. (C, D, E) Cryo-EM density for residues surrounding ATP.
Figure 5
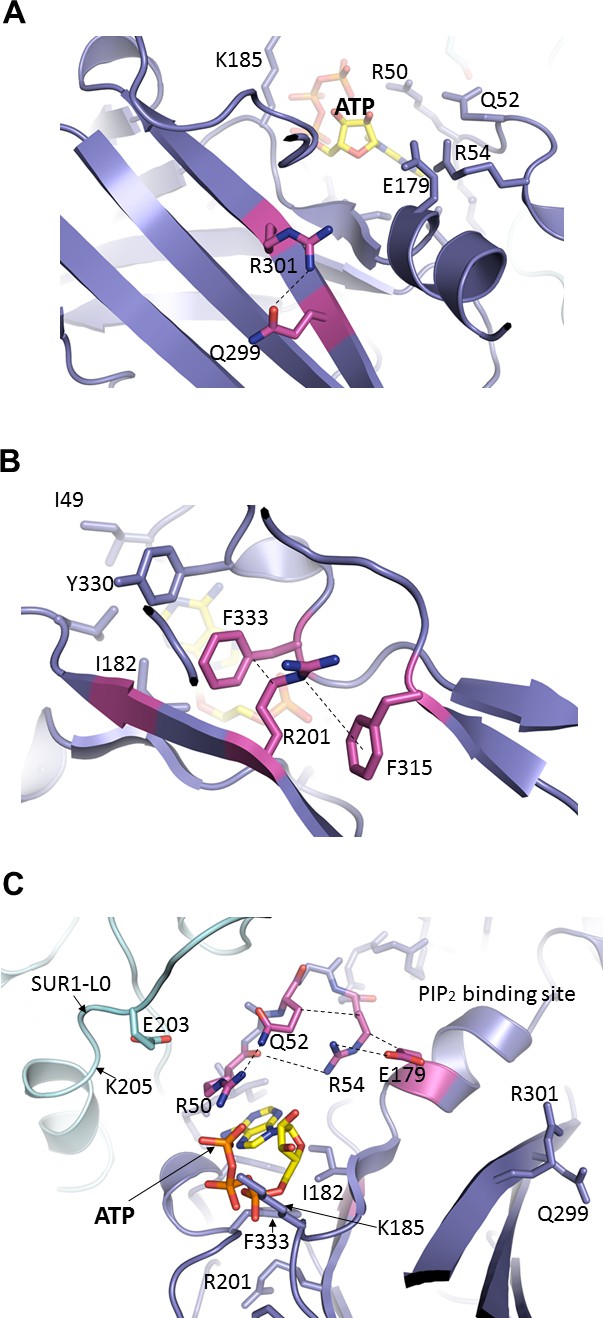
Important molecular interactions surrounding the ATP binding site.
(A) Electrostatic interaction between R301 and Q299, viewed from the interior of Kir6.2 and looking out toward the cytoplasm. These residues are found on an internal β-sheet 12 Å from ATP (Cα of R301 to ribose of ATP) (B) Dual interaction between R201 and F315, likely via cation-π, and hydrophobic stacking between aliphatic portion of R201 side chain and F333, again viewed from the Kir6.2 interior. These residues are found directly below ATP (~9 Å from Cα of R201 to ribose of ATP). (C) Relationship between R50, Q52, R54, and E179 of Kir6.2 near the ATP and PIP2 binding sites. The dashed lines indicate possible van der Waals or electrostatic interactions to aid visualization.
Figure 6 with 1 supplement
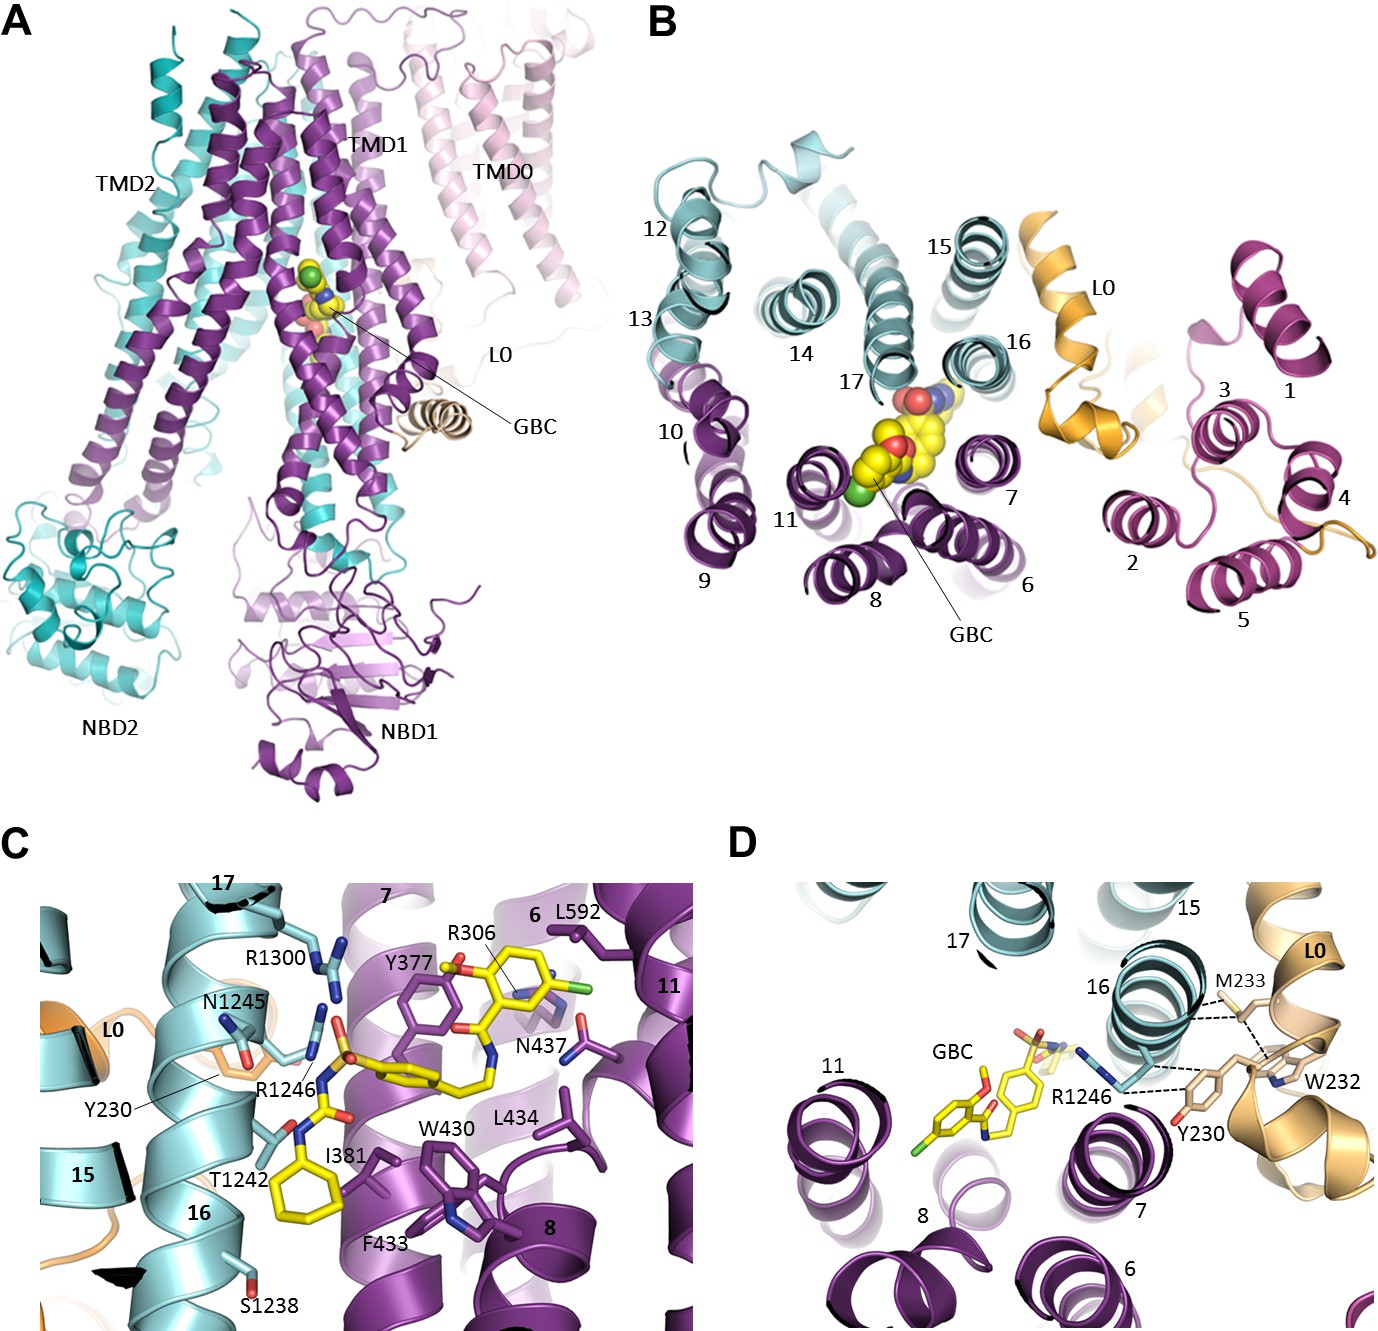
The GBC binding site in SUR1.
(A) Ribbon diagram of SUR1 showing location of GBC, which is primarily coordinated by the inner helices of TMD1 (purple) and TMD2 (cyan). (B) Slice view of model in (A) viewed from the extracellular side. Note juxtaposition of L0 to helices in ABC core directly interacting with GBC. (C) Close-up of GBC binding pocket, showing all residues which immediately line the pocket and seem to form direct contact with GBC; a subset of these residues were mutated to test their role in GBC binding (Figure 7). (D) Magnified view in (B), highlighting indirect roles of Y230 and W232 (L0) in GBC binding. These both likely stabilize interactions between residues on helix 16 of TMD2 and GBC, at the same time anchoring this helix of L0 to the ABC core structure.
Figure 6—figure supplement 1
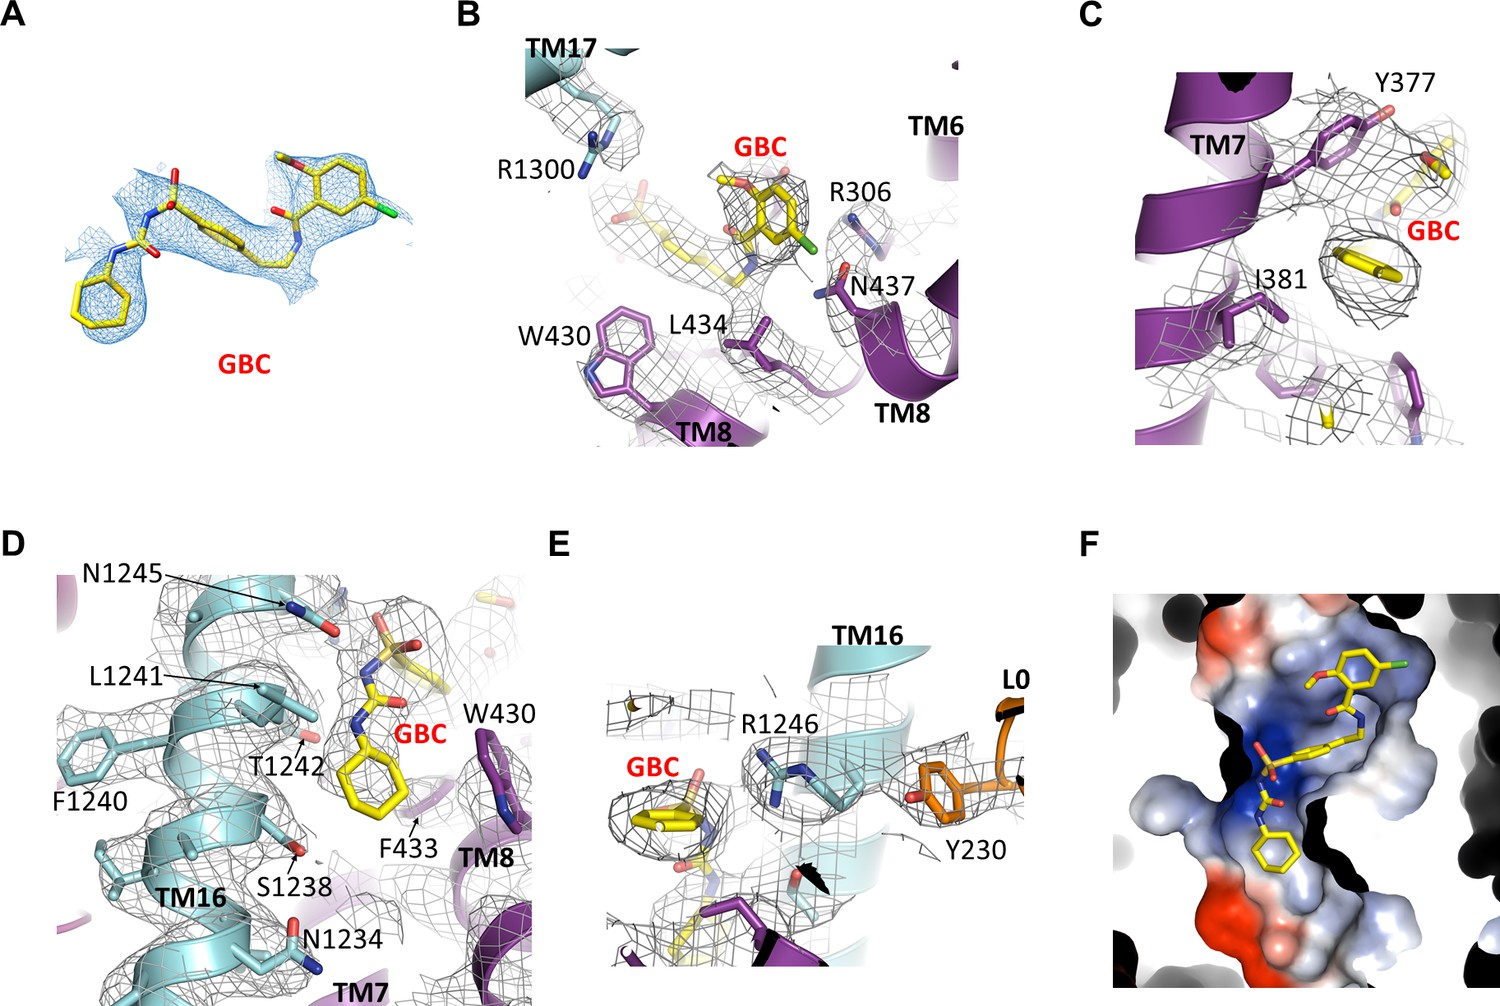
GBC binding site.
(A) Cryo-EM density of GBC, contoured to 3σ. (B, C, D, E) Cryo-EM density of residues near GBC, contoured to 3.5σ. (F) Close-up surface representation view of the GBC binding pocket. The basic portion comprises N1245, R1246, and R1300, while the acid end is formed by S1238 and D1193.
Figure 7 with 1 supplement
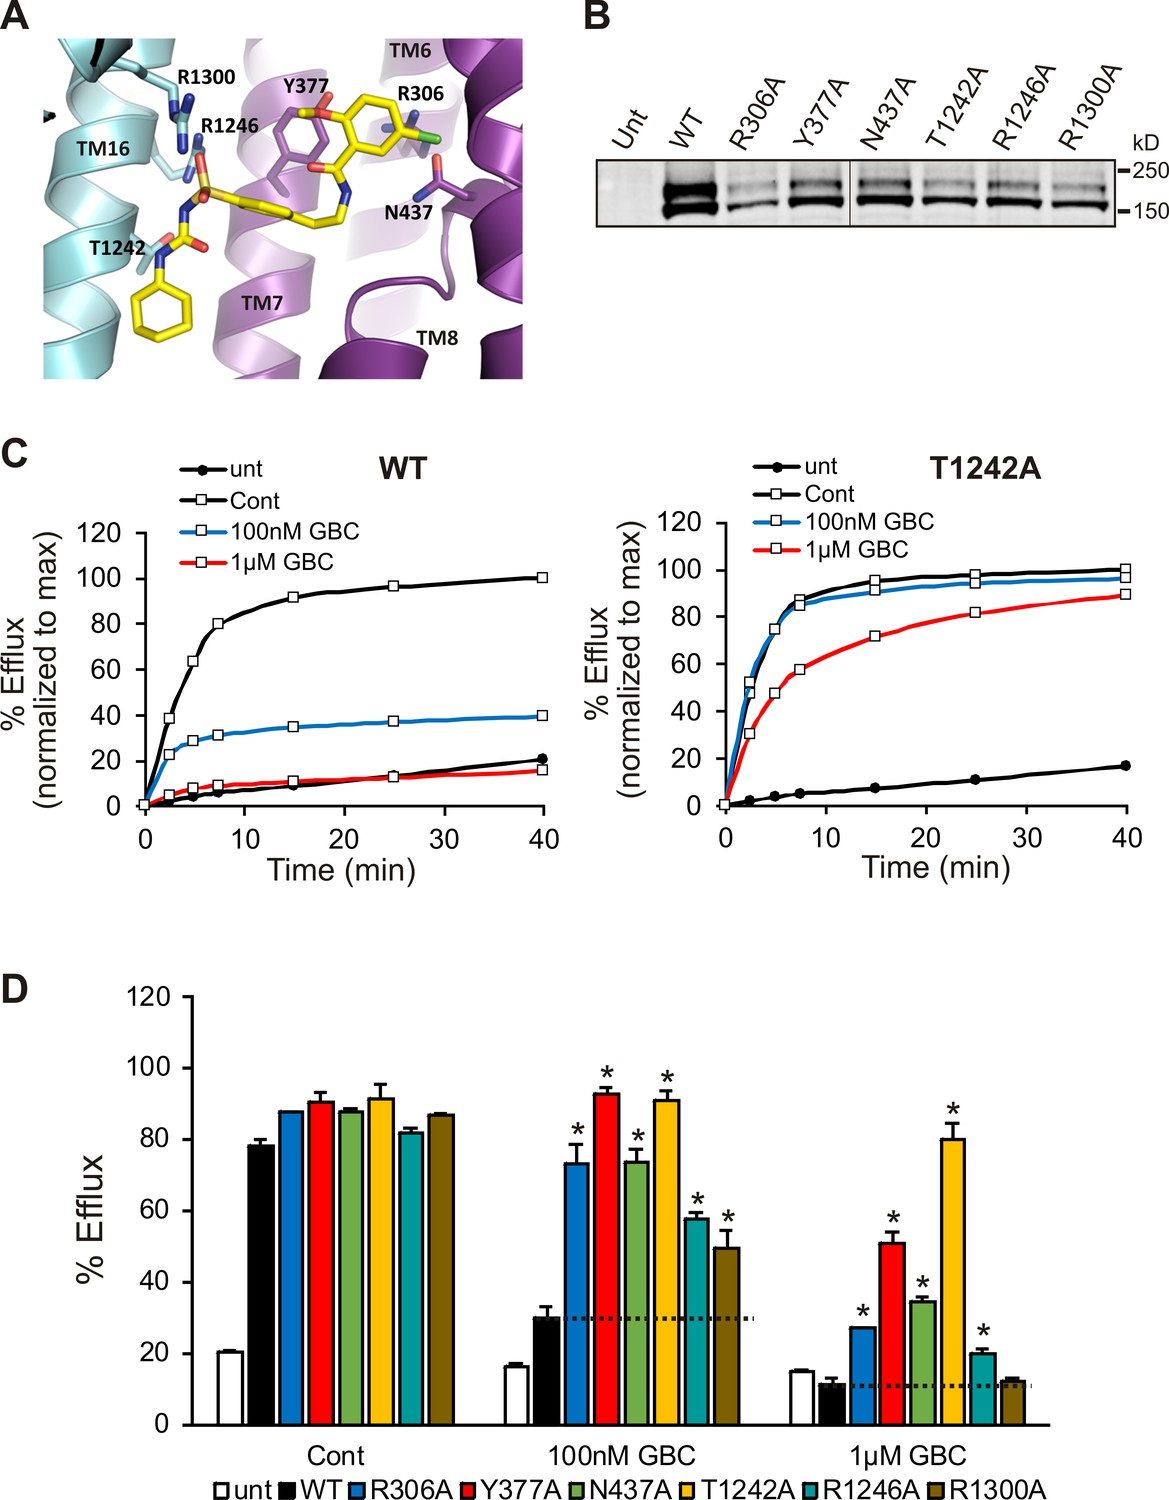
Functional testing of GBC binding residues.
(A) Residues in SUR1 selected to be mutated to alanine. (B) Western blot of WT and mutant SUR1 co-expressed with Kir6.2 in COS cells. Two SUR1 bands corresponding to the core-glycosylated immature protein (lower band) and the complex-glycosylated mature protein (upper band) are detected. The vertical line in the middle of the blot separates two parts of the same blot. (C) Representative efflux profiles of WT channels and T1242A mutant channels in cells pretreated with metabolic inhibitors for 30 min in the presence of 0.1% DMSO (cont), 100 nM GBC, or 1 µM GBC. Untransfected cells (unt) served as a control. Efflux was normalized to the maximal value observed at 40 min for direct comparison. (D) Quantification of percent efflux of all mutants compared to WT. Each bar represents the mean ± s.e.m. of 3–4 biological repeats. *p<0.05 by one-way ANOVA with Newman-Keuls post hoc test.
Figure 7—figure supplement 1
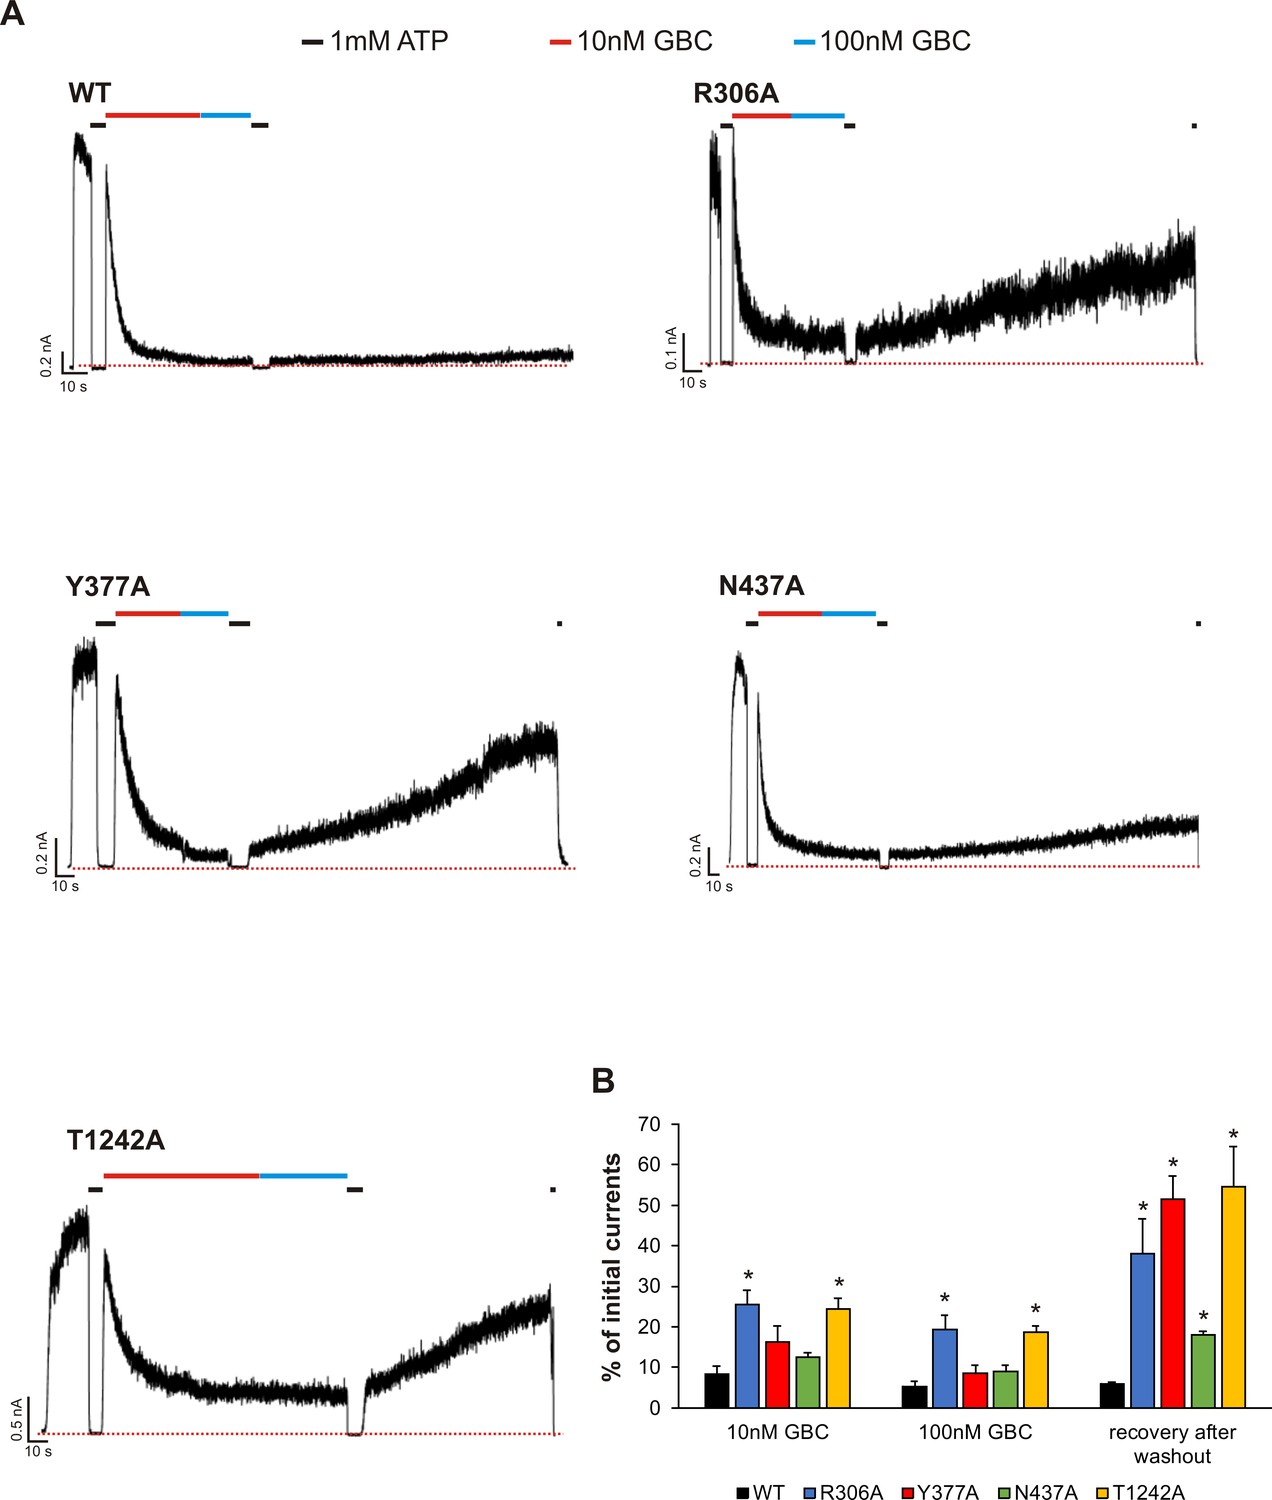
Functional testing of GBC binding residues by electrophysiology.
(A) Examples of inside-out patch clamp recordings of WT and various mutant channels. Recordings were made at + 50 mV in symmetric K+ solutions and inward currents shown as upward deflections. (B) Quantification of residual currents (expressed as percent of initial currents observed in K-INT solution) after exposure to 10 nM or 100 nM GBC, with values taken when the currents reached a steady level. The value for ‘recovery after washout’ was taken at ~ 100 s after the patch was returned to K-INT solution following a brief exposure to 1 mM ATP (to check baseline). Each bar represents mean ± s.e.m. of 3–6 patches, which represent the number of biological repeats. *p<0.05 by one-way ANOVA with Newman-Keuls post hoc test.
Figure 8 with 2 supplements
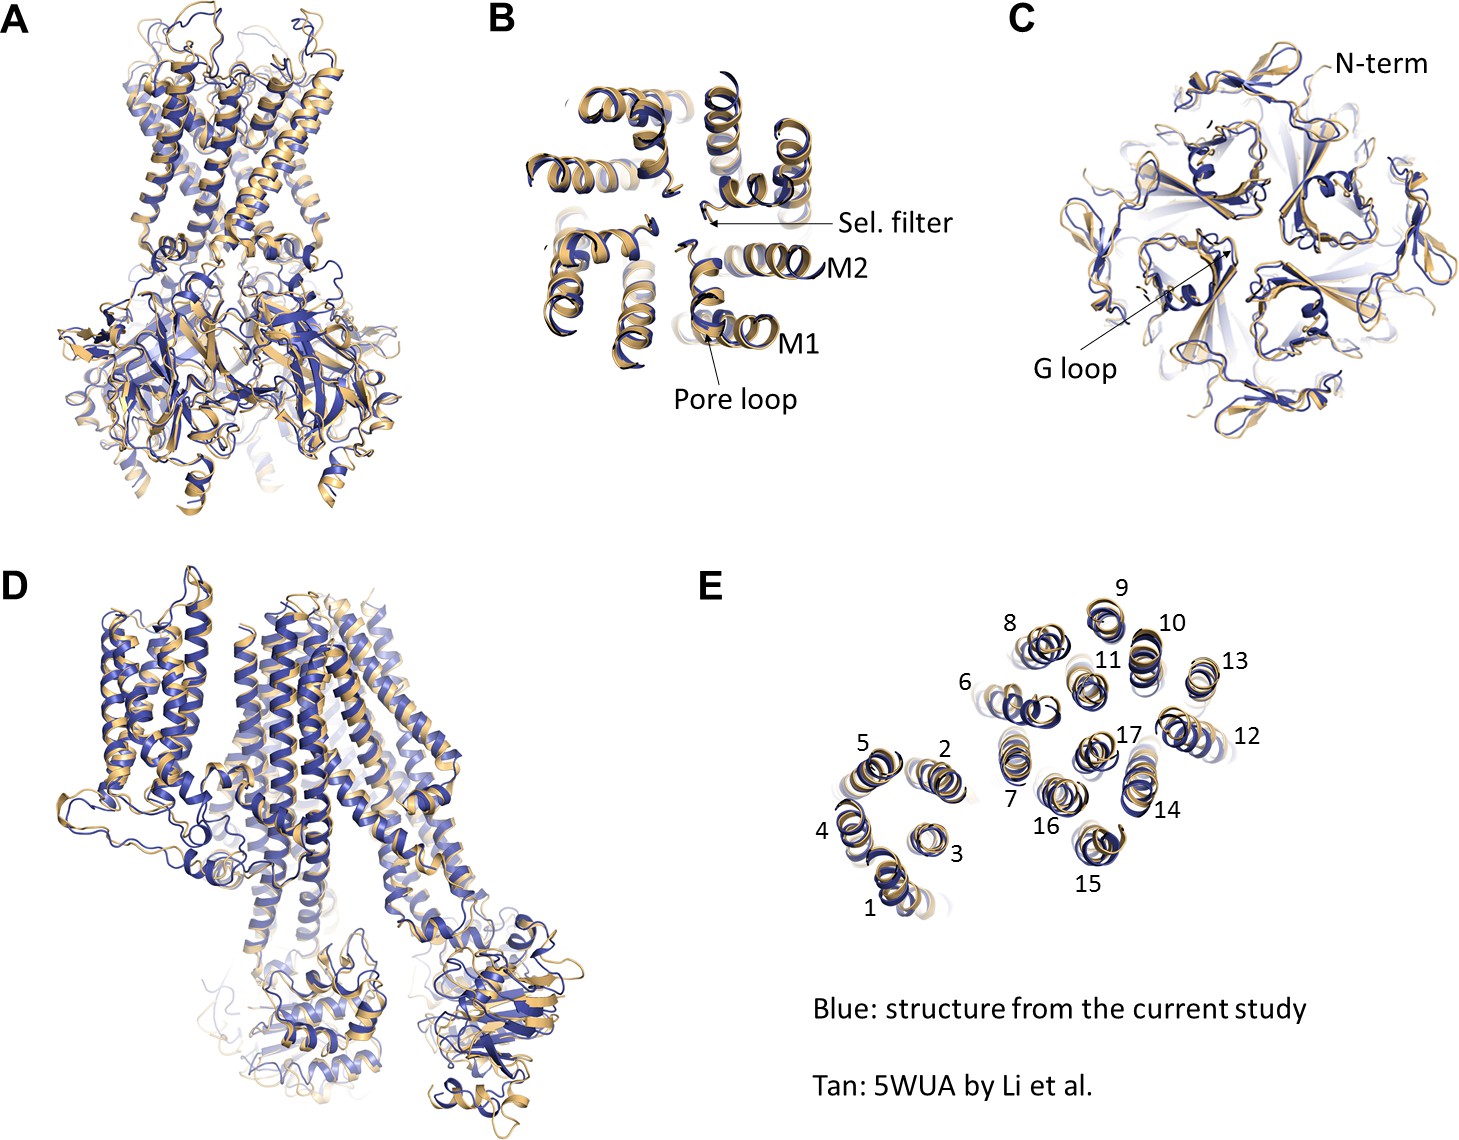
Comparison of the current structure with the GBC-bound, ATP-free structure from Li et al.(PDB ID: 5WUA).
(A) Overlay of the Kir6.2 structure viewed on the side. (B) Overlay of the Kir6.2 membrane helices viewed from the top. (C) Overlay of the Kir6.2 cytoplasmic domain. (D) Side view of the overlay of the SUR1 structure. (E) Overlay of the SUR1 transmembrane helices 1–17 viewed from the top. In all panels, the higher resolution structure from the current study is colored in blue, and the 5WUA structure from Li et al. is colored in tan.
Figure 8—figure supplement 1

Reinterpretation of the GBC cryo-EM density proposed in Li et al.
(A, B) Cryo-EM density of 5WUA near SUR1-L0 where GBC binding site was proposed (approximately the boxed region shown in A). Note only W231 and W232 of SUR1-L0 were modeled in the density shown. (C, D) Cryo-EM density from the current study and the corresponding structural model in the same region shown in (A) and (B).
Figure 8—figure supplement 2
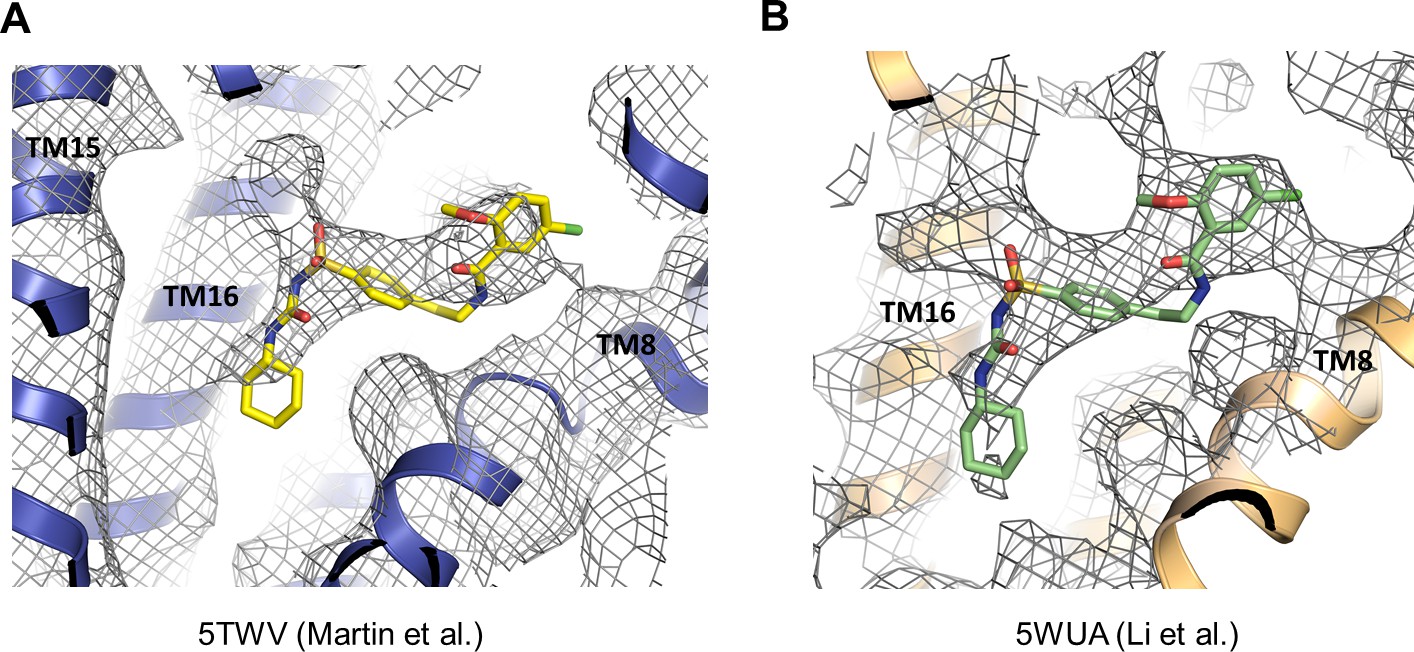
Cryo-EM density that likely corresponds to GBC in previously published KATP channel structures.
(A) Cryo-EM density of 5TWV near the GBC binding site identified in the present study. (B) Cryo-EM density of 5WUA near the GBC binding site identified in the current study. In both (A) and (B), unassigned density with shape and size that can accommodate GBC is observed.
Figure 9
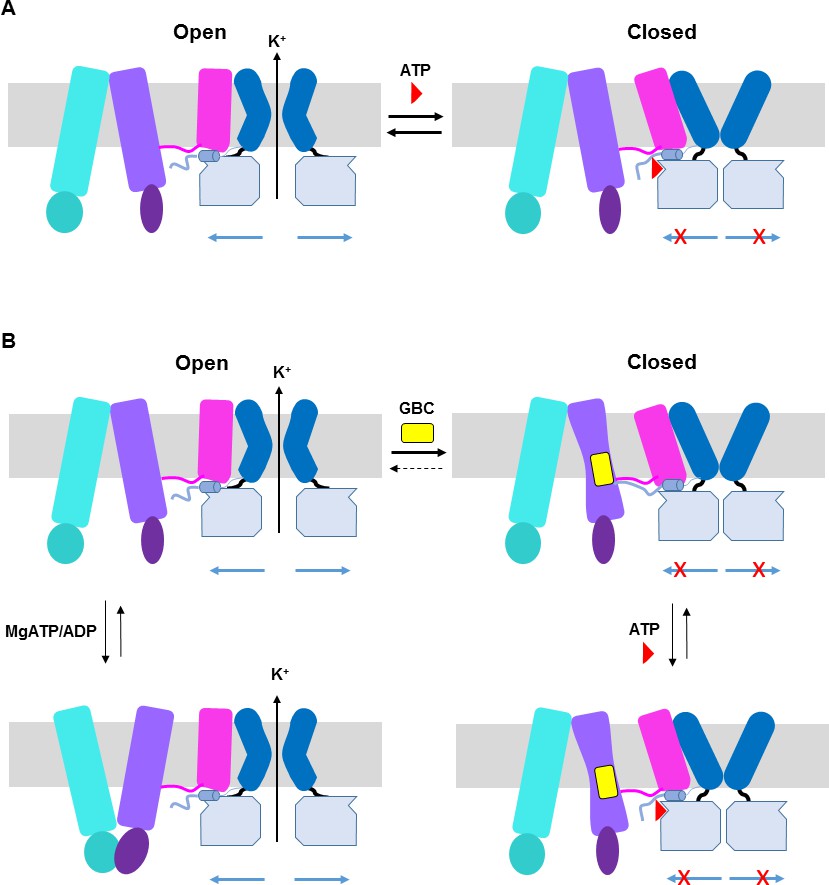
ATP and GBC gating models.
(A) Hypothetical model illustrating that ATP binds to a pocket formed by the N-terminus and CTD of Kir6.2 (from two adjacent subunits), with contribution form L0 of SUR1. This stabilizes the channel in a closed state that is energetically unfavorable for transitioning into an open state. (B) Hypothetical model of GBC gating. In the absence of nucleotides, GBC binds to the TM bundle juxtaposing L0, which stabilizes the distal N-terminus of Kir6.2 to greatly reduce channel open probability and promote channel closure. Addition of ATP further closes the channel by preventing residual free N-terminus from moving channels into an open state (see panel A). In the presence of MgATP/ADP, the SUR1-ABC core can transition from an inward-facing conformation to an outward conformation upon dimerization of the NBDs to antagonize ATP inhibition on Kir6.2 and promote channel opening; GBC binding stabilizes the SUR1-ABC core in the inward-facing conformation and shifts the equilibrium towards channel closure. The dashed lines between states illustrate the near irreversible binding of GBC. In both A and B, Kir6.2 transmembrane helices: dark blue; Kir6.2 cytoplasmic domain: pale blue; Kir6.2 slide helix and N-terminus from adjacent subunit: light blue cylinder and thick light blue line, respectively; SUR1-TMD0/L0: magenta; SUR1-TMD1: light purple; SUR1-NBD1: dark purple; SUR1-TMD2: cerulean; SUR1-NBD2: deep cerulean; GBC: yellow; ATP: red. Note the different states shown are not meant to reflect the actual kinetic transitions, but the hypothesized stable states.
Tables
Table 1
Statistics of cryo-EM data collection, 3D reconstruction and model building.
https://doi.org/10.7554/eLife.31054.005| Data collection/processing | |
| Microscope | Krios |
| Voltage (kV) | 300 |
| Camera | Gatan K2 Summit |
| Camera mode | Super-resolution |
| Defocus range (µm) | −1.4 ~ −3.0 |
| Movies | 2180 |
| Frames/movie | 60 |
| Exposure time (s) | 15 |
| Dose rate (e-/pixel/s) | 8 |
| Magnified pixel size (Å) | 1.72 (Super-resolution pixel size 0.86) |
| Total Dose (e-/Å^2) | ~40 |
| Reconstruction | |
| Software | Relion and Frealign |
| Symmetry | C4 |
| Particles refined | 59,417 |
| Resolution (Relion masked) | 4.07 Å |
| Resolution (Frealign masked) | 3.63 Å |
| Model Statistics | |
| MapCC | 0.758 (masked) |
| Clash score | 9.10 |
| Molprobity score | 1.9 |
| Cβ deviations | 0 |
| Ramachandran | |
| Outliers | 0.12% |
| Allowed | 6.31% |
| Favored | 93.57% |
| RMS deviations | |
| Bond length | 0.01 |
| Bond angles | 1.11 |
Key resources table
| Reagent type (species) or resource | Designation | Source or reference | Identifiers | |||
|---|---|---|---|---|---|---|
| Recombinant DNA/adenovirus | ||||||
| FLAG-tagged SUR1 (Cricetus cricetus) in AdEasy | ham f-SUR1 | PMID: 28092267 | N/A | |||
| Kir6.2 (Rattus norvegicus) in AdEasy | rat Kir6.2 | PMID: 28092267 | N/A | |||
| tTA adenovirus | PMID: 28092267 | N/A | ||||
| FLAG-tagged SUR1 (Cricetus cricetus) in pECE | f-SUR1 | PMID: 11226335 | N/A | |||
| Kir6.2 (Rattus norvegicus) in pCDNA3 | PMID: 14707124 | N/A | ||||
| Cell lines | ||||||
| INS-1 clone 832/13 (Rattus norvegicus) | PMID: 10868964 | RRID:CVCL_7226 | ||||
| COS-M6 (Chlorocebus aethiops) | COSm6 | PMID: 11226335 | RRID:CVCL_8561 | |||
| Software/Algorithms | ||||||
| Serial EM | PMID: 16182563 | http://bio3d.colorado.edu/SerialEM | ||||
| MOTIONCOR2 | PMID: 28250466 | http://msg.ucsf.edu/em/software/motioncor2 | ||||
| CTFFIND4 | PMID: 26278980 | http://grigoriefflab.janelia.org/ctffind4 | ||||
| DoGPicker | PMID: 19374019 | https://sbgrid.org/software/titles/dogpicker | ||||
| Relion-2 | PMID: 27845625 | https://www2.mrc-lmb.cam.ac.uk/relion | ||||
| Frealign | PMID: 27572728 | http://grigoriefflab.janelia.org/frealign | ||||
| Bsoft | PMID: 11472087 | https://lsbr.niams.nih.gov/bsoft/ | ||||
| COOT | PMID: 20383002 | http://www2.mrc-lmb.cam.ac.uk/personal/pemsley/coot | ||||
| RosettaCM | PMID: 24035711 | https://www.rosettacommons.org | ||||
| UCSF Chimera | PMID: 15046863 | http://www.cgl.ucsf.edu/chimera | ||||
| Pymol | PyMOL | https://pymol.org/2 | ||||
| MolProbity | PMID: 20057044 | http://molprobity.biochem.duke.edu | ||||
| T-Coffee | PMID: 10964570 | http://www.tcoffee.org/Projects/tcoffee/ | ||||
| Chemicals/Commercial Kits/Antibodies | ||||||
| Digitonin | Calbiochem (San Diego, CA) | CAS 11024-24-1 | ||||
| ATP | Sigma-Aldrich (St. Louis, MO) | A7699 | ||||
| Glibenclamide | Sigma-Aldrich | G0639 | ||||
| QuikChange mutagenesis kit | Agilent (Santa Clara, CA) | 200515 | ||||
| FuGENE6 | Promega (Madison, WI) | E2691 | ||||
| Anti-FLAG M2 affinity gel | Sigma-Aldrich | A2220 | ||||
| FLAG peptide | Sigma-Aldrich | F3290 | ||||
| Anti-SUR1 (Oryctolagus cuniculus) | PMID: 17575084 | N/A | ||||
| Super Signal West Femto | Pierce (Rochford, IL) | PI34095 | ||||
| Other | ||||||
| R1.2/1.3 300 mesh UltrAuFoil grids | Quantifoil (Großlöbichau, Germany) | Q27507 | ||||
Additional files
-
Transparent reporting form
- https://doi.org/10.7554/eLife.31054.021
Download links
A two-part list of links to download the article, or parts of the article, in various formats.
Downloads (link to download the article as PDF)
Open citations (links to open the citations from this article in various online reference manager services)
Cite this article (links to download the citations from this article in formats compatible with various reference manager tools)
Anti-diabetic drug binding site in a mammalian KATP channel revealed by Cryo-EM
eLife 6:e31054.
https://doi.org/10.7554/eLife.31054


