Targeting RAS-driven human cancer cells with antibodies to upregulated and essential cell-surface proteins
- University of California, San Francisco, United States
- Frederick National Laboratory for Cancer Research, United States
Figures
Figure 1 with 1 supplement
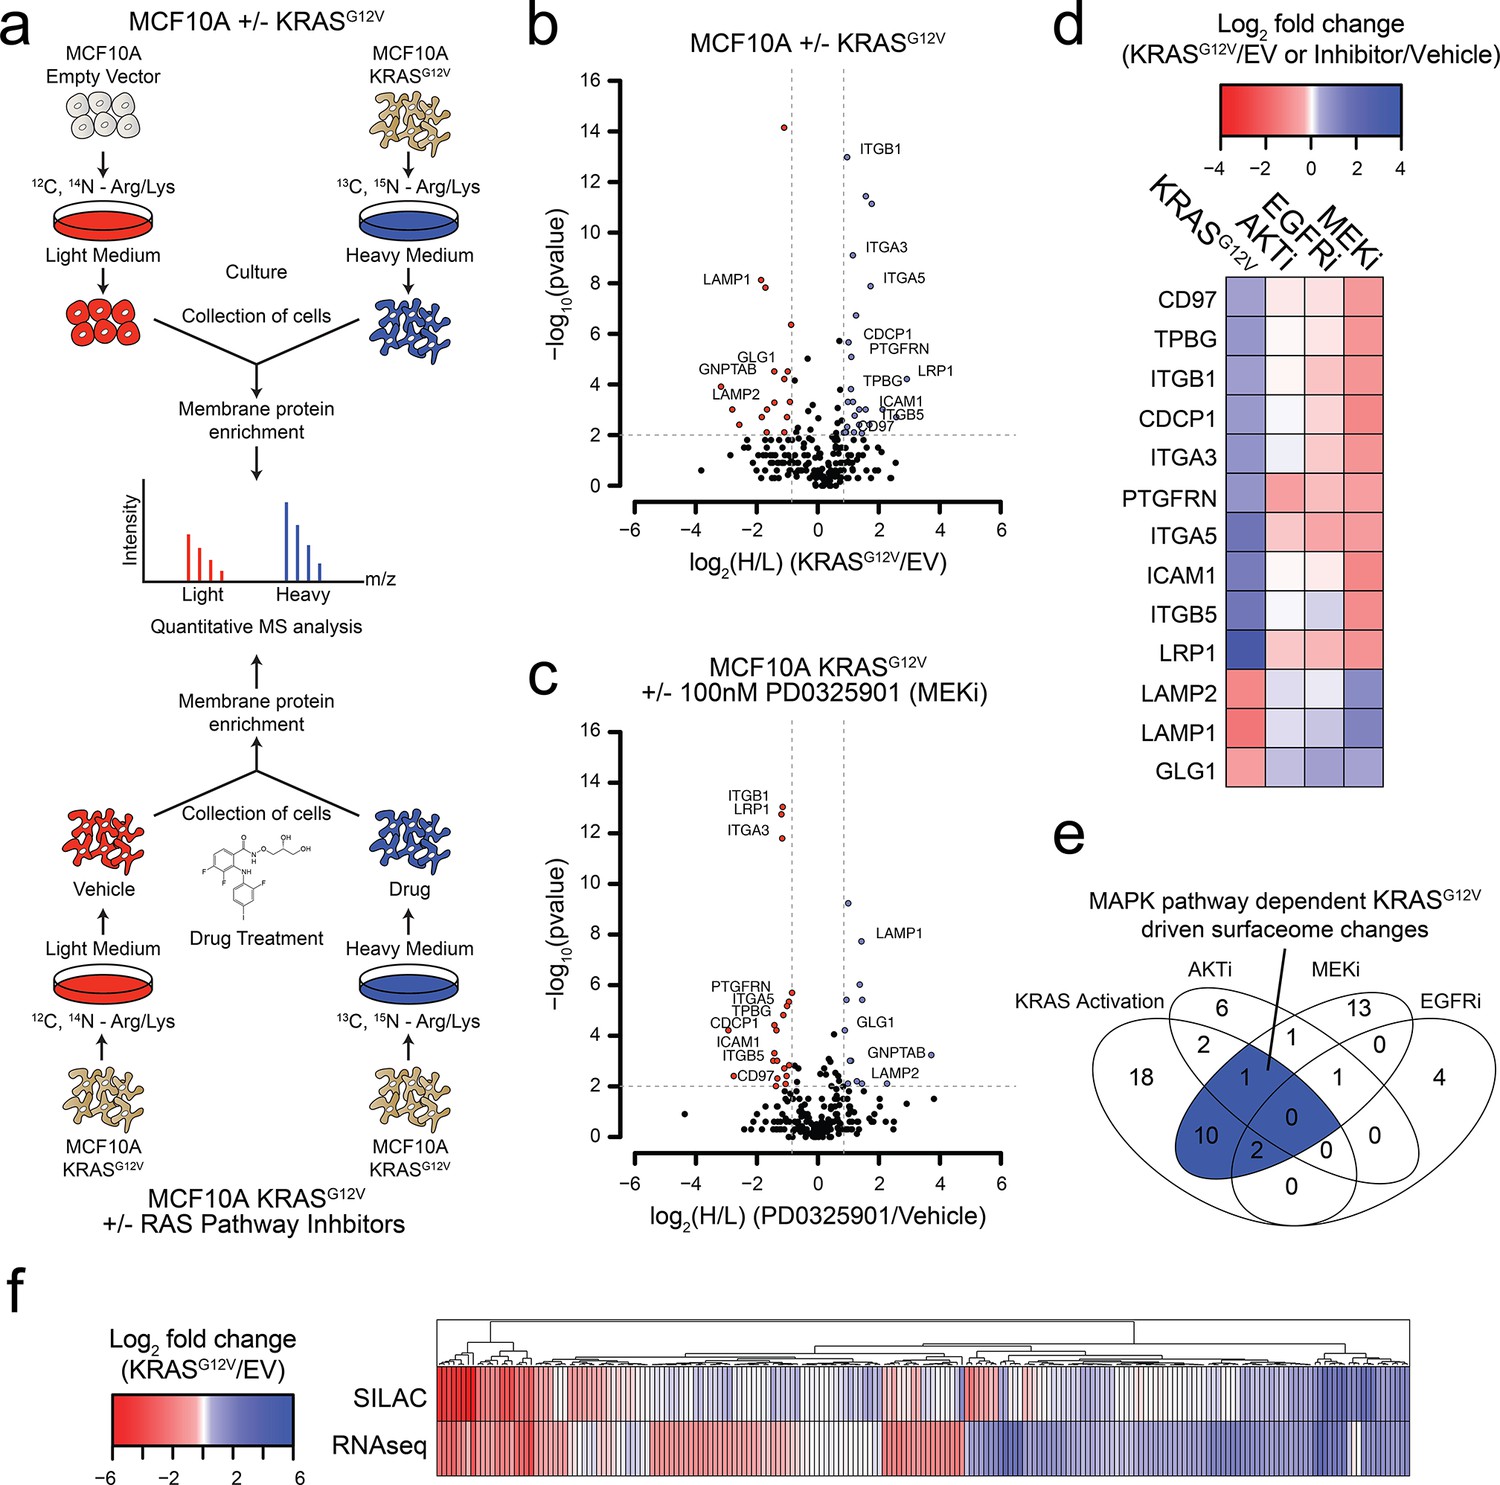
Oncogenic KRAS signaling coordinately regulates the expression of cell surface proteins in a model epithelial cell.
(a) Experimental strategy for quantitative SILAC surface proteomics to compare surfaceomes of MCF10A empty vector cells to MCF10A KRASG12V cells (Top), or MCF10A KRASG12V cells treated with vehicle versus RAS pathway inhibitors (Bottom). Cells were cultured in either light or heavy SILAC media and then processed using N-linked cell surface glycoprotein enrichment and MS-based proteomic analysis. (b) Volcano plot of MCF10A empty vector versus MCF10A KRASG12V cell-surface mass spectrometry experiment showing log2 fold-changes in expression (X-axis) or –log10(p-value)s (Y-axis). Proteins with a p-value less than 0.01 and a minimum of 1.75 fold increase (blue) or decrease (red) in SILAC ratio were considered significantly changed. Proteins labeled with text show expression patterns that were significantly altered by oncogenic KRAS signaling and inversely altered by MEKi. (c) Volcano plot representations of surface proteins in MCF10A KRASG12V cells with or without treatment with the MEK inhibitor (MEKi), PD0325901 (100 nM). Proteins with a p-value less than 0.01 and a minimum of 1.75 fold increase (blue) or decrease (red) in SILAC ratio were considered significantly changed. Proteins labeled with text showed expression patterns that were significantly altered by oncogenic KRAS signaling and inversely altered by MEKi. (d) Heatmap representation of the SILAC mass spectrometry data for proteins that were significantly changed by both KRASG12V and MEKi. (e) Venn diagram showing overlap of targets found in the SILAC mass spectrometry data for significantly altered proteins detected in all experiments. (f) Heatmap representation of a comparison between RNAseq and SILAC MS-based proteomics for all commonly identified genes. These data showing modest correlation highlight the importance of quantifying cell-surface proteomes by mass spectrometry for higher confidence identification of candidate proteins for antibody generation.
Figure 1—figure supplement 1
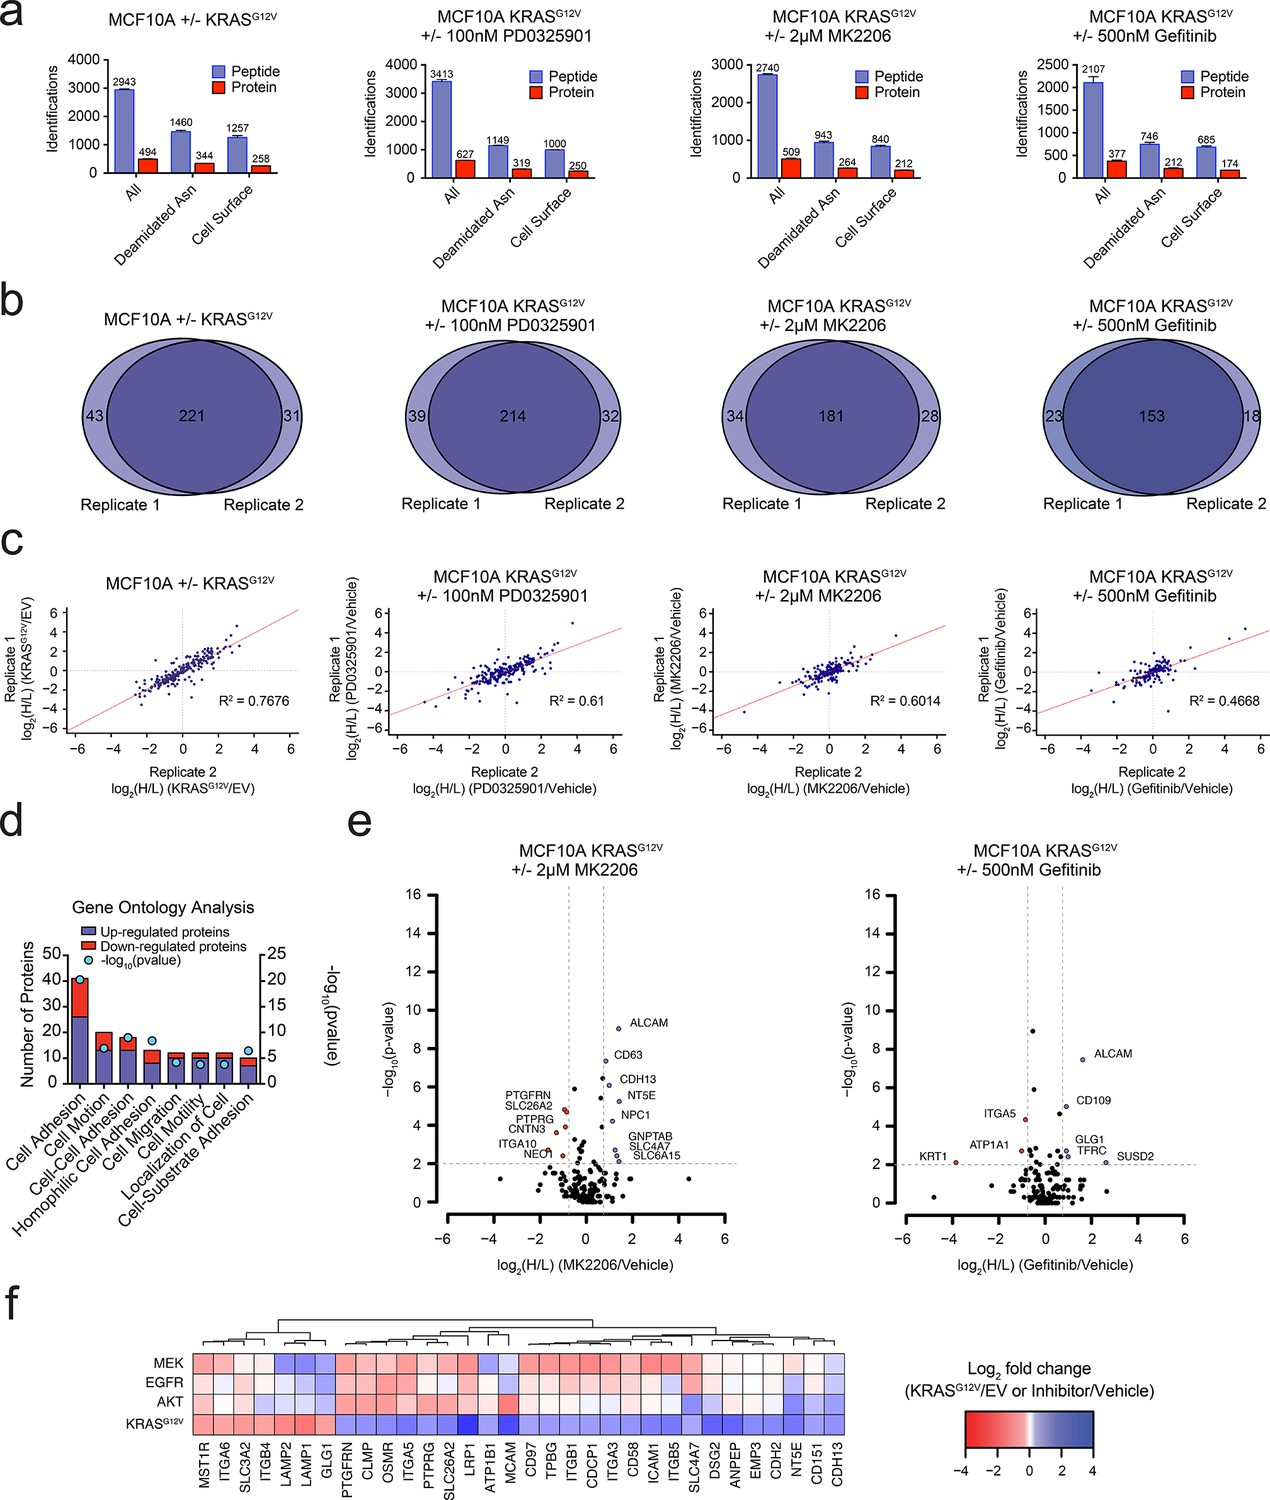
Oncogenic KRAS signaling coordinately regulates the expression of cell surface proteins in a model epithelial cell.
(a) Bar graph representation of the total number of unique peptides (blue) and proteins (red) identified by MS-based proteomics for each experiment. Data were bioinformatically triaged to remove peptides not containing the characteristic asparagine deamidation generated by PNGase digest and proteins not annotated to be localized to the cell surface. (b) Venn diagram representation of the overlap of identified proteins between biological replicates demonstrates reproducibility for each experiment. (c) Scatter plots of SILAC ratios show reproducibility between biological replicates for each experiment. (d) Gene ontology (GO) analysis of the cell-surface proteins significantly altered by expression of KRASG12V. (e) Volcano plot representations of the AKTi and EGFRi mass spectrometry experiments are shown. Proteins with a p-value less than 0.01 and a minimum of 1.75 fold increase (blue) or decrease (red) in SILAC ratio were considered significantly changed. (f) Heatmap representation of a comparison between proteins identified in all four proteomic experiments and significantly altered (fold-change >±1.75; p-value<0.01) in at least one dataset.
Figure 2 with 1 supplement
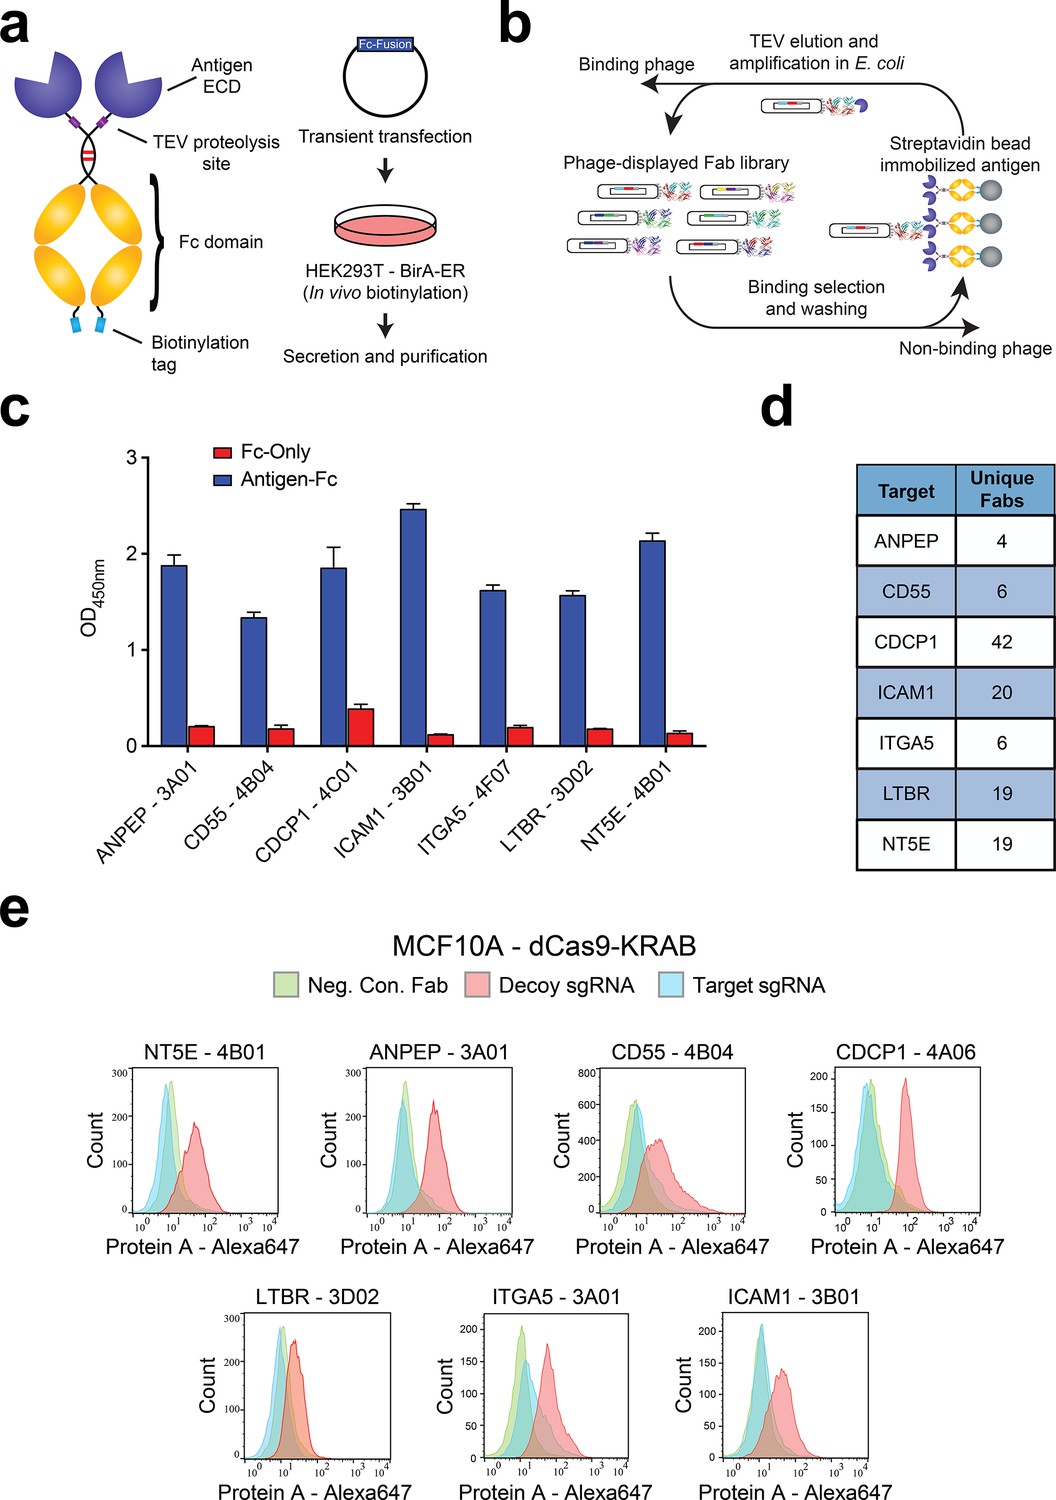
Generation and validation of antibodies to oncogenic KRAS upregulated surface proteins.
(a) (Left) Schematic of the Fc-fusion construct developed for rapid expression of membrane protein extracellular domains. Each extracellular domain was expressed as a TEV cleavable site-specifically biotinylated Fc-fusion. (Right) HEK293T cells stably expressing an ER-localized biotin ligase are transiently transfected with the Fc-fusion expression vector. Proteins are quantitatively biotinylated in-vivo, secreted into the cellular media, and purified by Protein A affinity purification. (b) Shown is the strategy for phage display generation of antibodies to each RAS-induced protein ECD. Proteins were immobilized on streptavidin magnetic beads and mixed with a highly diverse phage-displayed Fab library. Non-binding phage were removed by washing and phage bound protein was released by enzymatic treatment with TEV protease. Eluted phage were propagated in E. coli and the selection process was iterated for 3–4 rounds to enrich the library for specific protein binders. (c) Representative phage ELISAs from selections against seven proteins seen elevated in expression level by oncogenic KRAS signaling in MCF10As. Phage clones show strong binding to cognate protein Fc-fusions but little detectable binding to the isolated Fc-domain suggesting binding to the targeted ECD. (d) Table of the number of unique antibody clones generated against each of the specified KRAS upregulated targets. (e) Representative flow cytometry histograms demonstrate specific cellular target engagement of Fab clones generated against seven KRAS-driven surface proteins. MCF10A cells stably expressing dCas9-KRAB and a decoy sgRNA (red) or target sgRNA (blue and green) were labeled with either a negative control Fab (green) or a Fab of interest (red and blue). Fab binding to cells was detected by addition of a Protein A Alexa647 conjugate and quantification by immunofluorescence flow cytometry.
Figure 2—figure supplement 1
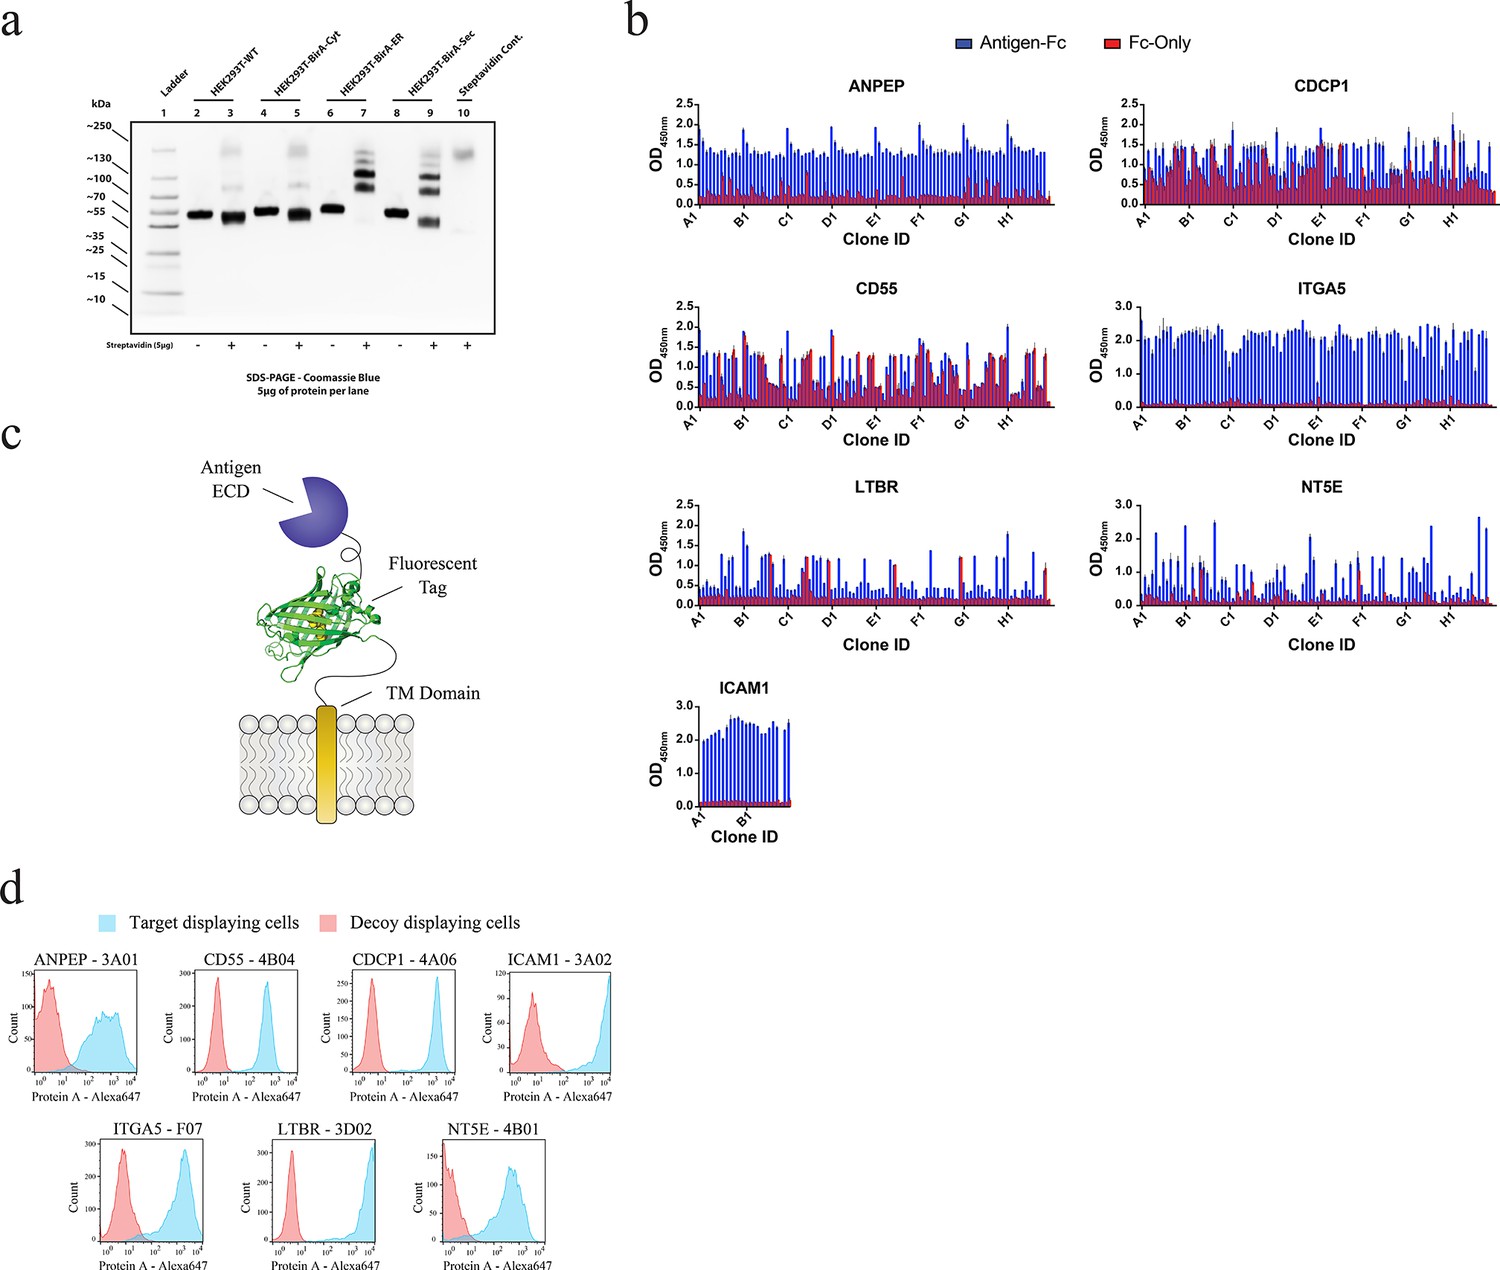
Generation and validation of antibodies to oncogenic KRAS upregulated surface proteins.
(a) Western blot analysis of Fc-fusion protein endogenous biotinylation. Expression in WT HEK293T cells was compared to expression in HEK293T cells stably expressing BirA localized to the cytosol (Left), the endoplasmic reticulum (Middle), or secreted into the extracellular space (Right). The amount of biotinylation was estimated by assessment of band migration by SDS-PAGE after co-incubation of the purified Fc-fusion with streptavidin. Expression in cells expressing ER-localized BirA showed quantitative biotinylation (>98%). (b) Phage ELISAs from selections against seven proteins elevated in expression level by oncogenic KRAS signaling in MCF10As. Phage clones that showed strong binding to cognate protein Fc-fusions but little detectable binding to the isolated Fc-domain were advanced for further characterization. (c) Schematic of the construct used to display each protein on the surface of HEK293 (T-Rex-293) cells for validation of antibody specificity. (d) Representative flow cytometry histograms demonstrate specific cellular target engagement of Fab clones raised against seven RAS-driven surface proteins.
Figure 3

Validation of oncogenic KRAS-induced cell surface proteins with recombinant antibodies.
(a) Seven proteins were confirmed to be upregulated on the MCF10A KRASG12V cells by flow cytometry using specific recombinant antibodies (n = 3, error bars represent s.d.). The table below compares log2 fold-changes as measured by flow cytometry, SILAC proteomics, and RNAseq. (b) Representative immunofluorescence images demonstrate orthogonal confirmation of KRAS-driven differential expression and cell surface localization of target proteins. (c) Heatmap representation of flow cytometry median fluorescent intensity values for Fabs to seven upregulated targets plus a Fab to GFP as a control for binding against nine tumorigenic cell lines. (d) Heatmap representation of flow cytometry median fluorescent intensity values for the eight Fabs against nine tumorigenic cell lines treated with RAS pathway inhibitors. (e) Flow cytometry and western blot profiling of CDCP1 expression levels in response to RAS pathway inhibitors.
Figure 4 with 1 supplement
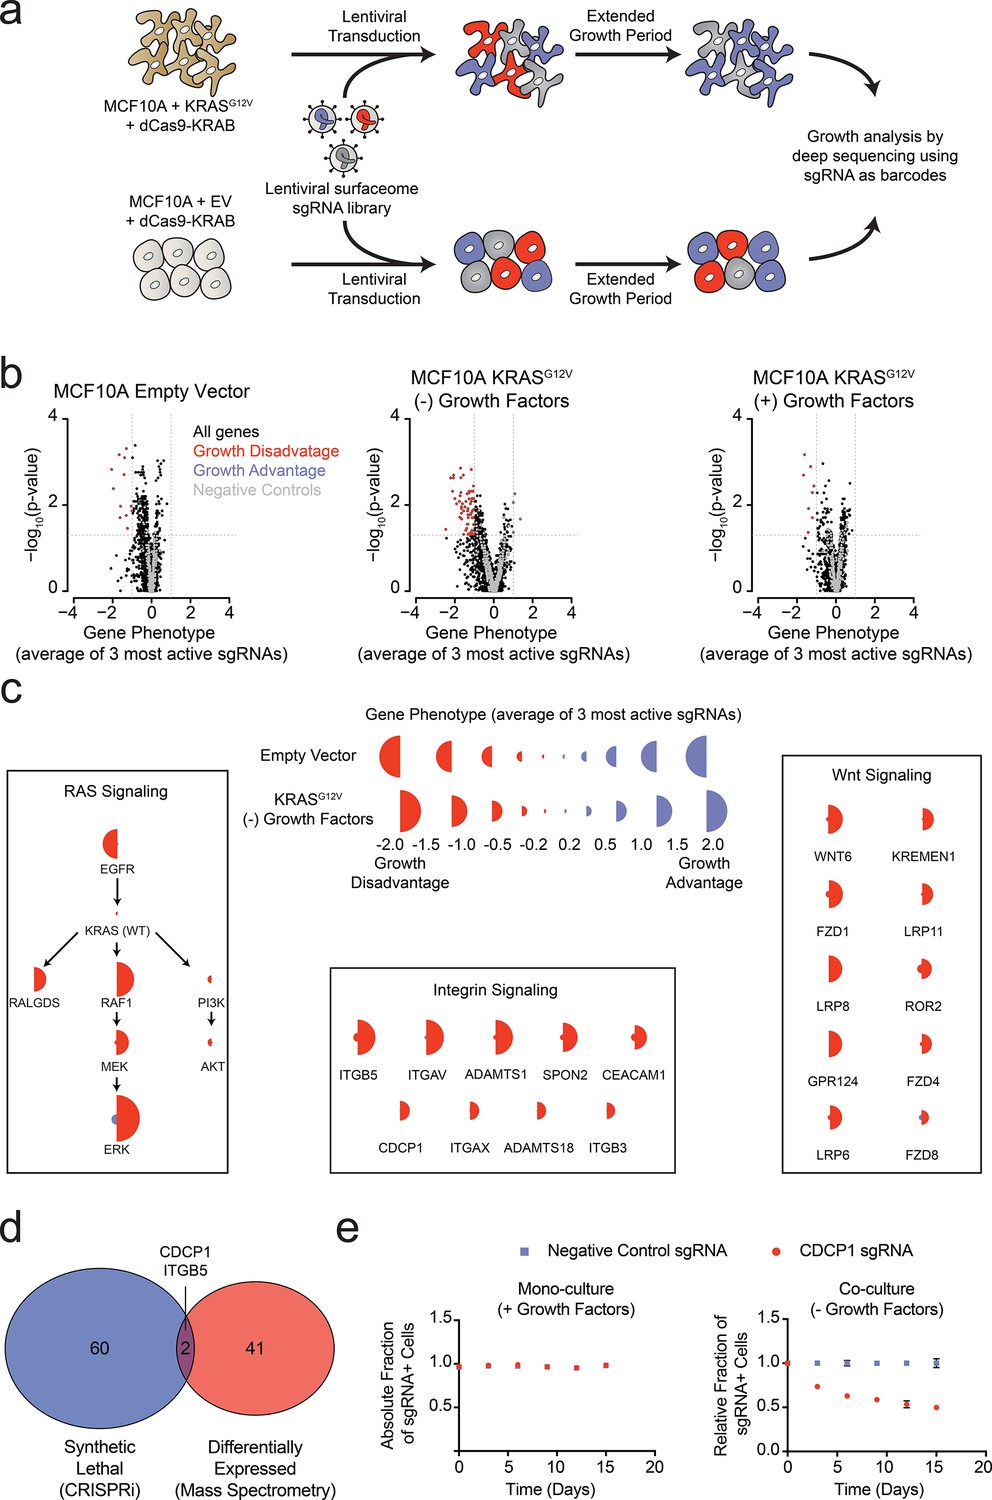
Systematic characterization of the functional importance of the KRAS surfaceome.
(a) Experimental strategy for the CRISPRi surfaceome screen. MCF10A Empty Vector or MCF10A KRASG12V cells were transduced with a lentiviral surfaceome sgRNA library containing five guides each for 1605 transmembrane targets. After being cultured for an extended growth period, the abundance of each sgRNA barcode was quantified by deep sequencing. (b) Volcano plots of the CRISPRi experiment showing effects on growth rate (gene phenotype,X-axis) versus –log10(p-value)s (Y-axis). Proteins with a p-value less than 0.05 and a gene phenotype >1 (blue) or <-1 (red) were considered significant. (c) Shown is a representation of CRISPRi phenotypes for RAS pathway control genes (Left), functionally categorized KRASG12V synthetic lethal genes including integrin signaling genes (Middle), and Wnt Signaling genes (Right). KRASG12V synthetic lethal genes were defined as having a p-value<0.025 and a phenotype >0.8 for KRASG12V cells and <0.8 for Empty Vector cells. (d) A Venn diagram comparing KRASG12V synthetic lethal genes and differentially expressed genes. (e) Competitive growth assays performed with KRASG12V cells transduced with the indicated CDCP1 and negative control sgRNAs. Cells were grown in monoculture with growth factors to ensure they maintained sgRNA expression (Left), and in co-culture with cells lacking sgRNA expression without growth factor to determine relative growth rates (Right). (n = 3, error bars represent s.d.).
Figure 4—figure supplement 1
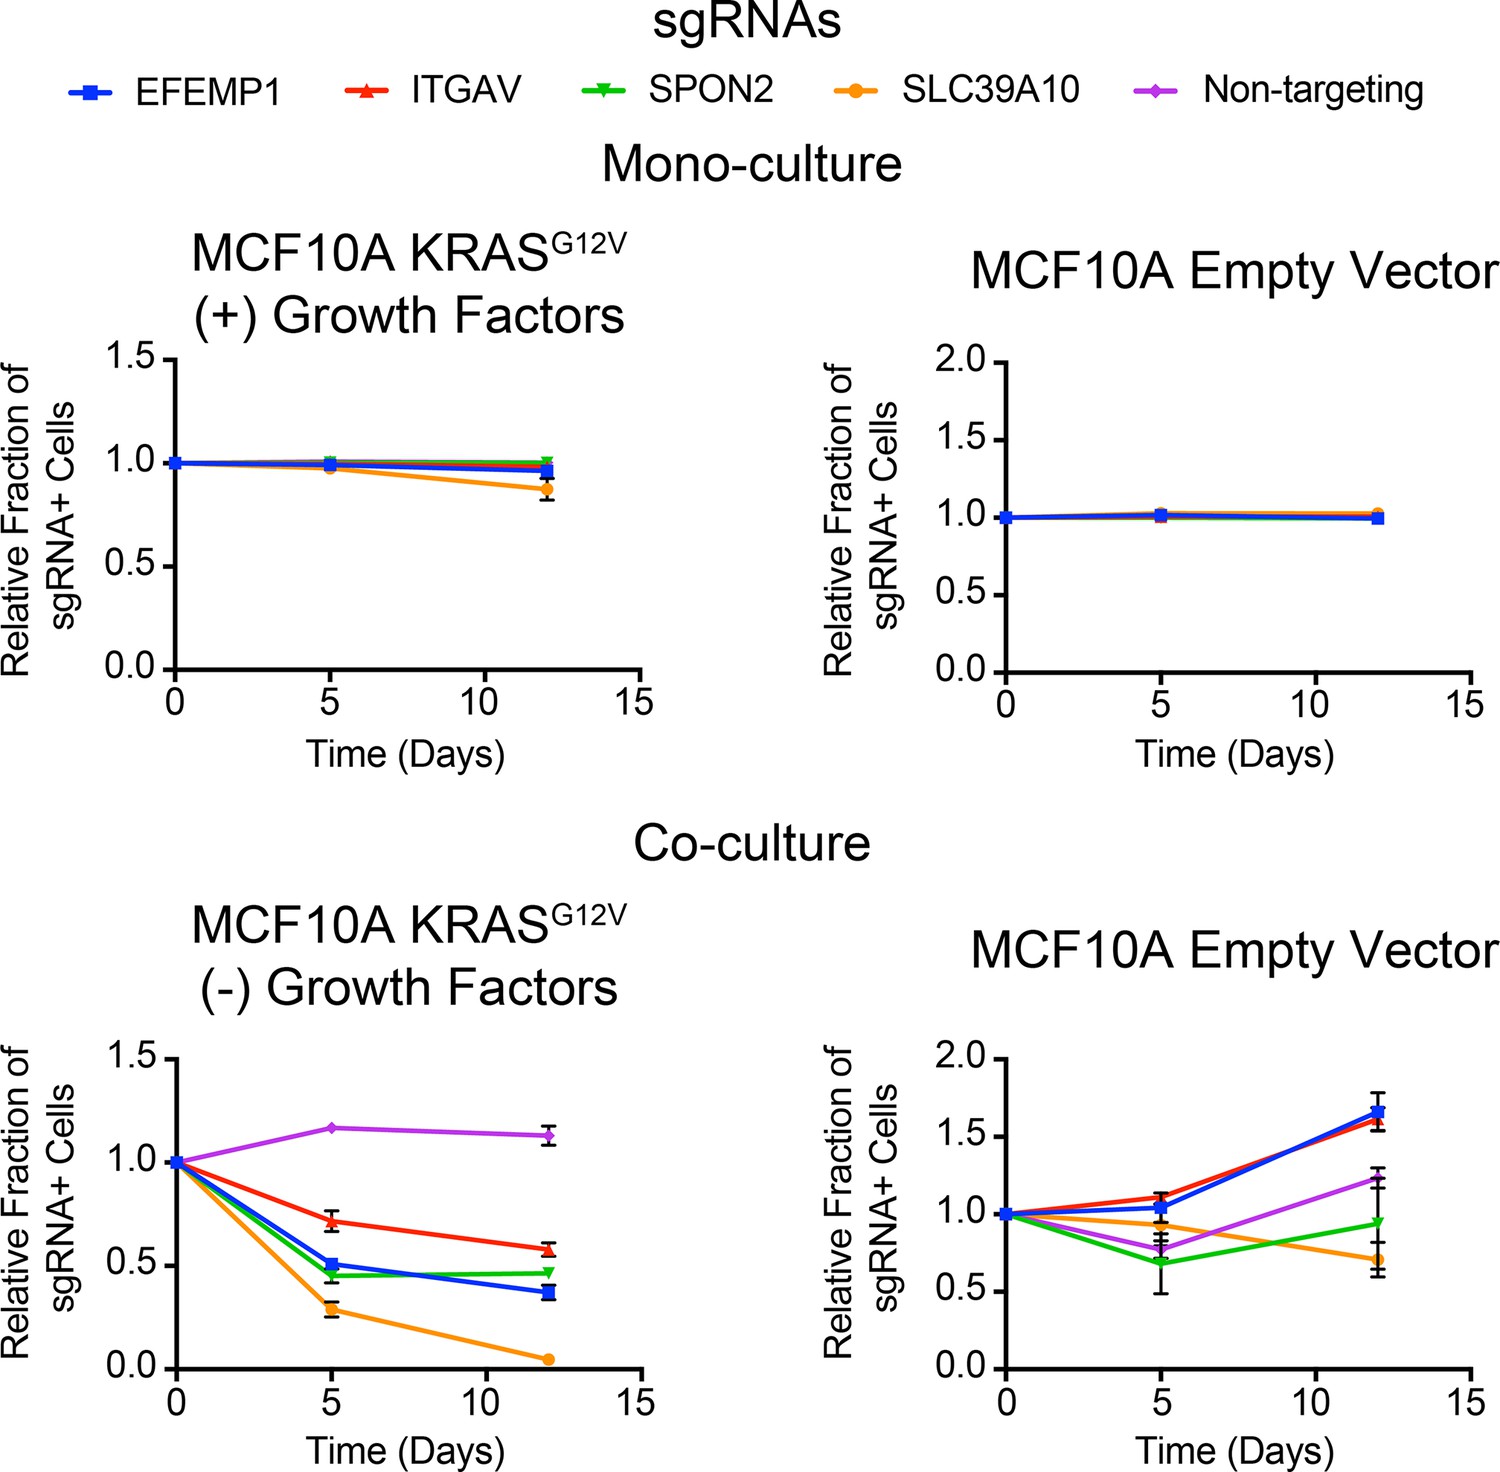
Competitive growth assays performed with KRASG12V (Left) and Empty Vector (Right) MCF10A cells transduced with the indicated sgRNAs.
Cells were grown in monoculture (Top) with growth factors to ensure they maintained sgRNA expression and in co-culture (Bottom) with cells lacking sgRNA expression to determine relative growth rates. (n = 3, error bars represent s.d.).
Figure 5 with 3 supplements
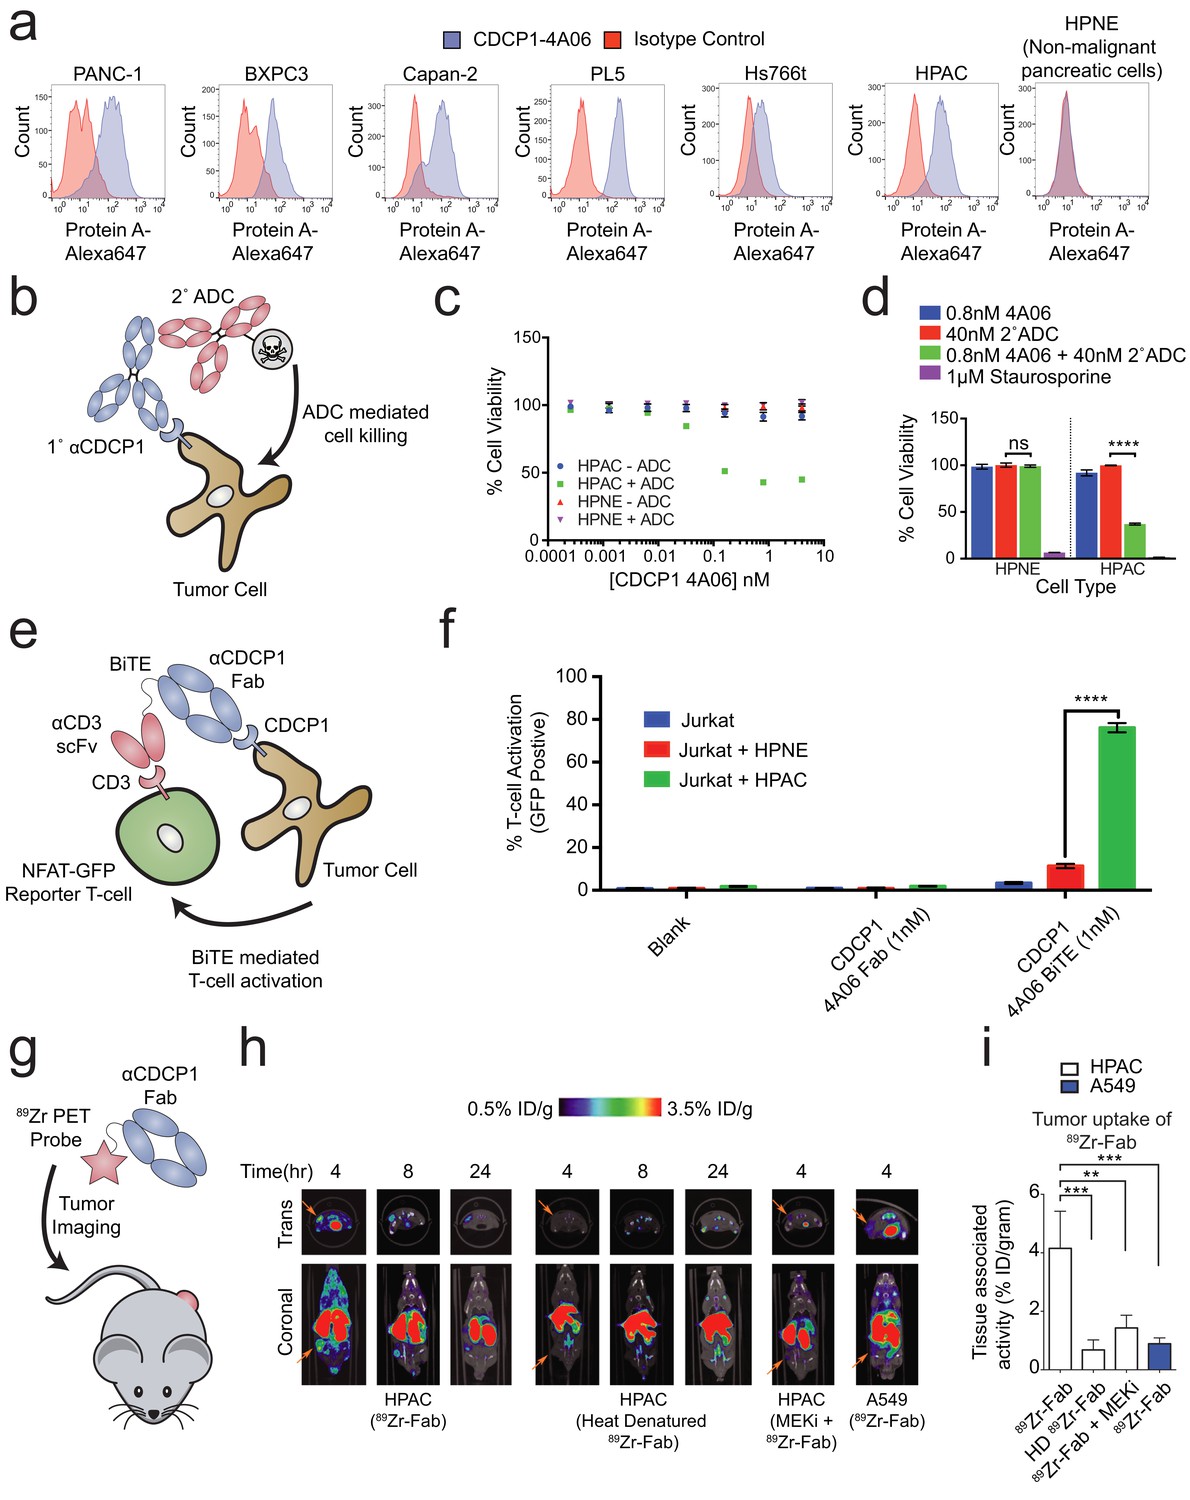
Systematic approaches to demonstrate the utility of the recombinant antibodies to target and detect RAS signaling in pancreatic ductal adenocarcinoma (PDAC).
(a) Profiling of a panel of pancreatic ductal adenocarcinoma cells by flow cytometry demonstrates that CDCP1 is highly expressed on PDAC cells. Remarkably, CDCP1 was expressed at much lower levels on non-tumorogenic cells derived from the same tissue origin. (b) A schematic representation of the antibody drug conjugate cell-killing assay. Cells were treated with a primary IgG that targets CDCP1 and a secondary anti-human IgG conjugated to the cytotoxic drug monomethyl auristatin F (MMAF). Cellular viability was quantified by CellTiter-glo after 72 hr incubation with antibody treatment. (c) Dose- dependent antibody drug conjugate-mediated cell killing was only observed in the HPAC tumorigenic cells and not in the non-tumorogenic HPNE cells (n = 3, error bars represent s.d.). (d) Sub-nanomolar treatment with a CDCP1 IgG was sufficient to selectively kill greater than 50% of HPAC cells, but only when in combination with a stoichiometric excess of the secondary antibody drug conjugate (n = 3, error bars represent s.d.). (e) Schematic of the experimental setup for the flow cytometry-based T-cell activation assay used to profile BiTE activity. Cells were incubated with HPAC or HPNE target cells in the presence or absence of antibody treatment. After overnight incubation, T-cell activation was quantified via the expression of an NFAT-dependent GFP reporter gene. (f) Jurkat cells were significantly activated when treated with 1 nM BiTE in the presence of HPAC target cells as compared to HPNE control cells. Importantly, treatment with the CDCP1 BiTE alone or with Fab lacking the CD3 targeting component resulted in no significant T-cell activation. (g) A schematic representation of the in vivo PET imaging study. 89Zr-labeled CDCP1 Fabs were used for PET imaging of PDAC xenograft bearing mice. (h) Representative microPET images of four immunocompromised nu/nu mice bearing cancer xenografts targeted with a 89Zr-labeled CDCP1 Fab. Images over time show the tumor specific expression of CDCP1, as well as the persistent binding of the Fab to the tumor over 24 hr (Left). Importantly, when the same Fab was heat denatured prior to injection or when a negative control xenograft was used, there was no observable uptake of the 89Zr-Fab (Middle and Right). Remarkably, no uptake was observed in the mouse treated with a sub-toxic dose of MEKi prior to imaging, demonstrating the coupling of CDCP1 expression MAPK pathway signaling in vivo. (i) Quantification of tumor specific bio-distribution of the CDCP1 89Zr-Fab in tumor-bearing nu/nu mice (n = 5 per treatment arm) confirms the trends observed by microPET imaging. Tumor localization of 89Zr-Fab was antigen dependent and ablated by specific inhibition of MAPK signaling.
Figure 5—figure supplement 1
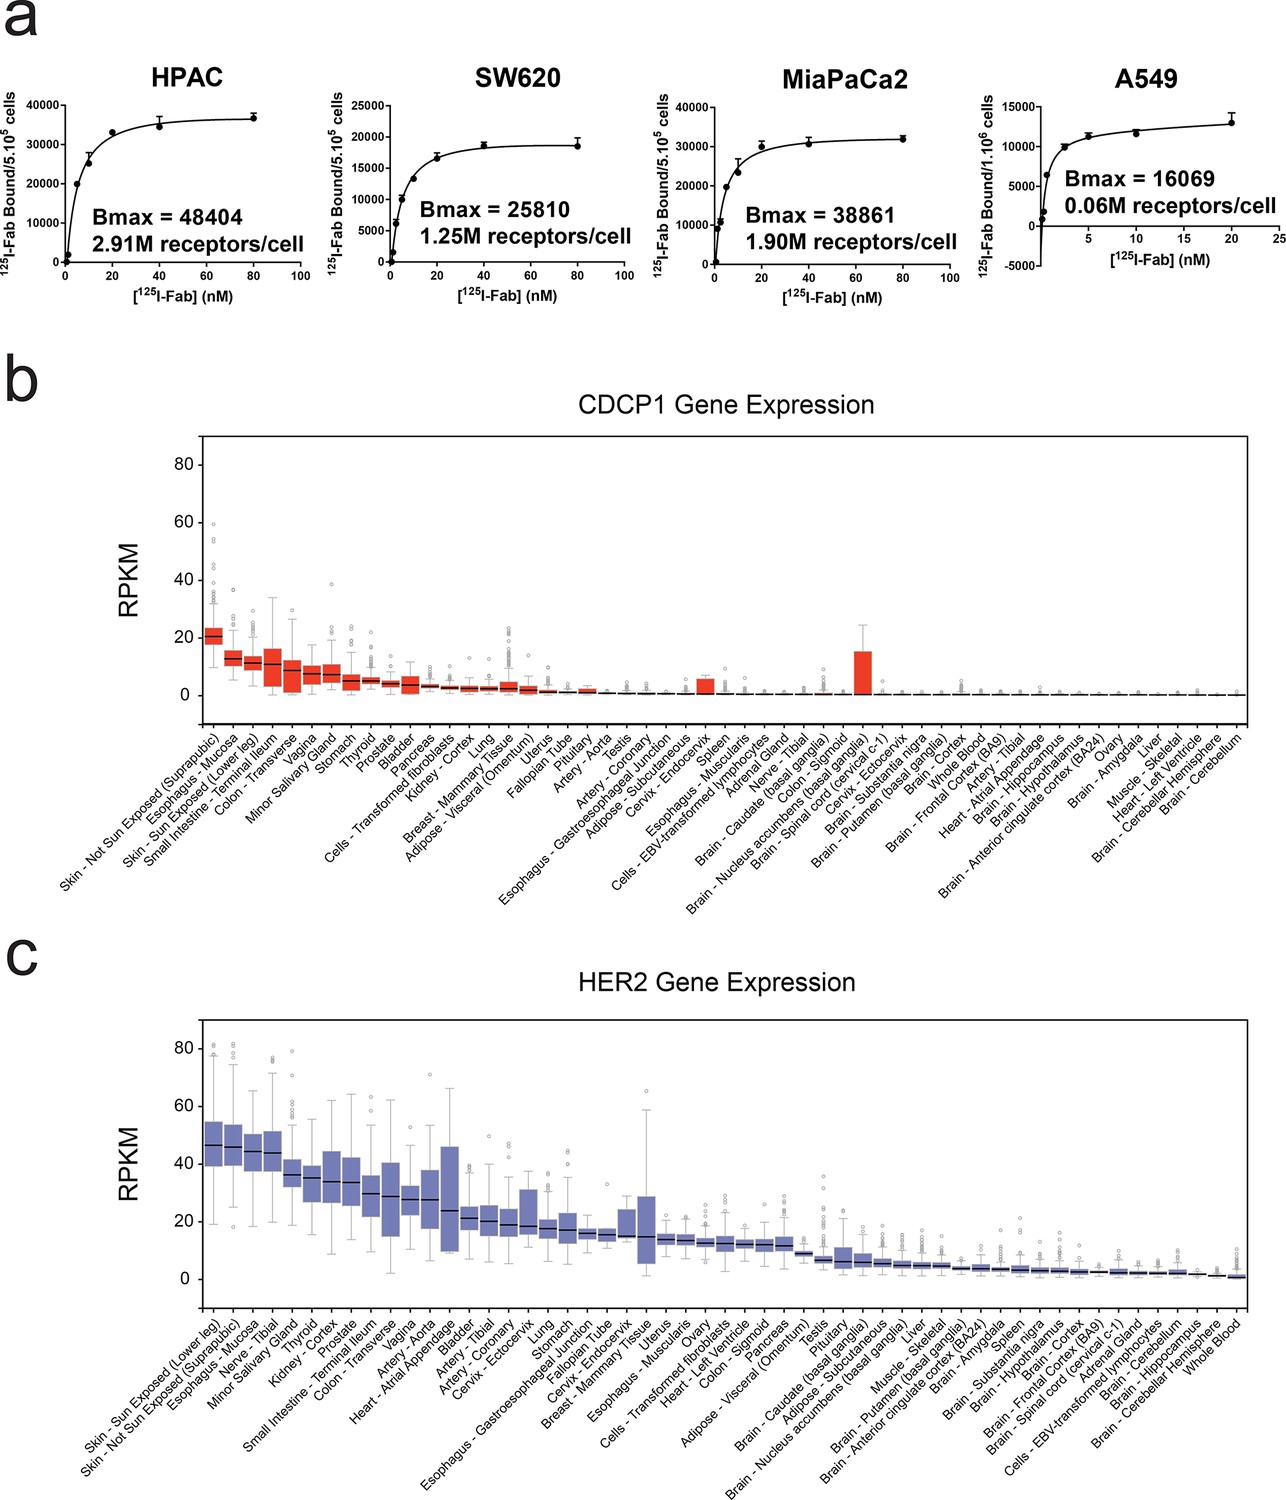
Characterization of CDCP1 expression levels in cancer cell lines and normal human tissues.
(a) Bmax determination for CDCP1 expression on HPAC, SW620, MiaPaCa2, and A549 cells using a titration of 125I labeled CDCP1-4A06 Fab. (b) GTEx database analysis of the tissue specific gene-expression of CDCP1 shows limited expression in normal tissues. (c) GTEx database analysis of the tissue specific gene-expression of HER2, a classically targeted cell-surface protein overexpressed in sub-types of breast cancer.
Figure 5—figure supplement 2
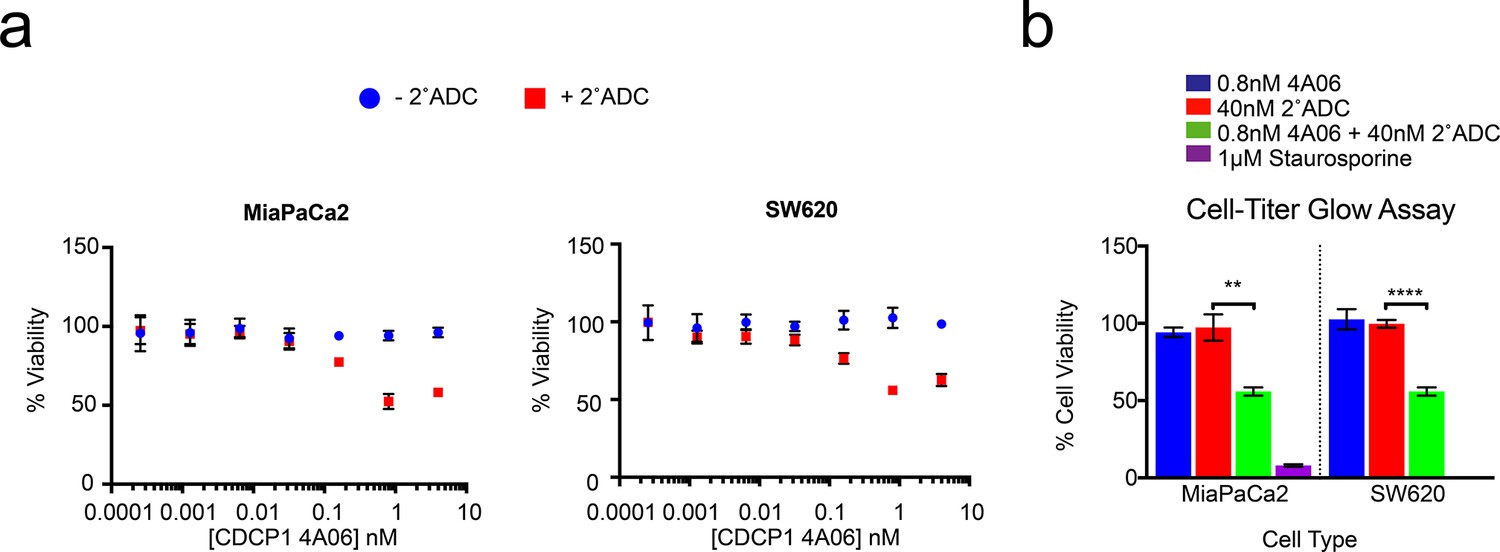
Application of recombinant antibody drug conjugates to target RAS signaling in cancer.
(a) Dose-dependent antibody drug conjugate-mediated cell killing is shown for MiaPaCa2 and SW620 tumorigenic cells (n = 3, error bars represent s.d.). (b) Sub-nanomolar treatment with a CDCP1 IgG was sufficient to selectively kill nearly 50% of MiaPaCa2 and SW620 cells, but only when in combination with a stoichiometric excess of the secondary antibody drug conjugate (n = 3, error bars represent s.d.).
Figure 5—figure supplement 3
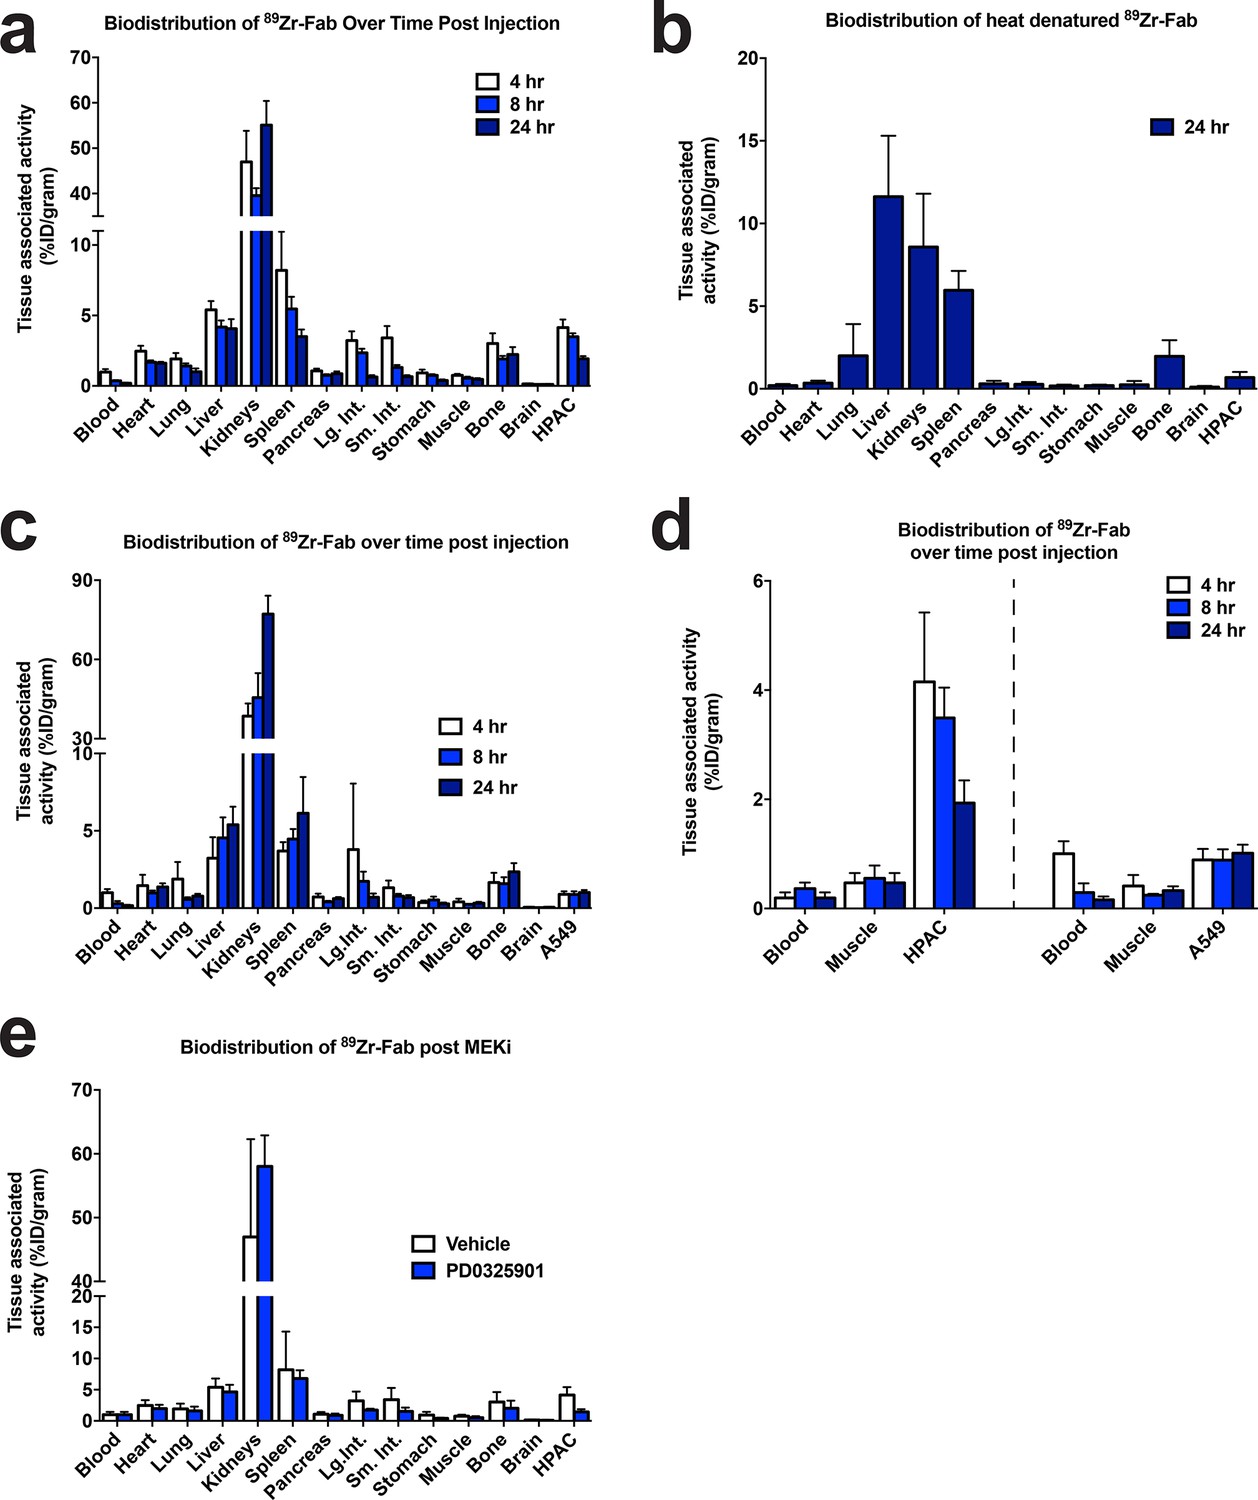
CDCP1 expression is coupled to MAPK signaling in mice.
(a) Quantification of the bio-distribution of the CDCP1 89Zr-Fab in HPAC tumor-bearing nu/nu mice (n = 5 per treatment arm) 4 hr (White), 8 hr (Light Blue), and 24 hr (Dark Blue) post injection. (b) Quantification of the bio-distribution of heat denatured CDCP1 89Zr-Fab in HPAC tumor-bearing nu/nu mice (n = 5 per treatment arm) 24 hr post injection. (c) Quantification of the bio-distribution of the CDCP1 89Zr-Fab in A549 tumor-bearing nu/nu mice (n = 5 per treatment arm) 4 hr (White), 8 hr (Light Blue), and 24 hr (Dark Blue) post injection. (d) Quantification of tumor specific bio-distribution of the CDCP1 89Zr-Fab in HPAC (Left) and A549 (Right) tumor-bearing nu/nu mice (n = 5 per treatment arm) 4 hr (White), 8 hr (Light Blue), and 24 hr (Dark Blue) post injection. Only HPAC xenograft mice showed tumor localization of the 89Zr-Fab, consistent with the difference in CDCP1 expression level between HPAC (~2.9M copies/cell) and A549 (~0.06M copies/cell) cells. (e) Quantification of the bio-distribution of the CDCP1 89Zr-Fab 4 hr post injection in HPAC tumor-bearing nu/nu mice (n = 5 per treatment arm) treated with vehicle (White) or MEKi (Dark Blue).
Additional files
-
Supplementary file 1
SILAC surface proteomics dataset for MCF10A KRASG12V compared to MCF10A Empty Vector.
- https://cdn.elifesciences.org/articles/31098/elife-31098-supp1-v3.xls
-
Supplementary file 2
SILAC surface proteomics dataset for MCF10A KRASG12V cells treated with MEKi or Vehicle.
- https://cdn.elifesciences.org/articles/31098/elife-31098-supp2-v3.xls
-
Supplementary file 3
SILAC surface proteomics dataset for MCF10A KRASG12V cells treated with AKTi or Vehicle.
- https://cdn.elifesciences.org/articles/31098/elife-31098-supp3-v3.xls
-
Supplementary file 4
SILAC surface proteomics dataset for MCF10A KRASG12V cells treated with EGFRi or Vehicle.
- https://cdn.elifesciences.org/articles/31098/elife-31098-supp4-v3.xls
-
Supplementary file 5
RNAseq dataset for MCF10A KRASG12V compared to MCF10A Empty Vector.
- https://cdn.elifesciences.org/articles/31098/elife-31098-supp5-v3.xlsx
-
Supplementary file 6
Sequences of all sgRNAs contained in the surfaceome CRISPRi library.
- https://cdn.elifesciences.org/articles/31098/elife-31098-supp6-v3.xls
-
Supplementary file 7
CRISPRi growth screen datasets for MCF10A KRASG12V (Minus Growth Factors), MCF10A KRASG12V (Plus Growth Factors), and MCF10A Empty Vector (Plus Growth Factors).
- https://cdn.elifesciences.org/articles/31098/elife-31098-supp7-v3.xls
-
Transparent reporting form
- https://cdn.elifesciences.org/articles/31098/elife-31098-transrepform-v3.docx
Download links
A two-part list of links to download the article, or parts of the article, in various formats.
Downloads (link to download the article as PDF)
Open citations (links to open the citations from this article in various online reference manager services)
Cite this article (links to download the citations from this article in formats compatible with various reference manager tools)
Targeting RAS-driven human cancer cells with antibodies to upregulated and essential cell-surface proteins
eLife 7:e31098.
https://doi.org/10.7554/eLife.31098


